Retirement Benefits Schemes FY'2025 Performance Report, & Cytonn Weekly #11.2026
By Research team, Mar 22, 2026
Executive Summary
Fixed Income
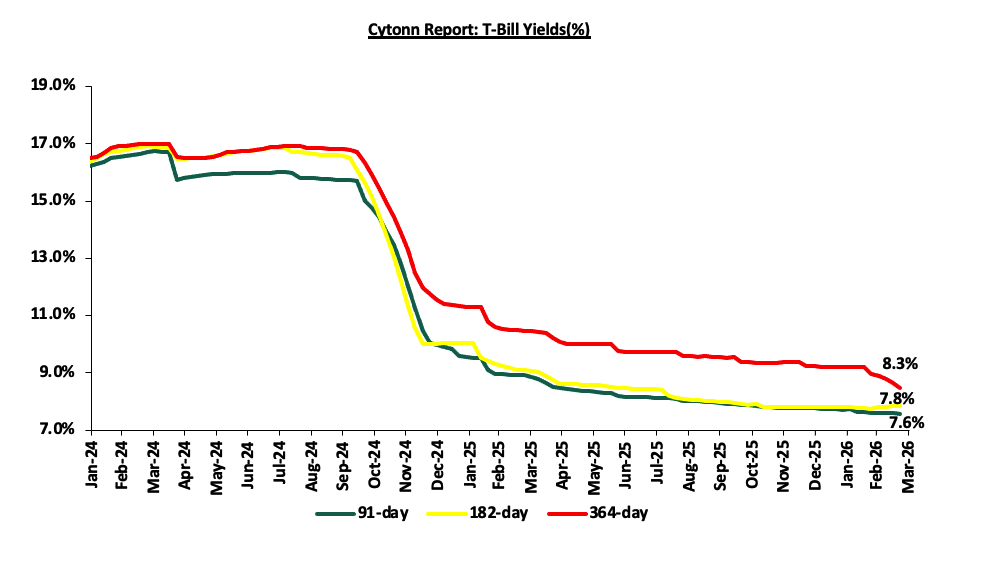
During the week, T-bills were oversubscribed for the eighth consecutive week, with the overall subscription rate coming in at 146.9%, lower than the subscription rate of 182.3% recorded the previous week. Investors’ preference for the shorter 91-day paper persisted, with the paper receiving bids worth Kshs 14.5 bn against the offered Kshs 4.0 bn, translating to a subscription rate of 361.3%, higher than the subscription rate of 124.5%, recorded the previous week. The subscription rate for the 182-day paper increased to 103.0% from 78.9% recorded the previous week, while that of the 364-day paper decreased significantly to 105.1% from 308.7% recorded the previous week. The government accepted a total of Kshs 29.1 bn worth of bids out of Kshs 35.3 bn bids received, translating to an acceptance rate of 82.5%. The yields on the government papers registered a mixed performance with the yields on the 91-day papers increasing by 0.4 bps to remain relatively unchanged at 7.6% in comparison to last week. However, the yields on the 364-day paper decreased by 13.6 bps to 8.3% from 8.5% recorded the previous week, while the yields on the 182-day paper decreased by 0.6 bps to remain relatively unchanged from the 7.8% in comparison to the previous week;
Also, during the week, the Central Bank of Kenya released the auction results for the switch of treasury bonds from FXD1/2021/005, with a tenor to maturity of 0.6 years and a fixed coupon rate of 11.3%, to FXD3/2019/015, a with a tenor to maturity of 8.3 years and a fixed coupon rate of 12.3%. This marks the fourth bond switch, following the switches to IFB1/2022/06, IFB1/2020/06 and FXD1/2022/015 in December 2022, June 2020 and January 2026, respectively. The bond was oversubscribed, with the overall subscription rate coming in at 148.1%, receiving bids worth Kshs 22.2 bn against the offered Kshs 15.0 bn. The government accepted bids worth Kshs 18.4 bn, translating to an acceptance rate of 82.9%. The weighted average yield for the accepted bids for the FXD3/2019/015 came in at 11.6%. Notably, the 11.6% on the switch to FXD3/2019/015 was lower than the 12.2% recorded the last time the bond was reopened in February 2026. With the Inflation rate at 4.3% as of February 2026, the real return of the FXD3/2019/015 was 7.3%. Given the 10.0% withholding tax on the bonds, the tax equivalent yields for shorter term bonds with 15.0% withholding tax is 12.3% for the FXD3/2019/015;
On 17th March 2026 The National Treasury officially released the Draft Virtual Asset Service Providers (VASP) Regulations, 2026, which outline how stablecoins will be issued and managed in Kenya through a framework built on licensing, disclosure, and reserve requirements. Three key takeaways are that stablecoin issuers must obtain approval and meet relatively high entry thresholds, including minimum capital requirements of about Kshs 500 million; stablecoins must be issued and redeemed at par and backed by reserve assets, although gaps remain around liquidity standards and insolvency protection; and issuers are prohibited from paying interest, which limits stablecoins to a payments role but may reduce their attractiveness compared to alternative products. For more please see our Stablecoin-Focused Note on the Draft Virtual Asset Service Providers Regulations, 2026;
Equities
The equities market was on a downward trajectory, with NSE 10, NASI, NSE 20, and NSE 25 declining by 1.0%, 0.9%, 0.8% and 0.6% respectively, taking the YTD performance to gains of 16.6%, 14.2%, 12.8% and 11.8% for NSE 20, NSE 25, NSE 10 and NASI respectively. The equities market performance was mainly driven by losses recorded by large cap stocks such as KCB, BAT and EABL of 4.1%, 2.1% and 1.7% respectively. However, the performance was supported by gains recorded by large cap stocks such as NCBA and ABSA of 3.7% and 2.4% respectively;
Also, during the week, the banking sector index declined by 0.4% to 241.3 from 242.2 recorded the previous week. This is attributable to losses recorded by stocks such as KCB, Standard Chartered and DTBK of 4.1%, 1.5% and 1.0% respectively. However, the performance was supported by gains recorded by stocks such as NCBA and ABSA of 3.7% and 2.4% respectively;
During the week, Equity Group released its FY’2025 financial results, Equity Group’s Profit After Tax (PAT) increased by 54.7% to Kshs 75.5 bn, from Kshs 48.8 bn in FY’2024. The performance was mainly driven by a 12.4% increase in Total Operating Income to Kshs 217.7 bn, from Kshs 193.8 bn in FY’2024, coupled with the 5.6% decrease in Total Operating expense to Kshs 125.6 bn in FY’2025, from Kshs 133.0 bn in FY’2024. The decrease in Operating expenses was largely driven by the 28.2% decrease in loan loss provisions expense to Kshs 14.5 bn from Kshs 20.2 bn in FY’2024. Notably, staff costs increased by 18.9% to Kshs 39.6 bn, from 33.3 bn in FY’2024. The 12.4% increase in Total Operating Income was driven by a 16.8% increase in Net Interest income to Kshs 126.9 bn in FY’2025, from Kshs 108.7 bn in FY’2024, coupled with a 6.7% increase in Non-Interest Income to Kshs 90.8 bn in FY’2025, from Kshs 85.1 bn in FY’2024;
During the week, Standard Chartered Bank Ltd released its FY’2025 financial results, Standard Chartered Bank Kenya’s Profit After Tax (PAT) decreased by 38.0% to Kshs 12.4 bn in FY’2025, from Kshs 20.1 bn in FY’2024. The performance was mainly driven by a 16.5% decrease in Total Operating Income to Kshs 42.3 bn in FY’2025, from Kshs 50.7 bn in FY’2024, coupled with a 13.3% increase in Total Operating expense to Kshs 25.5 bn in FY’2025, from Kshs 22.5 bn in FY’2024. The increase in Operating expenses was largely driven by the 23.7% increase in staff costs to Kshs 11.2 bn in FY’2025, from Kshs 9.1 bn in FY’2024 mainly attributable to the pension settlement paid to 629 former employees for underpaid retirement benefits, following the Supreme Court ruling in September 2025 that required the bank to pay approximately Kshs 7.0 bn. The 16.5% decline in Total Operating Income was driven by a 23.0% decrease in Non-Interest Income to Kshs 13.4 bn in FY’2025, from Kshs 17.4 bn in FY’2024, and a 13.1% decrease in Net-Interest income to Kshs 28.9 bn in FY’2025, from Kshs 33.3 bn in FY’2024;
During the week, Co-operative Group released its FY’2025 financial results, Cooperative Bank Kenya’s Profit After Tax (PAT) increased by 16.9% to Kshs 29.8 bn, from Kshs 25.5 bn in FY’2024. The performance was mainly driven by a 13.9% increase in total operating income to Kshs 91.9 bn, from Kshs 80.6 bn in FY’2024, but however weighed down by a 11.4% increase in operating expenses to Kshs 52.0 bn, from Kshs 46.7 bn in FY’2024. The increase in Operating expenses was largely driven by the 13.6% increase in Staff Costs to Kshs 20.8 bn, from Kshs 18.3 bn in FY’2024. The 13.9% increase in Total Operating Income was driven by a 22.0% increase in Net-Interest Income to Kshs 62.9 bn in FY’2025, from Kshs 51.5 bn in FY’2024, it was however weighed down by an 0.3% decrease in Non-Interest income to Kshs 29.0 bn in FY’2025, from Kshs 29.1 bn in FY’2024;
Real Estate
During the week, the Kenya National Bureau of Statistics (KNBS) released the Leading Economic Indicators (LEI) January 2026 Report, which highlighted the performance of major economic indicators;
During the week, President William Ruto presided over the launch of an affordable housing project in Kimilili, Bungoma County, as part of his broader Western Kenya development tour, reinforcing the government’s ongoing efforts to scale up the Affordable Housing Programme across the country. The initiative reflects a continued shift towards expanding housing delivery into emerging urban centres, with the Kimilili project forming part of a growing pipeline of developments aimed at increasing access to decent and affordable housing while supporting local economic activity;
On the Unquoted Securities Platform, Acorn D-REIT and I-REIT traded at Kshs 27.4 and Kshs 23.2 per unit, respectively, as per the last updated data on 13th March 2026. Additionally, ILAM Fahari I-REIT traded at Kshs 11.0 per share as of 20th February 2026 representing a 45.0% loss from the Kshs 20.0 inception price;
Focus of the Week
According to the Retirement Benefits Authority Industry Brief for December 2025, the Assets Under Management (AUM) increased by 24.6% to Kshs 2.8 tn from Kshs 2.3 tn. The performance was attributable to higher contributions from the NSSF Act, 2013’s raised limits and strong investment performance supported by a stable macroeconomic environment. Notably, according to the ACTSERV Q4’2025 Retirement Benefits Schemes Investments Performance Survey, segregated retirement benefits schemes recorded a 2.6% return in Q4’2025, from the 13.2% return recorded in Q4’2024. The performance was largely driven by weaker equity performance, with the average return coming in at 8.0% compared to 15.7% return recorded in Q4’2024. The return reflects the performance of the market as the Nairobi All Share Index (NASI) had gained by 4.7% and 48.9% in Q4’2025 and FY’2025 respectively.
Investment Updates:
-
Weekly Rates: Cytonn Money Market Fund closed the week at a yield of 11.5% p.a. To invest, dial *809# or download the Cytonn App from Google Play store here or from the Appstore here;
-
We continue to offer Wealth Management Training every Tuesday, from 7:00 pm to 8:00 pm. The training aims to grow financial literacy among the general public. To register for any of our Wealth Management Trainings, click here;
-
If interested in our Private Wealth Management Training for your employees or investment group, please get in touch with us through wmt@cytonn.com;
-
Cytonn Insurance Agency acts as an intermediary for those looking to secure their assets and loved ones’ future through insurance namely; Motor, Medical, Life, Property, WIBA, Credit and Fire and Burglary insurance covers. For assistance, get in touch with us through insuranceagency@cytonn.com;
-
Cytonn Asset Managers Limited (CAML) continues to offer pension products to meet the needs of both individual clients who want to save for their retirement during their working years and Institutional clients that want to contribute on behalf of their employees to help them build their retirement pot. To more about our pension schemes, kindly get in touch with us through pensions@cytonn.com;
Hospitality Updates:
-
We currently have promotions for Staycations. Visit cysuites.com/offers for details or email us at sales@cysuites.com;
Money Markets, T-Bills Primary Auction:
This week, T-bills were oversubscribed for the eighth consecutive week, with the overall subscription rate coming in at 146.9%, lower than the subscription rate of 182.3% recorded the previous week. Investors’ preference for the shorter 91-day paper persisted, with the paper receiving bids worth Kshs 14.5 bn against the offered Kshs 4.0 bn, translating to a subscription rate of 361.3%, higher than the subscription rate of 124.5%, recorded the previous week. The subscription rate for the 182-day paper increased to 103.0% from 78.9% recorded the previous week, while that of the 364-day paper decreased significantly to 105.1% from 308.7% recorded the previous week. The government accepted a total of Kshs 29.1 bn worth of bids out of Kshs 35.3 bn bids received, translating to an acceptance rate of 82.5%. The yields on the government papers registered a mixed performance with the yields on the 91-day papers increasing by 0.4 bps to remain relatively unchanged at 7.6% in comparison to last week. However, the yields on the 364-day paper decreased by 13.6 bps to 8.3% from 8.5% recorded the previous week, while the yields on the 182-day paper decreased by 0.6 bps to remain relatively unchanged from the 7.8% in comparison to the previous week.
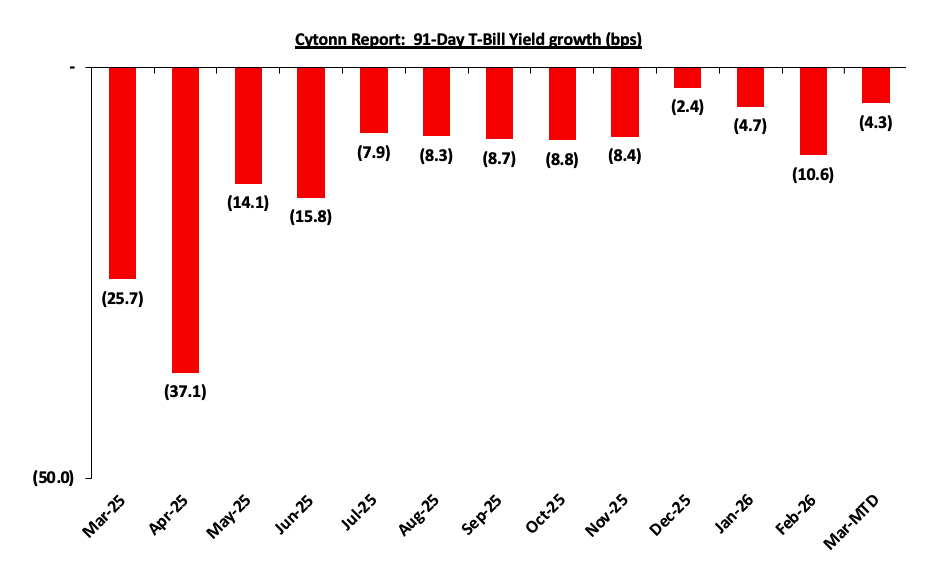
The chart below shows the yield growth rate for the 91-day paper from January 2024 to date:
The charts below show the performance of the 91-day, 182-day and 364-day papers from March 2025 to March 2026
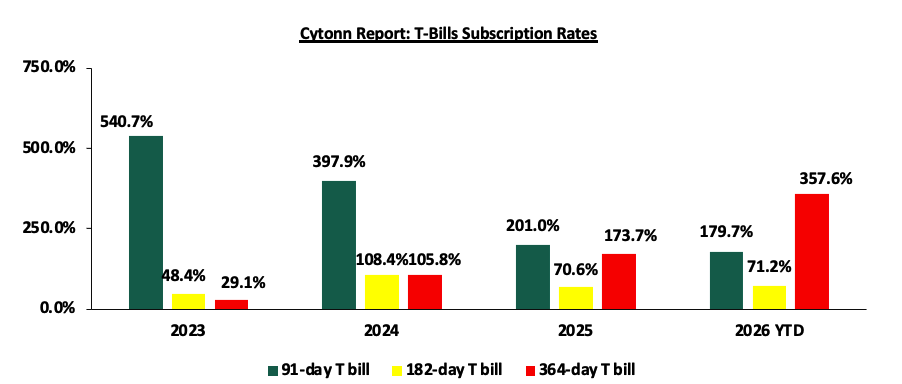
The chart below compares the overall average T-bill subscription rates obtained in 2023, 2024, 2025 and 2026 Year-to-date (YTD:
Money Market Performance:
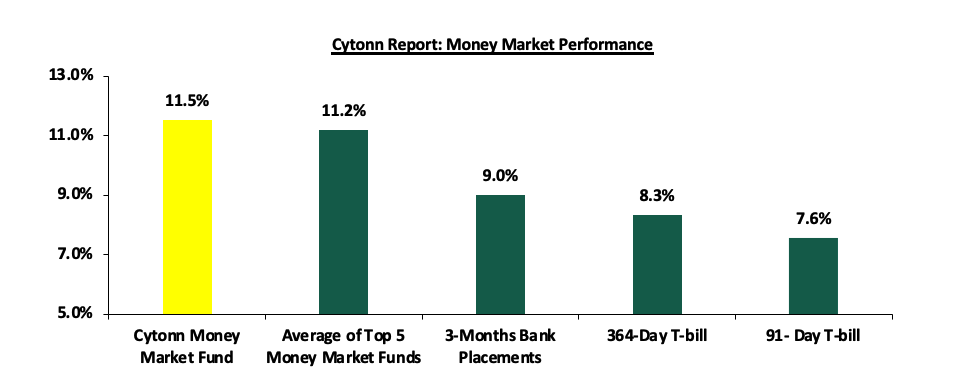
In the money markets, 3-month bank placements ended the week at 9.0% (based on rates offered by various banks). The yields on the 364-day paper decreased by 13.6 bps to 8.3% from 8.5% recorded the previous week, while the yields on the 91-day paper increased by 0.4 bps to remain relatively unchanged at 7.6% in comparison to last week. The yield on the Cytonn Money Market Fund increased by 13.0 bps to 11.5% from 11.4% recorded the previous week, while the average yields on the Top 5 Money Market Funds increased by 2.6 bps to remain relatively unchanged at 11.2% recorded the previous week.
The table below shows the Money Market Fund Yields for Kenyan Fund Managers as published on 20th March 2026:
|
Money Market Fund Yield for Fund Managers as published on 20th March 2026 |
||
|
Rank |
Fund Manager |
Effective Annual Rate |
|
1 |
Cytonn Money Market Fund (Dial *809# or download Cytonn App) |
11.5% |
|
2 |
Nabo Africa Money Market Fund |
11.5% |
|
3 |
Gulfcap Money Market Fund |
11.4% |
|
4 |
Arvocap Money Market Fund |
10.8% |
|
5 |
Enwealth Money Market Fund |
10.8% |
|
6 |
Lofty-Corban Money Market Fund |
10.7% |
|
7 |
Ndovu Money Market Fund |
10.5% |
|
8 |
Kuza Money Market fund |
10.4% |
|
9 |
Jubilee Money Market Fund |
10.3% |
|
10 |
Madison Money Market Fund |
10.1% |
|
11 |
Old Mutual Money Market Fund |
10.1% |
|
12 |
Faulu Money Market Fund |
10.1% |
|
13 |
Etica Money Market Fund |
10.0% |
|
14 |
Orient Kasha Money Market Fund |
9.9% |
|
15 |
British-American Money Market Fund |
9.8% |
|
16 |
Dry Associates Money Market Fund |
9.5% |
|
17 |
SanlamAllianz Money Market Fund |
9.34% |
|
18 |
GenAfrica Money Market Fund |
9.3% |
|
19 |
KCB Money Market Fund |
9.0% |
|
20 |
Genghis Money Market Fund |
9.0% |
|
21 |
Apollo Money Market Fund |
8.5% |
|
22 |
CIC Money Market Fund |
8.5% |
|
23 |
CPF Money Market Fund |
8.4% |
|
24 |
ICEA Lion Money Market Fund |
8.4% |
|
25 |
Co-op Money Market Fund |
8.3% |
|
26 |
Mali Money Market Fund |
8.1% |
|
27 |
Absa Shilling Money Market Fund |
7.3% |
|
28 |
Mayfair Money Market Fund |
6.7% |
|
29 |
Ziidi Money Market Fund |
6.1% |
|
30 |
AA Kenya Shillings Fund |
5.9% |
|
31 |
Stanbic Money Market Fund |
5.6% |
|
32 |
Equity Money Market Fund |
4.8% |
Source: Business Daily
Liquidity:
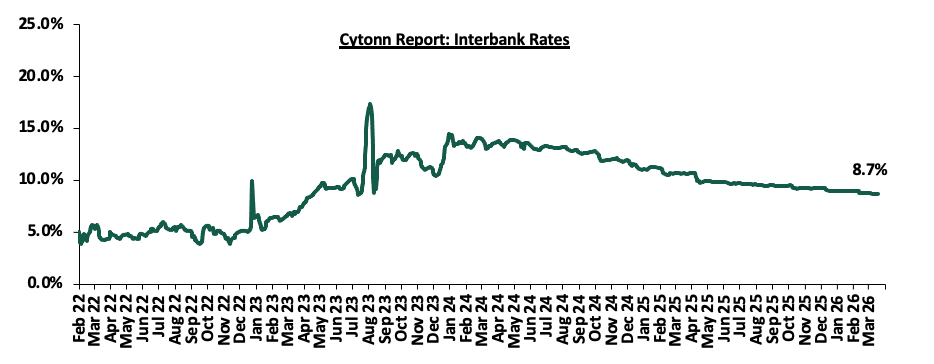
During the week, liquidity in the money markets tightened with the average interbank rate increasing by 0.8 bps to remain relatively unchanged at 8.7% in comparison to last week, partly attributable to tax remittances that offset government payments. The average interbank volumes traded decreased by 2.1% to Kshs 12.0 bn from Kshs 12.2 bn recorded the previous week. The chart below shows the interbank rates in the market over the years
Kenya Eurobonds:
During the week, the yields on the Eurobonds were on an upward trajectory with the yield on the 7-year Eurobond issued in 2024, increasing the most by 50.0 bps to 8.0% from 7.5% recorded the previous week. The table below shows the summary performance of the Kenyan Eurobonds as of 12th March 2026;
|
Cytonn Report: Kenya Eurobonds Performance |
||||||
|
|
2018 |
2019 |
2021 |
2024 |
||
|
Tenor |
10-year issue |
30-year issue |
12-year issue |
13-year issue |
7-year issue |
|
|
Amount Issued (USD) |
1.0 bn |
1.0 bn |
1.0 bn |
1.5 bn |
1.5 bn |
|
|
Years to Maturity |
2.5 |
22.5 |
8.8 |
5.5 |
10.5 |
|
|
Yields at Issue |
7.3% |
8.3% |
6.2% |
10.4% |
9.9% |
|
|
2-Jan-26 |
6.1% |
8.8% |
7.2% |
7.8% |
7.1% |
|
|
2-Mar-26 |
6.1% |
9.1% |
7.2% |
8.3% |
7.1% |
|
|
12-Mar-26 |
6.6% |
9.6% |
8.0% |
8.9% |
8.0% |
|
|
13-Mar-26 |
6.7% |
9.7% |
8.0% |
9.0% |
8.1% |
|
|
16-Mar-26 |
6.8% |
9.7% |
8.1% |
9.0% |
8.1% |
|
|
17-Mar-26 |
6.7% |
9.5% |
8.0% |
8.9% |
8.0% |
|
|
18-Mar-26 |
6.7% |
9.5% |
8.2% |
9.0% |
8.2% |
|
|
19-Mar-26 |
6.7% |
9.5% |
8.2% |
9.0% |
8.2% |
|
|
Weekly Change |
0.1% |
(0.0%) |
0.2% |
0.1% |
0.2% |
|
|
MTD Change |
0.6% |
0.5% |
0.9% |
0.7% |
1.1% |
|
|
YTD Change |
0.6% |
0.7% |
1.0% |
1.2% |
1.1% |
|
Source: Central Bank of Kenya (CBK) and National Treasury
Kenya Shilling:
During the week, the Kenya Shilling depreciated by 17.0 bps against the US Dollar, to Kshs 129.5 from the Kshs 129.3 recorded the previous week. On a year-to-date basis, the shilling has depreciated by 36.4 bps against the dollar, as compared to the 22.9 bps appreciation recorded in 2025.
We expect the shilling to be supported by:
-
Diaspora remittances standing at a cumulative USD 5,051.2 mn in the twelve months to February 2026, 1.9% higher than the USD 4,956.5 mn recorded over the same period in 2025. These have continued to cushion the shilling against further depreciation. In the February 2026 diaspora remittances figures, North America remained the largest source of remittances to Kenya accounting for 54.2% in the period, and,
-
Tourism inflows, which strengthened significantly. Tourism receipts reached Kshs 560.0 bn in 2025, up from Kshs 452.2 bn in 2024, representing a 23.9% increase, supported by improved international arrivals through the country’s major airports, and,
-
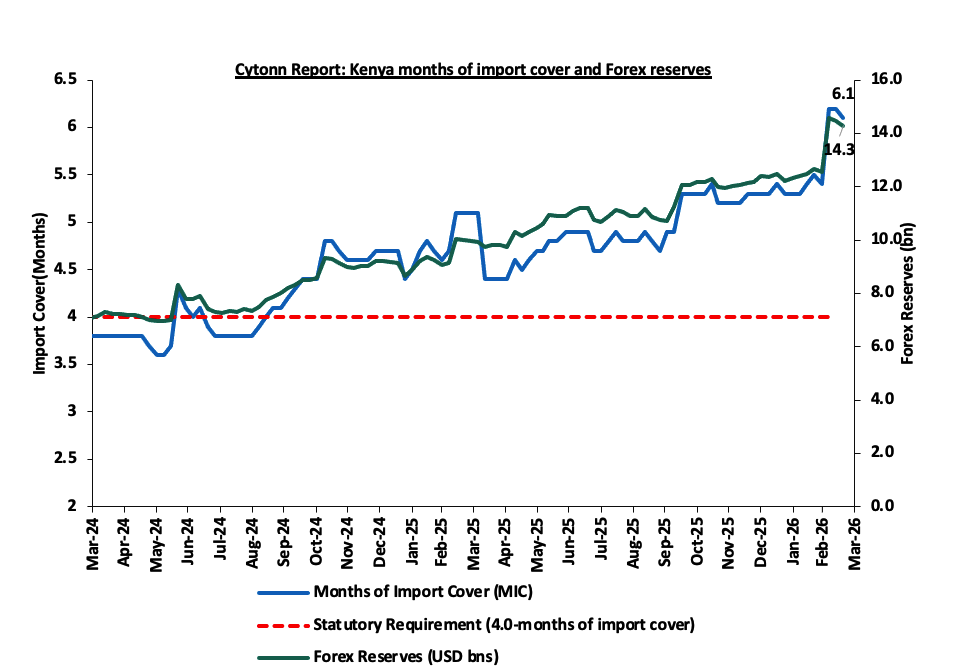
Improved forex reserves currently at USD 14.3 bn (equivalent to 6.1-months of import cover), which is above the statutory requirement of maintaining at least 4.0-months of import cover and above the EAC region’s convergence criteria of 4.5-months of import cover.
The shilling is however expected to remain under pressure in 2026 as a result of:
-
An ever-present current account deficit which came at 2.2% of GDP in the twelve months to October 2025, and,
-
The need for government debt servicing, continues to put pressure on forex reserves given that 52.0% of Kenya’s external debt is US Dollar-denominated as of September 2025.
Kenya’s forex reserves decreased by 1.2% during the week to USD 14.3 bn from the USD 14.5 bn recorded the previous week, equivalent to 6.1 months of import cover, and above the statutory requirement of maintaining at least 4.0-months of import cover.
The chart below summarizes the evolution of Kenya's months of import cover over the years:
Rates in the Fixed Income market have been on a downward trend due to high liquidity in the money market which allowed the government to front load most of its borrowing. The government is 123.1% ahead of its prorated net domestic borrowing target of Kshs 634.8 bn, having a net borrowing position of Kshs 1,031.0 bn (inclusive of T-bills). However, we expect stabilization of the yield curve in the short and medium term, with the government looking to increase its external borrowing to maintain the fiscal surplus, hence alleviating pressure in the domestic market. As such, we expect the yield curve to stabilize in the short to medium-term and hence investors are expected to shift towards the long-term papers to lock in the high returns
Market Performance:
The equities market was on a downward trajectory, with NSE 10, NASI, NSE 20, and NSE 25 declining by 1.0%, 0.9%, 0.8% and 0.6% respectively, taking the YTD performance to gains of 16.6%, 14.2%, 12.8% and 11.8% for NSE 20, NSE 25, NSE 10 and NASI respectively. The equities market performance was mainly driven by losses recorded by large cap stocks such as KCB, BAT and EABL of 4.1%, 2.1% and 1.7% respectively. However, the performance was supported by gains recorded by large cap stocks such as NCBA and ABSA of 3.7% and 2.4% respectively.
Also, during the week, the banking sector index declined by 0.4% to 241.3 from 242.2 recorded the previous week. This is attributable to losses recorded by stocks such as KCB, Standard Chartered and DTBK of 4.1%, 1.5% and 1.0% respectively. However, the performance was supported by gains recorded by stocks such as NCBA and ABSA of 3.7% and 2.4% respectively.
During the week, equities turnover decreased by 67.2% to USD 15.9 mn from USD 48.3 mn recorded the previous week, taking the YTD total turnover to USD 396.2 mn. Foreign investors remained net sellers for the seventh consecutive week with a net selling position of USD 2.7 mn, from a net selling position of USD 20.1 mn recorded the previous week, taking the YTD foreign net selling position to USD 62.1 mn, compared to a net selling position of USD 92.9 mn recorded in 2025.
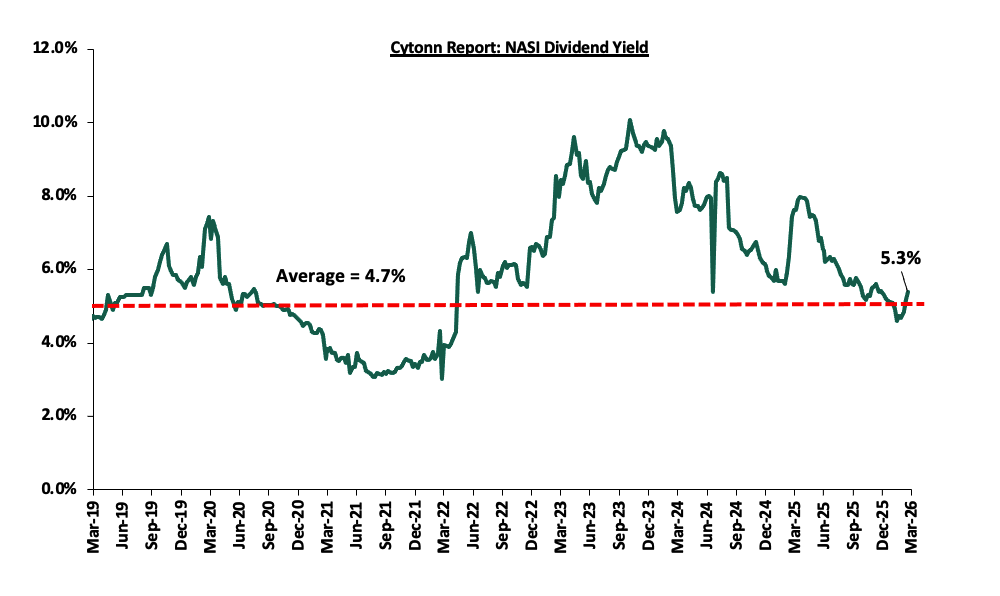
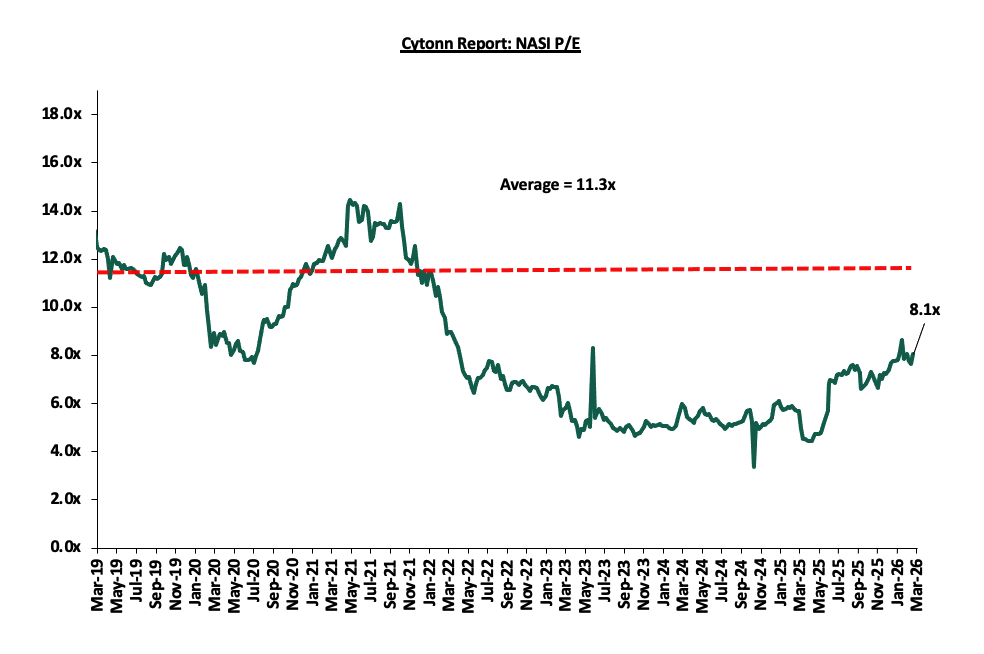
The market is currently trading at a price to earnings ratio (P/E) of 8.1x, 28.7% below the historical average of 11.3x. The dividend yield stands at 5.3%, 0.6% points above the historical average of 4.7%. Key to note, NASI’s PEG ratio currently stands at 1.0x, suggesting that the market is fairly valued relative to its expected earnings growth. A PEG ratio greater than 1.0x indicates the market may be overvalued while a PEG ratio less than 1.0x indicates that the market is undervalued.
The charts below indicate the historical P/E and dividend yields of the market.
Universe of Coverage:
|
Cytonn Report: Equities Universe of Coverage |
||||||||||
|
Company |
Price as at 13/03/2026 |
Price as at 19/03/2026 |
w/w change |
YTD Change |
Year Open 2026 |
Target Price* |
Dividend Yield |
Upside/ Downside** |
P/TBv Multiple |
Recommendation |
|
KCB Group* |
79.3 |
76.0 |
(4.1%) |
15.6% |
23.9 |
86.9 |
9.2% |
23.6% |
0.9x |
Buy |
|
Co-op Bank* |
30.0 |
30.0 |
0.0% |
25.3% |
65.8 |
33.4 |
8.3% |
19.9% |
1.3x |
Accumulate |
|
I&M Group |
50.8 |
51.3 |
1.0% |
19.7% |
42.8 |
57.4 |
5.9% |
17.8% |
0.9x |
Accumulate |
|
NCBA |
88.0 |
91.3 |
3.7% |
7.4% |
85.0 |
101.3 |
6.0% |
17.0% |
1.5x |
Accumulate |
|
Equity Group* |
77.0 |
76.5 |
(0.6%) |
14.2% |
197.8 |
81.8 |
7.5% |
14.4% |
1.3x |
Accumulate |
|
Stanbic Holdings* |
260.8 |
260.0 |
(0.3%) |
31.5% |
114.8 |
275.8 |
8.0% |
14.1% |
1.6x |
Accumulate |
|
Diamond Trust Bank |
157.0 |
155.5 |
(1.0%) |
35.5% |
4.5 |
170.0 |
4.5% |
13.8% |
0.5x |
Accumulate |
|
CIC Group |
5.0 |
5.0 |
(1.0%) |
9.5% |
67.0 |
5.5 |
2.6% |
13.3% |
1.4x |
Accumulate |
|
ABSA Bank* |
31.1 |
31.8 |
2.4% |
28.0% |
299.8 |
33.0 |
6.4% |
10.2% |
2.1x |
Accumulate |
|
Britam |
13.1 |
12.5 |
(4.2%) |
38.0% |
24.9 |
13.5 |
0.0% |
8.0% |
1.2x |
Hold |
|
Standard Chartered Bank* |
335.0 |
330.0 |
(1.5%) |
10.1% |
9.1 |
324.3 |
9.4% |
7.7% |
1.9x |
Hold |
|
Jubilee Holdings |
393.8 |
398.0 |
1.1% |
23.4% |
322.5 |
407.5 |
3.4% |
5.8% |
0.6x |
Hold |
|
*Target Price as per Cytonn Analyst estimates **Upside/ (Downside) is adjusted for Dividend Yield *Dividend Yield is calculated using FY’2025 Dividends Dividend Yield is calculated using FY’2024 Dividends |
||||||||||
Weekly Highlights
-
Earnings Releases
-
Equity Bank FY’2025 Performance
During the week, Equity Group Ltd released their FY’2025 financial results. Below is a summary of the performance:
|
Balance Sheet Items |
FY'2024 |
FY'2025 |
y/y change |
|
Government Securities |
300.9 |
335.3 |
11.4% |
|
Net Loans and Advances |
819.2 |
882.5 |
7.7% |
|
Total Assets |
1,804.6 |
1,971.0 |
9.2% |
|
Customer Deposits |
1,399.6 |
1,455.1 |
4.0% |
|
Deposits per branch |
3.5 |
3.6 |
1.4% |
|
Total Liabilities |
1,557.8 |
1,644.9 |
5.6% |
|
Shareholders’ Funds |
234.0 |
309.5 |
32.2% |
|
Balance Sheet Ratios |
FY'2024 |
FY'2025 |
% y/y change |
|
Loan to Deposit Ratio |
58.5% |
60.6% |
2.1% |
|
Government Securities to Deposits |
36.7% |
38.0% |
1.3% |
|
Return on average equity |
22.1% |
27.8% |
5.7% |
|
Return on average assets |
2.7% |
4.0% |
1.3% |
|
Income Statement |
FY'2024 |
FY'2025 |
y/y change |
|
Net Interest Income |
108.7 |
126.9 |
16.8% |
|
Net non-Interest Income |
85.1 |
90.8 |
6.7% |
|
Total Operating income |
193.8 |
217.7 |
12.4% |
|
Loan Loss provision |
(20.2) |
(14.5) |
(28.2%) |
|
Total Operating expenses |
(133.0) |
(125.6) |
(5.6%) |
|
Profit before tax |
60.7 |
92.1 |
51.7% |
|
Profit after tax |
48.8 |
75.5 |
54.7% |
|
Core EPS |
12.3 |
19.1 |
54.5% |
|
Income Statement Ratios |
Fy'2024 |
FY'2025 |
y/y change |
|
Yield from interest-earning assets |
10.9% |
10.6% |
(0.2%) |
|
Cost of funding |
4.2% |
3.1% |
(1.1%) |
|
Cost of risk |
10.4% |
6.7% |
(3.8%) |
|
Net Interest Margin |
7.0% |
7.8% |
0.8% |
|
Net Interest Income as % of operating income |
56.1% |
58.3% |
2.2% |
|
Non-Funded Income as a % of operating income |
43.9% |
41.7% |
(2.2%) |
|
Cost to Income Ratio |
68.7% |
57.7% |
(11.0%) |
|
CIR without LLP |
58.2% |
51.0% |
(7.2%) |
|
Cost to Assets |
7.4% |
6.4% |
(1.0%) |
|
Capital Adequacy Ratios |
Fy'2024 |
FY'2025 |
% Points Change |
|
Core Capital/Total Liabilities |
18.0% |
20.5% |
2.5% |
|
Minimum Statutory ratio |
8.0% |
8.0% |
0.0% |
|
Excess |
10.0% |
12.5% |
2.5% |
|
Core Capital/Total Risk Weighted Assets |
17.3% |
19.1% |
1.8% |
|
Minimum Statutory ratio |
10.5% |
10.5% |
0.0% |
|
Excess |
6.8% |
8.6% |
1.8% |
|
Total Capital/Total Risk Weighted Assets |
19.0% |
20.5% |
1.5% |
|
Minimum Statutory ratio |
14.5% |
14.5% |
0.0% |
|
Excess |
4.5% |
6.0% |
1.5% |
|
Liquidity Ratio |
57.4% |
64.7% |
7.3% |
|
Minimum Statutory ratio |
20.0% |
20.0% |
0.0% |
|
Excess |
37.4% |
44.7% |
7.3% |
Key Take-Outs:
-
Increased earnings - Core earnings per share grew by 54.5% to Kshs 19.1, from Kshs 12.3 in FY’2024, driven by the 12.4% increase in total operating income to Kshs 217.7 bn, from Kshs 193.8 bn in FY’2024, coupled with the 5.6% decrease in total operating expenses to Kshs 125.6 bn from Kshs 133.0 bn in FY’2024,
-
Improved asset quality – The bank’s Asset Quality improved, with Gross NPL ratio decreasing to 11.5% in FY’2025, from 13.6% in FY’2024, attributable to a 9.8% decrease in Gross non-performing loans to Kshs 110.1 bn, from Kshs 122.0 bn in FY’2024, compared to the 6.6% increase in gross loans to Kshs 956.0 bn, from Kshs 896.9 bn recorded in FY’2024,
-
Expanded Balanced sheet - The balance sheet registered an expansion as total assets increased by 9.2% to Kshs 1,971.0 bn in FY’2025, from Kshs 1,804.6 bn in FY’2024, mainly driven by the 11.4% increase in government securities to Kshs 335.3 bn, from Kshs 300.9 bn in FY’2024, coupled with a 7.7% increase in net loans to customers to Kshs 882.5 bn, from Kshs 819.2 bn in FY’2024,
-
Increased lending- Customer net loans and advances increased by 7.7% to Kshs 882.5 bn, from Kshs 819.2 bn in FY’2024.
-
Declaration of dividends - The Board of Directors recommended a dividend of Kshs 5.75, translating to a dividend yield of 7.4% and a dividend payout ratio of 30.2% for the FY’2025
For a more detailed analysis, please see the Equity Group FY’2025 Earnings Note
-
Standard Chartered Bank Ltd FY’2025 Performance
During the week, Standard Chartered Bank Ltd released their FY’2025 financial results. Below is a summary of the performance:
|
Balance Sheet Items |
FY'2024 |
FY'2025 |
y/y change |
|
Net loans |
151.6 |
154.3 |
1.8% |
|
Government Securities |
93.7 |
104.7 |
11.8% |
|
Total Assets |
384.6 |
363.5 |
(5.5%) |
|
Customer Deposits |
295.7 |
283.5 |
(4.1%) |
|
Deposits per Branch |
11.8 |
12.9 |
8.9% |
|
Total Liabilities |
312.8 |
297.2 |
(5.0%) |
|
Shareholder's Funds |
71.8 |
66.3 |
(7.6%) |
|
Balance Sheet Ratios |
FY'2024 |
FY'2025 |
% point change |
|
Loan to deposit ratio |
51.3% |
54.4% |
3.2% |
|
Government securities to deposit ratio |
31.7% |
36.9% |
5.3% |
|
Return on Average Equity |
30.1% |
18.0% |
(12.1%) |
|
Return on Average Assets |
4.9% |
3.3% |
(1.6%) |
|
Income Statement (Kshs Bn) |
FY'2024 |
FY'2025 |
y/y change |
|
Net Interest Income |
33.3 |
28.9 |
(13.1%) |
|
Net non-Interest Income |
17.4 |
13.4 |
(23.0%) |
|
Total Operating income |
50.7 |
42.3 |
(16.5%) |
|
Loan Loss provision |
2.4 |
2.0 |
(16.3%) |
|
Total Operating expenses |
22.5 |
25.5 |
13.3% |
|
Profit before tax |
28.2 |
16.8 |
(40.3%) |
|
Profit after tax |
20.1 |
12.4 |
(38.0%) |
|
Core EPS (Kshs) |
53.1 |
32.9 |
(38.0%) |
|
Dividend Per Share (Kshs) |
45.0 |
31.0 |
(31.1%) |
|
Dividend Yield |
14.7% |
9.4% |
(5.4%) points |
|
Dividend Payout Ratio |
84.8% |
94.2% |
9.4% points |
|
Income Statement Ratios |
FY'2024 |
FY'2025 |
% points change |
|
Yield from interest-earning assets |
11.1% |
9.8% |
(1.3%) |
|
Cost of funding |
1.7% |
1.4% |
(0.4%) |
|
Net Interest Spread |
9.4% |
8.5% |
(0.9%) |
|
Net Interest Margin |
9.5% |
8.7% |
(0.8%) |
|
Cost of Risk |
4.7% |
4.7% |
0.0% |
|
Net Interest Income as % of operating income |
65.6% |
68.3% |
2.7% |
|
Non-Funded Income as a % of operating income |
34.4% |
31.7% |
(2.7%) |
|
Cost to Income Ratio |
44.3% |
60.2% |
15.9% |
|
Cost to Income Ratio without LLP |
39.6% |
55.5% |
15.8% |
|
Capital Adequacy Ratios |
FY'2024 |
FY'2025 |
% points change |
|
Core Capital/Total Liabilities |
18.3% |
19.4% |
1.1% |
|
Minimum Statutory ratio |
8.0% |
8.0% |
0.0% |
|
Excess |
10.3% |
11.4% |
1.1% |
|
Core Capital/Total Risk Weighted Assets |
19.5% |
20.4% |
0.9% |
|
Minimum Statutory ratio |
10.5% |
10.5% |
0.0% |
|
Excess |
9.0% |
9.9% |
0.9% |
|
Total Capital/Total Risk Weighted Assets |
19.6% |
20.4% |
0.9% |
|
Minimum Statutory ratio |
14.5% |
14.5% |
0.0% |
|
Excess |
5.1% |
5.9% |
0.9% |
|
Liquidity Ratio |
67.6% |
0.0% |
(67.6%) |
|
Minimum Statutory ratio |
20.0% |
0.0% |
(20.0%) |
|
Excess |
47.6% |
0.0% |
(47.6%) |
Key Take-Outs:
-
Declined earnings growth - Core earnings per share decreased by 38.0% to Kshs 32.9 in FY’2025, from Kshs 53.1 in FY’2024, mainly driven by the 16.5% decrease in total operating income to Kshs 42.3 bn in FY’2025, from Kshs 50.7 bn in FY’2024, coupled with the 13.3% increase in total operating expenses to Kshs 25.5 bn in FY’2025, from Kshs 22.5 bn in FY’2024,
-
Improved asset quality – The bank’s Asset Quality improved, with Gross NPL ratio decreasing to 5.5% in FY’2025, from 7.4% in FY’2024, attributable to the 26.5% decrease in gross non-performing loans to Kshs 8.8 bn, from Kshs 12.0 bn in FY’2024, coupled with 22.6% decrease in Interest Suspense to Kshs 3.5 bn in FY’2025 from Kshs 4.5 bn recorded in FY’2024, and,
-
Declaration of dividends- The Board of Directors declared a final dividend of Kshs 23.0 per share in addition to an interim dividend of Kshs 8.0 per share, bringing the total dividend for FY’2025 to Kshs 31.0 per share translating to a dividend yield of 9.4% a and a dividend-payout ratio of 94.2%
For a more detailed analysis, please see the Standard Chartered Bank Ltd FY’2025 Earnings Note
-
Co-operative Group FY’2025 Performance
During the week, Co-operative Group released their FY’2025 financial results. Below is a summary of the performance:
|
Balance Sheet Items |
FY'2024 |
FY'2025 |
y/y change |
|
Government Securities |
217.6 |
244.9 |
12.6% |
|
Net Loans and Advances |
373.7 |
421.0 |
12.6% |
|
Total Assets |
743.2 |
827.4 |
11.3% |
|
Customer Deposits |
506.1 |
574.2 |
13.4% |
|
Deposits per branch |
2.47 |
2.65 |
7.2% |
|
Total Liabilities |
597.6 |
661.3 |
10.7% |
|
Shareholders Funds |
145.4 |
165.5 |
13.8% |
|
Balance Sheet Ratios |
FY'2024 |
FY'2025 |
% points change |
|
Loan to Deposit Ratio |
73.8% |
73.3% |
(0.5%) |
|
Government Securities to Deposits Ratio |
43.0% |
42.7% |
(0.3%) |
|
Return on average equity |
19.7% |
19.1% |
(0.5%) |
|
Return on average assets |
3.6% |
3.8% |
0.2% |
|
Income Statement |
FY'2024 |
FY'2025 |
y/y change |
|
Net Interest Income |
51.5 |
62.9 |
22.0% |
|
Non-Interest Income |
29.1 |
29.0 |
(0.3%) |
|
Total Operating income |
80.6 |
91.9 |
13.9% |
|
Loan Loss provision |
(8.7) |
(9.5) |
9.2% |
|
Total Operating expenses |
(46.7) |
(52.0) |
11.4% |
|
Profit before tax |
34.8 |
40.3 |
15.8% |
|
Profit after tax |
25.5 |
29.8 |
16.9% |
|
Core EPS |
4.3 |
5.1 |
16.9% |
|
Dividend per Share |
1.5 |
2.5 |
66.7% |
|
Dividend Payout Ratio |
34.6% |
49.3% |
14.7% |
|
Dividend Yield |
9.1% |
8.3% |
(0.9%) |
|
Income Statement Ratios |
FY'2024 |
FY'2025 |
% points change |
|
Yield from interest-earning assets |
13.9% |
13.6% |
(0.4%) |
|
Cost of funding |
6.4% |
5.0% |
(1.3%) |
|
Net Interest Spread |
7.6% |
8.5% |
1.0% |
|
Net Interest Income as % of operating income |
63.9% |
68.4% |
4.5% |
|
Non-Funded Income as a % of operating income |
36.1% |
31.6% |
(4.5%) |
|
Cost to Income |
57.9% |
56.6% |
(1.3%) |
|
CIR without provisions |
47.2% |
46.3% |
(0.9%) |
|
Cost to Assets |
5.1% |
5.1% |
0.0% |
|
Net Interest Margin |
8.3% |
9.2% |
0.8% |
|
Capital Adequacy Ratios |
FY'2024 |
FY'2025 |
% points change |
|
Core Capital/Total deposit Liabilities |
24.2% |
24.0% |
(0.2%) |
|
Minimum Statutory ratio |
8.0% |
8.0% |
|
|
Excess |
16.2% |
16.0% |
(0.2%) |
|
Core Capital/Total Risk Weighted Assets |
18.3% |
20.3% |
2.0% |
|
Minimum Statutory ratio |
10.5% |
10.5% |
|
|
Excess |
7.8% |
9.8% |
2.0% |
|
Total Capital/Total Risk Weighted Assets |
21.2% |
22.6% |
1.4% |
|
Minimum Statutory ratio |
14.5% |
14.5% |
|
|
Excess |
6.7% |
8.1% |
1.4% |
|
Liquidity Ratio |
59.9% |
60.0% |
0.1% |
|
Minimum Statutory ratio |
20.0% |
20.0% |
|
|
Excess |
39.9% |
40.0% |
0.1% |
Key Take-Outs:
-
Increased earnings - Core earnings per share grew by 16.9% to Kshs 5.1, from Kshs 4.3 in FY’2024, driven by the 13.9% increase in total operating income to Kshs 91.9 bn, from Kshs 80.6 bn in FY’2024. However, the performance was weighed down by a 11.4% increase in total operating expenses to Kshs 52.0 bn from Kshs 46.7 bn in FY’2024,
-
Improved asset quality – The bank’s Asset Quality improved, with Gross NPL ratio decreasing to 15.7% in FY’2025, from 17.0% in FY’2024, attributable to a 3.4% increase in Gross non-performing loans to Kshs 73.5 bn, from Kshs 71.1 bn in FY’2024, relative to the 12.0% increase in gross loans to Kshs 469.5 bn, from Kshs 419.2 bn recorded in FY’2024,
-
Expanded Balanced sheet - The balance sheet recorded an expansion as total assets increased by 11.3% to Kshs 827.4 bn, from Kshs 743.2 bn in FY’2024, mainly driven by a 12.6% increase in net loans and advances and governments securities holdings to Kshs 421.0 bn and Kshs 244.9 bn, from Kshs 373.7 bn and 217.6 bn in FY’2024.
For a more detailed analysis, please see the Co-operative Group FY’2025 Earnings Note
Asset Quality:
The table below shows the asset quality of listed banks that have released their FY’2025 results using several metrics:
|
Cytonn Report: Listed Banks Asset Quality in FY’2025 |
||||||
|
Bank |
FY'2025 NPL Ratio* |
FY'2024 NPL Ratio** |
% point change in NPL Ratio |
FY'2025 NPL Coverage* |
FY'2024 NPL Coverage** |
% point change in NPL Coverage |
|
KCB Group |
16.2% |
19.8% |
(3.7%) |
74.0% |
65.1% |
9.0% |
|
Equity Group |
11.5% |
13.6% |
(2.1%) |
66.8% |
63.7% |
3.1% |
|
Standard Chartered Bank |
5.5% |
7.4% |
(2.0%) |
87.0% |
81.8% |
5.2% |
|
Co-operative Bank |
15.7% |
17.0% |
(1.3%) |
66.0% |
63.9% |
2.1% |
|
Stanbic Holdings |
8.0% |
9.1% |
(1.1%) |
84.3% |
78.4% |
5.9% |
|
Absa Bank Kenya |
11.5% |
12.6% |
(1.1%) |
64.6% |
66.0% |
(1.4%) |
|
FY’2025 Mkt Weighted Average* |
12.2% |
13.4% |
(1.1%) |
71.8% |
66.7% |
5.2% |
|
FY’2025 Mkt Weighted Average** |
13.2% |
12.6% |
0.7% |
66.8% |
60.7% |
6.1% |
|
*Market cap weighted as at 19/03/2026 |
||||||
|
**Market cap weighted as at 13/03/2025 |
||||||
Key take-outs from the table include;
-
Asset quality for the listed banks that have released results improved during FY’2025, with market-weighted average NPL ratio decreasing by 1.1% points to 12.2% from 13.4% in FY’2024 largely due to KCB Group numbers, and,
-
Market-weighted average NPL Coverage for the six listed banks increased by 5.2% points to 71.8% in FY’2025 from 66.7% recorded in FY’2024. The increase was attributable to KCB Group NPL coverage ratio increasing by 9.0% points to 74.0% from 65.1% in FY’2024. However the performance was weighed down by Absa Bank Kenya NPL coverage ratio decreasing by 1.4% points to 64.6% from 66.0% in FY’2024.
Summary Performance
The table below shows the performance of listed banks that have released their FY’2025 results using several metrics:
|
Cytonn Report: Listed Banks Performance in FY’2025 |
||||||||||||||
|
Bank |
Core EPS Growth |
Interest Income Growth |
Interest Expense Growth |
Net Interest Income Growth |
Net Interest Margin |
Non-Funded Income Growth |
NFI to Total Operating Income |
Growth in Total Fees & Commissions |
Deposit Growth |
Growth in Government Securities |
Loan to Deposit Ratio |
Loan Growth |
Return on Average Equity |
|
|
Equity Group |
54.7% |
2.0% |
(24.2%) |
16.8% |
7.8% |
6.7% |
41.7% |
7.9% |
4.0% |
11.4% |
60.6% |
7.7% |
27.8% |
|
|
Co-operative Bank |
16.9% |
8.0% |
(12.8%) |
22.0% |
9.2% |
(0.3%) |
31.6% |
1.2% |
13.4% |
12.6% |
73.3% |
12.6% |
19.1% |
|
|
KCB Group |
11.2% |
(1.7%) |
(18.9%) |
7.8% |
8.6% |
(2.6%) |
30.8% |
0.7% |
15.2% |
10.2% |
72.3% |
16.3% |
22.5% |
|
|
Absa Bank Kenya |
9.7% |
(10.9%) |
(22.2%) |
(6.4%) |
9.1% |
12.2% |
29.4% |
18.8% |
1.4% |
20.7% |
83.8% |
1.0% |
24.7% |
|
|
Stanbic Group |
0.0% |
(17.2%) |
(41.4%) |
(1.0%) |
5.7% |
(6.4%) |
37.5% |
(10.0%) |
19.5% |
36.4% |
70.3% |
17.2% |
18.8% |
|
|
Standard Chartered Bank |
(38.0%) |
(15.4%) |
(29.1%) |
(13.1%) |
8.7% |
(23.0%) |
31.7% |
1.0% |
(4.1%) |
11.8% |
54.4% |
1.8% |
18.0% |
|
|
FY'2025 Mkt Weighted Average* |
16.6% |
(3.6%) |
(23.0%) |
7.0% |
8.3% |
(0.1%) |
34.3% |
4.5% |
8.1% |
15.1% |
69.0% |
9.5% |
22.8% |
|
|
FY'24 Mkt Weighted Average* |
26.2% |
20.5% |
42.6% |
12.0% |
7.6% |
13.9% |
36.1% |
9.2% |
(4.4%) |
18.9% |
66.5% |
(7.6%) |
22.8% |
|
|
*Market cap weighted as at 19/03/2026 |
||||||||||||||
|
**Market cap weighted as at 13/03/2025 |
||||||||||||||
Key take-outs from the table include:
-
The listed banks that have released their FY’2025 results recorded a 16.6% growth in core Earnings per Share (EPS) in FY2025, compared to the weighted average growth of 26.2% in FY’2024, an indication of deteriorated performance attributable to the Standard Chartered numbers.
-
Interest income recorded a weighted average decrease of 3.6% in FY’2025, compared to 20.5% in FY’2024. Similarly, interest expenses recorded a market-weighted average decline of 23.0% in FY’2025 compared to the weighted average growth of 42.6% in FY’2024.
-
The Banks’ net interest income recorded a weighted average growth of 7.0% in FY’2025, a decrease from the 12.0% recorded over a similar period in 2024, while the non-funded income declined by 0.1% in FY’2025 compared to the 13.9% growth recorded in FY’ 2024, and,
-
The Banks recorded a weighted average deposit growth of 8.1%, compared to the decrease in market-weighted average deposit of 4.4% in FY’2024.
We maintain a “cautiously optimistic” short-term outlook supported primarily earnings-led attractive valuations, lower yields on short-term government papers and expected global and local economic recovery, and, “neutral” in the long term as persistent foreign investor outflows continue to constrain market liquidity and limit broad-based market re-rating. With the market currently trading at par to its future growth (PEG Ratio at 1.0x), where performance will be driven by company-specific fundamentals rather than general market direction, we believe that investors should reposition towards value stocks exhibiting strong earnings growth, attractive dividend yields, solid balance sheets, sustainable competitive advantages and trading at compelling discounts to their intrinsic value. While foreign investor sell-offs are expected to continue exerting pressure in the near term, we believe this will create selective entry opportunities for long-term investors.
-
Industry Report
-
January Leading Economic Indicators (LEI)
During the week, the Kenya National Bureau of Statistics (KNBS) released the Leading Economic Indicators (LEI) January 2026 Report, which highlighted the performance of major economic indicators. The key highlights related to the Real Estate sector include:
-
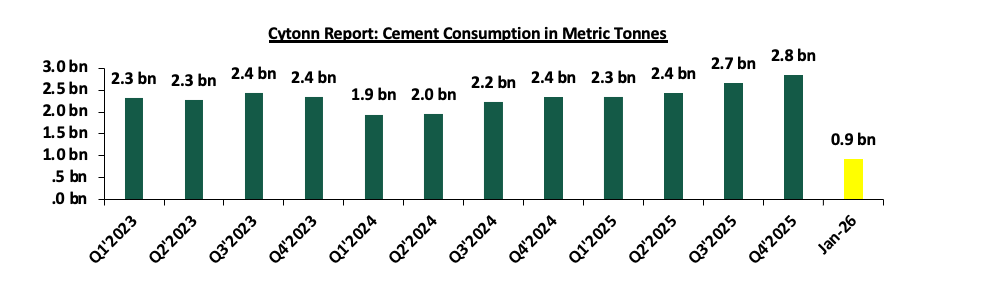
In January 2026, cement consumption reached 922,369 metric tonnes, representing a 17.6% y/y increase from the same month in 2025. Month-on-month, consumption decreased by 1.7%, to 922,369 from 938,302 in December 2025 reflecting a decline in momentum in the construction sector. The y/y performance was anchored by (i) continuous increase in production of cement to 938,012 as at January 2026 (ii) continued private sector construction activity in urban hubs such as Nairobi, Mombasa, and Kisumu, (iii) government-led infrastructure investments under the Bottom-Up Economic Transformation Agenda (BETA), including roads, affordable housing, water, and sanitation projects, and (iv) public works initiatives in rural and semi-urban areas, which both support livelihoods and expand critical infrastructure.
The chart below shows cement consumption in metric tonnes in Kenya between Q1’2023 and January 2026
Source: Kenya National Bureau of Statistics (KNBS)
-
Residential Sector
Launch of Affordable Housing Project in Kimilili, Bungoma County
During the week, William Ruto presided over the launch of an affordable housing project in Kimilili, Bungoma County, as part of his broader Western Kenya development tour, reinforcing the government’s ongoing efforts to scale up the Affordable Housing Programme across the country. The initiative reflects a continued shift towards expanding housing delivery into emerging urban centres, with the Kimilili project forming part of a growing pipeline of developments aimed at increasing access to decent and affordable housing while supporting local economic activity.
The affordable housing initiative has continued to, to record notable progress, with recent handovers of completed units signaling movement from construction to occupancy. Uptake levels have remained relatively strong, with 98.0% absorption rate across completed units, supported by flexible financing frameworks and sustained end-user demand.
Going forward we expect continued rollout of affordable housing projects in secondary, supporting expansion of formal housing supply. We anticipate increased private sector participation alongside government efforts driven by sustained demand and policy support. We expect gradual land value appreciation and rising investor interest in emerging residential nodes as infrastructure and housing developments scale up.
-
Real Estate Investments Trusts
-
REITs Weekly Performance
On the Unquoted Securities Platform Acorn D-REIT and I-REIT traded at Kshs 27.4 and Kshs 23.2per unit, respectively, as per the last updated data on 13th March 2025. The performance represented a 33.4% and 14.5% gain for the D-REIT and I-REIT, respectively, from the Kshs 20.0 inception price. The volumes traded for the D-REIT and I-REIT came in at 13.4 mn and 42.2 mn shares, respectively. Additionally, ILAM Fahari I-REIT traded at Kshs 11.0 per share as of 19th March, representing a 45.0% loss from the Kshs 20.0 inception price. The volume traded to date came in at 1.2 mn shares for the I-REIT, REITs offer various benefits, such as tax exemptions, diversified portfolios, and stable long-term profits. However, the ongoing decline in the performance of Kenyan REITs and the restructuring of their business portfolios are hindering significant previous investments. Additional general challenges include:
-
Insufficient understanding of the investment instrument among investors leading to a slower uptake of REIT products,
-
Lengthy approval processes for REIT creation,
-
High minimum capital requirements of Kshs 100.0 mn for REIT trustees compared to Kshs 10.0 mn for pension funds Trustees, essentially limiting the licensed REIT Trustee to banks only
-
The rigidity of choice between either a D-REIT or and I-REIT forces managers to form two REITs, rather than having one Hybrid REIT that can allocate between development and income earning properties
-
Limiting the type of legal entity that can form a REIT to only a trust company, as opposed to allowing other entities such as partnerships, and companies,
-
We need to give time before REITS are required to list – they would be allowed to stay private for a few years before the requirement to list given that not all companies maybe comfortable with listing on day one, and,
-
Minimum subscription amounts or offer parcels set at Kshs 0.1 mn for D-REITs and Kshs 5.0 mn for restricted I-REITs. The significant capital requirements still make REITs relatively inaccessible to smaller retail investors compared to other investment vehicles like unit trusts or government bonds, all of which continue to limit the performance of Kenyan REITs.
We expect the performance of Kenya’s Real Estate sector to remain resilient, supported by several factors: i) Kimilili Affordable Housing Project launch signalling expansion of Government Housing Programme in Bungoma County. However, challenges such as the weak investor appetite in listed REITs like ILAM Fahari I-REIT and high capital requirements will continue to constrain the sector’s optimal performance.
Focus of the Week : Retirement Benefits Schemes FY'2025 Performance Report, & Cytonn Weekly #11.2026
According to the Retirement Benefits Authority Industry Brief for December 2025, the Assets Under Management (AUM) increased by 24.6% to Kshs 2.8 tn from Kshs 2.3 tn. The performance was attributable to higher contributions from the NSSF Act, 2013’s raised limits and strong investment performance supported by a stable macroeconomic environment. Notably, according to the ACTSERV Q4’2025 Retirement Benefits Schemes Investments Performance Survey, segregated retirement benefits schemes recorded a 2.6% return in Q4’2025, from the 13.2% return recorded in Q4’2024. The performance was largely driven by weaker equity performance, with the average return coming in at 8.0% compared to 15.7% return recorded in Q4’2024. The return reflects the performance of the market as the Nairobi All Share Index (NASI) had gained by 4.7% and 48.9% in Q4’2025 and FY’2025 respectively.
In our previous report, we highlighted that, as of 30th June 2025, pensions and gratuities exchequer issues came in at Kshs 207.2 bn, equivalent to 92.9% of the revised estimates III of Kshs 223.1 bn. Additionally, the National Treasury highlighted that the claims processing fell behind with only 85.0% of the claims being processed as of 30th June 2025. Notably, in FY 2024/25, all pensions and gratuities processed for payment, together with Government of Kenya remittances to the Public Service Superannuation Scheme (PSSS), were fully funded. As of 30th June 2025, the Public Service Superannuation Scheme (PSSS) reported Assets Under Management (AUM) of Kshs 242.8 billion, with 85.5% invested in government securities, 6.9% in equities, and 3.0% in offshore investments. According to the Office of the Controller of Budget, total payments towards Pensions and Gratuities (including PSSS) in the first three months of FY’2025/26 stood at Kshs 36.6 bn, representing 15.6% of the gross estimates of Kshs 234.9 bn compared to Kshs 32.1 bn recorded in a similar period of FY’2024/25 representing 14.4% of the gross estimates of Kshs 223.1 bn. Payments towards the PSSS stood at Kshs 9.7 bn representing 28.1% of the gross estimates of Kshs 34.4 bn. Ordinary and commuted pensions processed for payment totaled Kshs 29.0 bn, of which exchequer releases amounted to Kshs 26.9 bn, leaving an unfunded gap of Kshs 2.2 bn still outstanding.
We have been tracking the performance of Kenya’s Pension schemes with the most recent topicals being,
Retirement Benefits Schemes Q3'2025 Performance Report, done in December 2025. This week, we shall focus on understanding Retirement Benefits Schemes and looking into the historical and current state of retirement benefits schemes in Kenya and what can be done going forward. We shall also analyze other asset classes that the schemes can tap into to achieve higher returns. Additionally, we shall look into factors and challenges influencing the growth of the RBSs in Kenya as well as the actionable steps that can be taken to improve the pension industry. We shall do this by looking into the following:
-
Introduction to Retirement Benefits Schemes in Kenya,
-
Historical and Current State of Retirement Benefits Schemes in Kenya,
-
Factors Influencing the Growth of Retirement Benefits Scheme in Kenya,
-
Challenges that Have Hindered the Growth of Retirement Benefit Schemes, and,
-
Recommendations on Enhancing the Performance of Retirement Benefits Schemes in Kenya;
Section I: Introduction to Retirement Benefits Schemes in Kenya
A retirement benefits scheme is a savings avenue that allows contributing individuals to make regular contributions during their productive years into the scheme and thereafter get income from the scheme upon retirement. These schemes offer a range of benefits, including income replacement to maintain one’s lifestyle post-employment, compounded and tax-free interest that accelerates savings growth, and substantial tax incentives, such as monthly reliefs of up to Kshs 30,000 on contributions and exemptions on pension withdrawals after 20 years, under the Tax Amendment Act, 2024. Beyond financial independence, which reduces reliance on family support, the schemes also support home ownership through structured access to pension savings, allowing members to either assign up to 60% of their benefits for mortgage guarantees or utilize up to 40% (capped at Kshs 7.0 mn) for direct residential house purchases. These features make retirement benefits schemes a vital pillar of personal financial planning and national economic resilience.
Section II: Historical and the Current State of Retirement Benefits Schemes in Kenya
i. Growth of Retirement Benefits Schemes
According to the latest Retirement Benefits Authority (RBA) Industry Report for December 2025, assets under management increased by 24.6% to Kshs 2.8 tn from the Kshs 2.3 tn recorded in December 2024. The growth of the assets was majorly attributed to the increase in contributions to the mandatory National Social Security Fund (NSSF) scheme, through the rollout of the third phase of the NSSF Act, 2013 which took effect in February 2025 significantly boosting retirement savings. Under Phase 3, the lower earnings limit increased from Kshs 7,000.0 to Kshs 8,000.0, while the upper earnings limit doubled from Kshs 36,000.0 to Kshs 72,000.0. As such, the NSSF investment assets increased by 43.1% to Kshs 623.8 bn in December 2025, from Kshs 435.9 bn in December 2024. Additionally, the improved macroeconomic conditions during the period as evidenced by favorable interest rate environment, mild inflationary pressures and stability of the exchange rate led to the growth in investment income for the schemes. In February 2026, the fourth phase of the NSSF contribution limit adjustment was successfully implemented, raising the lower earnings limit to Kshs 9,000 from Kshs 8,000 and the upper earnings limit to Kshs 108,000 from Kshs 72,000. Additionally, Tier I contributions rose from Kshs 480 to Kshs 540 for both employer and employee, while maximum Tier II contributions increased from Kshs 3,840 to Kshs 5,940 for both. This upward revision has already begun to strengthen the retirement benefits sector by boosting individual savings and accelerating the growth of overall Assets Under Management (AUM). The enhanced contributions are expected to continue to deepen long-term investment capacity and improve income security for future retirees, reinforcing the sector’s role in national economic development.
The graph below shows the growth of Assets under Management of the retirement benefits schemes over the last 10 years:
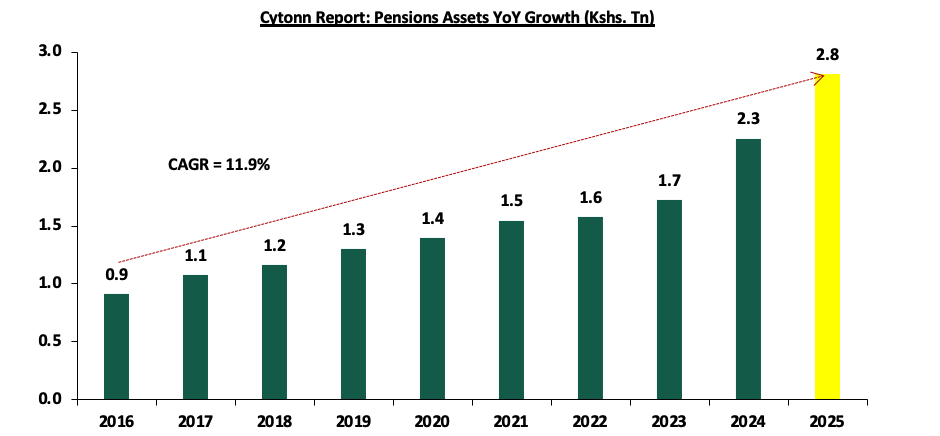
The consistent YoY increase demonstrates the significant role that the enhanced NSSF contributions made to the industry’s performance, following the implementation of the NSSF Act of 2013, which took effect in February 2023. The primary goal of the Act was to broaden the NSSF’s benefit coverage, range, and scope as well as improve the adequacy of benefits paid out of the scheme by the Fund amongst others.
The chart below shows the y/y changes in the assets under management for the schemes over the years.
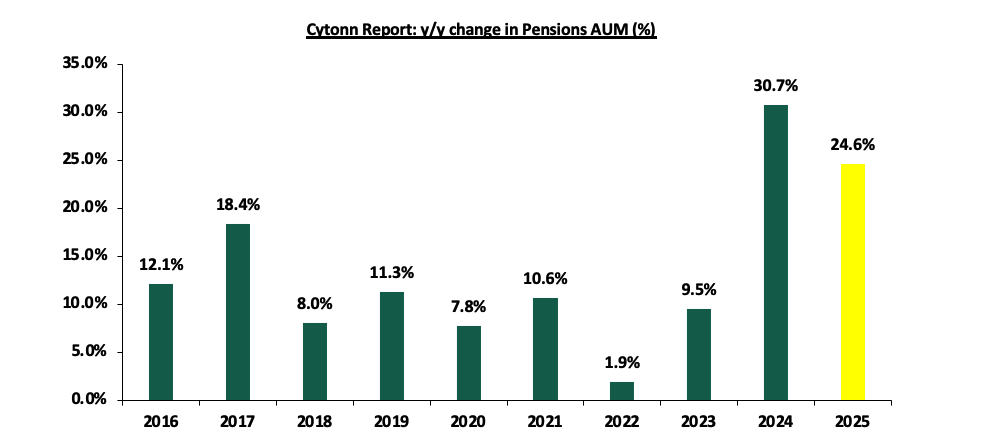
Source: RBA Industry Report
In Kenya, pension funds hold a substantial share of financial assets, consistently growing due to mandatory and voluntary contributions under the National Social Security Fund (NSSF) Act of 2013 regulations. In comparison, bank deposits remain the largest financial pool, reflecting their role as the primary savings vehicle driven by their liquidity, security, and accessibility, though they offer lower returns. Capital markets products, including unit trusts and REITs, are relatively smaller highlighting the nascent stage of capital markets in Kenya, but expanding as investors seek diversification and higher yields. Key to note, the Collective Investments Scheme’s industry’s overall Assets under Management (AUM) grew by 11.3% quarter‑on‑quarter to Kshs 756.2 bn in FY’2025 from Kshs 679.6 bn in Q3’2025, while on a year‑on‑year basis AUM rose by 94.3% from Kshs 389.2 bn in FY’2024. SACCOs play a crucial role in cooperative-based savings and credit access, especially for middle-income earners.
The graph below shows the Assets under Management of Pensions against other Capital Markets products and bank deposits:
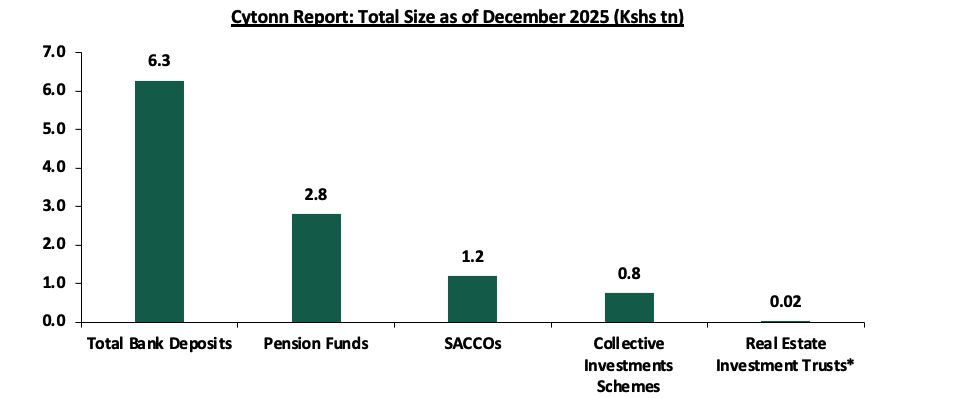
*Data as of June 2025
Sources: CMA, RBA, SASRA and RAK
As of the latest available data by RBA, Kenya’s pension-to-GDP ratio increased by 1.5% points to 16.1% in December 2025 from 14.6% in 2024, driven by a 24.6% increase in pension Assets Under Management (AUM) to Kshs 2.8 bn, significantly outpacing the country’s GDP growth rate, which recorded a growth of 4.9% in Q3’2025. This disparity implies that the pension sector is expanding at a much faster rate than the broader economy, reflecting stronger savings mobilization, improved investment returns, and possibly increased compliance or contribution levels following regulatory reforms. However, the 16.1% is significantly lower than that of developed countries such as the United States at 169.5%, Australia at 132.6%, and the United Kingdom at 124.2%, reflecting the maturity and depth of their pension systems. In Sub-Saharan Africa region, Kenya outperforms countries like Malawi at 11.7%, Uganda at 9.0% and Nigeria at 8.0%, but still lags behind Namibia at 100.4% and South Africa at 83.8%. This positioning indicates that while Kenya’s pension sector is growing steadily, particularly with recent reforms, there remains considerable room for expansion and deeper integration into the national economy. The graph below shows select countries’ pension assets to GDP ratio as per the latest published data by World Bank as of 2020:
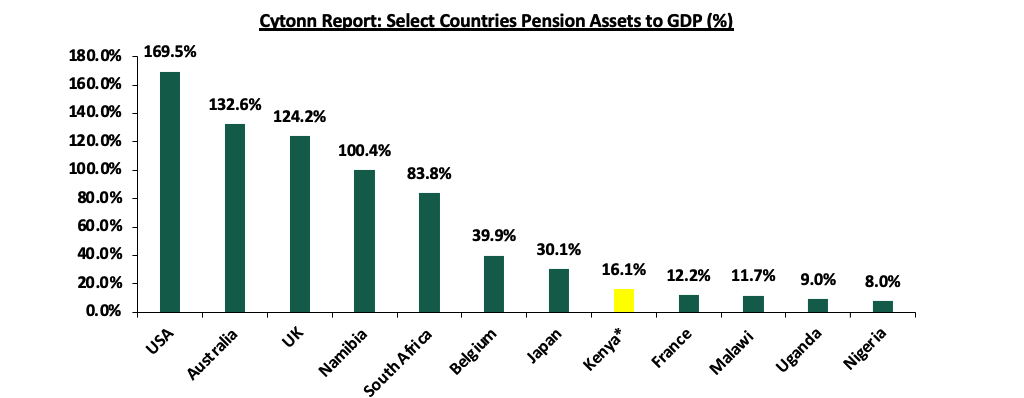
Sources: World Bank, RBA *data as of December 2025
The graph below shows Kenya’s pension to GDP ratio over the years:
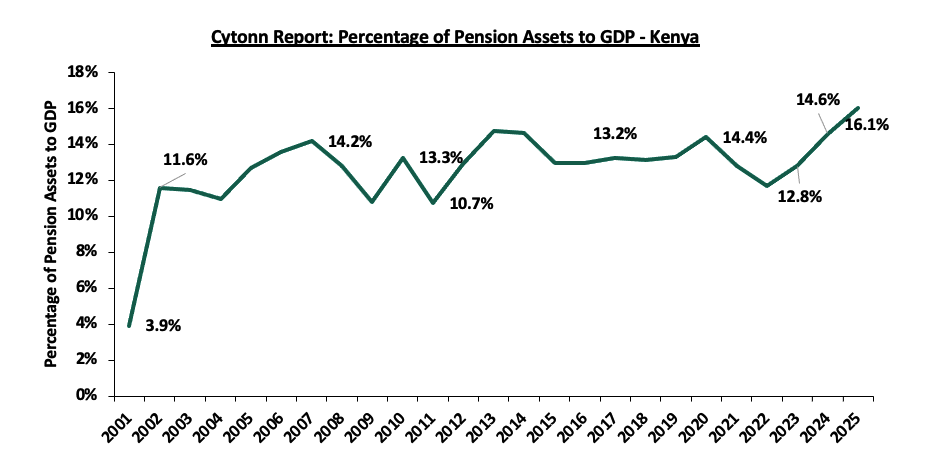
Source: RBA Industry Reports
-
Assets Held by Fund Managers
According to the Retirement Benefits Authority, as of the end of December 2025, 23 fund managers submitted their returns to RBA. The AUM for the fund managers increased by 12.7% to Kshs 2,217.8 bn in December 2025 from Kshs 1,967.5 bn recorded in June 2025. The table below outlines the performance of the Fund Managers comparing June 2025 and December 2025:
|
# |
Cytonn Report: Assets Under Management by Fund Managers |
|||||
|
Fund Manager |
June 2025 AUM |
Market Share |
December 2025 AUM |
Market Share |
AUM Growth (June 2024 to December 2024) |
|
|
1. |
Genafrica Asset Managers Limited |
770.5 |
39.2% |
703.7 |
31.7% |
(8.7%) |
|
2. |
Co-optrust Investment Services Limited |
376.8 |
19.2% |
466.8 |
21.0% |
23.9% |
|
3. |
African Alliance Kenya Asset Management Limited |
218.8 |
11.1% |
320.4 |
14.4% |
46.4% |
|
4. |
Sanlam Investments East Africa Limited |
250.9 |
12.8% |
316.3 |
14.3% |
26.1% |
|
5. |
Old Mutual Investment Group Limited |
211.2 |
10.7% |
227.0 |
10.2% |
7.5% |
|
6. |
ICEA Lion Asset Management Limited |
94.7 |
4.8% |
103.3 |
4.7% |
9.1% |
|
7. |
CIC Asset Management Limited |
15.3 |
0.8% |
45.7 |
2.1% |
199.3% |
|
8. |
ABSA Asset Management Ltd |
4.5 |
0.2% |
9.8 |
0.4% |
115.2% |
|
9. |
NCBA Investment Bank Ltd |
8.0 |
0.4% |
8.8 |
0.4% |
9.8% |
|
10. |
Britam Asset Managers Kenya Limited |
9.8 |
0.5% |
7.7 |
0.3% |
(21.6%) |
|
11. |
Globetec Asset Management Limited |
4.1 |
0.2% |
5.1 |
0.2% |
23.8% |
|
12. |
Mayfair Asset Managers Limited |
0.6 |
0.0% |
0.8 |
0.0% |
31.5% |
|
13. |
Zimele Asset Management Company Limited |
0.8 |
0.0% |
0.8 |
0.0% |
0.7% |
|
14. |
Investcent Partners Limited |
0.6 |
0.0% |
0.7 |
0.0% |
5.5% |
|
15. |
Kuza Asset Management Limited |
0.2 |
0.0% |
0.3 |
0.0% |
55.4% |
|
16. |
Dry Associates Limited |
0.3 |
0.0% |
0.3 |
0.0% |
(0.0%) |
|
17. |
Cytonn Asset Managers Limited |
0.1 |
0.0% |
0.1 |
0.0% |
14.7% |
|
18. |
Lofty Corban Investments Limited |
0.0 |
0.0% |
0.1 |
0.0% |
47.8% |
|
19. |
Amana Capital Limited |
0.1 |
0.0% |
0.0 |
0.0% |
(9.6%) |
|
20. |
Fusion Investment Management Limited |
0.0 |
0.0% |
0.0 |
0.0% |
15.0% |
|
21. |
Genghis Capital Ltd |
0.0 |
0.0% |
0.0 |
0.0% |
1.7% |
|
22. |
VCG Asset Management Limited |
0.0 |
0.0% |
0.0 |
0.0% |
651.6% |
|
23. |
Star Capital Management Ltd |
- |
- |
0.0 |
0.0% |
- |
|
|
Total |
1,967.5 |
2,217.8 |
12.7% |
||
Source: RBA Industry Report
Key take-outs from the above table include:
-
Assets Under Management: The AUM recorded a 12.7% growth to Kshs 2,217.8 bn in December 2025, higher than the AUM of Kshs 1,967.5 bn in June 2025,
-
Growth: In terms of AUM growth, VCG Asset Managers recorded the highest growth of 651.6% with its AUM increasing to Kshs 4.5 mn, from Kshs 0.6 mn in June 2025, attributable to the base effect. On the other hand, Britam Asset Managers recorded the largest decline with its AUM declining by 21.6% to Kshs 7.7 bn in December 2025, from Kshs 9.8 mn in June 2025,
-
Market Share: GenAfrica Asset Managers remained the largest overall Unit Trust with a market share of 31.7%, 7.4% points increase from 39.2% recorded in June 2025.
-
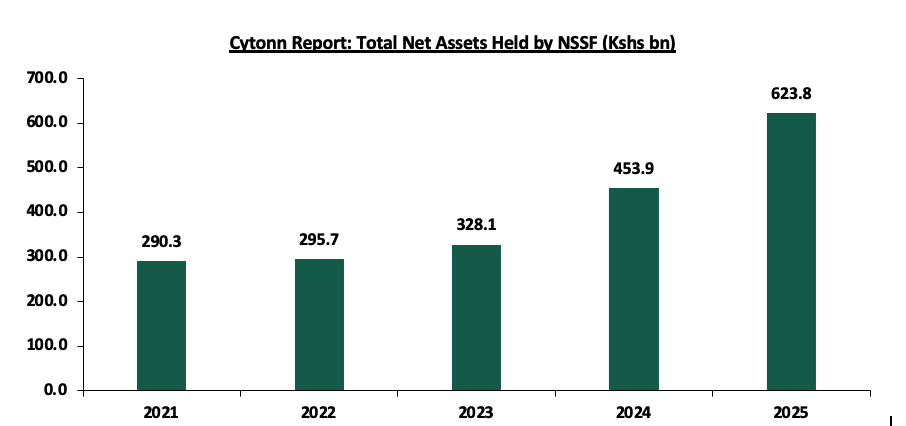
Assets Held by NSSF
The total assets held by NSSF increased by 37.4% on a year-on-year basis to Kshs 623.8 bn in December 2025 from Kshs 453.9 bn in December 2024, and by 11.8% from Kshs 558.1 in June 2025. This is attributable to increased contributions due to the implementation of the NSSF Act of 2013, with the total NSSF remitted contributions increasing by 38.5% to Kshs 81.9 bn in FY’2023/24 from Kshs 59.1 bn in FY’2024/25, while unremitted contributions decreased by 35.4% to Kshs 2.0 bn from Kshs 3.1 bn in June 2024 highlighting improved employer compliance. Notably, contributions to the NSSF increased by 2.7% to Kshs 43.4 bn in December 2025 from Kshs 44.7 bn in June 2025. Additionally, internally managed funds amounted to Kshs 34.5 bn while externally managed funds were Kshs 589.3 bn. The graph below shows the total Assets under Management of NSSF over the last 5 years:
Source: RBA Industry Report
-
Total Pension Contributions
Total pension contributions in 2025 came in at 285.4 bn, a 21.5% increase from the 234.9 bn in 2024. Since the implementation of the NSSF Act, 2013 in February 2023, the total pension contributions have increased gradually from Kshs 133.0 bn in 2022 to Kshs 188.8 bn in 2023 and Kshs 285.4 in 2025. Notably, the total NSSF remitted contributions increased by 38.5% to Kshs 81.9 bn in FY’2023/24 from Kshs 59.1 bn in FY’2024/25, while unremitted contributions decreased by 35.4% to Kshs 2.0 bn from Kshs 3.1 bn in June 2024 highlighting improved employer compliance.
Contributions to Post-Retirement Medical Funds (PRMFs) increased by 32.2% to Kshs 157.1 bn in December 2025 from Kshs 118.8 bn in 2024. This growth is primarily attributed to an increasing number of retirement benefit schemes being established and commencing contributions to PRMFs to enhance member welfare post-retirement.
ii. Retirement Benefits Schemes Allocations and Various Investment Opportunities
Retirement Benefits Schemes aim to protect members’ savings while achieving competitive long-term returns by investing across various asset classes. Schemes have invested in traditional asset classes such as equities and fixed income securities, which offer a balance between risk and return. However, to enhance portfolio performance and diversify risk, they have increasingly explored alternative asset classes such as real estate, private equity, offshore funds and other non-traditional asset classes. Investing in alternative assets provides opportunities for higher returns, hedge against inflation and exposure to long-term growth sectors. The choice and proportion of these investments are determined by each scheme’s Investment Policy Statement (IPS), which sets out guidelines for risk tolerance, liquidity needs and return objectives. As such, the performance of Retirement Benefits Schemes in Kenya depends on a number of factors such as;
-
Asset allocation,
-
Selection of the best-performing security within a particular asset class,
-
Size of the scheme,
-
Risk appetite of members and investors, and,
-
Investment horizon.
The Retirement Benefits (Forms and Fees) Regulations, 2000 provide investment guidelines for pension schemes in Kenya, setting asset class exposure limits to safeguard returns and protect members’ funds. Trustees are required to draft and update Investment Policy Statements (IPS) every three years, tailored to scheme demographics and economic outlook, to guide diversification, risk management, and performance monitoring. Current regulations permit up to 90% in government bonds, 70% in quoted equities, 30% in property, 15% offshore, and 10% in private equity, though allocations remain skewed toward traditional assets, with IPS encouraging broader inclusion of alternatives and offshore investments. The table below represents how the retirement benefits schemes have invested their funds in the past:
|
Asset Class |
2016 |
2017 |
2018 |
2019 |
2020 |
2021 |
2022 |
2023 |
2024 |
2025 |
Average |
Limit |
|
Government Securities |
38.3% |
36.5% |
39.4% |
42.0% |
44.7% |
45.7% |
45.8% |
47.5% |
52.5% |
52.1% |
44.4% |
90.0% |
|
Quoted Equities |
17.4% |
19.5% |
17.3% |
17.6% |
15.6% |
16.5% |
13.7% |
8.4% |
9.0% |
11.1% |
14.6% |
70.0% |
|
Immovable Property |
19.5% |
21.0% |
19.7% |
18.5% |
18.0% |
16.4% |
15.8% |
14.0% |
11.1% |
8.6% |
16.3% |
30.0% |
|
Guaranteed Funds |
14.2% |
13.2% |
14.4% |
15.5% |
16.5% |
16.8% |
18.9% |
20.8% |
19.4% |
18.6% |
16.8% |
100.0% |
|
Listed Corporate Bonds |
5.1% |
3.9% |
3.5% |
1.4% |
0.4% |
0.4% |
0.5% |
0.4% |
0.3% |
1.0% |
1.7% |
20.0% |
|
Fixed Deposits |
2.7% |
3.0% |
3.1% |
3.0% |
2.8% |
1.8% |
2.7% |
4.8% |
2.4% |
2.0% |
2.8% |
30.0% |
|
Offshore |
0.8% |
1.2% |
1.1% |
0.5% |
0.8% |
1.3% |
0.9% |
1.6% |
2.9% |
3.0% |
1.4% |
15.0% |
|
Cash |
1.4% |
1.2% |
1.1% |
1.2% |
0.9% |
0.6% |
1.1% |
1.5% |
1.0% |
1.2% |
1.1% |
5.0% |
|
Unquoted Equities |
0.4% |
0.4% |
0.3% |
0.3% |
0.2% |
0.2% |
0.3% |
0.2% |
0.2% |
0.3% |
0.3% |
5.0% |
|
Private Equity |
0.0% |
0.0% |
0.1% |
0.1% |
0.1% |
0.2% |
0.2% |
0.3% |
0.7% |
1.1% |
0.3% |
10.0% |
|
REITs* |
0.1% |
0.1% |
0.1% |
0.0% |
0.0% |
0.0% |
0.0% |
0.6% |
0.5% |
0.5% |
0.2% |
30.0% |
|
Commercial Paper, non-listed bonds by private companies* |
- |
0.0% |
0.0% |
0.0% |
0.0% |
0.0% |
0.0% |
0.0% |
0.1% |
0.4% |
0.1% |
10.0% |
|
Others e.g. Unlisted Commercial Papers |
0.0% |
0.0% |
0.0% |
0.0% |
0.0% |
0.1% |
0.2% |
- |
0.0% |
0.02% |
0.0% |
10.0% |
|
Total |
100.0% |
100.0% |
100.0% |
100.0% |
100.0% |
100.0% |
100.0% |
100.0% |
100.0% |
100.0% |
100.0% |
100.0% |
Source: Retirement Benefits Authority
Retirement benefits schemes have for a long time skewed their investments towards traditional assets, mostly, government securities and the equities market, averaging 59.0% between 2016 and 2025 for the two asset classes, leaving only 41.0% for the other asset classes. However, as pension schemes seek higher returns, diversification, and inflation hedging, there has been a growing shift towards alternative investments that include immovable property, private equity and Real Estate Investments Trusts (REITs). It is vital to note, that in 2025 there was an increase recorded in investments in private equity by 84.8% to Kshs 29.9 bn from Kshs 16.2 bn recorded in 2024 while investments in Real Estate Investments Trusts increased by 22.8% to Kshs 14.4 bn in 2025 from Kshs 11.7 bn in 2024. However, allocation to immovable property decreased by 3.3% to Kshs 241.0 bn in 2025 from Kshs 249.2 bn in 2024.
Key Take-outs from the table above are;
-
Schemes in Kenya allocated an average of 59.0% of their members’ funds towards government securities and Quoted Equities between the period of 2016 and end of 2025. The 44.4% average allocation to government securities is the highest among the asset classes attributable to safety assurances of members’ funds because of low-risk associated with government securities. Notably, allocation towards government decreased by 0.3% points to 52.1% from 52.5% recorded in 2024 attributable to the cumulative 225.0 bps reduction in the Central Bank Rate (CBR) to 9.00% by December 2025 from 11.25% in December 2024, which exerted downward pressure on yields for new debt issues and made them less attractive to investors,
-
The allocation towards quoted equities increased by 2.1% points to 11.1% in 2025, from 9.0% in 2024 on the back of improved performance in the Kenyan equities market as evidenced by 48.9% gain by the NASI index in 2025, driven by price rallies in major blue‑chip stocks, notably Safaricom, East African Breweries (EABL), and leading tier‑one banks such as Equity Group, KCB, and Co‑operative Bank. Favourable macroeconomic conditions, such as stable inflation and a stable shilling, boosted market sentiment, have encouraged schemes to allocate more funds to equities during the period, and,
-
Retirement Benefits Schemes investments in immovable property decreased by 2.5% points to 8.6% in 2025, from 11.1% in 2024 due to liquidity constraints of the real estate sector compared to other asset classes, making schemes favor more liquid investments such as equities and government securities.
The chart below shows the allocation by pension schemes on the three major asset classes over the years:
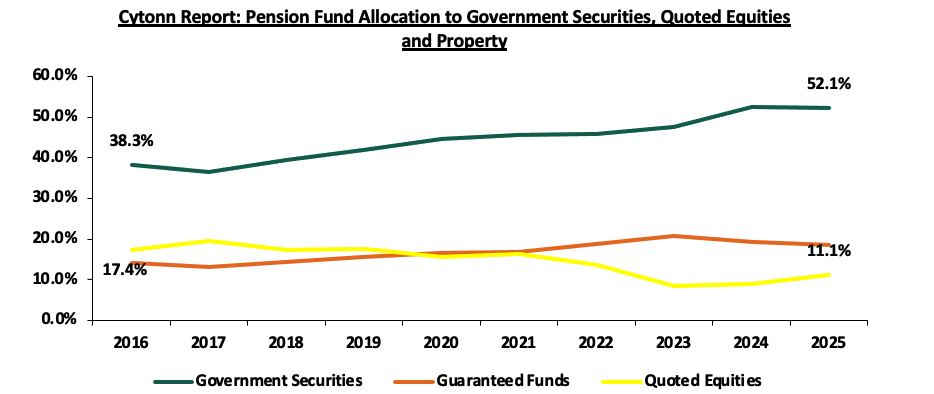
Source: RBA Industry report
The table below shows the AUM in the different asset classes in 2024 and 2025 and the change:
|
Cytonn Report: Kenyan Pension Funds’ Assets AUM (Kshs bn) |
|||
|
Asset Category |
2024 |
2025 |
YoY Change (%) |
|
Government Securities |
1,183.3 |
1,465.6 |
23.9% |
|
Guaranteed Funds |
437.5 |
522.4 |
19.4% |
|
Quoted Equities |
202.3 |
312.8 |
54.6% |
|
Immovable Property |
249.2 |
241.0 |
(3.3%) |
|
Offshore |
64.5 |
85.2 |
32.1% |
|
Fixed Deposits |
53.7 |
56.5 |
5.2% |
|
Cash |
23.1 |
33.2 |
43.6% |
|
Private Equity |
16.2 |
29.9 |
84.8% |
|
Listed Corporate Bonds |
6.3 |
28.3 |
349.0% |
|
REITs* |
11.7 |
14.4 |
22.8% |
|
Commercial Paper, non-listed bonds by private companies* |
3.2 |
12.1 |
276.9% |
|
Unquoted Equities |
4.0 |
8.9 |
122.5% |
|
Others e.g. Unlisted Commercial Papers |
0.2 |
0.5 |
135.0% |
|
TOTAL |
2,255.2 |
2,810.6 |
24.6% |
Source: RBA Industry report
Key Take-outs from the table above are;
-
Government securities remained the highest allocated asset class, recording a 23.9% increase in AUM to Kshs 1,465.6 bn in 2025 from Kshs 1,183.3 bn in 2024. Additionally, quoted equities grew by 54.6% to Kshs 312.8 bn in 2025 from Kshs 202.3 bn in 2024,
-
Commercial paper and non-listed bonds by private companies grew significantly by 276.9% to Kshs 12.1 bn in 2025 from Kshs 3.2 bn in 2024 due to the growth of the Linzi Sukuk Bond value to Kshs 16.9 bn. Notably, investment in other assets increased by 135.0% to Kshs 0.5 bn from Kshs 0.2 bn, attributable to increased demand for specialized investment vehicles with Mansa-X Shariah Compliant Fund and SIB Najah Mansa-X Special Fund growing to Kshs 417.1 mn and Kshs 50.4 mn,
-
Listed corporate bonds increased significantly by 349.0% to Kshs 28.3 bn in 2025 from Kshs 6.3 bn in 2024 attributable to new issuances such as the LINZI 003 Infrastructure Asset‑Backed Security, which accounted for Kshs 18.1 bn in scheme investments at a fixed 15.0% return to fund the Talanta Sports Stadium. Further contributions came from East African Breweries Ltd’s 11.8% medium‑term note with Kshs 196.6 mn invested, and Safaricom’s medium‑term notes with Kshs 209.6 mn and Kshs 68.4 mn invested, expanding exposure to manufacturing and telecommunications.
-
Fixed deposits grew by 5.2% to Kshs 56.5 bn in 2025 from Kshs 53.7 bn in 2024. Additionally, cash increased by 43.6% to Kshs 33.2 bn in 2025 from Kshs 23.1 bn in 2024.
Performance of the Retirement Benefit Schemes
According to the ACTSERV Q4’2025 Pension Schemes Investments Performance Survey, the five-year average return for segregated schemes over the period 2021 to 2025 was 4.4% with the performance fluctuating over the years to a high of 13.2% in Q4’2025. Notably, segregated retirement benefits scheme returns recorded a 2.6% return in Q4’2025, down from the 13.2% gain recorded in Q4’2024. The y/y decline in overall returns was largely driven by the 11.7% points decrease in returns from Fixed Income to 1.6% from a gain of 13.3% in Q4’2024 coupled with the 7.7% points decrease in Equities returns to 8.0% from a gain of 15.7% in Q4’2024. The chart below shows the quarterly performance of segregated pension schemes since 2021:
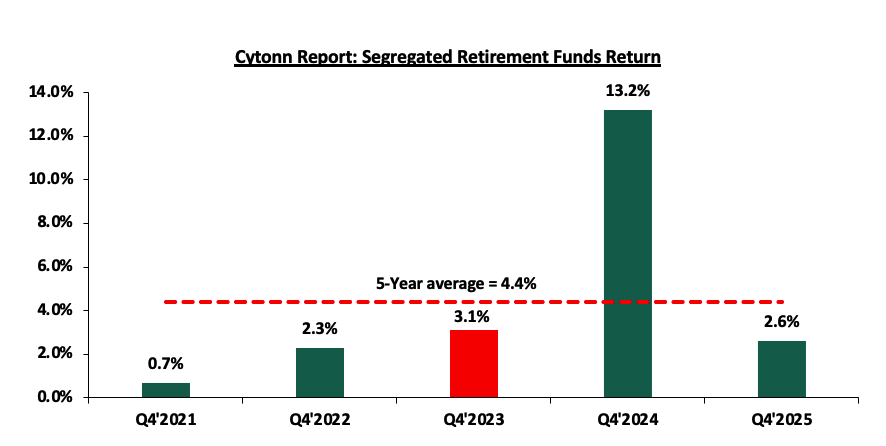
Source: ACTSERV quarterly surveys
The key take-outs from the graph include:
-
Schemes recorded a decrease of 10.6% points to 2.6% in Q4’2025 from the 13.2% gain recorded in Q4’2024. The performance was largely driven by a 1.6% gain in fixed income investments in comparison to the 13.3% gain recorded in Q4’2024, coupled with the 8.0% gain in equities investments in Q4’2025 compared to a gain of 15.7% in Q4’2024. Offshore assets registered increased returns, recording a 1.3% in Q4’2025, from the 0.8% gain recorded in Q4’2024, 0.5% points increase, and,
-
Returns from segregated retirement funds have exhibited significant fluctuations over the last five years, ranging from a high of 13.2% recorded in Q4’2024 to a low of 0.7% in Q4’2021, highlighting the sensitivity of fund performance to market and economic conditions.
The survey covered the performance of asset classes in three broad categories: Fixed Income, Equity, Offshore, and Overall Return. Below is a table showing the fourth quarter performances over the period 2021-2025:
|
Cytonn Report: Quarterly Performance of Asset Classes (2021 – 2025) |
|||||||
|
|
Q4'2021 |
Q4'2022 |
Q4'2023 |
Q4'2024 (a) |
Q4'2025 (b) |
Average (Q4'2021-Q4'2025) |
% points change (b-a) |
|
Fixed Income |
2.2% |
2.9% |
4.0% |
13.3% |
1.6% |
4.8% |
(11.7%) |
|
Equity |
(4.4%) |
(0.1%) |
(3.0%) |
15.7% |
8.0% |
3.2% |
(7.7%) |
|
Offshore |
7.2% |
7.4% |
18.0% |
0.8% |
1.3% |
6.9% |
0.5% |
|
Overall Return |
0.7% |
2.3% |
3.1% |
13.2% |
2.6% |
4.4% |
(10.6%) |
Source: ACTSERV Surveys
Key take-outs from the table above include;
-
Returns from Fixed Income recorded a decline of 11.7% points to 1.6% in Q4’2025 from the 13.3% gain recorded in Q4’2024. The change is mainly due to attributable to lower yields resulting from the easing of monetary policy. Fixed income has continued to offer stable returns with some volatility over the years, achieving its highest return in Q4’2024 and the lowest return in Q4’2025,
-
Notably, returns from Equity investments recorded a decrease by 7.7% points to a 8.0% gain in Q4’2025, from the 15.7% gain recorded in Q4’2024. The performance was partly attributable to attributable to attractive equity valuations, monetary policy easing, stable inflation, and moderating bond yields, which strengthened investor preference for equities over interest‑bearing assets, and,
-
Returns from the Offshore investments, recorded a gain of 0.5% in Q4’2025, to a 1.3% return from the 0.8% recorded in Q4’2024. The performance was partly attributable to majorly on the back gradual monetary policy easing by major central banks, stable inflation, and strong corporate earnings, though the pace of easing remained gradual.
Other Asset Classes that Retirement Benefit Schemes Can Leverage on
a. Alternative Investments (Immovable Property, Private Equity and REITs)
Retirement benefits schemes have for a long time skewed their investments towards traditional assets, mostly, government securities and the equities market, 63.3% as of 31st December 2025, leaving only 36.7% for all the other asset classes. In the asset allocation, alternative investments that include immovable property, private equity as well as Real Estate Investments Trusts (REITs) account for an average of only 10.1% against the total allowable limit of 70.0%. It is vital to note, however, that in 2025 the increase in allocation was recorded in investments in private equity by 84.8% to Kshs 29.9 bn from Kshs 16.2 bn recorded in 2024. Allocation to immovable property decreased by 3.3% to Kshs 241.0 bn in 2025 from Kshs 249.2 bn in 2024, while investments in Real Estate Investments Trusts increased by 22.8% to Kshs 14.4 bn in 2025 from Kshs 11.7 bn in 2024. In terms of overall asset allocation, alternative investments still lagged way behind the other asset classes, as demonstrated in the graph below;
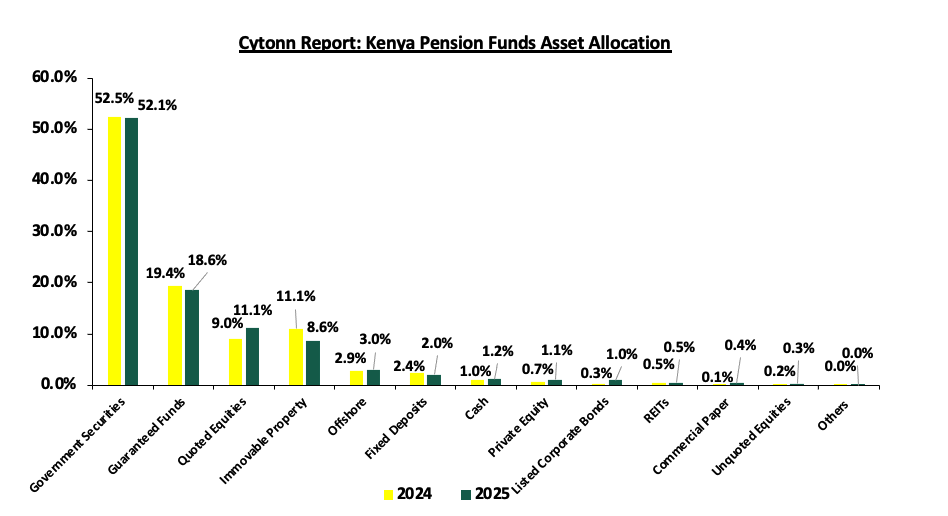
Source: RBA Industry Report
Alternative Investments refers to investments that are supplemental strategies to traditional long-only positions in equities, bonds, and cash. They differ from traditional investments on the basis of complexity, liquidity, and regulations and can invest in immovable property, private equity, and Real Estate Investment Trusts (REITs) to a limit of 70.0% exposure. We believe that there is value in the alternative markets that schemes can take advantage of. Some of the key advantages of alternatives investments include:
-
Diversification: Diversifying across asset classes such as REITs, fixed income, and equities reduces risk by spreading investments across sectors and platforms. REITs, which own physical assets like land and buildings and often secure long leases, are considered dependable. This diversification enables a blended portfolio to pursue higher returns while minimizing the risk of losses, and,
-
Competitive Long-Term Returns: REITs provide robust and long-term yields, by its ability to generate stable cash flows through rental income and capital appreciation. Alternatives can outperform traditional investments like fixed-income. This makes them an ideal component of a successful and efficient portfolio.
-
Inflation hedging – Assets such as real estate often provide returns that move with inflation, protecting members’ savings from erosion of purchasing power. These assets ensure that returns grow alongside the cost of living, protecting members from the risk of diminished real value in their benefits. In essence, inflation-hedging investments help preserve the stability and sustainability of pension portfolios, ensuring retirees maintain their standard of living even in inflationary environments.
-
Public Private Partnerships
According to the Retirement Benefits Authority Investment Regulations and Policies, pension schemes can invest up to 10.0% of their total assets under management in debt instruments for the financing of infrastructure or affordable housing projects approved under the Public Private Partnerships Act. In FY’2024/2025, Kshs 17.7 bn in private capital investments through Public Private Partnerships (PPPs) was mobilized, bringing the cumulative total mobilized since 2013 to Kshs 145.0 bn as of June 2025. Additionally, Kenya's pension schemes are increasingly investing in infrastructure projects to diversify their portfolios, achieve stable long-term returns, and contribute to national development.
A prime example of this opportunity in 2025 is the joint partnership by the National Social Security Fund (NSSF) and China Road and Bridge Corporation (CRBC) to upgrade and dual the Rironi-Nakuru-Mau Summit Road, a 175 km brownfield infrastructure project estimated to cost over Ksh 90.0 bn. NSSF will commit to invest up to Kshs 25.0 n in the project, underscoring its strategic role in supporting long‑term infrastructure development Under the DBFOMT model, NSSF will utilize pension funds to finance the development, aiming to generate long-term returns for contributors while enhancing national transport infrastructure. This initiative reflects a growing trend of leveraging pension assets for strategic investments, though it has sparked public debate over the appropriateness and risk of deploying retirement savings into large-scale infrastructure.
Section III: Factors Influencing the Growth of Retirement Benefit Schemes
The retirement benefit scheme industry in Kenya has registered significant growth in the past 10 years with assets under management growing at a CAGR of 11.9% to Kshs 2.8 tn in 2025, from Kshs 0.9 tn in 2016. Notably, the AUM increased by 24.6% to Kshs 2.8 tn in 2025 from the Kshs 2.3 tn recorded in 2024. The growth is attributable to:
-
Legislation - The National Assembly, on 26th December 2024, assented to the Tax Laws (Amendment) Bill 2024. The Bill amended the Income Tax Act by increasing the deductible amount for contributions to registered pension, provident, and individual retirement funds or public pension schemes to Kshs 360,000 annually from Kshs 240,000 and introduced provisions that allow contributions to post-retirement medical funds up to Kshs 15,000 per month to be tax-deductible. Additionally, income from registered retirement benefits schemes is now tax-exempt for individuals who have reached the retirement age set by their scheme, those withdrawing benefits early due to ill health, or those exiting a registered scheme after at least 20 years of membership. These changes aim to adjust for inflation and modernize deductions that have remained unchanged for over a decade. The revisions are expected to reduce individual taxable income and enhance retirement benefits. In addition, the implementation of the National Social Security Fund Act, 2013 is entering its third year and is expected to foster the growth of the pension industry by allowing both the employees in the formal and informal sector to save towards their retirement. The upward revision of the NSSF Tier 1 and Tier 2 contribution limits effective from February 2026, to Kshs 9,000 and 108,000 respectively from Kshs 8,000 and Kshs 72,000 respectively is expected to enhance retirement savings, improving pension adequacy for retirees,
-
Public-Private partnerships - Public-private partnerships can be instrumental in expanding financial inclusion in the Kenyan pension sector. Collaborations between the government and private financial institutions can lead to the development and promotion of inclusive pension products. In Kenya, the National Social Security Fund (NSSF) is currently licensing and partnering with the private sector (Pension Fund Managers) to invest and manage NSSF Tier II contributions. This is a good example that the government is giving employees, employers, and persons in the informal sector to invest and save for their retirement in the private sector,
-
Increased Pension Awareness – More people are becoming increasingly aware of the importance of pension schemes and as such, they are joining schemes to grow their retirement pot which they will use during their golden years. Over the last 20 years, pension coverage has grown from 12.0% to about 26.0% of the labour force. The Retirement Benefits Authority, through their Strategic Plan 2024-2029, aims to further expand this coverage to 34.0% by 2029. This growth reflects industry-wide initiatives to increase awareness among Kenyan citizens on the need for retirement planning and innovations,
-
Tax Incentives - Members of Retirement Benefit Schemes are entitled to a maximum tax-free contribution of of Kshs 30,000 monthly, equivalent to Kshs 360,000 annually. Consequently, pension scheme members enjoy a reduction in their taxable income and pay less taxes. This incentive has motivated more people to not only register but also increase their regular contributions to pension schemes,
-
Micro-pension schemes - Micro-pension schemes are tailored to address the needs of Kenyans in the informal sector with irregular earnings. These schemes allow people to make small, flexible contributions towards their retirement. By accommodating their financial realities, micro-pensions can attract a broader segment of the population into the pension sector. Examples of these pension schemes are Mbao Pension Plan and Individual Pension Schemes where one can start saving voluntarily and any amount towards their retirement,
-
Relevant Product Development – Pension schemes are not only targeting people in formal employment but also those in informal employment through individual pension schemes, with the main aim of improving pension coverage in Kenya. To achieve this, most Individual schemes have come up with flexible plans that fit various individuals in terms of affordability and convenience. Additionally, the National Social Security Fund Act, 2013 contains a provision for self-employed members to register as members of the fund, with the minimum aggregate contribution in a year being Kshs 4,800 with the flexibility of making the contribution by paying directly to their designated offices or through mobile money or any other electronics transfers specified by the board,
-
Technological Advancement – The adoption of technology into pension schemes has improved the efficiency and management of pension schemes. A notable example of pension technology in Kenya is the M-Akiba platform. This is a mobile-based platform that was developed by the government to enable Kenyans to save for their retirement using their mobile phones. Additionally, the improvement of mobile penetration rate and internet connectivity has enabled members to make contributions and track their benefits from the convenience of their mobile phones, and,
-
Financial literacy programs - Financial literacy programs play a vital role in promoting the growth of retirement benefit schemes by enhancing financial inclusion among the public. Educating the public about the benefits of retirement savings and how to navigate pension schemes can empower individuals to take control of their financial future. The Retirement Benefits Authority (RBA) is at the forefront of ensuring the public is educated on financial literacy by organizing free training.
Section IV: Challenges that Have Hindered the Growth of Retirement Benefit Schemes
Despite the expansion of the Retirement Benefit industry, several challenges continue to hinder its growth. Key factors include:
-
Market Volatility – In segregated schemes, investment returns are not guaranteed and are subject to market fluctuations. A large portion of pension assets in Kenya are invested in fixed income instruments, particularly government securities. While these are traditionally considered stable, they are not immune to market fluctuations. For instance, in segregated schemes, investment returns are not guaranteed and are subject to market fluctuations. In Q4’2025, the returns in the fixed income market recorded gains of 1.6%, following a 13.3% gain in Q4’2024. This level of volatility introduces uncertainty in the growth of retirement savings. When interest rates fall, bond yields may fall but equity returns rise, affecting overall portfolio performance. Such volatility creates uncertainty in retirement savings growth,
-
Inadequate Contributions - Even when individuals are covered by retirement schemes, their contributions are often inadequate to meet future financial needs due to factors such as low disposable income, delayed enrolment in schemes and inadequate contribution rates. Insufficient contributions translate directly into lower payouts upon retirement. For retirees, this can result in financial insecurity, dependence on family or government assistance and inability to meet basic living expenses. Low contributions may be insufficient to sustain post-retirement life,
-
Premature Access to Savings – Members of individual pension schemes can withdraw 100.0% of their contributions, excluding any transferred employer contributions. In umbrella and occupational schemes, members can access up to 50.0% of their benefits before reaching retirement age, often due to job loss or changing employers. The RBA proposed a two-pot pension system where members can access a part of their pension savings during financial hardships such as education, housing and medical bills. While this provides short-term relief, it reduces the value of retirement savings, limiting the sector's growth potential,
-
Low Pension Coverage in the Informal Sector – The informal sector is a significant part of Kenya's economy but is marked by irregular incomes and job insecurity. Kenya’s informal sector employs over 83.0% of the workforce, yet most workers in this segment lack access to structured retirement savings plans. Unlike formal employees who are automatically enrolled in schemes like NSSF, informal workers often operate outside regulatory frameworks. The Retirement Benefit Statistical Digest 2024 reports that only 151.5 mn individuals are registered in individual pension schemes. This number is low compared to the 16.7 mn people in the informal sector, representing 83.4% of the total workforce. Many in this sector prioritize immediate financial needs over long-term savings, and traditional pension products may not meet their financial realities,
-
Unremitted Contributions – Some employers face financial constraints and fail to remit pension contributions to umbrella and occupational schemes. According to the NSSF 2025 Annual Report, as of 30th June 2025, total unremitted contributions had reached Kshs 2.0 bn. A notable example is the Standard Chartered Bank Kenya case, where 629 former employees successfully challenged the undervaluation of their pension benefits following the conversion of the scheme from a defined benefit to a defined contribution plan. The Supreme Court upheld the Retirement Benefits Appeals Tribunal ruling, compelling the bank to pay Kshs 7.2 bn in arrears. This case illustrates how both unremitted and undervalued contributions can expose employees to significant losses, while also highlighting the need for stricter compliance and oversight in the pension industry.
-
Delayed Benefit Payments – The process of paying retirement benefits involves multiple steps, from determining accrued benefits to obtaining approvals from pension scheme trustees and employers. Delays are common as files move between service providers, creating frustration for retirees. These delays can discourage potential members from joining retirement schemes. According to the Pensioner Survey 2024, delay in payments of benefits is a major challenge to retirees,
-
Low Allocation into Alternative Investments and Private Equity – There is limited allocation to alternative investments and private equity, despite their alignment with the long-term nature of retirement savings. These asset classes such as infrastructure, venture capital, and unlisted real estate offer the potential for higher returns, inflation hedging, and broader economic impact. However, pension schemes continue to favor traditional investments like fixed income and listed equities, largely due to regulatory conservatism, limited expertise in private markets, and perceived risk. This cautious approach restricts portfolio diversification and underutilizes the opportunity to channel pension capital into transformative sectors that could stimulate national development while enhancing member returns over time. Addressing this gap requires capacity building, regulatory support, and strategic partnerships to unlock the full potential of pension funds in alternative asset spaces. and,
-
Low Financial Literacy and Awareness - A significant portion of Kenyans lack basic understanding of how pension schemes work, why they matter, and how to plan for retirement. According to RBA surveys, many contributors are unaware of their scheme’s investment strategy or the expected benefits upon retirement. This knowledge gap leads to poor decision-making, such as early withdrawals or failure to contribute consistently. For example, a young worker may opt out of a pension scheme believing it’s unnecessary, only to face financial insecurity later in life.
Section V: Recommendations to Enhance the Growth and Penetration of Retirement Benefit Schemes in Kenya
-
Increase Public Education and Awareness – To enhance the growth and inclusivity of retirement benefit schemes in Kenya, especially among informal sector workers, a multifaceted approach is essential. One of the most pressing challenges is the widespread lack of financial literacy and awareness about pension schemes. Many Kenyans, particularly those in informal employment, do not understand the importance of long-term savings or how pension systems operate. According to the RBA Pensioners Survey 2024, 65.0% of retirees expressed dissatisfaction with their retirement income, largely due to unrealistic expectations and poor planning. To address this, the government and stakeholders should invest in nationwide financial education campaigns tailored to different demographics. These initiatives can be delivered through radio, mobile platforms, and community outreach programs, leveraging trusted institutions such as SACCOs, religious organizations, and local leaders to build credibility and drive participation.
-
Improve Regulatory Framework to Address Unremitted Contributions – The Retirement Benefits Authority (RBA) should enhance its oversight of employers to ensure pension contributions are fully and promptly remitted. Non-compliant employers should be subject to stricter penalties, such as fines or legal action, to encourage timely payments. However, for businesses experiencing short-term financial difficulties, RBA could provide options for structured payment plans or deadline extensions, helping them meet their obligations without defaulting. Additionally, RBA could involve Kenya Revenue Authority (KRA) to collect unremitted pension contributions and remit to RBA. KRA shall issue agency notices requiring holders of unremitted pension contributions to pay up within a specified date or notify KRA of their inability to pay due to lack of funds within 14 days of the receipt of the notice. Additionally, RBA should automate remittance tracking through systems like the Pensions Management Information System (PMIS), and publicly disclose defaulter lists to enhance transparency and accountability. An example of steps being taken to tackle the challenge of unremitted payments is the call for a comprehensive overhaul of Kenya’s pensions system by the Commission on Administrative Justice (Office of the Ombudsman) in February 2025. The initiative sought to address inordinate delays, unresponsiveness, and the manifest injustices affecting the public service pensions system, with the aim of restoring fairness, dignity, and public confidence.
-
Introduce Policy Reforms to Limit Premature Withdrawals – To safeguard long-term retirement savings, the percentage of pension funds accessible before retirement should be further reduced. Withdrawals should only be permitted in cases of genuine emergencies, such as critical illness, and must be supported by clear documentation and justification. Additionally, retirement schemes should provide educational workshops and materials to raise awareness about the long-term benefits of sustained savings and the financial risks associated with early withdrawals. Incentives such as loyalty bonuses, employer matching contributions, and enhanced tax relief for retained benefits can further motivate individuals to maintain their savings over the long term.
-
Adoption of Flexible Contribution Models in the Informal Sector – Traditional monthly contribution structures are often impractical for individuals whose earnings fluctuate daily or seasonally. Pension products should therefore allow for micro-contributions, daily, weekly, or even seasonal payments, through accessible platforms like mobile money. Schemes such as the Mbao Pension Plan have demonstrated the viability of this approach, enabling contributors to save as little as Kshs 20.0 per day. However, broader awareness and integration with other financial services are needed to scale these models.
-
Promote Employees and Employer Participation in Pension Schemes – The Retirement Benefits Authority (RBA) should introduce incentives to encourage higher pension savings. This could include enhanced tax benefits for individuals and employers who contribute more to their pension schemes or a matching contribution system for voluntary savings. Such measures would motivate employees and employers to save beyond the mandatory contributions, ultimately improving retirement security and financial well-being.
-
Streamline the Benefit Payment Process – The approval and disbursement of retirement benefits should be streamlined to minimize delays. Implementing automation for key processes and establishing clear timelines for each stage would ensure that retirees receive their benefits promptly. This efficiency would enhance trust in pension schemes and encourage greater participation, ultimately strengthening the retirement savings culture.
-
Increase Allocation to Alternative Investments – alternative investments such as real estate, infrastructure and private equity then to have long-term investment horizons, usually in decades, and more stable and higher returns hence more suited to pension funds. However, allocation to these assets class is very low. It would help with returns and stability if retirement schemes increased their allocation to these asset classes.
-
Incorporating Post-Retirement Medical Funds (PRMFs) into pension schemes – Incorporating Post-Retirement Medical Funds into pension schemes is a crucial step toward ensuring retirees can access quality healthcare without financial strain. The RBA Pensioners Survey 2024 revealed that 29.0% of retirees lack any form of medical insurance, while 77.0% of those with coverage still incur out-of-pocket expenses. Only 16.0% of the covered retirees are able to meet their medical costs through their insurance schemes or PRMFs. With most private insurers unwilling to cover individuals over 65, retirees are left vulnerable. PRMFs should be made a mandatory component of all pension schemes, with flexible contribution options and separate asset management to ensure transparency. Tax incentives for PRMF contributions and employer matching can further encourage uptake, with contributions deductible up to Kshs 15,000 per month. Contributions to PRMFs increased by 32.2% to Kshs 157.1 bn in 2025 from Kshs 118.8 in 2024. Kenya Power Pension Fund’s PRMF model, which allows members to save for healthcare during employment and access funds post-retirement, serves as a strong example of best practice.
Implementing these recommendations will be instrumental in fostering the sustainable expansion of Kenya’s retirement benefits sector. By addressing the underlying structural challenges that have long hindered progress, the industry can move toward a more inclusive and resilient future. This transformation will help build public confidence in pension systems, encouraging broader participation across both formal and informal employment segments.
Disclaimer: The views expressed in this publication are those of the writers where particulars are not warranted. This publication, which follows Section 2 of the Capital Markets Authority Act Cap 485A, is meant for general information only and is not a warranty, representation, advice or solicitation of any nature. Readers are advised in all circumstances to seek the advice of a registered investment advisor

- Talk to us
- Kenya
- P.O Box 20695 - 00200, Nairobi, Kenya
- Cell +254709101200
- Tel +254709101200
- WhatsApp +254741676635
- United States
- +254709101200
- DOWNLOAD OUR APP
-


- Kenya
- 8th Floor, Pinetree Plaza, Kaburu Drive, Ngong Road, Nairobi, Kenya
- USA
- Suite 1150, 1775 Eye Street NW, USA, Washington DC 20006, USA
- Investments
- High Yield
- Private Equity
- Real Estate
- Real Estate
- RiverRun Estates
- Cytonn Towers
- The Ridge
- Taraji Heights
- The Alma