
Retirement Benefits Schemes Q2’2026 Performance Report, & Cytonn Weekly #34.2026
By Research Team, Aug 30, 2026
Executive Summary
Fixed Income
During the week T-bills were oversubscribed for the fourth consecutive week, with the overall subscription rate coming in at 202.6% lower than the subscription rate of 255.9%, recorded the previous week. Investors’ preference for the shorter 91-day paper persisted, with the paper receiving bids worth Kshs 23.7 bn against the offered Kshs 8.0 bn, translating to a subscription rate of 296.2%, lower than the subscription rate of 470.9%, recorded the previous week. The subscription rate for the 182-day paper increased to 268.8% from 185.7% recorded the previous week, while that of the 364-day paper decreased significantly to 61.6% from 154.1%% recorded the previous week. The government accepted a total of Kshs 44.3 bn worth of bids out of Kshs 56.7 bn bids received, translating to an acceptance rate of 78.1%. The yields on the government papers were on a downward trajectory with the yields on the 182-day paper decreasing the most by 0.8 bps to 8.94% from 8.95% recorded the previous week. The yields on the 364-day paper decreased by 0.3 bps to 9.03% from 9.04% recorded the previous week. Moreover, the yields on the 91-day paper decreased marginally by 0.1 bps to remain unchanged at 8.77% recorded the previous week;
During the week, the Central Bank of Kenya released the auction results for the switch of treasury bonds from T-Bill 2685/091, 2646/182, 2574/364 all with 12 days remaining to maturity and FXD1/2012/015, with a tenor to maturity of 1.0 year and a coupon rate of 11.0% to FXD4/2019/010, a with a tenor to maturity of 3.2 years and a fixed coupon rate of 12.3%. The bond was oversubscribed, with the overall subscription rate coming in at 150.6%, receiving bids worth Kshs 22.6 bn against the offered Kshs 15.0 bn. The government accepted bids worth Kshs 22.5 bn, translating to an acceptance rate of 99.7%. The weighted average yield for the accepted bids for the FXD4/2019/010 came in at 11.2%. Notably, the 11.2% on the switch to FXD4/2019/010 was lower than the 12.6% recorded the last time the bond was reopened in December 2021. With the Inflation rate at 6.5% as of July 2026, the real return of the FXD4/2019/010 was 4.7%;
Also, the government announced a prospectus for switch auction worth Kshs 10.0 bn, allowing holders of Treasury bond FXD1/2013/015 to switch their holdings into Treasury bond FXD4/2019/010, as part of its debt liability management strategy. The destination bond, FXD4/2019/010, carries a fixed coupon rate of 12.28% and a remaining tenor to maturity of 3.2 years. The offer period opened on 27th August 2026 and closes on 7th September 2026, with the auction and settlement dates set for 7th and 9th September 2026, respectively. Our recommended bidding range for FXD4/2019/010 is 10.5% -11.5%;
Equities
During the week, the equities market was on an upward trajectory, with NSE 20, NASI, NSE 25 and NSE 10 gaining by 1.8%, 1.5%, 1.1% and 0.8% respectively taking the YTD performance to gains of 37.2%, 36.3%, 35.0% and 32.6% respectively for NSE 20, NSE 10, NSE 25 and NASI respectively. The week-on-week equities market performance was mainly driven by gains recorded by large cap stocks such as DTB-K, Stanbic, and Safaricom of 8.2%, 4.9% and 4.1% respectively. However, the performance was weighed down by losses recorded by large cap stocks such as ABSA, BAT and Standard Chartered Bank Kenya of 2.8%, 0.5% and 0.3% respectively;
During the week, the banking sector index increased by 0.3% to 285.4 from the 284.5 recorded the previous week. This is attributable to gains recorded by large cap stocks such as DTB-K, Stanbic, and Cooperative Bank of 8.2%, 4.9% and 2.5% respectively. However, the performance was weighed down by losses recorded by large cap stocks such as ABSA, Standard Chartered Bank Kenya, and Equity of 2.8%, 0.3% and 0.3% respectively;
During the week I&M Group released their H1’2026 financial results Profit after tax increased by 22.4% to Kshs 10.2 bn in H1’2026;
During the week HFCB Group released their H1’2026 financial results, Profit after tax increased by 59.9% increase in profit after tax to Kshs 1.0 bn in H1’2026;
During the week, Jubilee Holdings Limited released their H1’2026 results. Jubilee’s Profit After Tax (PAT) increased by 12.7% to Kshs 3.4 bn, from Kshs 3.1 bn recorded in H1’2025;
During the week, CIC Group released their H1’2026 results. CIC’s Profit After Tax increased by 70.3% to Kshs 1.1 bn in H1’2026, from Kshs 0.6 bn recorded in H1’2025;
During the week, Britam Holdings released their H1’ 2026 results. Britam’s Profit After Tax (PAT) increased by 53.3% to Kshs 2.7 bn, from Kshs 1.7 bn recorded in H1’2025;
During the week, Kenya Re corporation released their HY’2026 results, recording an 42.8% increase in Profit After Tax to Kshs 2.3 bn, from the Kshs 1.6 bn recorded in H1’2025;
Real Estate
During the week, Knight Frank, an international Real Estate consultancy and management firm, released the Kenya Market Update H1'2026 Report highlighting the performance of key Real Estate sectors in the country;
During the week, state-backed mortgage lender, Kenya Mortgage Refinance Company (KMRC) released its HY’2026 financial results, which reported a 35.6% decrease in Profit After Tax (PAT) to Kshs 350.7 mn from Kshs 544.2 mn recorded in HY’2025;
On the Unquoted Securities Platform Acorn D-REIT and I-REIT traded at Kshs 29.7 and Kshs 24.4 per unit, respectively, as per the last updated data on 28th August 2026. The performance represented a 48.5% and 22.0% gain for the D-REIT and I-REIT, respectively, from the Kshs 20.0 inception price. The volumes traded for the D-REIT and I-REIT came in at 0.1 mn and 1.5 mn shares, respectively. Additionally, ILAM Fahari I-REIT traded at Kshs 20.5 per share as of 28th August 2026, representing a 2.7% gain from the Kshs 20.0 inception price;
Digital Payments Weekly Highlights
During the week, Visa announced major cybersecurity updates to its portfolio, releasing the next evolution of its model-agnostic Visa Vulnerability Agentic Harness (VVAH) framework alongside three new specialized cybersecurity advisory services under Visa Consulting & Analytics (VCA);
During the week, Mastercard Incorporated, in collaboration with Qatar National Bank (QNB) Group, processed Syria's first end-to-end international card payment in over 15 years following the U.S. government's removal of Syria from its list of state sponsors of terrorism;
During the week, PayPal Holdings, Inc. saw the termination of a proposed buyout pursuit exceeding USD 50.0 bn from a consortium comprising buyout firm Advent International and payment processor Stripe;
The digital payment companies we track (AXP, Visa, Mastercard, Circle, Block, PayPal, Coinbase, Global Payments and Wise) are currently trading at an average P/E of 25.2x, implying that investors are pricing in strong future earnings growth expectations and are willing to pay a significant premium for current earnings, which may also suggest that valuations may be stretched relative to near-term fundamentals;Bottom of FormBottom of FormBottom of Form
Focus of the Week
According to the Retirement Benefits Authority Industry Brief for June 2026, the Assets Under Management (AUM) increased by 25.1% to Kshs 3.2 tn from Kshs 2.5 tn in June 2025. The performance was attributable to higher contributions from the NSSF Act, 2013’s raised limits and strong investment performance supported by a stable macroeconomic environment. Notably, according to the ACTSERV Q2’2026 Retirement Benefits Schemes Investments Performance Survey, segregated retirement benefits schemes recorded a 3.1% return in Q2’2026, a decrease from the 6.6% return recorded in Q2’2025.
Investment Updates:
-
Weekly Rates: Cytonn Money Market Fund closed the week at a yield of 11.08% p.a. To invest, dial *809# or download the Cytonn App from Google Play store here or from the Appstore here;
-
We continue to offer Wealth Management Training every Tuesday, from 7:00 pm to 8:00 pm. The training aims to grow financial literacy among the general public. To register for any of our Wealth Management Trainings, click here. If interested in our Private Wealth Management Training for your employees or investment group, please get in touch with us through wmt@cytonn.com;
-
Cytonn Asset Managers Limited (CAML) continues to offer pension products to meet the needs of both individual clients who want to save for their retirement during their working years and Institutional clients that want to contribute on behalf of their employees to help them build their retirement pot. To more about our pension schemes, kindly get in touch with us through pensions@cytonn.com;
Hospitality Updates:
-
We currently have promotions for Staycations. Visit cysuites.com/offers for details or email us at sales@cysuites.com;
Money Markets, T-Bills Primary Auction:
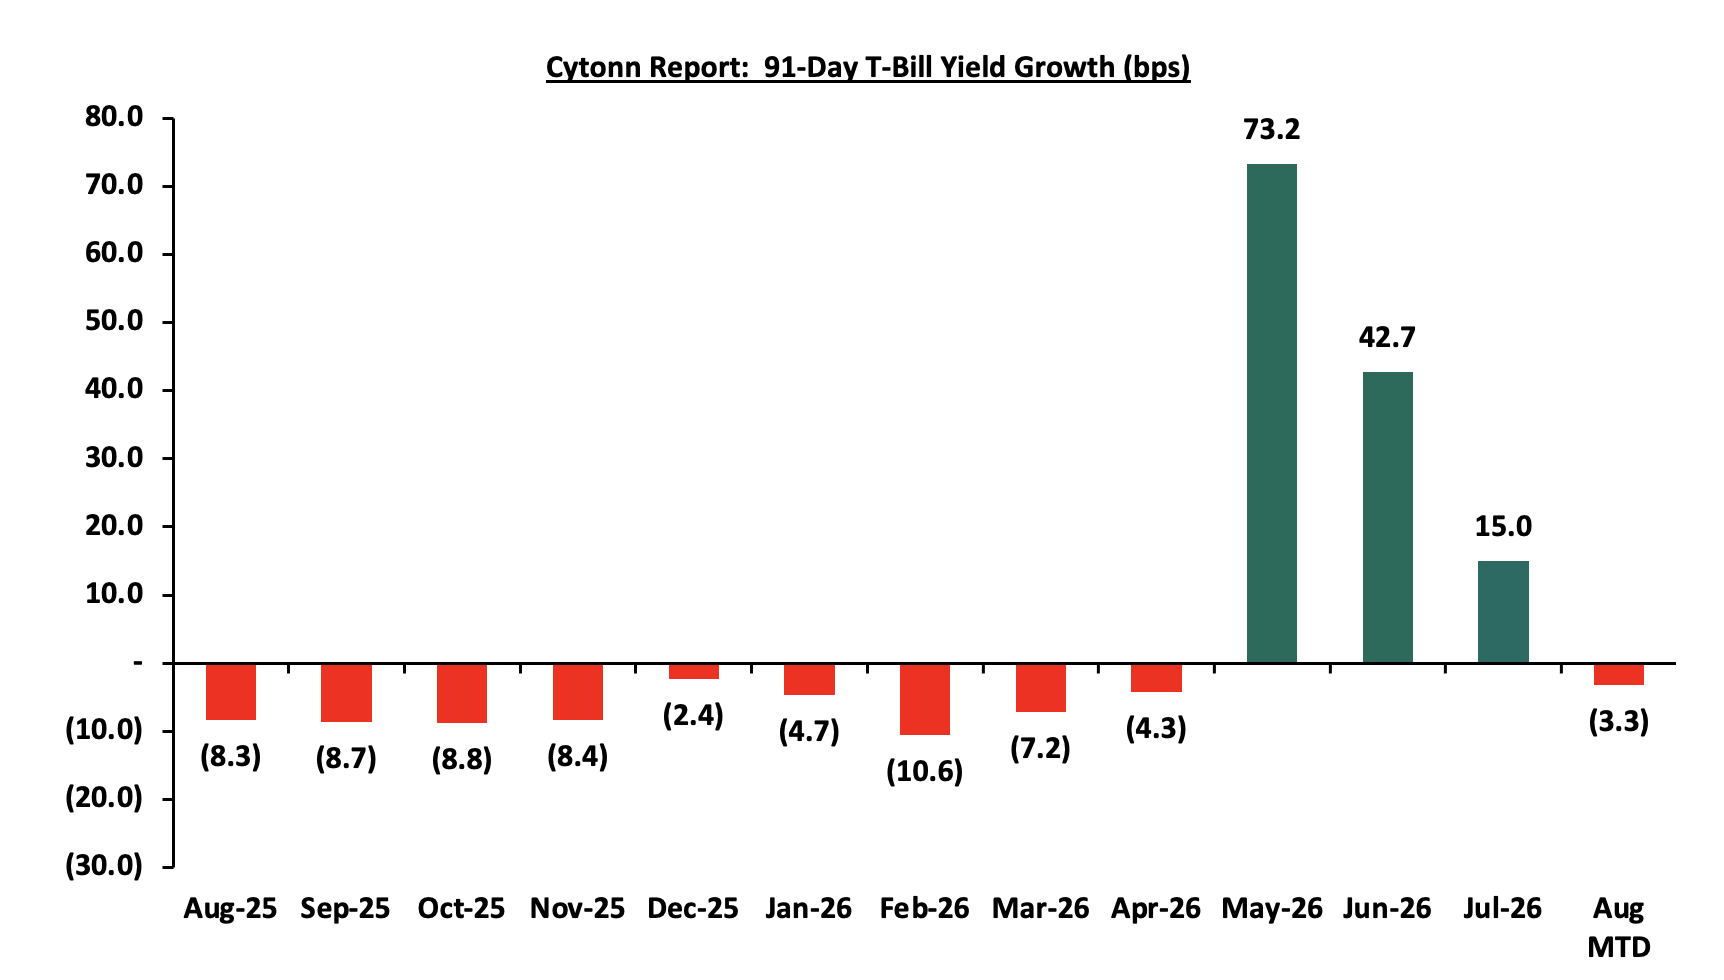
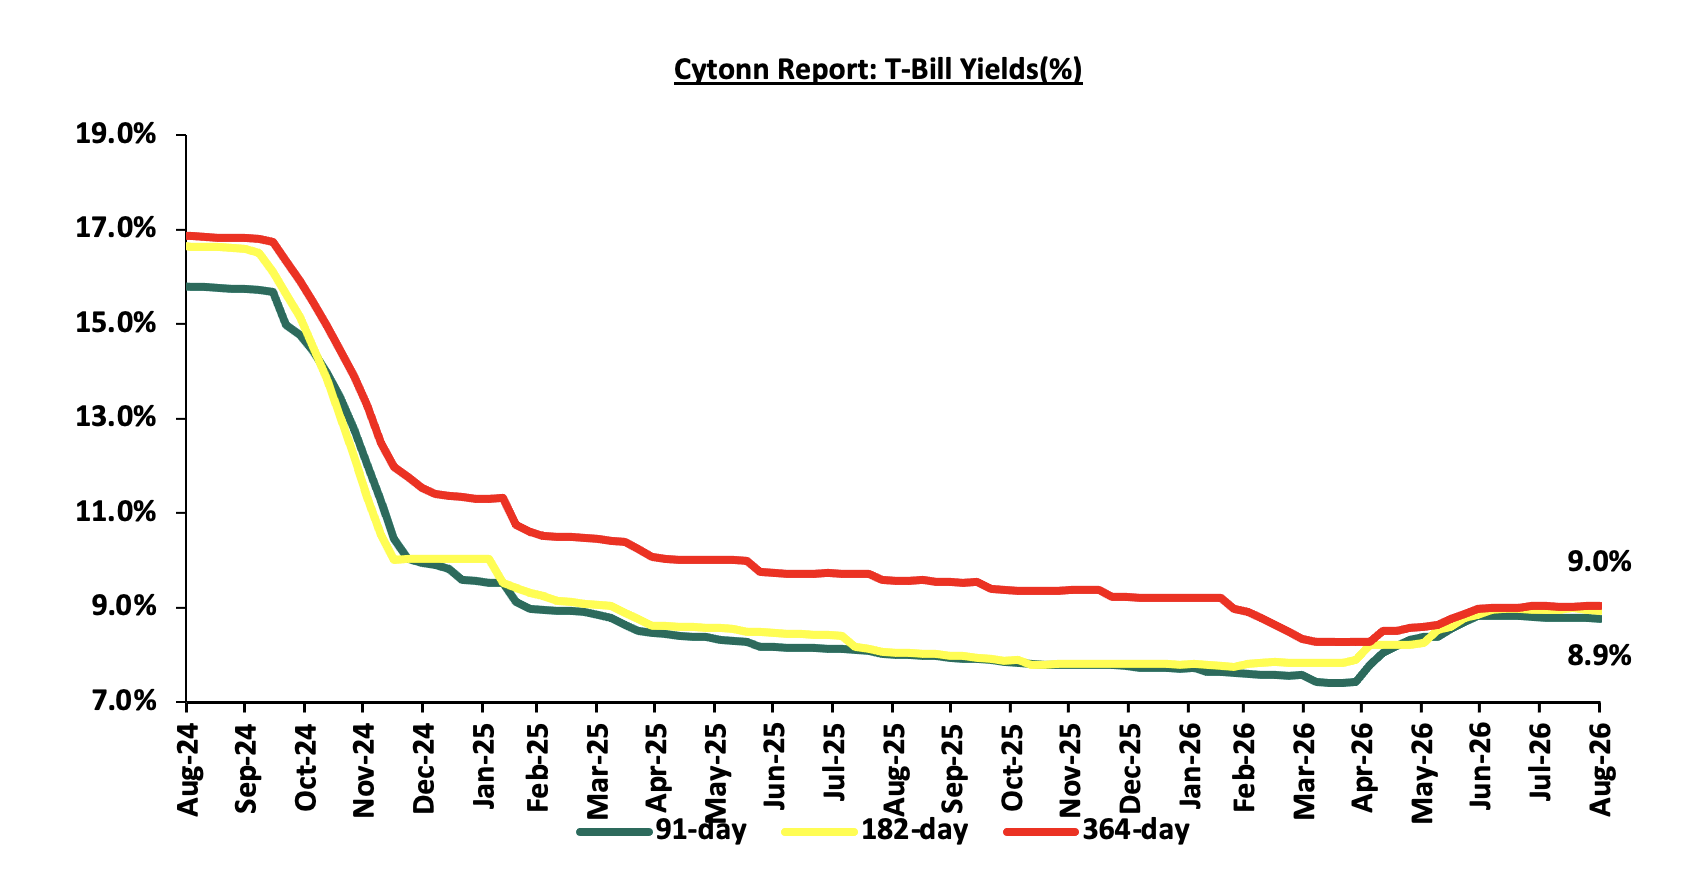
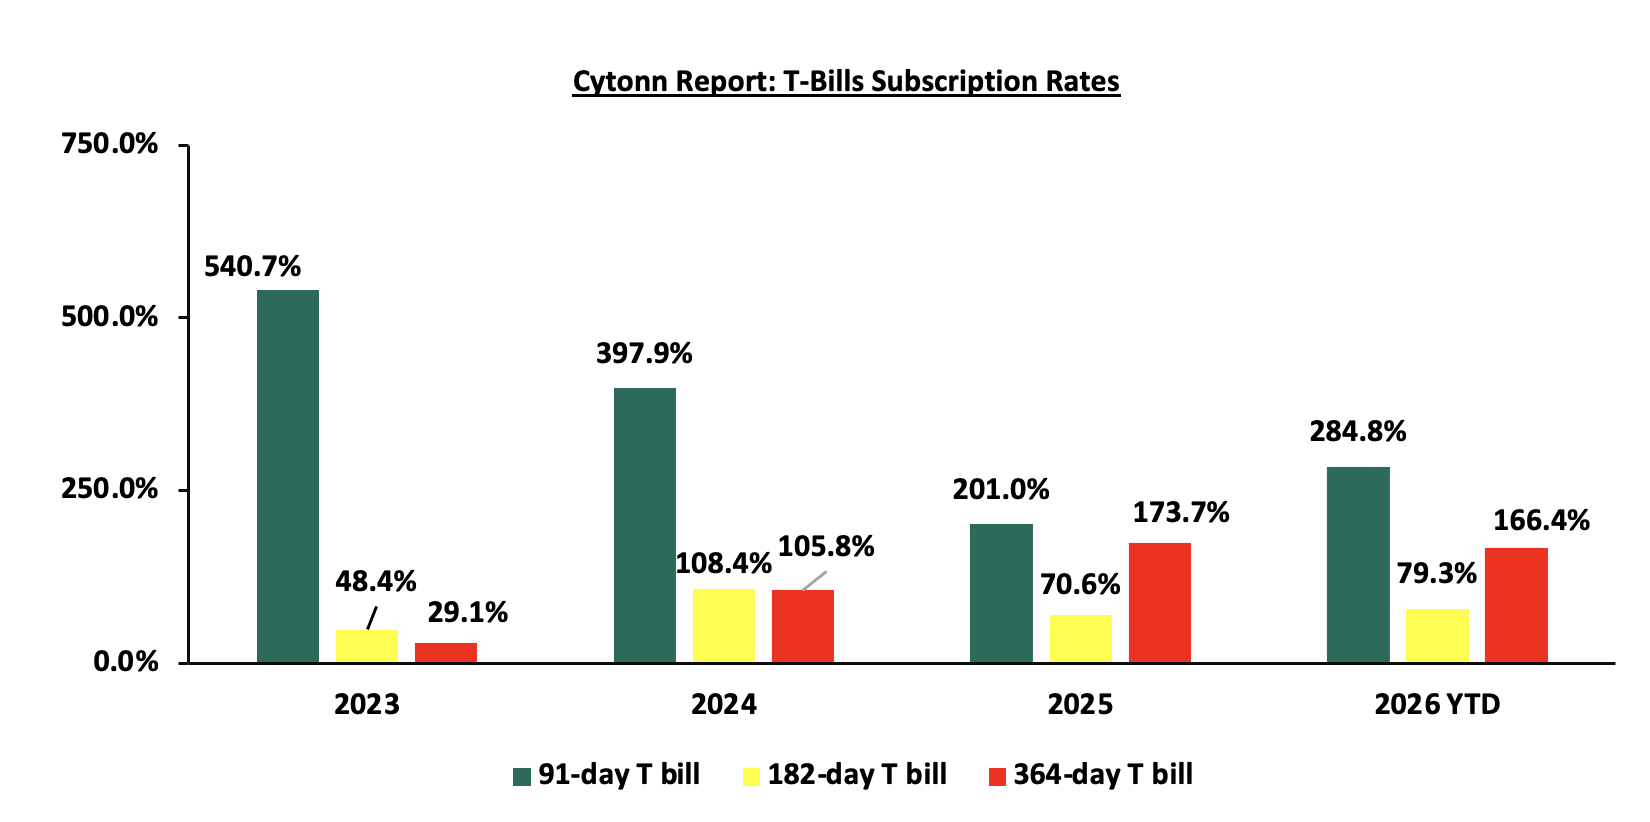
This week, T-bills were oversubscribed for the fourth consecutive week, with the overall subscription rate coming in at 202.6% lower than the subscription rate of 255.9%, recorded the previous week. Investors’ preference for the shorter 91-day paper persisted, with the paper receiving bids worth Kshs 23.7 bn against the offered Kshs 8.0 bn, translating to a subscription rate of 296.2%, lower than the subscription rate of 470.9%, recorded the previous week. The subscription rate for the 182-day paper increased to 268.8% from 185.7% recorded the previous week, while that of the 364-day paper decreased significantly to 61.6% from 154.1%% recorded the previous week. The government accepted a total of Kshs 44.3 bn worth of bids out of Kshs 56.7 bn bids received, translating to an acceptance rate of 78.1%. The yields on the government papers were on a downward trajectory with the yields on the 182-day paper decreasing the most by 0.8 bps to 8.94% from 8.95% recorded the previous week. The yields on the 364-day paper decreased by 0.3 bps to 9.03% from 9.04% recorded the previous week. Moreover, the yields on the 91-day paper decreased marginally by 0.1 bps to remain unchanged at 8.77% recorded the previous week.
The chart below shows the yield growth rate for the 91-day paper from August 2025 to date:
The chart below shows the performance of the 91-day, 182-day and 364-day papers from August 2024 to August 2026:
The chart below compares the overall average T-bill subscription rates obtained in 2023, 2024, 2025 and 2026 Year-to-date (YTD):
T-Bonds Primary Auction:
During the week, the Central Bank of Kenya released the auction results for the switch of treasury bonds from T-Bill 2685/091, 2646/182, 2574/364 all with 12 days remaining to maturity and FXD1/2012/015, with a tenor to maturity of 1.0 and a coupon rate of 11.0% to FXD4/2019/010, a with a tenor to maturity of 3.2 years and a fixed coupon rate of 12.3%. The bond was oversubscribed, with the overall subscription rate coming in at 150.6%, receiving bids worth Kshs 22.6 bn against the offered Kshs 15.0 bn. The government accepted bids worth Kshs 22.5 bn, translating to an acceptance rate of 99.7%. The weighted average yield for the accepted bids for the FXD4/2019/010 came in at 11.2%. Notably, the 11.2% on the switch to FXD4/2019/010 was lower than the 12.6% recorded the last time the bond was reopened in December 2021. With the Inflation rate at 6.5% as of July 2026, the real return of the FXD4/2019/010 was 4.7%.
The government announced a prospectus for switch auction worth Kshs 10.0 bn, allowing holders of Treasury bond FXD1/2013/015 to switch their holdings into Treasury bond FXD4/2019/010, as part of its debt liability management strategy. The destination bond, FXD4/2019/010, carries a fixed coupon rate of 12.28% and a remaining tenor to maturity of 3.2 years. The offer period opened on 27th August 2026 and closes on 7th September 2026, with the auction and settlement dates set for 7th and 9th September 2026, respectively. Our recommended bidding range for FXD4/2019/010 is 10.5% -11.5%.
Money Market Performance:
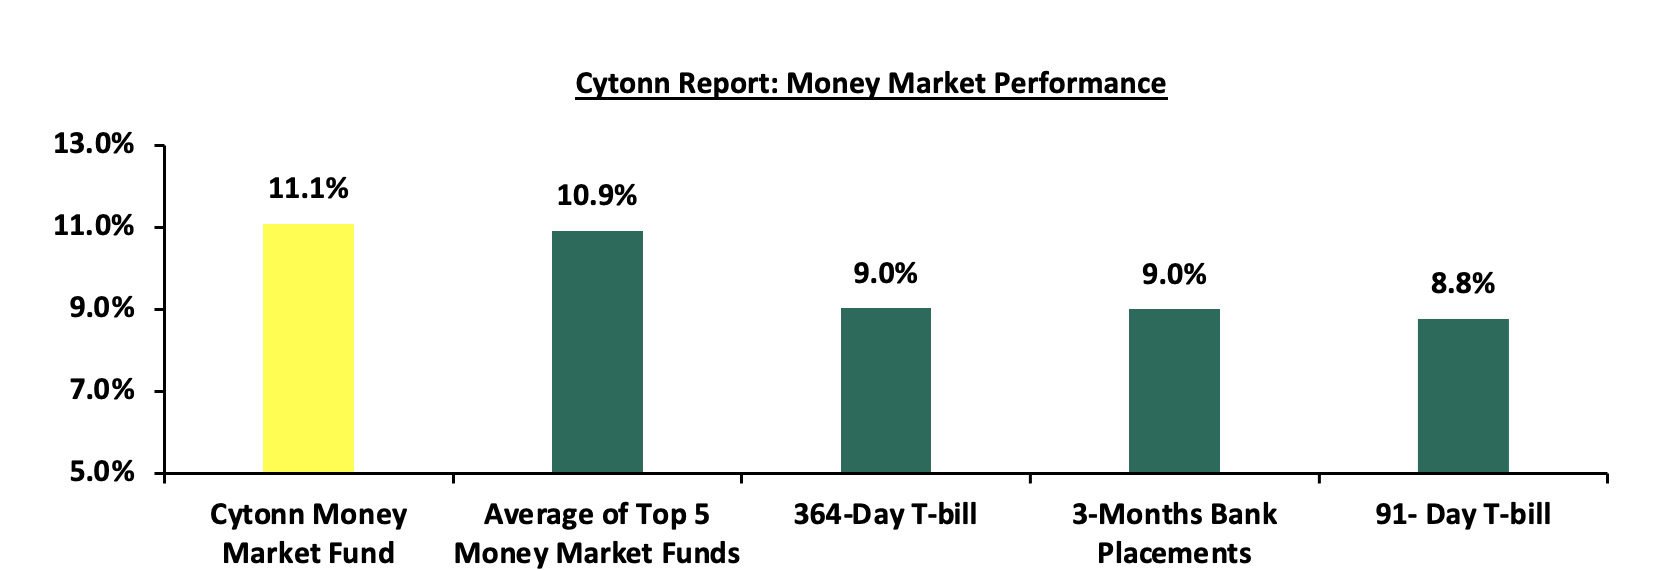
In the money markets, 3-month bank placements ended the week at 9.0% (based on rates offered by various banks). The yields on the government papers were on a downward trajectory with the yields on the 364-day paper decreasing by 0.3 bps to 9.03% from 9.04% recorded the previous week. Moreover, the yields on the 91-day paper decreased marginally by 0.1 bps to remain unchanged at 8.77% recorded the previous week. The yield on the Cytonn Money Market Fund remain unchanged at 11.08% recorded the previous week, while the average yields on Top 5 Money Market Funds increased by 3.8 bps to remain relatively unchanged from the 10.9% recorded the previous week.
The table below shows the Money Market Fund Yields for Kenyan Fund Managers as published on 28th August 2026:
|
Money Market Fund Yield for Fund Managers as published on 28th August 2026 |
||
|
Rank |
Fund Manager |
Effective Annual Rate |
|
1 |
Nabo Africa Money Market Fund |
11.2% |
|
2 |
Cytonn Money Market Fund (Dial *809# or download Cytonn App) |
11.1% |
|
3 |
Faulu Money Market Fund |
11.0% |
|
4 |
Lofty-Corban Money Market Fund |
10.7% |
|
5 |
Kuza Money Market fund |
10.6% |
|
6 |
Enwealth Money Market Fund |
10.6% |
|
7 |
Madison Money Market Fund |
10.6% |
|
8 |
Etica Money Market Fund |
10.5% |
|
9 |
Ndovu Money Market Fund |
10.5% |
|
10 |
Globetec Money Market Fund |
10.4% |
|
11 |
Old Mutual Money Market Fund |
10.3% |
|
12 |
Rejesha Money Market Fund |
10.3% |
|
13 |
Jubilee Money Market Fund |
10.3% |
|
14 |
Orient Kasha Money Market Fund |
10.2% |
|
15 |
Gulfcap Money Market Fund |
10.1% |
|
16 |
Arvocap Money Market Fund |
10.1% |
|
17 |
British-American Money Market Fund |
9.8% |
|
18 |
SanlamAllianz Money Market Fund |
9.7% |
|
19 |
GenAfrica Money Market Fund |
9.7% |
|
20 |
Apollo Money Market Fund |
9.2% |
|
21 |
CPF Money Market Fund |
9.2% |
|
22 |
Dry Associates Money Market Fund |
9.0% |
|
23 |
Genghis Money Market Fund |
8.9% |
|
24 |
CIC Money Market Fund |
8.4% |
|
25 |
KCB Money Market Fund |
8.2% |
|
26 |
Mayfair Money Market Fund |
8.1% |
|
27 |
AA Kenya Shillings Fund |
8.1% |
|
28 |
Mali Money Market Fund |
8.0% |
|
29 |
Co-op Money Market Fund |
7.9% |
|
30 |
ICEA Lion Money Market Fund |
7.7% |
|
31 |
Absa Shilling Money Market Fund |
7.3% |
|
32 |
Ziidi Money Market Fund |
5.9% |
|
33 |
Equity Money Market Fund |
5.4% |
|
34 |
Stanbic Money Market Fund |
|
Source: Business Daily
Liquidity:
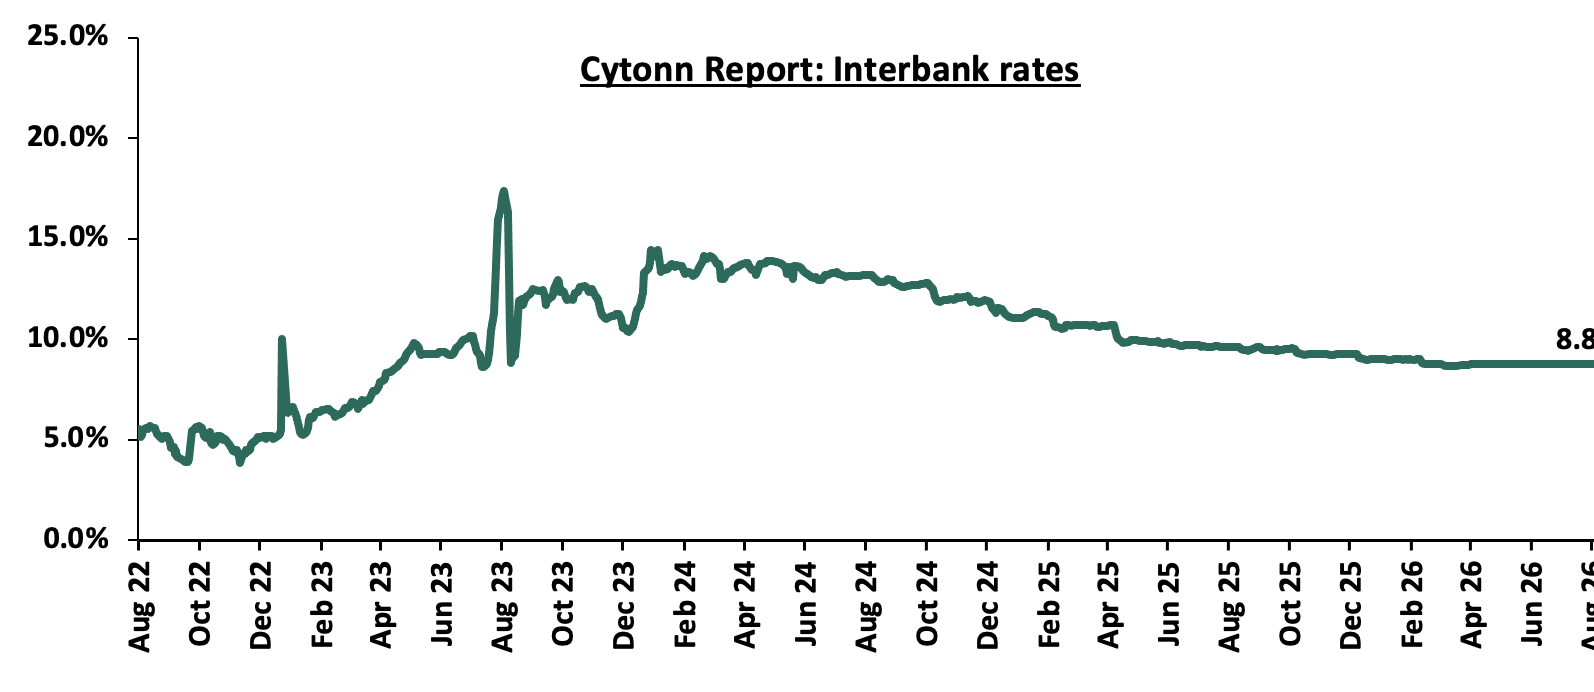
During the week, liquidity in the money markets eased with the average interbank rate decreasing marginally by 0.01 bps relatively unchanged at 8.8% recorded last week, partly attributable to tax remittances that offset government payments. The average interbank volumes traded increased by 8.5% to Kshs 19.2 bn from Kshs 17.6 bn recorded the previous week. The chart below shows the interbank rates in the market over the years:
Kenya Eurobonds:
During the week, the yields on the Eurobonds were on a downward trajectory with the yield on the 10-year Eurobond issued in 2018, decreasing the most by 20.3 bps to 6.4% from 6.6% recorded the previous week. The table below shows the summary performance of the Kenyan Eurobonds as of 27th August 2026:
|
Cytonn Report: Kenya Eurobonds Performance |
|||||
|
|
2018 |
2019 |
2021 |
2024 |
|
|
Date |
10-year issue |
30-year issue |
12-year issue |
13-year issue |
7-year issue |
|
2-Jan-26 |
6.1% |
8.8% |
7.2% |
7.8% |
7.1% |
|
13-Aug-26 |
6.6% |
8.9% |
7.5% |
8.0% |
7.3% |
|
20-Aug-26 |
6.6% |
9.0% |
7.6% |
8.1% |
7.4% |
|
21-Aug-26 |
6.6% |
9.0% |
7.6% |
8.1% |
7.4% |
|
24-Aug-26 |
6.6% |
9.0% |
7.6% |
8.1% |
7.4% |
|
25-Aug-26 |
6.5% |
9.0% |
7.5% |
8.0% |
7.3% |
|
26-Aug-26 |
6.4% |
8.9% |
7.4% |
8.0% |
7.2% |
|
27-Aug-26 |
6.4% |
8.9% |
7.4% |
8.0% |
7.2% |
|
Weekly Change |
(0.2%) |
(0.1%) |
(0.2%) |
(0.1%) |
(0.2%) |
|
MTD Change |
(0.2%) |
0.1% |
(0.1%) |
0.0% |
(0.1%) |
|
YTD Change |
0.3% |
0.1% |
0.2% |
0.2% |
0.1% |
Source: Central Bank of Kenya (CBK) and National Treasury
Kenya Shilling:
During the week, the Kenya Shilling depreciated against the US Dollar by 0.8 bps to remain relatively unchanged from the Kshs 129.5 recorded the previous week. On a year-to-date basis, the shilling has depreciated by 0.3 bps against the dollar, as compared to the 22.9 bps appreciation recorded in 2025.
We expect the shilling to be supported by:
-
Diaspora remittances standing at a cumulative USD 4,986.9 mn in the twelve months to July 2026, slightly lower than the USD 5,079.9 mn recorded over the same period in 2025. These have continued to cushion the shilling against further depreciation. In the July 2026 diaspora remittances figures, North America remained the largest source of remittances to Kenya accounting for 51.6% in the period,
-
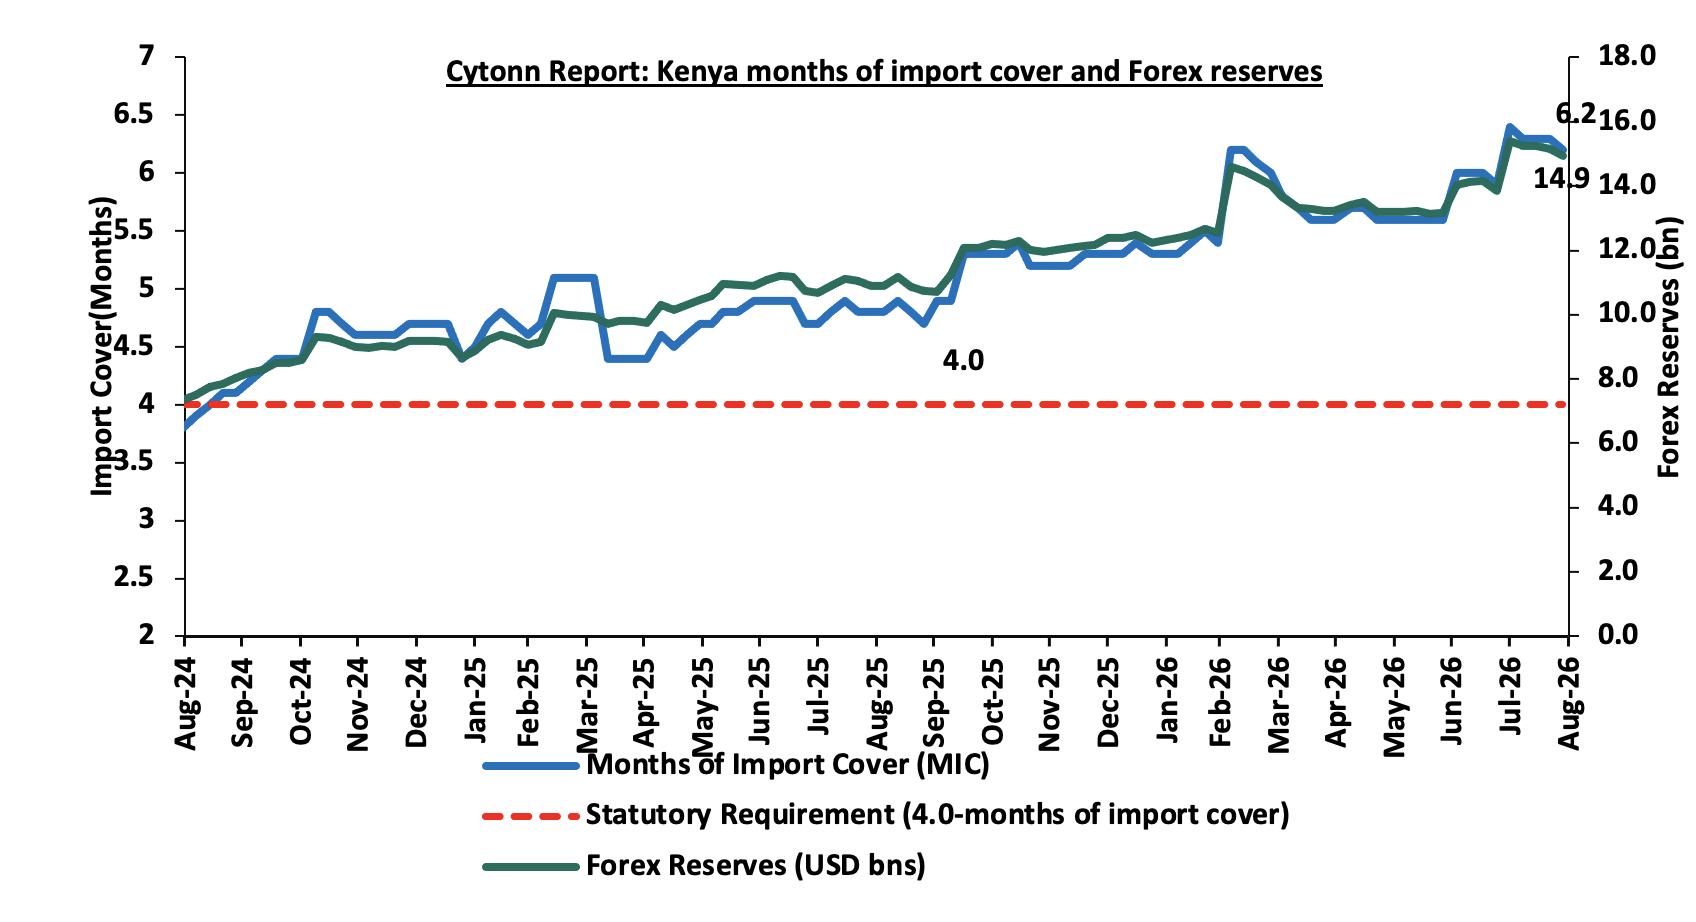
Improved forex reserves currently at USD 15.2 bn (equivalent to 6.3-months of import cover), which is above the statutory requirement of maintaining at least 4.0-months of import cover and above the EAC region’s convergence criteria of 4.5-months of import cover.
The shilling is however expected to remain under pressure in 2026 as a result of:
-
An ever-present current account deficit which widened to 3.0% of GDP in the 12 months to June 2026 compared to 1.9% of GDP in a similar period in 2025 and,
-
The need for government debt servicing, continues to put pressure on forex reserves given that 54.8% of Kenya’s external debt is US Dollar-denominated as of June 2026.
-
Rising geopolitical tensions in the Middle East, which could exert pressure on the shilling through higher global oil prices and increased uncertainty in international markets. Given that Kenya is a net importer of petroleum products, any sustained increase in oil prices would widen the import bill, increase demand for US Dollars, and consequently put depreciation pressure on the shilling
Kenya’s forex reserves decreased marginally by 0.1% during the week to remain relatively unchanged from USD 15.2 bn recorded the previous week, equivalent to 6.3 months of import cover, and above the statutory requirement of maintaining at least 4.0-months of import cover.
The chart below summarizes the evolution of Kenya's months of import cover over from August 2024 to August 2026:
Rates in the fixed income market have declined MTD, reversing the recent upward trend. The decline comes despite the CBK's decision to pause its rate-cutting cycle at 8.75%, with inflation remaining elevated at 6.5% but within the CBK's target range. The government is 282.2% ahead of its prorated net domestic borrowing target of Kshs 154.1 bn, having a net borrowing position of Kshs 434.8 bn (inclusive of T-bills). We expect investors to maintain a preference for short to medium-term papers as they monitor the pace of government issuance and the path of inflation before committing further out on the curve, with the yield curve likely to remain under upward pressure rather than stabilize, at least until the inflation trajectory becomes clearer.
Market Performance:
During the week, the equities market was on an upward trajectory, with NSE 20, NASI, NSE 25 and NSE 10 gaining by 1.8%, 1.5%, 1.1% and 0.8% respectively taking the YTD performance to gains of 37.2%, 36.3%, 35.0% and 32.6% respectively for NSE 20, NSE 10, NSE 25 and NASI respectively. The week-on-week equities market performance was mainly driven by gains recorded by large cap stocks such as DTB-K, Stanbic, and Safaricom of 8.2%, 4.9% and 4.1% respectively. However, the performance was weighed down by losses recorded by large cap stocks such as ABSA, BAT and Standard Chartered Bank Kenya of 2.8%, 0.5% and 0.3% respectively.
During the week, the banking sector index increased by 0.3% to 285.4 from the 284.5 recorded the previous week. This is attributable to gains recorded by large cap stocks such as DTB-K, Stanbic, and Cooperative Bank of 8.2%, 4.9% and 2.5% respectively. However, the performance was weighed down by losses recorded by large cap stocks such as ABSA, Standard Chartered Bank Kenya, and Equity of 2.8%, 0.3% and 0.3% respectively.
During the week, equities turnover decreased by 53.4% to USD 44.8 mn from USD 96.1 mn recorded the previous week, taking the YTD total turnover to USD 2,811.8 mn. Foreign investors remained net sellers for the seventh consecutive week with a net selling position of USD 7.1 mn, from a net selling position of USD 12.5 mn recorded the previous week, taking the YTD foreign net selling position to USD 136.4 mn, compared to a net selling position of USD 92.9 mn recorded in 2025.
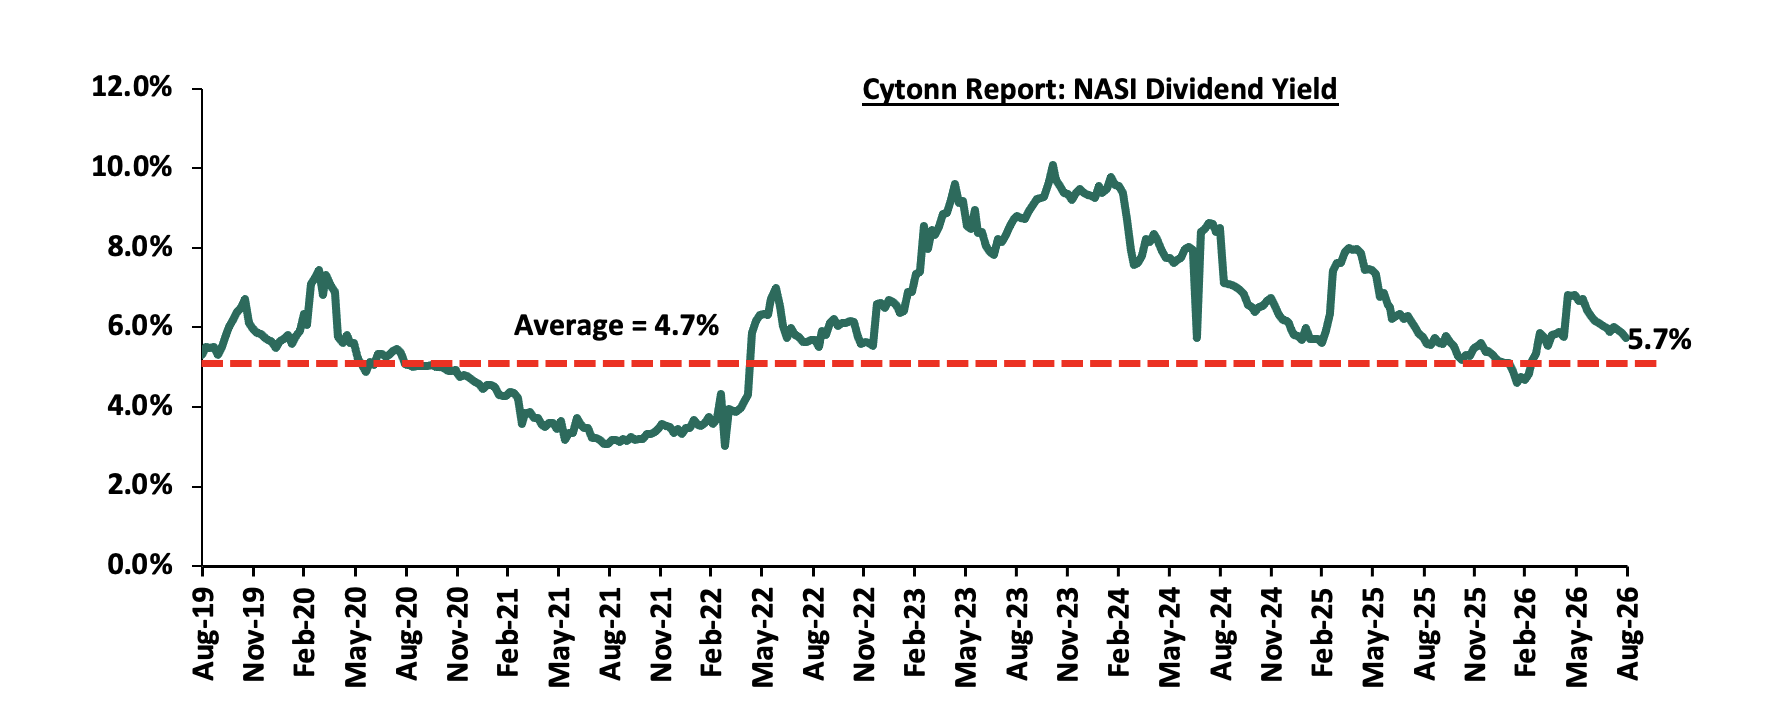
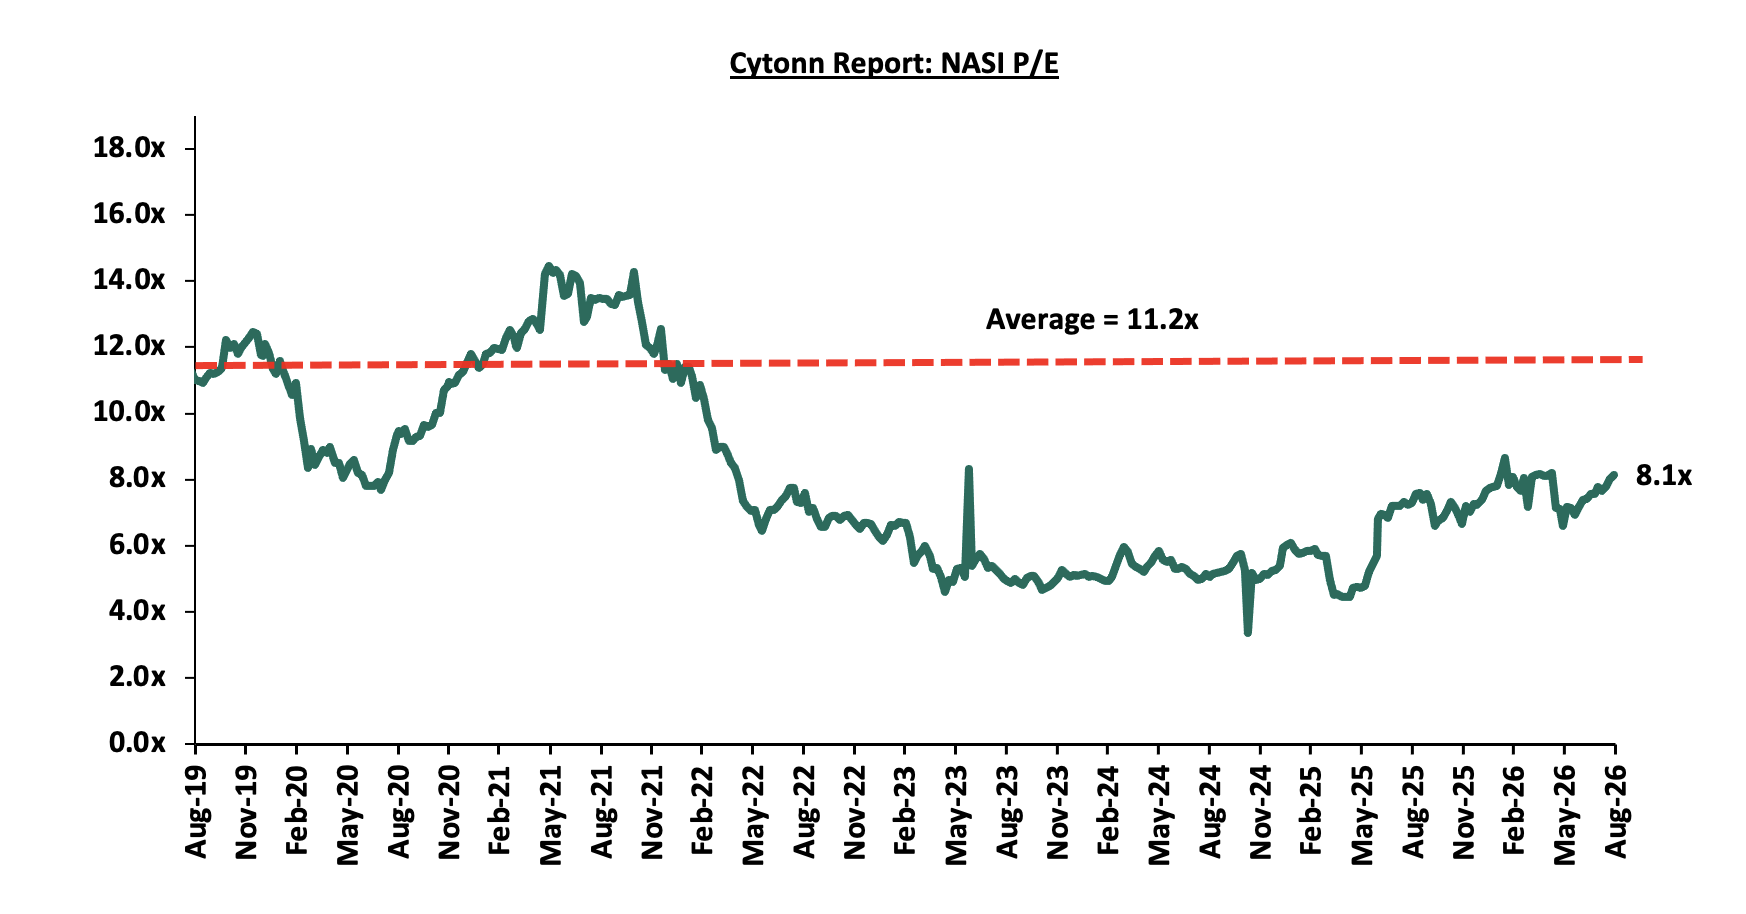
The market is currently trading at a price to earnings ratio (P/E) of 8.1x, 27.4% below the historical average of 11.2x, and a dividend yield of 5.7%, 1.0% points above the historical average of 4.7%. Key to note, NASI’s PEG ratio currently stands at 1.0x, an indication that the market is fairly valued relative to its future growth. A PEG ratio greater than 1.0x indicates the market may be overvalued while a PEG ratio less than 1.0x indicates that the market is undervalued.
The charts below indicate the historical P/E and dividend yields of the market:
Universe of Coverage:
|
Cytonn Report: Equities Universe of Coverage |
|||||||||||
|
Price as at 21/08/2026 |
Price as at 28/08/2026 |
w/w change |
m/m change |
YTD Change |
Year Open 2026 |
Target Price* |
Dividend Yield |
Upside/ Downside** |
P/TBv Multiple |
Recommendation |
|
|
Co-op Bank |
36.4 |
37.3 |
2.5% |
6.9% |
55.9% |
23.9 |
46.1 |
6.7% |
30.5% |
1.4x |
Buy |
|
NCBA |
90.5 |
90.5 |
0.0% |
0.6% |
6.5% |
85.0 |
108.9 |
7.8% |
28.2% |
1.2x |
Buy |
|
KCB Group |
93.5 |
93.5 |
0.0% |
8.7% |
42.2% |
65.8 |
104.4 |
7.5% |
19.1% |
1.0x |
Accumulate |
|
ABSA Bank |
35.3 |
34.3 |
(2.8%) |
2.9% |
37.8% |
24.9 |
36.8 |
6.0% |
13.5% |
1.9x |
Accumulate |
|
Family Bank |
32.3 |
31.1 |
(3.9%) |
(1.3%) |
72.5% |
18.0 |
34.0 |
3.9% |
13.4% |
1.6x |
Accumulate |
|
Standard Chartered Bank |
335.5 |
334.5 |
(0.3%) |
(1.0%) |
11.6% |
299.8 |
345.8 |
9.3% |
12.7% |
2.1x |
Accumulate |
|
Equity Group |
93.5 |
93.3 |
(0.3%) |
7.5% |
39.2% |
67.0 |
98.8 |
6.2% |
12.1% |
1.2x |
Accumulate |
|
Stanbic Holdings |
275.0 |
288.5 |
4.9% |
(1.0%) |
45.9% |
197.8 |
300.3 |
7.7% |
11.8% |
1.6x |
Accumulate |
|
I&M Group |
79.0 |
78.3 |
(0.9%) |
15.5% |
82.8% |
42.8 |
81.1 |
4.8% |
8.4% |
1.3x |
Hold |
|
Jubilee Holdings |
411.8 |
402.5 |
(2.2%) |
6.8% |
24.8% |
322.5 |
420.5 |
3.7% |
8.2% |
0.6x |
Hold |
|
Diamond Trust Bank |
173.3 |
187.5 |
8.2% |
23.0% |
63.4% |
114.8 |
190.2 |
4.8% |
6.3% |
0.5x |
Hold |
|
CIC Group |
4.7 |
4.8 |
1.7% |
1.3% |
5.7% |
4.5 |
5.0 |
2.7% |
6.0% |
1.2x |
Hold |
|
Britam |
18.2 |
18.6 |
2.2% |
6.9% |
105.3% |
9.1 |
18.5 |
0.0% |
(0.8%) |
1.4x |
Sell |
|
*Target Price as per Cytonn Analyst estimates **Upside/ (Downside) is adjusted for Dividend Yield ***Dividend Yield is calculated using FY’2025 Dividends |
|||||||||||
Weekly Highlights
-
I&M Group’s H1’2026 performance
During the week I&M Group released their H1’2026 financial results Profit after tax increased by 22.4% to Kshs 10.2 bn in H1’2026.
|
Balance Sheet Items (Kshs bn) |
H1’2025 |
H1’2026 |
y/y change |
|
Government Securities |
133.2 |
204.4 |
53.4% |
|
Net Loans and Advances |
290.3 |
333.8 |
15.0% |
|
Total Assets |
588.9 |
746.3 |
26.7% |
|
Customer Deposits |
429.4 |
505.2 |
17.7% |
|
Deposits/branch |
3.9 |
4.2 |
7.8% |
|
Total Liabilities |
475.3 |
619.1 |
30.3% |
|
Shareholders’ Funds |
106.5 |
119.4 |
12.1% |
|
Balance Sheet Ratios |
H1’2025 |
H1’2026 |
% points change |
|
Loan to Deposit Ratio |
67.6% |
66.1% |
(1.5%) |
|
Government Securities to Deposit Ratio |
31.0% |
40.5% |
9.4% |
|
Return on average equity |
17.6% |
18.0% |
0.4% |
|
Return on average assets |
3.1% |
3.2% |
0.1% |
|
Income Statement (Kshs bn) |
H1’2025 |
H1’2026 |
y/y change |
|
Net Interest Income |
20.4 |
25.0 |
22.5% |
|
Net non-Interest Income |
7.0 |
8.7 |
24.5% |
|
Total Operating income |
27.4 |
33.7 |
23.0% |
|
Loan Loss provision |
(4.1) |
(5.6) |
37.7% |
|
Total Operating expenses |
(16.1) |
(20.6) |
27.8% |
|
Profit before tax |
11.7 |
13.5 |
15.0% |
|
Profit after tax |
8.3 |
10.2 |
22.4% |
|
Core EPS |
5.0 |
6.2 |
22.4% |
|
Income Statement Ratios |
H1’2025 |
H1’2026 |
% points change |
|
Yield from interest-earning assets |
14.4% |
13.0% |
(1.4%) |
|
Cost of funding |
4.1% |
4.6% |
0.5% |
|
Net Interest Margin |
8.8% |
8.7% |
(0.1%) |
|
Net Interest Income as % of operating income |
74.6% |
74.3% |
(0.3%) |
|
Non-Funded Income as a % of operating income |
25.4% |
25.7% |
0.3% |
|
Cost to Income Ratio |
58.7% |
61.0% |
2.3% |
|
CIR without LLP |
43.9% |
44.4% |
0.5% |
|
Cost to Assets |
2.0% |
2.0% |
0.0% |
|
Capital Adequacy Ratios |
H1’2025 |
H1’2026 |
% points change |
|
Core Capital/Total Liabilities |
21.4% |
20.7% |
(0.7%) |
|
Minimum Statutory ratio |
8.0% |
8.0% |
0.0% |
|
Excess |
13.4% |
12.7% |
(0.7%) |
|
Core Capital/Total Risk Weighted Assets |
17.2% |
17.7% |
0.5% |
|
Minimum Statutory ratio |
10.5% |
10.5% |
0.0% |
|
Excess |
6.7% |
7.2% |
0.5% |
|
Total Capital/Total Risk Weighted Assets |
19.8% |
21.8% |
2.1% |
|
Minimum Statutory ratio |
14.5% |
14.5% |
0.0% |
|
Excess |
5.3% |
7.3% |
2.1% |
|
Liquidity Ratio |
54.0% |
64.9% |
10.9% |
|
Minimum Statutory ratio |
20.0% |
20.0% |
0.0% |
|
Excess |
34.0% |
44.9% |
10.9% |
Key Take-Outs:
-
Increased earnings - Core earnings per share grew by 22.4% to Kshs 6.2, from Kshs 5.0 in H1’2025, driven by the 23.0% increase in total operating income to Kshs 33.7 bn, from Kshs 27.4 bn in H1’2025. The performance was however weighed down by the 27.8% increase in total operating expenses to Kshs 20.6 bn from Kshs 16.1 bn in H1’2025,
-
Improved asset quality – The bank’s Asset Quality improved, with Gross NPL ratio decreasing by 2.5% points in H1’2026, to 8.4% from 11.0% in H1’2025, attributable to a 12.4% decrease in Gross non-performing loans to Kshs 30.1 bn, from Kshs 34.4 bn in H1’2025, compared to the 13.9% increase in gross loans to Kshs 356.3 bn, from Kshs 312.7 bn recorded in H1’2025,
-
Expanded Balance sheet - The balance sheet registered an expansion as total assets increased by 26.7% to Kshs 746.3 bn in H1’2026, from Kshs 588.9 bn in H1’2025, mainly attributable to the 53.4% increase in government securities to Kshs 204.4 bn, from Kshs 133.2 bn in H1’2025 coupled with a 15.0% increase in net loans to Kshs 333.8 bn in H1’2026 from Kshs 290.3 bn in H1’2025, and,
-
Increased lending- Customer net loans and advances increased by 15.0% to Kshs 333.8 bn, from Kshs 290.3 bn in H1’2025,
Going forward, the factors that would drive the bank’s growth would be driven by:
-
Regional Expansion - I&M Group's long-term growth trajectory remains firmly on course, anchored by the continued execution of its iMara 3.0 strategy. The Group has grown its Kenyan branch network to 65 outlets from 52 outlets across 27 counties, with 15 more branches planned for 2026 under the "Mahali Uko, Tuko" campaign, targeting 80 branches and a presence across all 47 counties by year end. Beyond Kenya, the Group has increased its shareholding in I&M Bank Tanzania to 95.5%, deepening its regional commitment as it advances toward its long-term ambition of becoming Eastern Africa's leading financial partner for growth.
-
Retail Ecosystem Credit Monetization - The front-end Backbase partnership powering the I&M On-The-Go (OTG) platform has transformed from a customer acquisition tool into a primary earnings engine. By lowering customer acquisition costs on the app by 44.0%, the bank successfully dispersed Kshs 15.7 bn in financing through digital channels in H1’2026. This digital credit expansion directly fueled a 22.5% jump in net interest income to Kshs 25.0 bn, as digital lending yields higher margins than traditional corporate facilities.
For a more detailed analysis, please see our I&M Group H1’2026 Earnings Note.
-
HFCB’s H1’2026 performance
During the week HFCB Group released their H1’2026 financial results, Profit after tax increased by 59.9% increase in profit after tax to Kshs 1.0 bn in H1’2026;
|
Balance Sheet Items |
H1'2025 |
H1'2026 |
y/y change |
|
Government Securities |
23.9 |
33.7 |
41.0% |
|
Net Loans and Advances |
38.9 |
43.4 |
11.5% |
|
Total Assets |
76.9 |
94.0 |
22.3% |
|
Customer Deposits |
52.5 |
68.1 |
29.7% |
|
Deposits/ Branch |
2.4 |
3.1 |
29.7% |
|
Total Liabilities |
60.2 |
75.8 |
26.0% |
|
Shareholders’ Funds |
16.8 |
18.2 |
8.9% |
|
Balance Sheet Ratios |
H1'2025 |
H1'2026 |
% Points change |
|
Loan to Deposit Ratio |
74.2% |
63.8% |
(10.4%) |
|
Government Securities to Deposit ratio |
45.5% |
49.5% |
4.0% |
|
Return on average equity |
6.8% |
10.3% |
3.5% |
|
Return on average assets |
1.3% |
2.1% |
0.8% |
|
Income Statement |
H1'2025 |
H1'2026 |
y/y change |
|
Net Interest Income |
2.0 |
2.6 |
29.4% |
|
Net non-Interest Income |
0.8 |
1.2 |
37.4% |
|
Total Operating income |
2.9 |
3.8 |
31.7% |
|
Loan Loss provision |
(0.2) |
(0.3) |
30.0% |
|
Total Operating expenses |
(2.2) |
(2.6) |
18.1% |
|
Profit before tax |
0.7 |
1.2 |
74.3% |
|
Profit after tax |
0.62 |
1.00 |
59.9% |
|
Core EPS |
0.3 |
0.5 |
59.9% |
|
Income Statement Ratios |
H1'2025 |
H1'2026 |
% points change |
|
Yield from interest-earning assets |
12.3% |
11.5% |
(0.8%) |
|
Cost of funding |
6.8% |
5.0% |
(1.8%) |
|
Net Interest Spread |
5.5% |
6.6% |
1.1% |
|
Net Interest Margin |
5.9% |
7.0% |
1.1% |
|
Cost of Risk |
7.3% |
6.6% |
(0.7%) |
|
Net Interest Income as % of operating income |
70.8% |
69.5% |
(1.3%) |
|
Non-Funded Income as a % of operating income |
29.2% |
30.5% |
1.3% |
|
Cost to Income Ratio (with LLP) |
75.7% |
67.8% |
(7.8%) |
|
Cost to Income Ratio (without LLP) |
68.4% |
60.6% |
(7.7%) |
|
Capital Adequacy Ratios |
H1'2025 |
H1'2026 |
% Points Change |
|
Core Capital/Total Liabilities |
18.1% |
15.3% |
(2.8%) |
|
Minimum Statutory ratio |
8.0% |
8.0% |
|
|
Excess |
10.1% |
7.3% |
(2.8%) |
|
Core Capital/Total Risk Weighted Assets |
21.3% |
20.7% |
(0.6%) |
|
Minimum Statutory ratio |
10.5% |
10.5% |
|
|
Excess |
10.8% |
10.2% |
(0.6%) |
|
Total Capital/Total Risk Weighted Assets |
24.2% |
22.2% |
(2.0%) |
|
Minimum Statutory ratio |
14.5% |
14.5% |
|
|
Excess |
9.7% |
7.7% |
(2.0%) |
|
Liquidity Ratio |
51.4% |
51.5% |
0.1% |
|
Minimum Statutory ratio |
20.0% |
20.0% |
|
|
Excess |
31.4% |
31.5% |
|
Key Take-Outs:
-
Increased earnings - Core earnings per share (EPS) increased by 59.9% to Kshs 0.5 in H1’2026 from Kshs 0.3 in H1’2025, driven by the 31.7% growth in total operating income to Kshs 3.8 bn from Kshs 2.9 bn in H1’2025, but was however weighed down by the 18.1% increase in total operating expenses to Kshs 2.6 bn from Kshs 2.2 bn.
-
Improvement in asset quality – The bank’s asset quality improved, with the gross NPL ratio decreasing by 2.7 % points to 21.4 % in H1’2026 from 24.0% in H1’2025, as gross loans increased by 10.2% to Kshs 52.4 bn in H1’2026 from Kshs 47.6 bn in H1’2025, relative to the 2.1 % decrease in gross non-performing loans to Kshs 11.2 bn in H1’2026 from Kshs 11.4 bn in H1’2025.
-
Expanded Balanced sheet - The balance sheet recorded an expansion, with total assets increasing by 22.3 % to Kshs 94.0 bn in H1’2026 from Kshs 76.9 bn in H1’2025, driven by a 11.5% increase in net loans to Kshs 43.4 bn, from Kshs 38.9 bn in H1’2025, coupled with a 41.0% increase in Government securities to Kshs 33.7 bn from Kshs 23.9 bn in H1’2025.
Going forward, the factors that would drive the bank’s growth would be:
-
Rebrand and TIER II consolidation as a structural growth platform: The group completed its unification of HFCK, Housing Finance, HFC, and HF Group under one new corporate identity, HFCB, following a TIER II upgrade in 2025 that consolidated its banking, property, and bancassurance subsidiaries under one roof after a 2024 recapitalization that has since strengthened the group's capital position, with the banking subsidiary now well ahead of the regulatory core capital threshold of Kshs 10.0 bn by 2029. This capital and structural base is effectively what's enabling the balance sheet growth you see in the numbers above.,
-
Product innovation in the property arm; Land Owner Wealth Management: Beyond diversification in the abstract, HFCB has developed concrete new fee-generating products that lean on its legacy property expertise rather than pure lending, most notably Land Owner Wealth Management from its property subsidiary, alongside an expanding bancassurance product suite, both explicitly flagged by management as key contributors to non-funded income growth.This is a differentiated play rather than a "me-too" banking product: HFCB has been in mortgage and property since 1965, and Land Owner Wealth Management monetizes that incumbent land/property valuation expertise through advisory-style fee income rather than balance-sheet-heavy lending, supporting ROE and capital ratios even as loan book growth moderates. Disclosure on the product remains thin, so it's worth flagging as a driver to watch rather than a fully quantified one.
For a more detailed analysis, please see our HFCB Group H1’2026 Earnings Note.
Summary Performance
The table below shows the performance of listed banks that have released their H1’2026 results using several metrics;
|
Cytonn Report: Listed Banks Performance in H1’2026 |
||||||||||||||
|
Bank |
Core EPS Growth |
Interest Income Growth |
Interest Expense Growth |
Net Interest Income Growth |
Net Interest Margin |
Non-Funded Income Growth |
NFI to Total Operating Income |
Growth in Total Fees & Commissions |
Deposit Growth |
Growth in Government Securities |
Loan to Deposit Ratio |
Loan Growth |
Return on Average Equity |
|
|
HFCB Group |
59.9% |
16.9% |
0.9% |
29.4% |
7.0% |
37.4% |
30.5% |
(10.4%) |
29.7% |
41.0% |
63.8% |
11.5% |
10.3% |
|
|
Diamond Trust Bank |
35.8% |
9.9% |
(9.5%) |
26.4% |
7.1% |
6.6% |
24.4% |
2.8% |
10.6% |
14.1% |
61.4% |
13.7% |
13.1% |
|
|
Equity Group |
31.5% |
8.2% |
(12.2%) |
16.8% |
6.7% |
35.9% |
44.5% |
29.7% |
21.4% |
6.7% |
61.7% |
18.9% |
29.1% |
|
|
Co-operative Bank |
28.0% |
6.3% |
(6.5%) |
13.0% |
9.0% |
11.6% |
32.2% |
10.9% |
13.4% |
7.0% |
74.4% |
18.1% |
20.6% |
|
|
Family Bank |
27.0% |
25.9% |
2.6% |
40.7% |
9.7% |
(14.2%) |
19.0% |
0.4% |
20.3% |
55.3% |
61.6% |
10.1% |
23.3% |
|
|
I&M Group |
22.4% |
18.9% |
12.5% |
22.5% |
8.7% |
24.5% |
25.7% |
(1.0%) |
17.7% |
53.4% |
66.1% |
15.0% |
18.0% |
|
|
KCB Group |
14.5% |
4.0% |
(2.9%) |
7.0% |
8.2% |
15.4% |
31.5% |
17.7% |
15.1% |
31.5% |
72.5% |
13.27% |
22.0% |
|
|
NCBA Group |
12.2% |
7.6% |
(12.8%) |
20.4% |
7.9% |
7.6% |
38.3% |
9.1% |
(11.3%) |
12.3% |
62.7% |
2.0% |
19.8% |
|
|
Stanbic Group |
1.3% |
5.9% |
6.6% |
5.5% |
6.2% |
(9.0%) |
23.8% |
1.9% |
9.4% |
14.5% |
68.1% |
24.7% |
20.7% |
|
|
Absa Bank Kenya |
(9.8%) |
(8.5%) |
(17.7%) |
(5.4%) |
8.4% |
(10.2%) |
(1.1%) |
9.4% |
6.8% |
(3.2%) |
86.7% |
8.2% |
23.3% |
|
|
Standard Chartered Bank |
(16.8%) |
(17.5%) |
0.7% |
(19.8%) |
7.5% |
15.9% |
39.1% |
23.1% |
6.4% |
(19.9%) |
54.7% |
11.1% |
17.1% |
|
|
H1'2026 Mkt Weighted Average* |
16.0% |
4.8% |
(5.6%) |
10.7% |
7.8% |
14.0% |
30.3% |
14.1% |
12.4% |
15.0% |
68.3% |
14.1% |
22.1% |
|
|
H1'2025 Mkt Weighted Average* |
8.4% |
(2.0%) |
(20.7%) |
10.4% |
8.0% |
(5.8%) |
33.9% |
4.2% |
1.7% |
28.3% |
67.2% |
1.5% |
22.3% |
|
|
*Market cap weighted as at 28/08/2026 |
||||||||||||||
|
**Market cap weighted as at 16/09/2025 |
||||||||||||||
Key take-outs from the table include:
-
The listed banks recorded a 16.8% weighted average growth in core Earnings per Share (EPS) in H1’2026, compared to the weighted average growth of 8.4% in H1’2025.
-
Interest income recorded a weighted average increase of 4.8% in H1’2026, compared to the 2.0% decline recorded in H1’2025. Interest expenses recorded a market-weighted average decline of 5.6% in H1’2026, compared to the 20.7% decline in H1’2025.
-
The Banks’ net interest income recorded a weighted average growth of 10.7% in H1’2026, from the 10.4% growth recorded over a similar period in 2025, while non-funded income increased by 14.0% in H1’2026 compared to the 5.8% decline recorded in H1’2025, and,
-
The Banks recorded a weighted average deposit growth of 12.4% in H1’2026, compared to the market-weighted average deposit growth of 1.7% in H1’2025.
Asset Quality
The table below shows the asset quality of listed banks that have released their H1’2026 results using NPL ratio and NPL coverage:
|
Bank |
H1'2026 NPL Ratio* |
H1'2025 NPL Ratio** |
% point change in NPL Ratio |
H1'2026 NPL Coverage* |
H1'2025 NPL Coverage** |
% point change in NPL Coverage |
|
Equity Group |
10.2% |
15.3% |
(5.0%) |
71.6% |
62.4% |
9.2% |
|
KCB Group |
14.5% |
17.9% |
(3.3%) |
78.8% |
64.3% |
14.4% |
|
Co-operative Bank |
14.2% |
17.3% |
(3.1%) |
68.9% |
65.8% |
3.1% |
|
Absa Bank Kenya |
10.2% |
13.2% |
(3.0%) |
69.1% |
66.6% |
2.5% |
|
HFCB Group |
21.4% |
24.0% |
(2.7%) |
80.5% |
75.4% |
5.1% |
|
I&M Group |
8.4% |
11.0% |
(2.5%) |
74.8% |
65.4% |
9.4% |
|
Stanbic Holdings |
7.3% |
9.5% |
(2.1%) |
86.6% |
82.7% |
3.9% |
|
NCBA Group |
10.8% |
12.2% |
(1.4%) |
67.4% |
65.5% |
1.8% |
|
Standard Chartered Bank |
5.1% |
6.0% |
(0.9%) |
84.3% |
81.4% |
2.9% |
|
Diamond Trust Bank |
12.2% |
12.9% |
(0.7%) |
58.2% |
45.9% |
12.2% |
|
Family Bank |
14.7% |
13.5% |
1.2% |
66.2% |
77.4% |
(11.3%) |
|
Mkt Weighted Average* |
11.2% |
13.8% |
(2.6%) |
73.6% |
67.8% |
5.8% |
|
*Market Cap weighted as at 28/08/2026 |
||||||
Key take-outs from the table include;
-
Asset quality for the listed banks improved during H1’2026, with the market-weighted average NPL ratio decreasing by 2.6% points to 11.2%, from 13.8% in H1’2025. The improvement was supported by the 5.0% points, 3.3% and 3.1% points decrease NPL ratios from Equity, KCB and Cooperative respectively. The performance was however weighed down by 1.2% points increase in NPL ratio from Family Bank.
-
Market-weighted average NPL coverage increased by 5.8% points to 73.6% in H1’2026 from 67.8% recorded in H1’2025. The performance was supported by increases in coverage by individual banks such as KCB Group by 14.4% points, DTB-K by 12.2% points, and I&M Group by 9.4% points. The performance was however weighed down by decrease in coverage by Family Bank by 11.3% points.
-
Jubilee Holdings Ltd H1’2026 Financial Results.
|
Cytonn Report: Jubilee Holdings Ltd Income Statement |
|||
|
Item (All figures in Bns) |
H1’2025 |
H1’2026 |
y/y change |
|
Insurance Revenue |
16.7 |
16.9 |
1.2% |
|
Insurance service expenses |
(15.4) |
(16.1) |
4.6% |
|
Net expenses from reinsurance contracts held |
(0.2) |
(0.3) |
74.2% |
|
Net Insurance income |
1.1 |
0.4 |
(59.7%) |
|
Net investment result |
1.6 |
2.3 |
45.8% |
|
Net non-attributable income (expenses) |
0.7 |
1.6 |
135.8% |
|
Profit Before Tax |
3.4 |
4.4 |
30.0% |
|
Taxation |
(0.3) |
(1.0) |
185.1% |
|
Profit After Tax |
3.1 |
3.4 |
12.7% |
|
Core EPS in Kshs |
42.2 |
47.6 |
12.7% |
|
Return on Average Equity |
5.5% |
6.1% |
0.6% |
|
Return on Average Assets |
1.4% |
1.4% |
0.0% |
|
Dividend Per Share in Kshs |
2.0 |
2.0 |
0.0% |
|
Dividend Payout Ratio |
4.7% |
4.2% |
(0.5%) |
|
Annualized Dividend Yield |
4.0% |
3.2% |
(0.8%) |
|
Cytonn Report: Jubilee Holdings Ltd Balance Sheet |
|||
|
Item (All figures in Bns) |
H1’2025 |
H1’2026 |
y/y change |
|
Investment assets |
206.8 |
246.5 |
19.2% |
|
Insurance Assets |
3.7 |
4.9 |
30.8% |
|
Other Assets |
5.5 |
6.5 |
19.1% |
|
Total Assets |
228.4 |
272.7 |
19.4% |
|
Insurance Contract Liabilities |
166.8 |
204.8 |
22.8% |
|
Provisions & other payables |
7.8 |
9.6 |
23.5% |
|
Total liabilities |
174.6 |
214.4 |
22.8% |
|
Shareholder funds |
51.7 |
56.5 |
9.1% |
|
Minority Interest |
2.1 |
1.8 |
(12.5%) |
|
Total Equity |
58.3 |
58.3 |
0.0% |
Key take outs from the results:
-
Core Earnings Per share increased by 12.7% to Kshs 3.4 from Kshs 3.1 in H1’2025, driven by the 1.2% increase in Insurance Services Revenues to Kshs 16.9 bn, from Kshs 16.7 bn in H1’2025, but was however weighed down by the 4.6 % increase in Insurance Services Expenses to Kshs 16.1 bn in H1’2026, from Kshs 15.4 bn in H1’2025,
-
Net Investment result increased by 45.8% to Kshs 2.3 bn in H1’2026, from Kshs 1.6 bn in H1’2025, while net non-attributable income increased significantly by 135.8% to Kshs 1.6 bn, from Kshs 0.7 bn in H1’2025, resulting in a 30.0 % increase in the Profit Before Tax to Kshs 4.4 bn in H1’2026, from Kshs 3.4 bn recorded in H1’2025,
-
Insurance services revenue increased by 1.2% to Kshs 16.9 bn in H1’2026 from Kshs 16.7 bn in H1’2025, while insurance expenses increased by 4.6% to Kshs 16.1 bn from Kshs 15.4 bn in H1’2025, and the net expenses from reinsurance contracts held increased significantly by 74.2% to Kshs 0.3 bn, from Kshs 0.2 bn in H1’2025. This translated to a Net investment result increase of 45.8% to Kshs 2.3 bn from Kshs 1.6 bn in H1’2025,
-
The balance sheet recorded an expansion as total assets increased by 19.4% to Kshs 272.7 bn in HY'2026 from Kshs 228.4 bn in HY'2025, mainly driven by a 30.8% increase in Insurance assets to Kshs 4.9 bn in H1'2026 from Kshs 3.7 bn in H1'2025 and a 19.2% increase in investment assets to Kshs 246.5 bn in H1’2026 from Kshs 206.8 bn in H1’2025 coupled with a 19.1 % increase in insurance assets to Kshs 4.9 bn in H1'2026, from Kshs 3.7 bn in H1'2025, and,
-
Total liabilities increased by 22.8% to Kshs 214.4 bn in H1’2026 from Kshs 174.6 bn in H1’2025 mainly driven by a 22.8% increase in insurance contract liabilities to Kshs 204.8 bn from Kshs 166.8 bn in H1’2025 coupled with a 23.5% increase in provisions and other payables to Kshs 9.6 bn from Kshs 7.8 bn in H1’2025.
Other highlights from the release include:
-
Declaration of dividends – The Board of Directors recommended an interim dividend of Kshs 2.0, which was consistent with H1’2025. This translates to an annualized dividend yield of 3.2% and a payout ratio of 4.2% from an annualized dividend yield of 4.0% and payout ratio of 4.7% in H1’2025.
Going forward, the factors that would drive the company’s growth would be:
-
Strong regional footprint and diversification: Its presence in countries such as Kenya, Uganda and Tanzania allows Jubilee to tap into multiple economies. Moreover, diversification across life, health, and general insurance creates multiple revenue streams.
-
Strategic partnerships: Partnerships with global players like Allianz enhance expertise, capital strength, and global best practices.
-
CIC Group Ltd H1’2026 Financial Results.
|
Cytonn Report: CIC Group Income Statement |
|||
|
Item (All figures in Bns) |
H1'2025 |
H1'2026 |
y/y change |
|
Insurance Revenue |
13.9 |
16.3 |
17.8% |
|
Insurance service expenses |
(12.8) |
(15.2) |
18.9% |
|
Net expenses from reinsurance contracts held |
(1.0) |
(1.1) |
15.1% |
|
Net Insurance income |
0.13 |
0.04 |
(67.2%) |
|
Net finance expenses from insurance contracts |
(1.4) |
(2.4) |
75.9% |
|
Investment return |
2.7 |
4.0 |
43.9% |
|
Net investment result |
1.5 |
1.7 |
11.1% |
|
Revenue from asset management services |
0.8 |
1.0 |
25.2% |
|
Other Operating Expenses |
(0.9) |
(1.3) |
33.8% |
|
Operating Profit |
1.5 |
1.8 |
20.6% |
|
Profit Before Tax |
1.2 |
1.6 |
30.2% |
|
Profit After Tax |
0.6 |
1.1 |
70.3% |
|
Core EPS in Kshs |
0.2 |
0.4 |
70.3% |
|
Return on Average Equity |
6.0% |
8.9% |
2.9% |
|
Return on Average Assets |
1.0% |
1.3% |
0.3% |
|
Cytonn Report: CIC Group Balance Sheet |
|||
|
Item (All figures in Bns) |
H1'2025 |
H1'2026 |
y/y change |
|
Investment Properties |
3.7 |
3.3 |
(11.7%) |
|
Financial Investments |
51.2 |
63.7 |
24.3% |
|
Property & Equipment and Intangibles |
1.45 |
1.36 |
(5.8%) |
|
Total Assets |
70.1 |
81.7 |
16.5% |
|
Insurance Contract Liabilities |
48.3 |
61.0 |
26.3% |
|
Provisions & other payables |
4.3 |
4.1 |
(3.9%) |
|
Total liabilities |
58.0 |
69.3 |
19.5% |
|
Shareholder funds |
12.1 |
12.4 |
2.0% |
|
Minority Interest |
(0.1) |
(0.0) |
(45.2%) |
|
Total Equity |
12.1 |
12.4 |
2.4% |
Key take outs from the results:
-
Core earnings per share increased by 70.3% to Kshs 0.4 in H1’2026, from Kshs 0.2 in H1’2025, mainly attributable to 11.1% increase in net investment return to Kshs 1.7 bn from Kshs 1.5 bn in H1’2025, coupled with 25.2% increase in revenue from asset management services to Kshs 1.0 bn from Kshs 0.8 bn in H1’2025. However, the performance was weighed down by the 33.8% increase in other operating expenses to Kshs 1.3 bn from Kshs 0.9 bn in H1’2025 coupled with a 67.2% decrease in net insurance income to Ksh 0.04 bn from Kshs 0.13 bn in H1’2025.
-
Net investment result increased by 11.1% to Kshs 1.7 bn in H1’2026, from Kshs 1.5 bn in H1’2025, supported by the 43.9% increase in investment income to Kshs 4.0 bn, from Kshs 2.7 bn in H1’2026, however it was weighed down by 75.9% increase in net finance expenses from insurance contracts to Kshs 2.4 bn from Kshs 1.4 bn in H1’2025.
-
Insurance service expenses rose by 18.9% to Kshs 15.2 bn in H1’2026, from Kshs 12.8 bn in H1’2025, outpacing the 17.8% growth in insurance revenue to Kshs 16.3 bn, from Kshs 13.9 bn. At the same time, net expenses from reinsurance contracts held increased by 15.1% to Kshs 1.1 bn, from Kshs 1.0 bn in H1’2025. Consequently, net insurance income declined by 67.2% to Kshs 0.04 bn, from Kshs 0.13 bn in H1’2025.
-
The balance sheet recorded an expansion as total assets increased by 16.5% to Kshs 81.7 bn in H1’2026, from Kshs 70.1 bn in H1’2025, mainly driven by a 24.3% increase in financial investments to Kshs 63.7 bn, from Kshs 51.2 bn in H1’2025.The growth was however weighed down by a 11.7% decrease in investment properties to Kshs 3.3 bn, from Kshs 3.7 bn in FY’2024, coupled with 5.8% increase in property and equipment to Kshs 1.36 bn in H1’2026 from Kshs 1.45 bn in H1’2025, and,
-
Total liabilities increased by 19.5% to Kshs 69.3 bn in H1’2026 from Kshs 58.0 bn in H1’2025, mainly attributable to the 26.3% increase in insurance contract liabilities to Kshs 61.0 bn from Kshs 48.3 bn in H1’2025, however it was weighed down by a 3.9% decrease in provisions and other payables to Kshs 4.1 bn from Kshs 4.3 bn in H1’2025.
Other highlights from the release include:
-
Non-declaration of dividends – The Group’s Board of Directors did not recommended dividends.
Going forward, the factors that would drive the company’s growth would be:
-
Underwriting Excellence and Premium Growth: Continued growth in insurance revenue, supported by new business acquisition and market expansion, provides a strong foundation for CIC’s growth. However, improving underwriting profitability will be critical, given the decline in the insurance service result in H1’2026. Greater focus on risk-based pricing, claims management, cost efficiency and disciplined risk selection should enable the Group to translate premium growth into stronger and more sustainable earnings.
-
Asset Management and Revenue Diversification: CIC’s Asset Management business provides an increasingly important source of growth and earnings diversification. Asset Management revenue increased by 25.2% to Kshs 1.0 bn from Kshs 0.8 bn in H1’2025. Continued expansion of fund management, investment and savings products, alongside businesses such as microinsurance and healthcare services, should broaden the Group’s revenue base and reduce reliance on traditional insurance earnings.
-
Digital Transformation and Market Expansion: The Group’s EDGE 2030 strategy places digital transformation and customer experience at the centre of its growth agenda. Platforms such as EasyBima can improve customer acquisition, accessibility and service delivery, while the expansion of microinsurance provides an opportunity to deepen penetration among underserved segments. Regional operations and new ventures should further support market expansion and provide additional avenues for long-term growth.
-
Britam Holdings Plc H1’2026 Financial Results.
|
Cytonn Report: Britam Holdings Income Statement |
|||
|
Item (All figures in Bns) |
H1’2025 |
H1'2026 |
y/y change |
|
Insurance Revenue |
19.7 |
22.4 |
13.7% |
|
Insurance service expenses |
15.1 |
19.7 |
30.7% |
|
Net Insurance income |
1.3 |
1.8 |
36.1% |
|
Net Investment Income |
17.3 |
13.4 |
(22.4%) |
|
Net Insurance and Finance expenses |
16.0 |
10.9 |
(31.6%) |
|
Other Income |
0.4 |
0.3 |
(37.9%) |
|
Other operating expenses |
1.2 |
1.9 |
62.4% |
|
Profit Before Tax |
2.5 |
3.8 |
52.0% |
|
Profit After Tax |
1.7 |
2.7 |
53.3% |
|
Core EPS |
0.7 |
1.1 |
56.7% |
|
Return on Average Equity |
6.0% |
7.7% |
1.7% |
|
Return on Average Assets |
0.8% |
1.1% |
0.3% |
|
Cytonn Report: Britam Holdings Balance Sheet |
|||
|
Item (All figures in Bns) |
H1'2025 |
H1'2026 |
y/y change |
|
Investment assets |
206.9 |
249.8 |
20.7% |
|
Intangible Assets |
2.3 |
2.7 |
15.2% |
|
Total Assets |
225.0 |
270.8 |
20.4% |
|
Insurance Contract Liabilities |
179.5 |
219.0 |
22.0% |
|
Provisions & other payables |
13.3 |
13.9 |
4.6% |
|
Total liabilities |
193.8 |
233.3 |
20.4% |
|
Shareholder funds |
31.0 |
37.3 |
20.3% |
|
Minority Interest |
0.3 |
0.3 |
8.0% |
|
Total Equity |
31.2 |
37.6 |
20.2% |
Key take outs from the results:
-
Core Earnings Per share increased by 56.7% to Kshs 1.1 from Kshs 0.7 in H1’2025 driven by 13.7% increase in insurance revenue to Kshs 22.4 bn in H1’2026, from Kshs 19.7 bn in H1’2025, coupled with a 31.6% decrease in Net insurance and finance expenses to Kshs 10.9 bn from Kshs 16.0 bn in H1’2025.
-
Net Investment Income (NII) decreased by 22.4% to Kshs 13.4 bn in H1’2026, from Kshs 17.3 bn in H1’2025. This was majorly attributable to the 82.2% decrease in Gains on financial assets at fair value through profit to 1.1 bn from Kshs 6.2 bn in H1’2025, coupled with a 21.4% decrease in income from investment property to 0.3 bn from the Kshs 0.4 bn in H1’2025. However, the performance was supported by a 12.9% increase in interest and dividend income to Kshs 12.0 bn from Kshs 10.6 bn in H1’2025.
-
Insurance revenue increased by 13.7% to Kshs 22.4 bn in H1’2026 from Kshs 19.7 bn in H1’2025, while insurance expenses increased by 30.7% to Kshs 19.7 bn from Kshs 15.1 bn in H1’2025, and net expenses from reinsurance contracts decreased by 73.0% to Kshs 0.9 bn from Kshs 3.3 bn in H1’2025, translating to a Net insurance service result increase of 36.1% to Kshs 1.8 bn from Kshs 1.3 bn in H1’2025,
-
The balance sheet recorded an expansion as total assets increased by 20.4% to Kshs 270.8 bn in H1’2026 from Kshs 225.0 bn in H1’2025, mainly driven by 20.7% increase in investment assets to Kshs 249.8 bn from Kshs 206.9 bn in H1’2025, coupled with 15.2% increase in intangible assets to Kshs 2.7 bn, from Kshs 2.3 bn in H1’2025.
-
Total liabilities increased by 20.4% to Kshs 233.3 bn from Kshs 193.8 bn in H1’2025, majorly on the back of Insurance contract liabilities 22.0% increase to Kshs 219.0 bn from Kshs 179.5 bn in H1’2025, coupled with the 4.6% increase in provisions and other payables to Kshs 13.9 bn from Kshs 13.3 bn in H1’2025.
Other highlights from the release include:
-
Non-declaration of dividends – The Group’s board of directors declined to announce any dividends for the eighth consecutive year citing the group’s attempt to conserve capital.
Going forward, the factors that would drive the company’s growth would be:
-
Digitalization – Leveraging Britam Connect, its microinsurance subsidiary, alongside digital systems allows Britam to expand access to affordable insurance for underserved populations while improving efficiency. Through mobile platforms and simplified processes, the company can reach more customers, reduce distribution costs, and enhance service delivery. At the same time, the use of data analytics and automation supports better risk management, faster operations, and more tailored products, enabling sustainable growth and greater financial inclusion.
-
Diversified Products – On top of their mainstream insurance products, Britam has innovatively introduced a number of products into the market. These diversified products, such as school personal accidents, new born baby insurance products and their unit trust products, will contribute to a continued growth of the company’s growth.
-
Kenya Re Corporation Limited H1’2026 Financial Results.
|
Cytonn Report: Kenya Re's Income Statement |
|||
|
Income Statement (Kshs bn) |
H1'2025 |
H1'2026 |
y/y change |
|
Insurance Revenue |
6.3 |
7.2 |
13.2% |
|
Insurance Service Expense |
(5.4) |
(5.3) |
(2.2%) |
|
Net Expense from reinsurance contracts held |
(0.6) |
(0.6) |
0.3% |
|
Insurance Service Result |
0.3 |
1.25 |
314.2% |
|
Investment Income |
2.7 |
2.6 |
(3.3%) |
|
Net Insurance and Investment Revenue |
2.8 |
3.9 |
39.1% |
|
Operating and other expenses |
(0.6) |
(0.8) |
21.7% |
|
Profit before tax |
2.2 |
3.22 |
44.1% |
|
Income tax expense |
(0.7) |
(0.97) |
47.1% |
|
Profit after tax |
1.6 |
2.3 |
42.8% |
|
Core EPS |
0.3 |
0.4 |
42.8% |
|
Return on Equity (ROE) |
3.1% |
4.0% |
1.0% |
|
Return on Assets (ROA) |
2.3% |
3.2% |
0.9% |
|
Cytonn Report: Kenya Re's Balance Sheet |
|||
|
Balance Sheet items |
H1'2025 |
H1'2026 |
y/y change |
|
Government Securities |
26.5 |
26.5 |
0.0% |
|
Reinsurance contract assets |
0.2 |
0.2 |
3.0% |
|
Other assets |
45.5 |
48.0 |
5.5% |
|
Total assets |
72.2 |
74.7 |
3.5% |
|
Insurance and Reinsurance contract liabilities |
15.0 |
14.4 |
(4.2%) |
|
Payables and Other liabilities |
2.7 |
2.8 |
3.9% |
|
Total liabilities |
17.7 |
17.2 |
(3.0%) |
|
Shareholder funds |
54.5 |
57.6 |
5.6% |
Key take outs from the results:
-
Core EPS increased by 42.8% to Kshs 0.4 in H1’2026 from Kshs 0.3 in H1’2025. This is attributable to a 39.1% increase in Insurance Investment Revenue to Kshs 3.9 bn from Kshs 2.8 bn in H1’2025, compared to a 21.7% increase in operating and other expenses to Kshs 0.8 bn from Kshs 0.6 bn recorded in H1’2025.
-
Net Investment revenue declined by 3.3% to Kshs 2.6 bn in H1’2026 from Kshs 2.7 bn in H1’2025. This, decline however was supported by a significant 135.5% increase in net finance income from insurance contracts to Kshs 0.1 bn from an expense of Kshs 0.2 bn in H1’2026, which supported the company’s net insurance and investment revenue.
-
Insurance revenue rose by 13.2% to Kshs 7.2 bn in H1’2026 from Kshs 6.3 bn in H1’2025, while insurance service expenses decreased by 2.2% to Kshs 5.3 bn. Additionally, net expenses from reinsurance contracts held rose marginally by 0.3% to remain unchanged from Kshs 0.6 bn recorded in H1’2025. This combination led to a steep 314.2% increase in insurance service result to Kshs 1.3 bn from Kshs 0.3 bn,
-
Profit before tax rose by 44.1% to Kshs 3.2 bn from Kshs 2.2 bn in H1’2025, while profit after tax rose by 42.8% to Kshs 2.3 bn from Kshs 1.6 bn in H1’2025. The higher tax expense of Kshs 1.0 bn, a 47.1% increase from Kshs 0.7 bn recorded in H1’2025, absorbed part of the increase in pre-tax profit, resulting in a slightly lower growth in profit after tax.
-
The balance sheet recorded an expansion as total assets increased by 3.5% to Kshs 74.7 bn in H1’2026 from Kshs 72.2 bn in H1’2025, driven primarily by a 5.5% rise in other assets to Kshs 48.0 bn and a 3.0% increase in reinsurance contracts to Kshs 0.2 bn.
-
Total liabilities decreased by 3.0% to Kshs 17.2 bn from Kshs 17.7 bn, primarily due to a 4.2% decrease in insurance and reinsurance contract liabilities to Kshs 14.4 bn from Kshs 15.0 bn in H1’2025. However, this was weighed down by a 3.9% increase in payables and other liabilities to Kshs 2.8 bn from Kshs 2.7 bn in H1’2025. Shareholder funds expanded by 5.6% to Kshs 57.6 bn from Kshs 54.5 bn recorded in H1’2025 reflecting the company’s retained earnings and strong capital base.
Other highlights from the release include:
-
Non-declaration of dividends – The directors of Kenya Re corporation did not recommend interim dividend for the first half of 2026, consistent with H1’2026.
-
Increase in ROE and ROA – The ROE increased by 1.0% points to 4.0% in H1’2026 from 3.1% recorded in H1’2025. In addition, Kenya Re’s ROA increased marginally by 0.9% points to 3.2% in H1’2026 from 2.3% H1’2025
Going forward, the factors that would drive Kenya Re’s growth would be:
-
Regional and international expansion – Kenya Re is pursuing geographic diversification through a Kshs 1.5 bn expansion programme targeting Tanzania, Rwanda and India, with the initiatives forming a key component of its 2027–2031 Strategic Plan. The Tanzanian subsidiary is expected to commence operations on 1st September 2026, subject to regulatory approval, with the company planning to invest more than USD 20.0 mn to provide additional reinsurance capacity to local insurers. In Rwanda, Kenya Re is progressing the establishment of a liaison office in Kigali, having initiated procurement for both office premises and consultancy services to support its establishment. The proposed India branch in GIFT City will provide access to the country's growing insurance market while focusing on property, engineering and marine business following Kenya Re's earlier exit from loss making agricultural reinsurance. The expansion is expected to broaden Kenya Re's premium base, diversify its geographical exposure and strengthen its position as a leading Pan African reinsurer.
-
Higher domestic reinsurance participation – Kenya Re is set to benefit from an increase in the mandatory cession of general insurance business by Kenyan insurers to 25.0% from 20.0%, following the gazettement of the Insurance (Amendment) Regulations. The revised requirement is expected to take effect from September 2026 and will increase the proportion of general insurance business that insurers must place with Kenya Re, providing greater visibility over domestic premium flows and supporting the Corporation's market share. However, the impact on profitability will remain dependent on the Corporation's ability to maintain underwriting discipline and appropriately price the additional risks assumed.
-
Digital transformation and operational efficiency – Kenya Re plan to deepen its digital transformation as part of its 2027–2031 Strategic Plan, with a focus on improving operational efficiency, strengthening risk management and supporting scalable growth. The Corporation intends to build on its existing investments in automation, data analytics and artificial intelligence by further integrating technology into underwriting, claims management and other core processes. This is expected to improve the speed and accuracy of risk assessment and claims processing, enhance fraud detection and strengthen data driven decision making. As Kenya Re expands into new markets, greater automation should also support the management of higher business volumes without a proportionate increase in operating costs, while improving service
We maintain a “cautiously optimistic” short-term outlook supported primarily earnings-led attractive valuations, despite rising yields on short-term government papers, which increase competition for capital by drawing investors towards risk-free government securities, as well as heightened geopolitical risks such as Iran war that may weigh on investor sentiment, and, “neutral” in the long term as persistent foreign investor outflows continue to constrain market liquidity and limit broad-based market re-rating. With the market currently trading at a discount to its future growth (PEG Ratio at 1.0x), where performance will be driven by company-specific fundamentals rather than general market direction, we believe that investors should reposition towards value stocks exhibiting strong earnings growth, attractive dividend yields, solid balance sheets, sustainable competitive advantages and trading at compelling discounts to their intrinsic value. While foreign investor sell-offs are expected to continue exerting pressure in the near term, we believe this will create selective entry opportunities for long-term investors
-
Industry Report
-
Knight Franks H1’2026 Kenyan Market Update
During the week, Knight Frank, an international Real Estate consultancy and management firm, released the Kenya Market Update H1'2026 Report highlighting the performance of key Real Estate sectors in the country. The following were the key take outs from the report;
-
In the residential sector, the average selling prices for prime housing units increased by 6.2% in H1'2026, reflecting a continued shortage of quality prime housing stock, particularly bungalows, villas, townhouses, and maisonettes, amid sustained demand from owner-occupiers and renters. Additionally, average monthly rents increased by 0.7% compared to December 2025. The performance was attributable to the persistent supply-demand imbalance in prime locations, coupled with a growing buyer preference for gated communities over standalone homes, driven by their stronger sense of community and lifestyle amenities. Notably, planning activity indicated growing developer caution, with the value of approved residential building plans in Nairobi declining by 10.0% to Kshs 41.0 bn in Q1'2026 from Kshs 45.7 bn recorded in a similar period in 2025, as developers prioritized completion and absorption of existing developments over new project launches,
-
The average monthly asking rents for prime commercial office spaces remained relatively unchanged at USD 1.2 per SQFT in H1'2026, with annual escalations ranging between 3.0%-5.0% for USD-denominated leases and 5.0%-7.0% for KES-denominated leases. Commercial office space occupancy increased by 3.3% points to 84.9% in H1'2026 from 81.9% recorded in December 2025. The performance was attributable to a limited supply of grade A offices amid the absence of significant new prime completions, coupled with sustained absorption of existing prime stock by multinational corporations, financial institutions, and diplomatic organizations. Additionally, the flexible workspace market continued to expand, with IWG opening four new centres and Node NBO establishing a new hub in Gigiri targeting AI, technology, and digital infrastructure businesses,
-
In the retail sector, growth continued to be driven by the physical expansion of major retail chains and the ongoing shift towards convenience-oriented formats. During the period under review, QuickMart opened its 67th and 68th branches at Basic Elgon View in Eldoret and along Ngong Road, while Naivas launched its 114th store at Ruaka Mall. Similarly, Jaza Supermarket continued expanding its neighbourhood retail model with at least six new outlets targeting middle and lower-income residential areas, while Uchumi advanced its turnaround strategy by reopening outlets at Lang'ata Hyper and Unicity Mall. Additionally, the completion of the 100,000.0 SQFT expansion of Galleria Mall in Karen underscored continued investor confidence in the sector despite headwinds from recurrent demonstrations and constrained household spending,
-
The industrial sector continues to grow, driven by a combination of institutional capital market activity, sector-specific investment, and logistics expansion. During the period under review, Africa Logistics Properties (ALP), in partnership with the UK Government's MOBILIST programme and the Private Infrastructure Development Group, successfully listed the ALP Industrial REIT, the first industrial REIT in East Africa and the first USD-denominated security listed on the Nairobi Securities Exchange, supported by a combined USD 24.0 mn investment. Kenya's industrial policy momentum was further reinforced by continued rollout of the County Aggregation and Industrial Parks programme, with six firms receiving 99-year leases within the Murang'a Industrial Park, while private sector investment included the MeTL Group's Kshs 6.5 bn soft drinks manufacturing plant in Mombasa and Dangote Group's proposed oil refinery in Lamu,
-
The hospitality sector recorded improved performance, with average hotel occupancy rising by 0.4% points to 29.3% in H1'2026, supported by a 6.2% increase in total tourist arrivals to 2.6 mn in 2025. The performance was attributable to strengthened investor confidence, evidenced by Choice Hotels International's entry into the African market through Kenya and continued expansion by CityBlue Hotels along the coastal region, alongside government-backed infrastructure investment including the USD 1.2 bn JKIA expansion agreement.
The findings of this report are in line with our Cytonn H1'2026 Markets Review which highlighted a rise in office occupancy to 84.9%, up 3.3% points from H1'2025, increased retail demand with occupancy up 4.9% points to 88.1%, and residential price appreciation of 1.4% y/y to an average of Kshs 148,579 per SQM. We maintain our view that the sector's performance will mainly be driven by: i) government's continued focus on affordable housing through the AHP, whose pipeline comprises over 214,000 units across 300+ projects, ii) continued infrastructural development, iii) provision of affordable mortgage financing through KMRC, iv) aggressive expansion by retailers, v) Kenya's recognition as a regional business hub, vi) positive demographics, with urbanization and population growth of 2.9% p.a and 1.9% p.a, and, vii) increasing investor confidence in hospitality. However, growth may face challenges such as: i) oversupply in select sectors, at 5.8 mn SQFT in office and 4.7 mn SQFT in retail, and, ii) a subdued REITs Market.
-
Residential Report
-
Kenya Mortgage Refinance Company (KMRC) financial performance HY’2026
During the week, KMRC released their H1’2026 financial results, recording a 35.6% decrease in profit after tax to Kshs 350.7 mn in HY’2026, from Kshs 544.2 mn in HY’2025;.
The table below shows a summary of KMRC’s income statement for HY’2025 and HY’2026;
|
Cytonn Report: Summary of KMRC Statement of Comprehensive Income |
|||
|
|
HY’2025 |
HY’2026 |
y/y Change |
|
REVENUE |
|
|
|
|
Interest Income |
1,576,934,875 |
1,549,514,475 |
(1.7%) |
|
Interest expense |
(649,776,334) |
(877,856,422) |
35.1% |
|
Net interest income |
927,158,541 |
671,658,053 |
(27.6%) |
|
EXPENSES |
|
||
|
Net movement in expected credit losses |
1,778,083 |
1,631,646 |
(8.2%) |
|
Operating and adminstration expenses |
(149,051,974) |
(165,841,339) |
11.3% |
|
Depreciation and amortisation expenses |
(2,482,166) |
(6,489,322) |
161.4% |
|
Total Expenses |
(149,756,057) |
(170,699,015) |
14.0% |
|
Net profit before income tax |
777,402,484 |
500,959,038 |
(35.6%) |
|
Income tax expense |
(233,220,745) |
(150,287,711) |
(35.6%) |
|
PROFIT AFTER TAX |
544,181,739 |
350,671,327 |
(35.6%) |
Source: KMRC
The table below shows a summary of KMRC’s balance sheet for HY’2025 and HY’2026;
|
Cytonn Report: Summary of KMRC Statement of Financial Position |
|||
|
|
HY’2025 |
HY’2026 |
y/y Change |
|
Assets |
|
|
|
|
Loan and Advances |
18,776,560,719 |
24,269,437,839 |
29.3% |
|
Cash and Cash equivalents |
16,154,723,082 |
16,031,077,748 |
(0.8%) |
|
Other Assets |
6,021,305,000 |
6,143,468,516 |
2.0% |
|
Total Assets |
40,952,588,801 |
46,443,984,103 |
13.4% |
|
Liabilities |
|||
|
Borrowings |
33,960,291,420 |
35,916,662,086 |
5.8% |
|
Debt securities in issue |
936,690,400 |
3,742,132,394 |
299.5% |
|
Lease Liabilities |
14,662,432 |
60,821,009 |
314.8% |
|
Other Liabilities |
424,947,395 |
383,054,230 |
(9.9%) |
|
Total Liabilities |
35,336,591,647 |
40,102,669,719 |
13.5% |
|
Capital Resources |
|||
|
Share Capital |
1,808,375,125 |
1,808,375,125 |
0.0% |
|
Revenue reserves |
3,689,553,059 |
4,337,903,947 |
17.6% |
|
Other Revenues |
132,035 |
28,745 |
(78.2%) |
|
Statutory Reserve |
117,936,935 |
195,006,567 |
65.3% |
|
Total Capital |
5,615,997,154 |
6,341,314,384 |
12.9% |
|
Total Liabilities and Equity |
40,952,588,801 |
46,443,984,103 |
13.4% |
Source: KMRC
Key Take-Outs:
-
Decreased earnings: The profit after tax decreased by 35.6% to Kshs 350.7 mn in HY’2026, from Kshs 544.2 mn in HY’2025 majorly attributable to 27.6% decrease in net interest income to Kshs 671.7 mn in HY’2026 from 927.2 mn in HY’2025 as compared to the 14.0% increase in total operating expense to Kshs 170.7 mn from Kshs 149.8 mn,
-
Expanded Balanced sheet: Total assets increased by 13.4% to Kshs 46.4 bn in HY’2026 from Kshs 41.0 bn in HY’2025 mainly attributable 29.3% increase in loans and advances to Kshs 24.3 bn in HY’2026 from Kshs 18.8 bn in HY’2025. Notably, Cash and Cash equivalents decreased by 0.8% to Kshs 16.0 bn in HY’2026 from Kshs 16.2 bn in HY’2025, and,
-
Increased lending: Loans and advances increased by 29.3% to Kshs 24.3 bn in HY’2026, from Kshs 18.8 bn disbursed in HY’2025, attributable to increased disbursement of mortgage loans to PMLs, further supported by KMRC's Kshs 3.0 bn sustainability bond issuance, which provided additional liquidity for onward refinancing
For a more detailed analysis, please see our Kenya Mortgage Refinance Company H1’2026 Earnings Note.
-
Real Estate Investments Trusts
-
REITs Weekly Performance
On the Unquoted Securities Platform Acorn D-REIT and I-REIT traded at Kshs 29.7 and Kshs 24.4 per unit, respectively, as per the last updated data on 28th August 2026. The performance represented a 48.5% and 22.0% gain for the D-REIT and I-REIT, respectively, from the Kshs 20.0 inception price. The volumes traded for the D-REIT and I-REIT came in at 0.1 mn and 1.5 mn shares, respectively. Additionally, ILAM Fahari I-REIT traded at Kshs 20.5 per share as of 28th August 2026, representing a 2.7% gain from the Kshs 20.0 inception price. REITs offer various benefits, such as tax exemptions, diversified portfolios, and stable long-term profits. However, the ongoing decline in the performance of Kenyan REITs and the restructuring of their business portfolios are hindering significant previous investments. Additional general challenges include:
-
Insufficient understanding of the investment instrument among investors leading to a slower uptake of REIT products,
-
Lengthy approval processes for REIT creation,
-
High minimum capital requirements of Kshs 100.0 mn for REIT trustees compared to Kshs 10.0 mn for pension funds Trustees, essentially limiting the licensed REIT Trustee to banks only
-
The rigidity of choice between either a D-REIT or and I-REIT forces managers to form two REITs, rather than having one Hybrid REIT that can allocate between development and income earning properties
-
Limiting the type of legal entity that can form a REIT to only a trust company, as opposed to allowing other entities such as partnerships, and companies,
-
We need to give time before REITS are required to list – they would be allowed to stay private for a few years before the requirement to list given that not all companies maybe comfortable with listing on day one, and,
-
Minimum subscription amounts or offer parcels set at Kshs 0.1 mn for D-REITs and Kshs 5.0 mn for restricted I-REITs. The significant capital requirements still make REITs relatively inaccessible to smaller retail investors compared to other investment vehicles like unit trusts or government bonds, all of which continue to limit the performance of Kenyan REITs.
We expect the performance of Kenya's Real Estate sector to remain resilient, supported by several factors, including: i) KMRC's 29.3% y/y growth in loans and advances to Kshs 24.3 bn in HY'2026, reflecting expanded capacity to refinance mortgages for Primary Mortgage Lenders, ii) the successful listing of KMRC's Kshs 3.0 bn Sustainability Bond on the NSE, oversubscribed by 312.8%, broadening funding for the refinancing of green and social housing loans, iii) rise in occupancy for the office sector to 84.9%, up 3.3% points, showing improved demand and uptake amid constrained new supply, iv) sustained price appreciation in the residential sector, with prime sale prices up 6.2% and rents up 0.7%, reflecting persistent demand, and v) continued advancement of the Government's Boma Yangu affordable housing programme through structured instalment-based purchase arrangements. However, challenges such as constrained developer financing and elevated commercial bank lending rates, averaging at 12.1%-15.0%, will continue to constrain the sector's optimal performance.
-
Visa Enhances Cybersecurity Portfolio and Launches VVAH-Driven Advisory Services
During the week, Visa announced significant enhancements to its global cybersecurity capabilities through the update of its open-source, model-agnostic Visa Vulnerability Agentic Harness (VVAH) and the expansion of its Visa Consulting & Analytics (VCA) Cybersecurity Advisory Practice. The updated VVAH framework advances beyond threat discovery into closed-loop remediation and automated validation, supporting Anthropic, OpenAI, and third-party AI models to drastically lower the Mean Time to Adapt (MTTA) for enterprise cyber vulnerabilities. Concurrently, VCA launched three specialized advisory offerings AI Cyber Leadership Education, VVAH-Informed Maturity Assessments, and Risk Prioritization Roadmaps designed to assist institutional clients in navigating AI-driven security risks. The initiative reinforces Visa’s strategic focus on expanding high-margin value-added services, fortifying payments network resilience, and deepening enterprise lock-in by addressing critical post-discovery infrastructure vulnerabilities across its global client base.
-
Mastercard Reconnects Syria to Global Payment Rails via QNB Partnership
During the week, Mastercard Incorporated, alongside Qatar National Bank (QNB) Group, completed Syria’s first live international point-of-sale (POS) card transaction in over 15 years. The operational milestone follows the U.S. Department of State's formal removal of Syria from its list of state sponsors of terrorism, clearing compliance hurdles for international payment processing networks. The initial execution allows participating merchants across Damascus including hotels, restaurants, and public sector entities to begin accepting internationally issued Mastercard credit cards. The market re-entry positions Mastercard as an early mover in Syria’s financial modernization, opening long-term growth opportunities in merchant acquiring, cross-border inbound volume, and foreign visitor transaction flows as the region reintegrates into global banking infrastructure.
-
Advent-Stripe Consortium Ends Pursuit of Takeover for PayPal Holdings
During the week, a private equity and fintech consortium comprising Advent International and Stripe abandoned its pursuit to acquire PayPal Holdings, Inc., halting discussions on what would have been one of the largest leveraged buyouts in financial services history. The consortium had previously submitted non-binding acquisition proposals valuing PayPal at over USD 50.0 bn (USD 60.5 per share), driven by PayPal's recent operational turnaround under CEO Enrique Lores and cost-restructuring initiatives. The termination of talks pivots investor attention back toward PayPal's standalone execution, operational efficiency targets, and core business unit restructuring across checkout, Venmo, and digital asset processing.
-
Digital Payments Stock Performance
The table below presents a snapshot of NYSE-listed digital payments stocks, covering Visa, Mastercard, American Express (AXP), Wise Plc, Block and PayPal:
|
Cytonn Report: Digital Payments NYSE and LSE Stock Performance |
||||||
|
Company |
Year Open 2026 |
Price 8/21/2026 |
Price 8/28/2026 |
w/w change |
YTD change |
P/E |
|
American Express |
372.7 |
336.0 |
333.2 |
(0.8%) |
(10.6%) |
25.9x |
|
Visa |
346.5 |
371.0 |
381.6 |
2.8% |
10.1% |
18.1 x |
|
Mastercard |
563.1 |
580.6 |
595.3 |
2.5% |
5.7% |
34.5x |
|
Block |
65.2 |
82.2 |
83.6 |
1.7% |
28.3% |
35.4 x |
|
Paypal Holdings |
58.1 |
61.5 |
53.7 |
(12.7%) |
(7.7%) |
10.7 x |
|
Wise PLC |
11.8 |
12.9 |
13.1 |
1.5% |
11.1% |
26.5 x |
|
Average |
|
|
|
|
|
25.2x |
Source: AXP, Visa, Mastercard, Circle, Block, PayPal, Coinbase, Global Payments, and Wise. NYSE
The stocks are currently trading at an average P/E multiple of 25.2x, indicating that investors are pricing in strong future earnings growth and are prepared to pay a substantial premium for current earnings. This also suggests that valuations may be stretched relative to near-term fundamentals.
We expect the global digital payments sector to continue evolving toward greater payment sovereignty, digital infrastructure modernization, and reduced reliance on traditional card-based payment networks as governments and financial institutions increasingly prioritize control over domestic payment ecosystems. Recent developments, particularly the European Central Bank’s progress toward launching the Digital Euro, signal a growing global shift toward central bank-backed digital payment infrastructure aimed at enhancing financial resilience, improving transaction efficiency, and strengthening monetary independence in an increasingly digital economy. This trend is likely to accelerate competition between public-sector digital currencies and established private payment networks such as Visa Inc. and Mastercard Incorporated, while driving broader innovation across digital finance infrastructure. However, despite these favorable long-term structural tailwinds, valuations within the sector remain relatively elevated, with the companies under coverage currently trading at an average P/E of 25.2x, suggesting that a significant portion of future growth expectations may already be priced in. As such, we expect near-term performance to remain sensitive to regulatory developments, execution risk, and the pace at which both incumbents and emerging digital payment infrastructure providers adapt to the rapidly changing payments landscape.
According to the Retirement Benefits Authority Industry Brief for June 2026, the Assets Under Management (AUM) increased by 25.1% to Kshs 3.2 tn from Kshs 2.5 tn in June 2025. The performance was attributable to higher contributions from the NSSF Act, 2013’s raised limits and strong investment performance supported by a stable macroeconomic environment. Notably, according to the ACTSERV Q2’2026 Retirement Benefits Schemes Investments Performance Survey, segregated retirement benefits schemes recorded a 3.1% return in Q2’2026, a decrease from the 6.6% return recorded in Q2’2025. The performance was largely driven by weaker equity performance, with the average return coming in at 19.7% compared to 21.5% return recorded in Q2’2025. The return reflects the performance of the market as the Nairobi All Share Index (NASI) had gained by 15.1% in Q2’2026 compared to a gain of 4.4% in Q1’2026.
We have been tracking the performance of Kenya’s Pension schemes with the most recent topicals being,
Progress of the Retirement Benefits Schemes in Kenya in Q1’2026 done in May 2026. This week, we shall focus on understanding Retirement Benefits Schemes and looking into the historical and current state of retirement benefits schemes in Kenya and what can be done going forward. We shall also analyze other asset classes that the schemes can tap into to achieve higher returns. Additionally, we shall look into factors and challenges influencing the growth of the RBSs in Kenya as well as the actionable steps that can be taken to improve the pension industry. We shall do this by looking into the following:
-
Historical and Current State of Retirement Benefits Schemes in Kenya,
-
Factors Influencing the Growth of Retirement Benefits Scheme in Kenya,
-
Challenges that Have Hindered the Growth of Retirement Benefit Schemes, and,
-
Recommendations on Enhancing the Performance of Retirement Benefits Schemes in Kenya.
Section I: Historical and the Current State of Retirement Benefits Schemes in Kenya
i. Growth of Retirement Benefits Schemes
According to the latest Retirement Benefits Authority (RBA) Industry Report for June 2026, assets under management increased by 25.1% to Kshs 3.2 tn from the Kshs 2.5 tn recorded in June 2025. The growth of the assets was majorly attributed to the increase in contributions to the mandatory National Social Security Fund (NSSF) scheme, through the rollout of the fourth phase of the NSSF Act, 2013 which took effect in February 2026 significantly boosting retirement savings. Under Phase 4, the lower earnings limit increased from Kshs 8,000.0 to Kshs 9,000.0, while the upper earnings limit increased from Kshs 72,000.0 to Kshs 108,000.0. As such, the NSSF investment assets increased by 33.0% to Kshs 742.4 bn in June 2026, from Kshs 558.1 bn in June 2025. Additionally, the improved macroeconomic conditions during the period as evidenced by favorable interest rate environment, mild inflationary pressures and stability of the exchange rate led to the growth in investment income for the schemes. Additionally, Tier I contributions rose from Kshs 480 to Kshs 540 for both employer and employee, while maximum Tier II contributions increased from Kshs 3,840 to Kshs 5,940 for both. This upward revision has already begun to strengthen the retirement benefits sector by boosting individual savings and accelerating the growth of overall Assets Under Management (AUM). The enhanced contributions are expected to continue to deepen long-term investment capacity and improve income security for future retirees, reinforcing the sector’s role in national economic development.
The graph below shows the growth of Assets under Management of the retirement benefits schemes over the last 10 years:
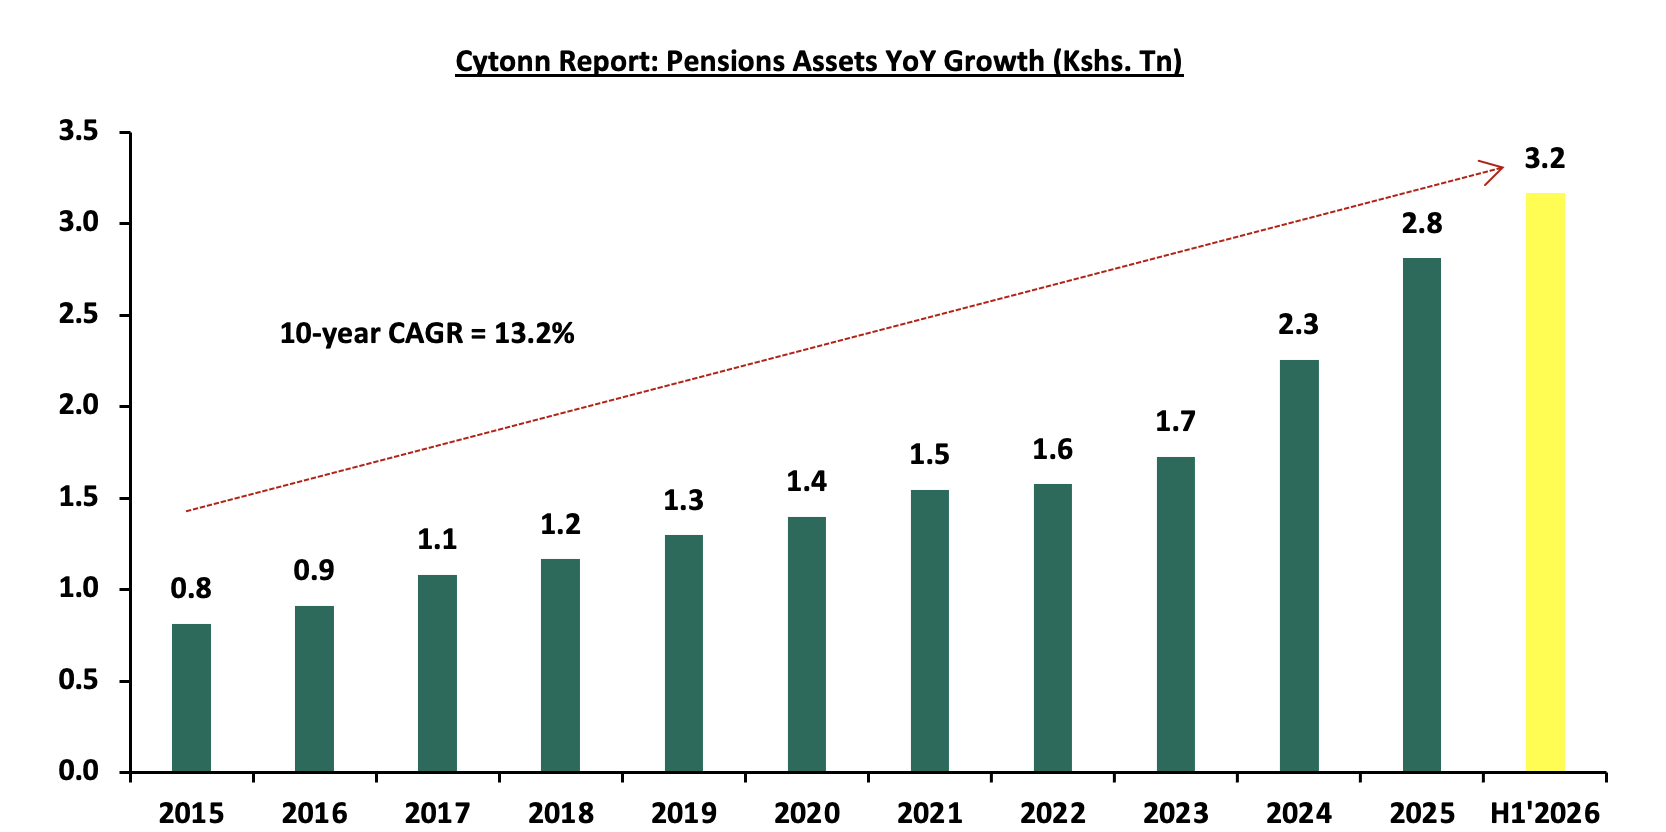
The consistent YoY increase demonstrates the significant role that the enhanced NSSF contributions made to the industry’s performance, following the implementation of the NSSF Act of 2013, which took effect in February 2023. The primary goal of the Act was to broaden the NSSF’s benefit coverage, range, and scope as well as improve the adequacy of benefits paid out of the scheme by the Fund amongst others. The chart below shows the y/y changes in the assets under management for the schemes over the years.
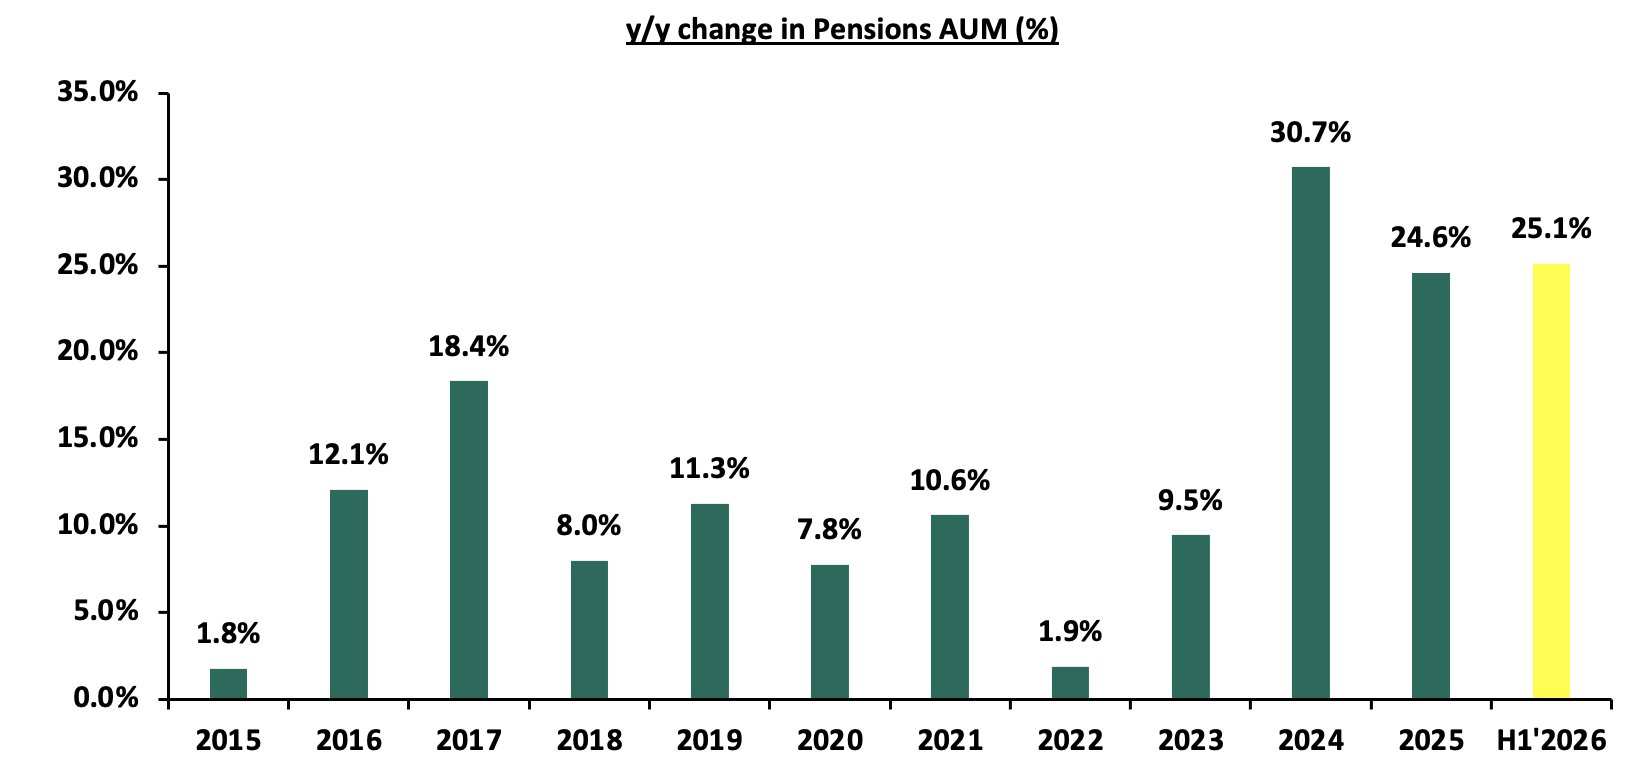
Source: RBA Industry Report
In Kenya, pension funds hold a substantial share of financial assets, consistently growing due to mandatory and voluntary contributions under the National Social Security Fund (NSSF) Act of 2013 regulations. In comparison, bank deposits remain the largest financial pool, reflecting their role as the primary savings vehicle driven by their liquidity, security, and accessibility, though they offer lower returns. Capital markets products, including unit trusts and REITs, are relatively smaller highlighting the nascent stage of capital markets in Kenya, but expanding as investors seek diversification and higher yields. Key to note, the Collective Investments Scheme’s industry’s overall Assets under Management (AUM) grew by 12.6% quarter‑on‑quarter to Kshs 851.7 bn in Q1’2026 from Kshs 756.2 bn in Q4’2025, while on a year‑on‑year basis AUM rose by 71.6% from Kshs 496.2 bn in Q1’2025. SACCOs play a crucial role in cooperative-based savings and credit access, especially for middle-income earners.
The graph below shows the Assets under Management of Pensions against other Capital Markets products and bank deposits:
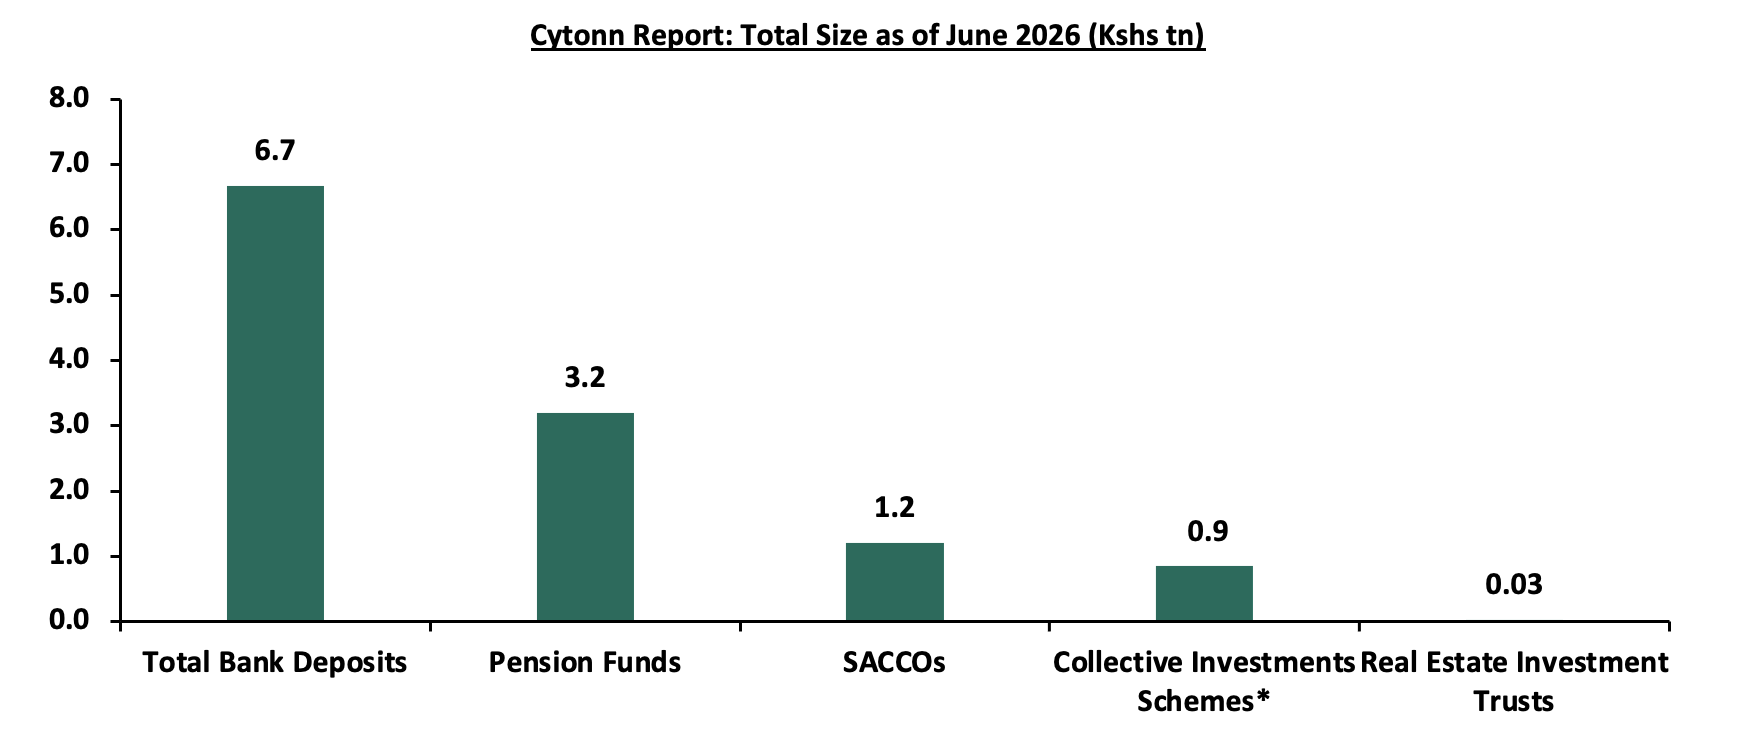
*Data as of March 2026
Sources: CMA, RBA, SASRA and RAK
As of the latest available data by RBA, Kenya’s pension-to-GDP ratio increased by 1.6% points to 17.6% in June 2026 from 15.2% in June 2025, driven by a 25.1% increase in pension Assets Under Management (AUM) to Kshs 3.2 bn, significantly outpacing the country’s GDP growth rate, which recorded a growth of 5.3% in Q1’2026. This disparity implies that the pension sector is expanding at a much faster rate than the broader economy, reflecting stronger savings mobilization, improved investment returns, and possibly increased compliance or contribution levels following regulatory reforms. However, the 17.6% is significantly lower than that of developed countries such as the United States at 169.5%, Australia at 132.6%, and the United Kingdom at 124.2%, reflecting the maturity and depth of their pension systems. In Sub-Saharan Africa region, Kenya outperforms countries like Malawi at 11.7%, Uganda at 9.0% and Nigeria at 8.0%, but still lags behind Namibia at 100.4% and South Africa at 83.8%. This positioning indicates that while Kenya’s pension sector is growing steadily, particularly with recent reforms, there remains considerable room for expansion and deeper integration into the national economy. The graph below shows select countries’ pension assets to GDP ratio as per the latest published data by World Bank as of 2020:
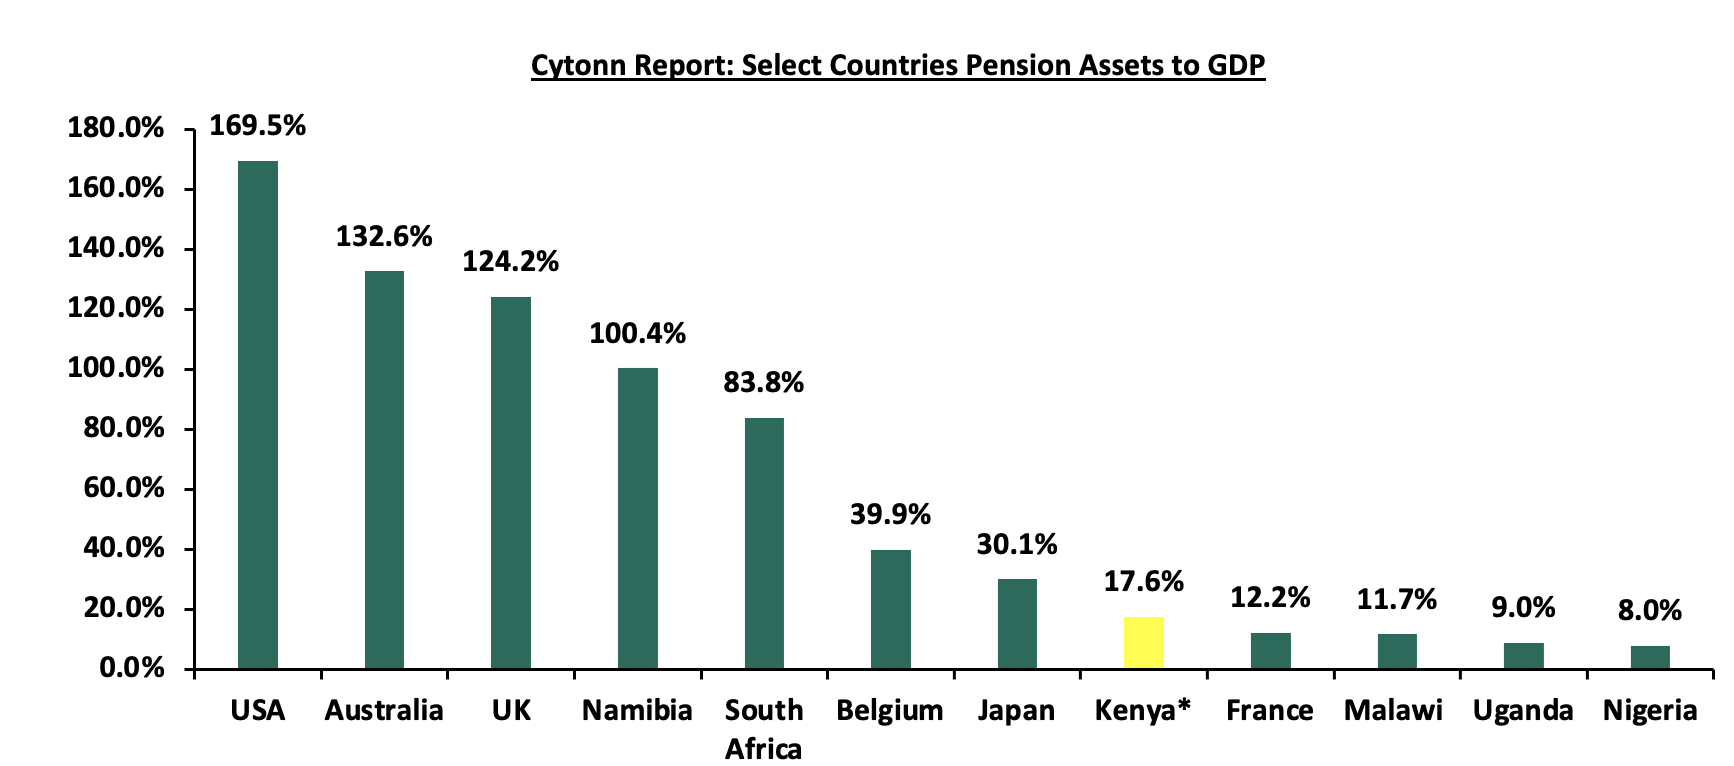
Sources: World Bank, RBA *data as of June 2026
The graph below shows Kenya’s pension to GDP ratio over the years:
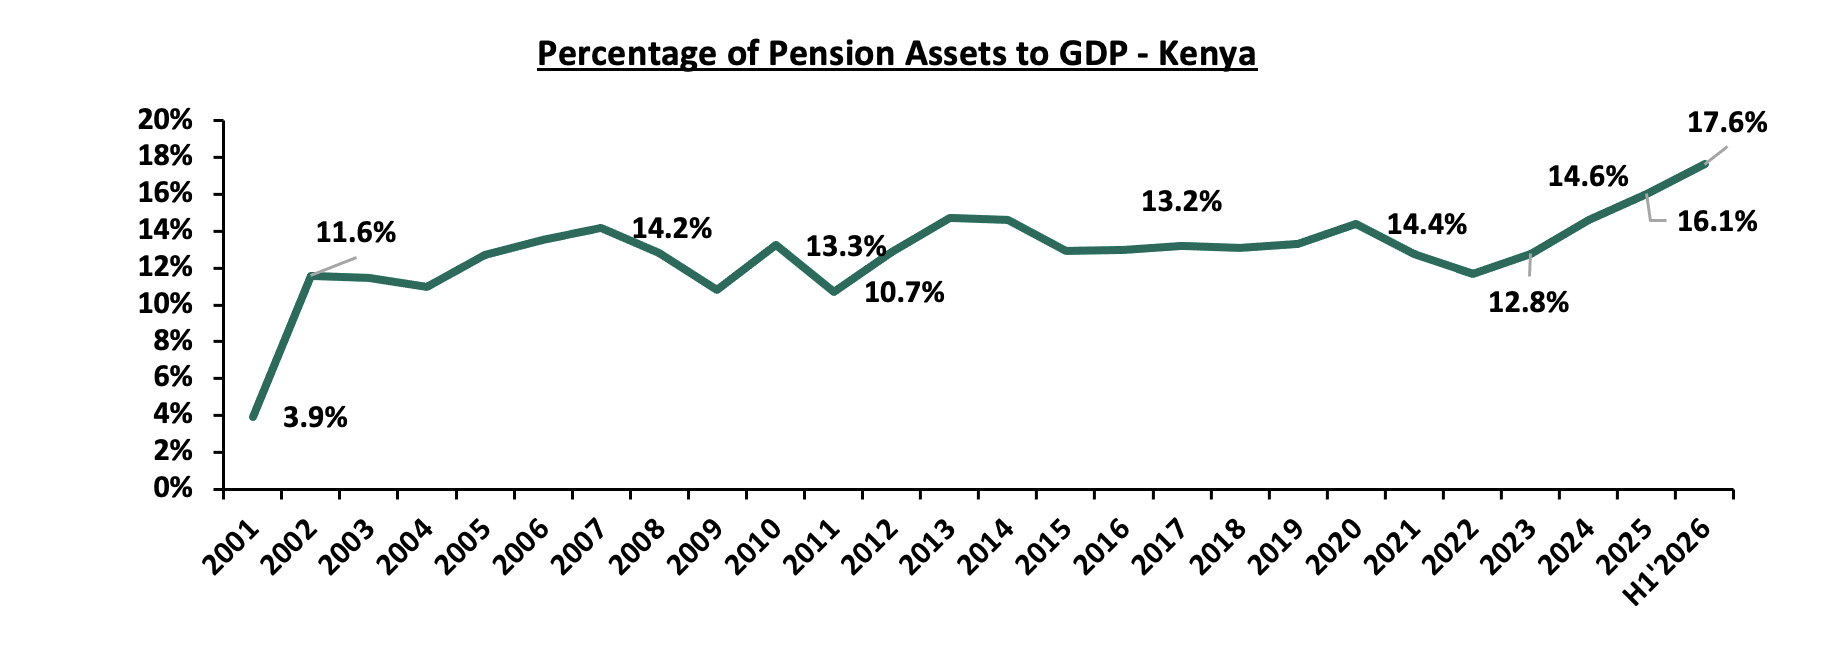
Source: RBA Industry Reports
-
Assets Held by Fund Managers
According to the Retirement Benefits Authority, as of the end of June 2026, 24 fund managers submitted their returns to RBA. The AUM for the fund managers increased by 9.0% to Kshs 2,416.9 bn in June 2026 from Kshs 2,217.8 bn recorded in December 2025. The table below outlines the performance of the Fund Managers comparing December 2025 and June 2026:
|
Fund Manager |
December 2025 AUM |
Market Share |
June 2026 AUM |
Market Share |
AUM Growth (December 2025 to June 2026) |
|
|
1. |
Genafrica Asset Managers Limited |
703.7 |
31.7% |
773.9 |
32.0% |
10.0% |
|
2. |
Co-optrust Investment Services Limited |
466.8 |
21.0% |
467.5 |
19.3% |
0.1% |
|
3. |
African Alliance Kenya Asset Management Limited |
320.4 |
14.4% |
397.6 |
16.5% |
24.1% |
|
4. |
Sanlam Investments East Africa Limited |
316.3 |
14.3% |
346.9 |
14.4% |
9.7% |
|
5. |
Old Mutual Investment Group Limited |
227.0 |
10.2% |
233.9 |
9.7% |
3.1% |
|
6. |
ICEA Lion Asset Management Limited |
103.3 |
4.7% |
110.0 |
4.6% |
6.5% |
|
7. |
CIC Asset Management Limited |
45.7 |
2.1% |
48.8 |
2.0% |
6.8% |
|
8. |
ABSA Asset Management Ltd |
9.8 |
0.4% |
11.7 |
0.5% |
19.8% |
|
9. |
NCBA Investment Bank Ltd |
8.8 |
0.4% |
9.8 |
0.4% |
12.3% |
|
10. |
Britam Asset Managers Kenya Limited |
7.7 |
0.3% |
5.8 |
0.2% |
(24.0%) |
|
11. |
Globetec Asset Management Limited |
5.1 |
0.2% |
4.8 |
0.2% |
(7.0%) |
|
12. |
Investcent Partners Limited |
0.7 |
0.0% |
1.7 |
0.1% |
151.7% |
|
13. |
Mayfair Asset Managers Limited |
0.8 |
0.0% |
1.0 |
0.0% |
32.3% |
|
14. |
Jubilee Asset Management Limited |
0.0 |
0.0% |
0.9 |
0.0% |
- |
|
15. |
Zimele Asset Management Company Limited |
0.8 |
0.0% |
0.8 |
0.0% |
9.7% |
|
16. |
Star Capital Management Ltd |
0.0 |
0.0% |
0.5 |
0.0% |
32645.2% |
|
17. |
Kuza Asset Management Limited |
0.3 |
0.0% |
0.4 |
0.0% |
27.3% |
|
18. |
Dry Associates Limited |
0.3 |
0.0% |
0.3 |
0.0% |
8.3% |
|
19. |
Cytonn Asset Managers Limited |
0.1 |
0.0% |
0.1 |
0.0% |
(5.9%) |
|
20. |
Lofty Corban Investments Limited |
0.1 |
0.0% |
0.1 |
0.0% |
25.1% |
|
21. |
Fusion Investment Management Limited |
0.0 |
0.0% |
0.0 |
0.0% |
13.1% |
|
22. |
Amana Capital Limited |
0.0 |
0.0% |
0.0 |
0.0% |
(38.7%) |
|
23. |
Genghis Capital Ltd |
0.0 |
0.0% |
0.0 |
0.0% |
(34.2%) |
|
24. |
VCG Asset Management Limited |
0.0 |
0.0% |
0.0 |
0.0% |
313.9% |
|
|
Total |
2,217.8 |
100.0% |
2,416.9 |
100.0% |
9.0% |
Source: RBA Industry Report
Key take-outs from the above table include:
-
Assets Under Management: The AUM recorded a 9.0% growth to Kshs 2,416.9 bn in June 2026, higher than the AUM of Kshs 2,217.8 bn in December 2025,
-
Growth: In terms of AUM growth, Star Capital Management Ltd recorded the highest growth of 32645.2% with its AUM increasing to Kshs 530.0 mn, from Kshs 1.6 mn in December 2025, attributable to the base effect. On the other hand, Amana Capital Limited recorded the largest decline with its AUM declining by 38.7% to Kshs 29.0 mn in December 2025, from Kshs 47.2 mn in December 2025,
-
Market Share: GenAfrica Asset Managers remained the largest overall Unit Trust with a market share of 32.0%, 0.3% points increase from 31.7% recorded in December 2025.
-
Assets Held by NSSF
The total assets held by NSSF increased by 33.0% on a year-on-year basis to Kshs 742.4 bn in June 2026 from Kshs 558.1 bn in June 2025, and by 19.0% from Kshs 623.8 in December 2025. This is attributable to increased contributions due to the implementation of the NSSF Act of 2013, with the total NSSF remitted contributions increasing by 38.5% to Kshs 81.9 bn in FY’2024/25 from Kshs 59.1 bn in FY’2023/24, while unremitted contributions decreased by 35.4% to Kshs 2.0 bn from Kshs 3.1 bn in June 2024 highlighting improved employer compliance. Notably, contributions to the NSSF increased by 12.3% to Kshs 48.8 bn in June 2026 from Kshs 43.5 bn in December 2025 and a 9.2% year on year growth from Kshs 44.7 bn in June 2025. Additionally, internally managed funds amounted to Kshs 56.1 bn while externally managed funds were Kshs 686.3 bn. The graph below shows the total Assets under Management of NSSF over the last 5 years:
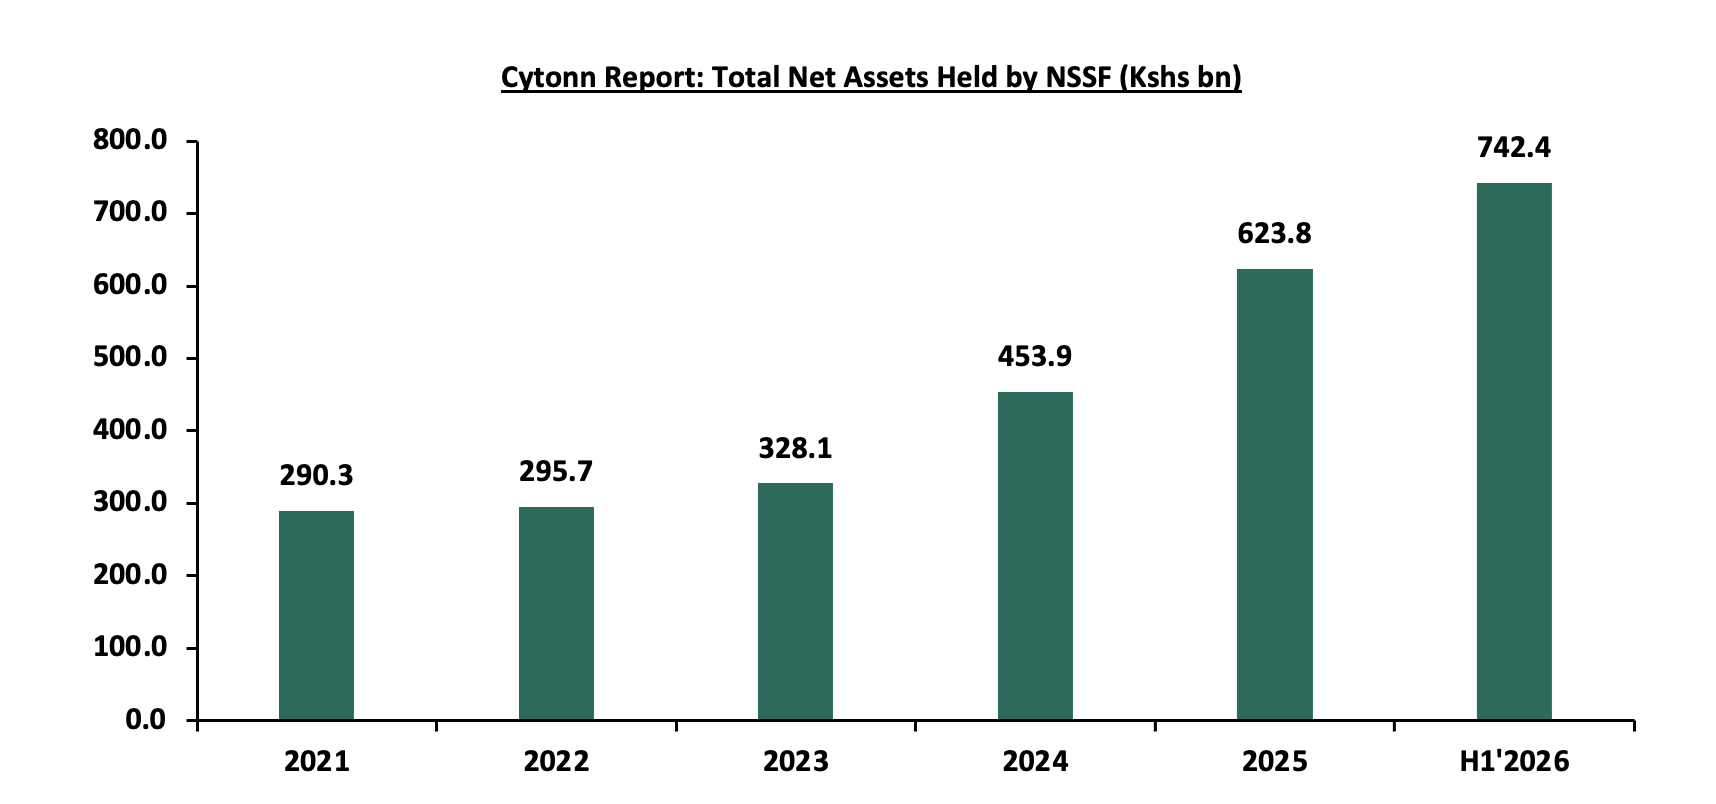
Source: RBA Industry Report
-
Total Pension Contributions
Total pension contributions in June 2026 came in at Kshs 165.3 bn, a 28.8% increase from the Kshs 128.3 bn in June 2025. Since the implementation of the NSSF Act, 2013 in February 2023, the total pension contributions have increased gradually from Kshs 133.0 bn in 2022 to Kshs 188.8 bn in 2023 and Kshs 285.4 in 2025. Notably, the total NSSF remitted contributions increased by 38.5% to Kshs 81.9 bn in FY’2024/25 from Kshs 59.1 bn in FY’2023/24, while unremitted contributions decreased by 35.4% to Kshs 2.0 bn from Kshs 3.1 bn in June 2024 highlighting improved employer compliance.
Contributions to Post-Retirement Medical Funds (PRMFs) increased by 34.1% to Kshs 220.7 bn in June 2026 from Kshs 164.6 bn in June 2025 . This growth is primarily attributed to an increasing number of retirement benefit schemes being established and commencing contributions to PRMFs to enhance member welfare post-retirement.
ii. Retirement Benefits Schemes Allocations and Various Investment Opportunities
Retirement Benefits Schemes aim to protect members’ savings while achieving competitive long-term returns by investing across various asset classes. Schemes have invested in traditional asset classes such as equities and fixed income securities, which offer a balance between risk and return. However, to enhance portfolio performance and diversify risk, they have increasingly explored alternative asset classes such as real estate, private equity, offshore funds and other non-traditional asset classes. Investing in alternative assets provides opportunities for higher returns, hedge against inflation and exposure to long-term growth sectors. The choice and proportion of these investments are determined by each scheme’s Investment Policy Statement (IPS), which sets out guidelines for risk tolerance, liquidity needs and return objectives. As such, the performance of Retirement Benefits Schemes in Kenya depends on a number of factors such as;
-
Asset allocation,
-
Selection of the best-performing security within a particular asset class,
-
Size of the scheme,
-
Risk appetite of members and investors, and,
-
Investment horizon.
The table below shows the AUM in the different asset classes in H1’2025 and H1’2026 and the change:
|
Cytonn Report: Kenyan Pension Funds’ Assets AUM (Kshs bn) |
||||||
|
Asset Category |
H1’2025 |
Market Share |
H1’2026 |
Market Share |
YoY Change (%) |
Market Share YoY % points change |
|
Government Securities |
1,329.3 |
52.5% |
1,495.3 |
46.4% |
12.5% |
(6.1%) |
|
Guaranteed Funds |
495.9 |
19.6% |
597.1 |
18.9% |
20.4% |
(0.7%) |
|
Quoted Equities |
255.2 |
10.1% |
439.3 |
14.4% |
72.1% |
4.3% |
|
Immovable Property |
235.6 |
9.3% |
258.0 |
13.2% |
9.5% |
3.9% |
|
Offshore |
84.0 |
3.3% |
105.0 |
3.4% |
25.0% |
0.1% |
|
Cash |
20.3 |
0.8% |
65.6 |
2.1% |
223.0% |
1.3% |
|
Fixed Deposits |
64.0 |
2.5% |
53.4 |
1.6% |
(16.6%) |
(0.9%) |
|
Commercial Paper, non-listed bonds by private companies* |
5.0 |
0.2% |
43.8 |
1.4% |
776.2% |
1.2% |
|
Private Equity |
20.1 |
0.8% |
43.1 |
1.4% |
114.4% |
0.6% |
|
Listed Corporate Bonds |
3.8 |
0.2% |
37.5 |
1.2% |
887.4% |
1.0% |
|
REITs* |
12.7 |
0.5% |
19.6 |
0.6% |
54.4% |
0.1% |
|
Unquoted Equities |
4.5 |
0.2% |
7.8 |
0.3% |
73.6% |
0.1% |
|
Infrastructure Debt Instruments |
- |
- |
0.8 |
0.0% |
- |
- |
|
Others e.g. Unlisted Commercial Papers |
0.3 |
0.0% |
0.7 |
0.0% |
136.7% |
0.0% |
|
TOTAL |
2,530.7 |
100% |
3,166.9 |
100.0% |
25.1% |
0.0% |
Source: RBA Industry Report
Key Take-outs from the table above are;
-
Government securities remained the highest allocated asset class, recording a 12.5% increase in AUM to Kshs 1,495.3 bn in H1’2026 from Kshs 1,329.3 bn in H1’2025. However, its market share declined by 6.1% points, to 46.4% from 52.5% in H1’2025. Additionally, quoted equities grew by 72.1% to Kshs 439.3 bn in H1’2026 from Kshs 255.2 bn in H1’2025 with its market share increasing by 4.3% points from 14.4% from 10.1% in H1’2025
-
Commercial paper and non-listed bonds by private companies grew significantly by 776.2% to Kshs 43.8 bn in H1’2026 from Kshs 5.0 bn in H1’2026 due to the growth of the Linzi Sukuk Bond value to Kshs 16.9 bn with a market share of 1.4%. Notably, investment in other assets increased by 136.7% to Kshs 0.7 bn from Kshs 0.3 bn, attributable to increased demand for specialized investment vehicles with Mansa-X Shariah Compliant Fund and SIB Najah Mansa-X Special Fund growing to Kshs 443.9 mn and Kshs 51.8 mn,
-
Listed corporate bonds increased significantly by 887.4% to Kshs 37.5 bn in H1’2026 from Kshs 3.8 bn in H1’2025 attributable to new issuances such as the LINZI 003 Infrastructure Asset‑Backed Security, which accounted for Kshs 18.0 bn in scheme investments at a fixed 15.0% return to fund the Talanta Sports Stadium. Further contributions came from I&M Bank 12.2% medium‑term note with Kshs 421.2 mn invested, and Safaricom’s medium‑term notes with Kshs 271.7 mn invested, expanding exposure to manufacturing and telecommunications. Consequently, the asset class’s market share increased by 1.0% points to 1.2% from 0.2% reflecting growing diversification into corporate debt instruments.
-
Fixed deposits declined by 16.6% to Kshs 53.4 bn in H1’2026 from Kshs 64.0 bn in H1’2025 with a market share of 1.6% from 2.5% in H1’2025. Additionally, cash increased significantly by 223.0% to Kshs 65.6 bn in H1’2026 from Kshs 20.3 bn in H1’2025 with a market share of 2.1% from 0.8% in H1’2025.
Performance of the Retirement Benefit Schemes
According to the ACTSERV Q2’2026 Pension Schemes Investments Performance Survey, the five-year average return for segregated schemes over the period 2022 to 2026 was 2.7% with the performance fluctuating over the years to a high of 6.6% in Q2’2024 and Q2’2025. Notably, segregated retirement benefits scheme returns recorded a 3.1% return in Q2’2026, down from the 6.6% gain recorded in Q2’2025. The y/y decline in overall returns was largely driven by the 4.8% points decrease in returns from Fixed Income to (0.8%) from a gain of 4.0% in Q2’2025 coupled with the 1.8% points decrease in Equities returns to 19.7% from a gain of 21.5% in Q2’2025. The chart below shows the quarterly performance of segregated pension schemes since 2022:
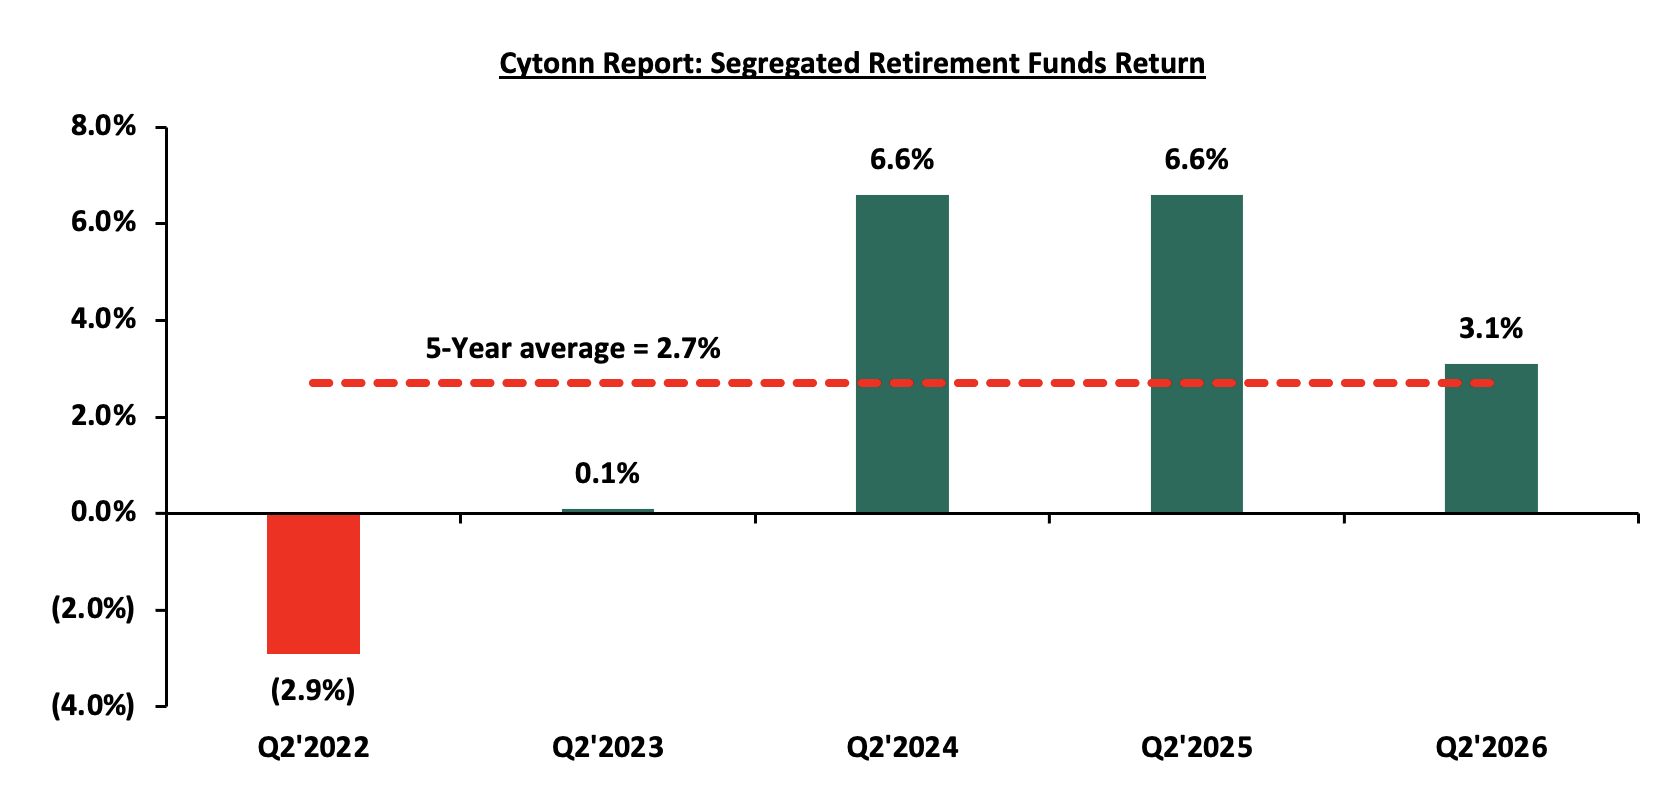
Source: ACTSERV quarterly surveys
The key take-outs from the graph include:
-
Schemes recorded a decrease of 3.5% points to 3.1% in Q2’2026 from the 6.6% gain recorded in Q2’2026. The performance was largely driven by a (0.8%) return in fixed income investments in comparison to the 4.0% gain recorded in Q2’2025, coupled with the 19.7% gain in equities investments in Q2’2026 compared to a gain of 21.5% in Q2’2025. Offshore assets registered increased returns, recording a 16.6% in Q2’2026, from the 13.1% gain recorded in Q2’2025, 3.5% points increase, and,
-
Returns from segregated retirement funds have exhibited significant fluctuations over the last five years, ranging from a high of 6.6% recorded in Q2’2024 and Q2’2025 to a low of (2.9%) in Q2’2022, highlighting the sensitivity of fund performance to market and economic conditions.
The survey covered the performance of asset classes in three broad categories: Fixed Income, Equity, Offshore, and Overall Return. Below is a table showing the second quarter performances over the period 2022-2026:
|
Cytonn Report: Quarterly Performance of Asset Classes (2022 – 2026) |
|||||||
|
|
Q2'2022 |
Q2'2023 |
Q2'2024 |
Q2'2025 (a) |
Q2'2026 (b) |
Average (Q2'2022-Q2'2026) |
% points change (b-a) |
|
Fixed Income |
1.5% |
0.7% |
8.0% |
4.0% |
(0.8%) |
2.7% |
(4.8%) |
|
Equity |
(15.4%) |
(4.3%) |
0.5% |
21.5% |
19.7% |
4.4% |
(1.8%) |
|
Offshore |
(17.3%) |
14.6% |
1.6% |
13.1% |
16.6% |
5.7% |
3.5% |
|
Overall Return |
(2.9%) |
0.1% |
6.6% |
6.6% |
3.1% |
2.7% |
(3.5%) |
Source: ACTSERV Surveys
Key take-outs from the table above include;
-
Returns from Fixed Income recorded a decline of 4.8% points to (0.8%) in Q2’2026 from the 4.0% gain recorded in Q2’2025. The change is mainly attributable to lower yields resulting from the easing of monetary policy. Fixed income has continued to offer stable returns with some volatility over the years, achieving its highest return in Q2’2024 and the lowest return in Q2’2026,
-
Notably, returns from Equity investments recorded a decrease by 1.8% points to a 19.7% gain in Q2’2026, from the 21.5% gain recorded in Q2’2025. The performance was partly attributable to attributable to attractive equity valuations, monetary policy easing, and moderating bond yields, which strengthened investor preference for equities over interest‑bearing assets, and,
-
Returns from the Offshore investments, recorded a gain of 3.5% in Q2’2026, to a 16.6% return from the 13.1% recorded in Q2’2025. The performance was partly attributable to majorly on the back gradual monetary policy easing by major central banks and strong corporate earnings, though the pace of easing remained gradual.
Section II: Factors Influencing the Growth of Retirement Benefit Schemes
The retirement benefit scheme industry in Kenya has registered significant growth in the past 10 years with assets under management growing at a CAGR of 13.2% to Kshs 2.8 tn in 2025, from Kshs 0.8 tn in 2015. Notably, the AUM increased by 25.1% to Kshs 3.2 tn in June 2026 from the Kshs 2.5 tn recorded in June 2025. The growth especially in the six months leading up to June 2026 was mainly attributable to:
-
Increased Pension Contributions - The growth of retirement benefit schemes in H1’2026 was supported by a significant increase in pension contributions. Total pension contributions reached Kshs 165.3 bn in June 2026, representing a 28.8% increase from Kshs 128.3 bn recorded in June 2025. The increase was attributed to the continued implementation of the NSSF Act, improved employer compliance and growth in active scheme membership. Higher contribution inflows provide retirement schemes with a larger pool of funds to invest, thereby supporting the growth of pension assets and improving the potential retirement benefits available to members,
-
Implementation of the NSSF Act and Higher contribution limits - The continued implementation of the National Social Security Fund Act, 2013 remained an important driver of pension-sector growth during H1’2026. From February 2026, the Year 4 contribution rates increased the Lower Earnings Limit to Kshs 9,000 and the Upper Earnings Limit to Kshs 108,000, resulting in higher mandatory contribution requirements for eligible employees and employers. The higher contribution limits have increased the amount being channeled towards retirement savings and are expected to strengthen pension adequacy over the long term. NSSF's total assets subsequently reached Kshs 742.4 bn by June 2026, while contributions to the Fund increased to Kshs 48.8 bn during the six months to June 2026
-
Growth in Post- Retirement Medical Fund Contributions - The establishment and continued funding of Post-Retirement Medical Funds (PRMFs) also contributed to the expansion of retirement-related savings. Contributions to PRMFs increased by 34.1% to Kshs 220.7 mn in June 2026, from Kshs 164.6 mn in June 2025. The increase indicates growing adoption of dedicated healthcare savings arrangements within retirement benefit schemes and provides members with an additional source of funding for healthcare expenses after retirement
-
Improved Investment Environment and Equity Market Performance – The investment environment during H1’2026 also supported the growth of pension assets, particularly through increased exposure to quoted equities. The increase in pension allocation to equities coincided with improved performance in the Kenyan capital markets. The improved market performance was supported by declining interest rates, stronger corporate earnings, dividend payouts and increased market activity following new listings. The stronger equity market provided pension schemes with an opportunity to benefit from capital appreciation and dividend income while diversifying their portfolios away from traditional fixed-income investments,
-
Increased Focus on Sustainable Investment Practices – The retirement benefits sector also witnessed increased regulatory attention towards sustainable investment practices during Q2’2026. In May 2026, the Retirement Benefits Authority published a Draft ESG Guidance Note for Retirement Benefits Schemes in Kenya, providing a framework for incorporating environmental, social and governance considerations into the management and investment of retirement assets. The development is relevant to pension schemes given their long-term investment horizon and growing exposure to diverse asset classes. Greater integration of ESG considerations could strengthen risk management, improve investment decision-making and encourage pension capital to support sustainable economic development.
Section III: Challenges that Have Hindered the Growth of Retirement Benefit Schemes
Despite the expansion of the Retirement Benefit industry, several challenges continue to hinder its growth. Key factors include:
-
Market Volatility – In segregated schemes, investment returns are not guaranteed and are subject to market fluctuations. A large portion of pension assets in Kenya are invested in fixed income instruments, particularly government securities. While these are traditionally considered stable, they are not immune to market fluctuations. For instance, in segregated schemes, investment returns are not guaranteed and are subject to market fluctuations. In Q2’2026, the returns in the fixed income market recorded returns of (0.8%), from a 4.0% gain in Q2’2025. This level of volatility introduces uncertainty in the growth of retirement savings. When interest rates fall, bond yields may fall but equity returns rise, affecting overall portfolio performance. Such volatility creates uncertainty in retirement savings growth,
-
Inadequate Contributions - Even when individuals are covered by retirement schemes, their contributions are often inadequate to meet future financial needs due to factors such as low disposable income, delayed enrolment in schemes and inadequate contribution rates. Insufficient contributions translate directly into lower payouts upon retirement. For retirees, this can result in financial insecurity, dependence on family or government assistance and inability to meet basic living expenses. Low contributions may be insufficient to sustain post-retirement life,
-
Premature Access to Savings – Members of individual pension schemes can withdraw 100.0% of their contributions, excluding any transferred employer contributions. In umbrella and occupational schemes, members can access up to 50.0% of their benefits before reaching retirement age, often due to job loss or changing employers. The RBA proposed a two-pot pension system where members can access a part of their pension savings during financial hardships such as education, housing and medical bills. While this provides short-term relief, it reduces the value of retirement savings, limiting the sector's growth potential,
-
Low Pension Coverage in the Informal Sector – The informal sector is a significant part of Kenya's economy but is marked by irregular incomes and job insecurity. Kenya’s informal sector employs over 83.0% of the workforce, yet most workers in this segment lack access to structured retirement savings plans. Unlike formal employees who are automatically enrolled in schemes like NSSF, informal workers often operate outside regulatory frameworks. The Retirement Benefit Statistical Digest 2025 reports that only Kshs 176.0 mn is under registered individual pension schemes. This number is low compared to the 18.1mn people in the informal sector, representing 83.8% of the total workforce. Many in this sector prioritize immediate financial needs over long-term savings, and traditional pension products may not meet their financial realities,
-
Continued Concentration in Government Securities – Despite increased diversification during H1’2026, government securities remained the largest asset class, accounting for 46.4% of total pension assets down from 52.5% in H1’2025. The continued high allocation exposes pension portfolios to interest-rate and sovereign risks and highlights the need for further diversification into other asset classes.
-
Low Allocation into Alternative Investments and Private Equity – There is limited allocation to alternative investments and private equity, despite their alignment with the long-term nature of retirement savings. These asset classes such as infrastructure, venture capital, and unlisted real estate offer the potential for higher returns, inflation hedging, and broader economic impact. However, pension schemes continue to favor traditional investments like fixed income and listed equities, largely due to regulatory conservatism, limited expertise in private markets, and perceived risk. This cautious approach restricts portfolio diversification and underutilizes the opportunity to channel pension capital into transformative sectors that could stimulate national development while enhancing member returns over time. Addressing this gap requires capacity building, regulatory support, and strategic partnerships to unlock the full potential of pension funds in alternative asset spaces. and,
Section IV: Recommendations to Enhance the Growth and Penetration of Retirement Benefit Schemes in Kenya
-
Encourage Further Portfolio Diversification – Pension schemes should continue diversifying their investment portfolios to enhance risk management and improve long-term returns. The decline in the allocation to government securities from 52.5% to 46.4% alongside increased allocations to equities, property, corporate bonds and private equity, indicates progress towards a more diversified investment approach. Schemes should maintain this momentum by strategically allocating funds across different asset classes while ensuring that investment decisions remain aligned with their risk appetite, liquidity requirements and long-term return objectives
-
Improve Contribution Adequacy- Pension schemes should continue encouraging members and employers to increase their contributions to improve retirement income adequacy. While total contributions have recorded strong growth, the level of savings may still be insufficient to provide members with adequate income during retirement. Schemes should therefore promote higher voluntary contributions, particularly among members with the capacity to save more, while strengthening financial education on the benefits of starting early and making consistent contributions throughout the working life.
-
Introduce Policy Reforms to Limit Premature Withdrawals – To safeguard long-term retirement savings, the percentage of pension funds accessible before retirement should be further reduced. Withdrawals should only be permitted in cases of genuine emergencies, such as critical illness, and must be supported by clear documentation and justification. Additionally, retirement schemes should provide educational workshops and materials to raise awareness about the long-term benefits of sustained savings and the financial risks associated with early withdrawals. Incentives such as loyalty bonuses, employer matching contributions, and enhanced tax relief for retained benefits can further motivate individuals to maintain their savings over the long term.
-
Adoption of Flexible Contribution Models in the Informal Sector – Traditional monthly contribution structures are often impractical for individuals whose earnings fluctuate daily or seasonally. Pension products should therefore allow for micro-contributions, daily, weekly, or even seasonal payments, through accessible platforms like mobile money. Schemes such as the Mbao Pension Plan have demonstrated the viability of this approach, enabling contributors to save as little as Kshs 20.0 per day. However, broader awareness and integration with other financial services are needed to scale these models.
-
Increase Allocation to Alternative Investments – alternative investments such as real estate, infrastructure and private equity then to have long-term investment horizons, usually in decades, and more stable and higher returns hence more suited to pension funds. However, allocation to these assets class is very low. It would help with returns and stability if retirement schemes increased their allocation to these asset classes.
-
Incorporating Post-Retirement Medical Funds (PRMFs) into pension schemes – Pension schemes should place greater emphasis on healthcare planning as part of retirement preparedness, given the potential for medical expenses to significantly erode retirement savings. The 34.1% increase in PRMFs contributions to Kshs 220.7 mn by June 2026 from 164.6 mn in June 2025 highlights growing attention towards post-retirement medical needs. Schemes should therefore continue promoting post-retirement medical funds alongside conventional retirement savings and provide members with greater awareness of the importance of building dedicated healthcare reserves to support financial security during retirement.
Implementing these recommendations will be instrumental in fostering the sustainable expansion of Kenya’s retirement benefits sector. By addressing the underlying structural challenges that have long hindered progress, the industry can move toward a more inclusive and resilient future. This transformation will help build public confidence in pension systems, encouraging broader participation across both formal and informal employment segments.
Disclaimer: The views expressed in this publication are those of the writers where particulars are not warranted. This publication, which follows Section 2 of the Capital Markets Authority Act Cap 485A, is meant for general information only and is not a warranty, representation, advice or solicitation of any nature. Readers are advised in all circumstances to seek the advice of a registered investment advisor.

- Talk to us
- Kenya
- P.O Box 20695 - 00200, Nairobi, Kenya
- Cell +254709101200
- Tel +254709101200
- WhatsApp +254741676635
- United States
- +254709101200
- DOWNLOAD OUR APP
-


- Kenya
- 8th Floor, Pinetree Plaza, Kaburu Drive, Ngong Road, Nairobi, Kenya
- USA
- Suite 1150, 1775 Eye Street NW, USA, Washington DC 20006, USA
- Investments
- High Yield
- Private Equity
- Real Estate
- Real Estate
- RiverRun Estates
- Cytonn Towers
- The Ridge
- Taraji Heights
- The Alma