Safaricom’s 44% of NSE Market Cap. and Portfolio Construction, & Cytonn Weekly #50/2017
By Cytonn Research Team, Dec 17, 2017
Executive Summary
Fixed Income
Treasury bills were still undersubscribed this week with the overall subscription rate at 73.7%, compared to 79.5% recorded the previous week. The yields on the 91, 182 and 364-day papers remained unchanged at 8.0%, 10.5% and 11.1%, respectively. The United States Federal Open Market Committee (FOMC) raised the Fed rate to a band of 1.25% - 1.50% from 1.00% - 1.25%, previously, in line with our expectations;
Equities
During the week, the equities market was on a downward trend with NASI, NSE 25 and NSE 20 losing 1.8%, 1.5% and 1.1%, respectively, taking their YTD performance to 29.1%, 22.0% and 16.4% for NASI, NSE 25 and NSE 20, respectively. During the week, the World Bank called for the reversal of the Banking (Amendment) Act, 2016, that has been in effect for a year now, due to the negative effect it has had on private sector credit growth, which has declined from a high of 25.8% as at June 2014, to a low of 1.4% as at July 2017, and came in at 2.0% in October 2017;
Private Equity
Shortlist, a tech firm which offers talent sourcing, screening and shortlisting services to corporates, has acquired the entire shareholding of Nairobi-based talent development firm, Spire Education, for an undisclosed amount. Berkeley Energy, a renewable energy firm focused on investments in Sub-Saharan Africa and Asia, has received Kshs 2.0 bn in equity funding for an undisclosed stake from the International Finance Corporation (IFC);
Real Estate
The Kenyan Government continues its initiatives to boost real estate, as it announced the roll out of an ambitious plan towards reducing the housing deficit by 25.0% from the current 2.0 mn units to 1.5 mn units. This is set to be achieved by encouraging the construction of residential units through initiatives such as subsidizing mortgages and reduction of licencing fees for developers. In the hospitality sector, Kenya was voted the world’s top Safari destination during the World Travel Awards (WTA) held in JW Marriott Hotel in Phu Quoc, Vietnam;
Focus of the Week
With Safaricom currently accounting for 44.0% of the total market capitalization of the Nairobi Securities Exchange (NSE), we examine the evolution of Safaricom’s share price and market capitalisation, its effect on the performance of the NSE, its performance in comparison to other listed Telcos in Sub Saharan Africa, and how it is likely to affect portfolio construction decisions.
- On 15th December 2017, we held our annual Cytonn Young Leaders Programme (CYLP) Alumni get together. The annual get together is one of the activities we have in place to nurture networks and community for CYLP alumni. See event note here
- On Thursday, 14th December 2017, we held the annual thanks giving lunch for laborers at our construction sites, The Alma and The Ridge, our real estate projects in Ruaka and Ridgeways, respectively. The annual events are aimed at appreciating the devotion and effort of the site employees throughout the year. See event note here
- Our Investment Manager, Maurice Oduor discussed the key economic highlights from the president’s speech during the Jamhuri day celebration. Watch Maurice on Citizen Television here
- Our Investment Analyst, John Ndua, discussed the performance of the Nairobi Securities Exchange (NSE) this year, in comparison to its peers i.e. the Nigerian Stock Exchange and the Johannesburg Stock Exchange. Watch John Ndua on CNBC here
- We continue to showcase our real estate developments through weekly site visits. Watch progress videos and pictures of The Alma, Amara Ridge, The Ridge, and Taraji Heights. The site visits target both investors looking to invest in real estate directly and those interested in high yield investment products to familiarize themselves with how we support our high yields. Key to note is that our cost of capital is priced off the loan markets where all-in pricing ranges from 16.0% to 21.0% and our yield on real estate developments ranges from 23.0% to 25.0%, hence our top-line gross spread is about 6.0%. If interested in attending the site visits, kindly register here
- We continue to see very strong interest in our Private Wealth Management training (largely covering financial planning and structured products), which is at no cost, and is held bi-weekly, but is open only to pre-screened participants. We also continue to see institutions and investment groups interested in the trainings for their teams. The Wealth Management Trainings are run by the Cytonn Foundation under its financial literacy pillar, and if interested in the training for your employees or investment group please get in touch with us through clientservices@cytonn.com or book through this link Wealth Management Training. To view the wealth management training topics click here
- For recent news about the company, see our news section here
- We have 10 investment-ready projects, offering attractive development and buyer targeted returns of around 23.0% to 25.0% p.a. See further details here: Summary of investment-ready projects
- To invest in any of our current or upcoming real estate projects, please visit Cytonn Real Estate
- Cytonn Towers, where we are only selling residential units in the first phase of residential apartments, is currently about 20.0% sold. See Cytonn Towers
- The Alma, which is 55.0% sold. See The Alma
- Amara Ridge has currently 100.0% uptake See Amara Ridge
- Situ Village is currently 22.0% sold. See Situ Village
- The Ridge (Phase 1) is currently 31.0% sold. See The Ridge
- Taraji Heights is currently 14.0% sold. See Taraji Heights
- RiverRun Estates (Phase 1) is currently 11.0% sold. See RiverRun Estates
- With over 10 investment ready projects worth over Kshs 82.0 billon of project value, we shall be very selective on new real estate projects going forward, only focusing on Joint Ventures and real estate opportunities with deep value. We are increasingly focused on private equity deals. Should you have any deals in banking, insurance, education, hospitality and technology sectors, kindly email a teaser to PE@cytonn.com
- We continue to beef up the team with ongoing hires for a Senior Manager, Hospitality and Hospitality Business Manager, among others. Visit our website Careers at Cytonn to apply.
During the week, T-bills were undersubscribed, with the overall subscription rate dropping to 73.7%, from 79.5% recorded the previous week, due to investors shifting their interest towards the two re-opened bonds, FXD 1/2008/15 and FXD 1/2017/10, whose combined performance came in at 73.0%. The subscription rates for the 91, 182 and 364-day papers came in at 36.7%, 77.8%, and 84.3% compared to 125.5%, 64.2%, and 76.4%, respectively, the previous week. Yields on the 91, 182 and 364-day papers remained unchanged at 8.0%, 10.5% and 11.1%, respectively. The overall acceptance rate came in at 82.3%, compared to 94.9% the previous week, with the government accepting a total of Kshs 14.6 bn of the Kshs 17.7 bn worth of bids received, against the Kshs 24.0 bn on offer. The government is still behind its domestic borrowing target for the current fiscal year, having borrowed Kshs 75.4 bn, against a target of Kshs 189.3 bn (assuming a pro-rated borrowing target throughout the financial year of Kshs 410.2 bn budgeted for the full financial year).
Last week, the Kenyan Government re-opened two bonds, a 15-year (FXD 1/2008/15) and a 10-year (FXD 1/2017/10) with effective tenors of 5.3 years and 9.6 years and coupons of 12.5% and 13.0%, respectively, in a bid to raise a total of Kshs 30.0 bn for budgetary support. The weighted average accepted yields on the bonds came in at 12.6% and 13.1% compared to the market weighted average yield of 12.7% and 13.2%, respectively. Despite being undersubscribed with a subscription rate of 73.0%, with Kshs 21.9 bn bids received compared to Kshs 30.0 bn on offer, the low acceptance rate of 45.9% (Kshs 10.0 bn was accepted compared to Kshs 21.9 bn received) is an indication that the government is not accepting expensive money despite remaining behind target in its borrowing.
According to the Quarterly Economic and Budget Review for the first quarter of the Fiscal Year (FY) 2017/18, the Kenyan Government has only borrowed 43.8% of its first quarter foreign borrowing target, having borrowed Kshs 7.5 bn of the targeted Kshs 17.0 bn. This week, the government signed a new 8-year commercial loan of Kshs 77.0 bn from the Eastern and Southern Africa Trade and Development Bank (TDB), formerly PTA Bank, at 6.7% above the 6-month London Interbank Offer Rate (Libor), currently at 0.6% to pay off debt holders of the 2015 syndicated loan, who declined to extend maturity. As at 1st December 2017, the Treasury had drawn Kshs 40.7 bn from its overdraft facility with the Central Bank of Kenya (CBK), the highest level since Kshs 44.2 bn in July 2016 as they bridge the cash flow deficit from the current borrowings and revenue collections. The government exceeded the first quarter of the FY’2017/18 spending targets for both recurrent and development expenditure at 102.4% and 102.9% absorption rates, respectively, which may trigger increased domestic borrowing to meet expenditure requirements. The total revenue collections for that quarter stood at Kshs 345.6 bn compared to the target of Kshs 388.0 bn, indicating that 89.1% of the target was met. This suggests that there exists possible upward pressure on interest rates as the government seeks to bridge the gap.
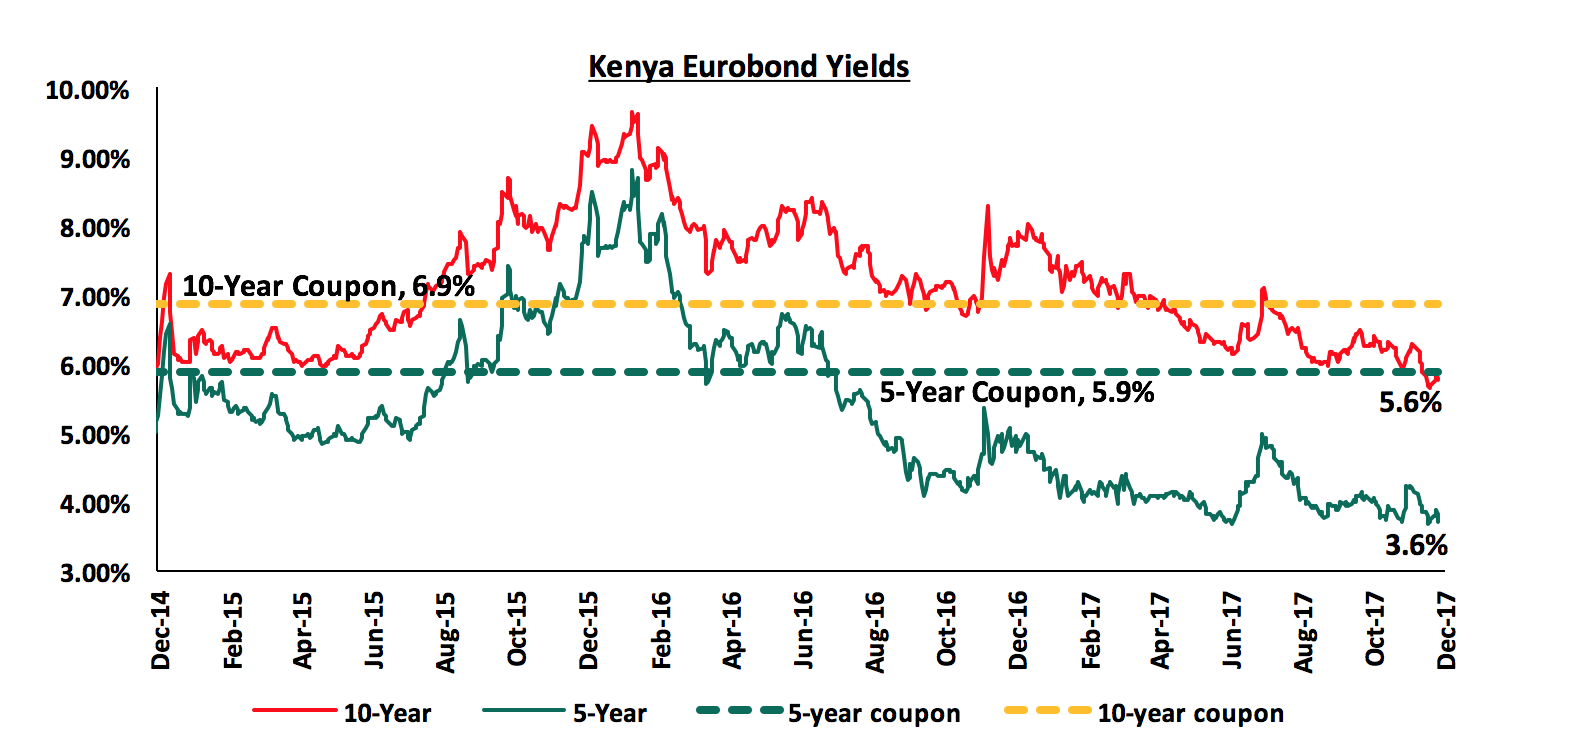
According to Bloomberg, yields on the 5-year and 10-year Eurobonds declined by 0.2 percentage points during the week, to close at 3.6% and 5.6%, respectively. Since the mid-January 2016 peak, yields on the Kenya Eurobonds have declined by 5.2% points and 4.0% points for the 5-year and 10-year Eurobonds, respectively, due to the relatively stable macroeconomic conditions in the country. The declining Eurobond yields and stable rating by Standard & Poor (S&P) are indications that Kenya’s macro-economic environment remains stable and hence an attractive investment destination. However, concerns from Moody’s and the International Monetary Fund (IMF) around Kenya’s rising debt to GDP levels may see Kenya receive a downgraded sovereign credit rating.
The Kenya Shilling depreciated marginally against the US Dollar, by 0.3%, during the week to close at Kshs 103.2 from Kshs 103.0, last week, even with forex trade activity and dollar demand from oil importers remaining low. On a year to date basis, the shilling has depreciated against the dollar by 0.7%. In our view, the shilling should remain relatively stable against the dollar in the short term supported by (i) expected calm in the political front as the government settles into office, (ii) the weakening of the USD in the global markets as indicated by the US Dollar Index, which has shed 8.3% year to date from 8.0% last week; this indicating that the dollar weakened further during the week even after the Federal Reserve decided to hike rates because the third rate hike of the year was already priced in by the market and the number of rate hikes expected in 2018 did not change since the last meeting, and (iii) the CBK’s intervention activities, as they have sufficient forex reserves, currently at USD 7.1 bn (equivalent to 4.8 months of import cover).
The United States Federal Open Market Committee (FOMC) met on 12th and 13th December 2017 to assess the current state of the US economy and shed light on a possible rate hike. The committee decided to hike the rate to a band of 1.25% - 1.50% from 1.00% - 1.25%, previously, in line with our expectations as highlighted in our Cytonn Weekly #49/2017. The decision was supported by (i) a strong labour market, leading to increased household spending, with 228,000 new jobs added in November, in addition to the 261,000 new jobs in October, despite the unemployment rate remaining at 4.1% in November, below the full employment target of 5.0%, and (ii) relatively strong annual economic growth, which came in at 2.3% in Q3’2017 compared to 2.8% in Q3’2016, and projections of 2.5% GDP growth in 2018 from 2.1% previously. This was the third rate hike of the year by the Fed, in line with indications that three rate hikes should be expected in 2017, at the beginning of the year. Three more hikes are expected in 2018, according to the FOMC, supported by expected improved US economic growth in 2018.
Rates in the fixed income market have remained stable, and we expect this to continue in the short-term as the government rejects expensive bids despite being behind their borrowing target. However, a budget deficit that is likely to result from depressed revenue collection creates uncertainty in the interest rates environment as any additional borrowing in the domestic market to plug the deficit could lead to upward pressures on interest rates. Our view is that investors should be biased towards short-to medium term fixed income instruments to reduce duration risk.
During the week, the equities market was on a downward trend with NASI, NSE 25 and NSE 20 losing 1.8%, 1.5% and 1.1%, respectively, taking their YTD performance to 29.1%, 22.0% and 16.4% for NASI, NSE 25 and NSE 20, respectively. This week’s performance is attributable to losses of large cap stocks such as Safaricom and Equity Group, which lost 3.6% and 1.8%, respectively. Since the February 2015 peak, the market has lost 3.0% and 32.6% for NASI and NSE 20, respectively.
Equities turnover increased by 15.0% to USD 37.6 mn from USD 32.7 mn the previous week. Foreign investors turned net sellers with a net outflow of USD 2.7 mn compared to a net inflow of USD 3.3 mn recorded the previous week. We expect the market to remain supported by improved investor sentiment once the political uncertainty dissipates, as investors take advantage of the attractive stock valuations.
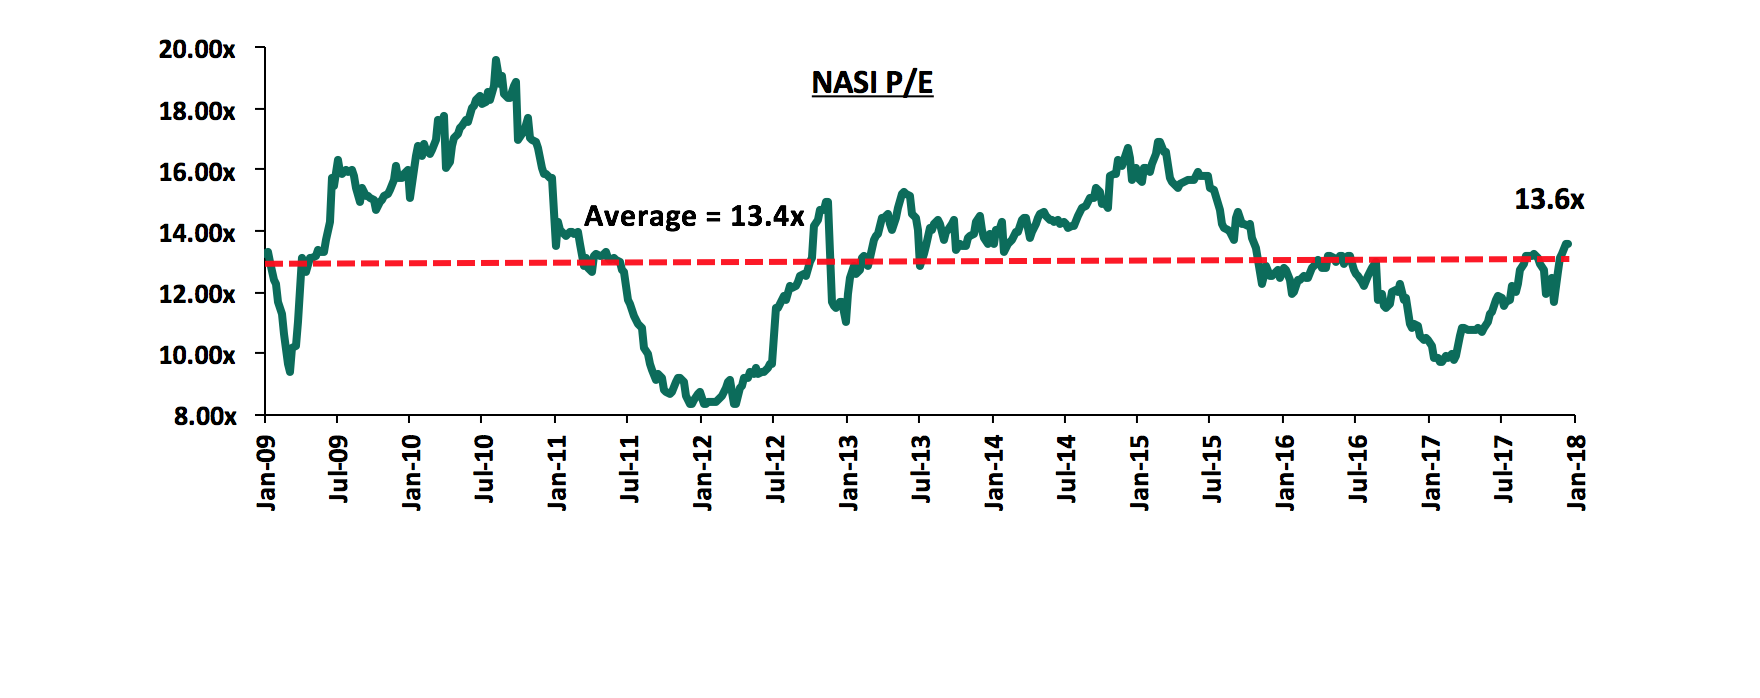
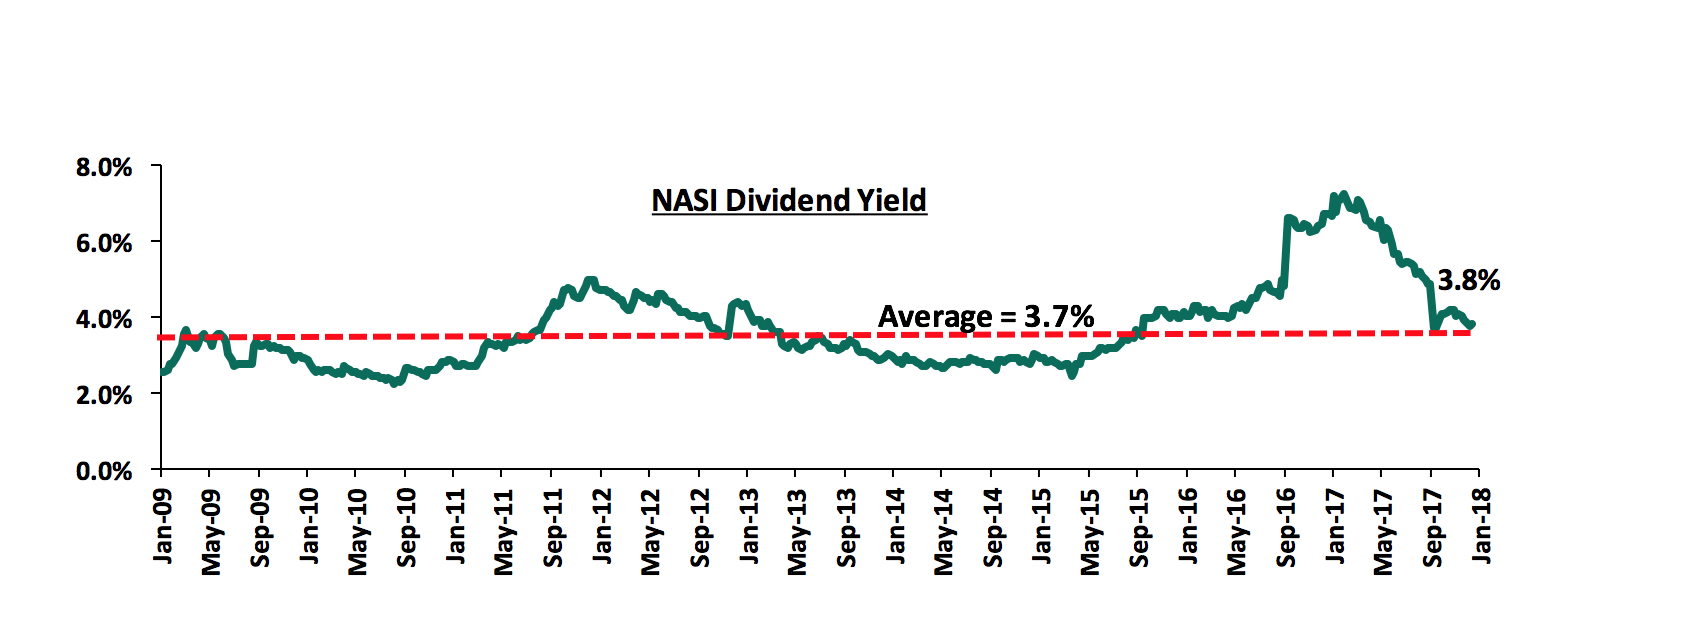
The market is currently trading at a price to earnings ratio (P/E) of 13.6x, above the historical average of 13.4x, and a dividend yield of 3.8%, compared to a historical average of 3.7%. In our view, there still exist pockets of value in the market, with the current P/E valuation being 19.6% below the most recent peak of 16.9x in February 2015. The current P/E valuation of 13.6x is 40.2% above the most recent trough valuation of 9.7x experienced in the first week of February 2017, and 63.7% above the previous trough valuation of 8.3x experienced in December 2011. The charts below indicate the historical P/E and dividend yields of the market.
During the week, the World Bank called for the reversal of Kenya’s law on interest rate capping but accompanied with more policy reforms that will improve access to credit and financial inclusion. This is in line with our view as highlighted in our Cytonn Weekly #37/2017 that a reversal of the rate caps regime is crucial, but should be accompanied with specific actions around consumer protection and improved competition to ensure banks remain disciplined in pricing of loans. Despite the positive intention behind the Banking (Amendment) Act, 2015 it has not achieved its intended goal, which was to improve lending to the consumer by making credit affordable, but so far the cap has curtailed lending as evidenced by: (i) the declining private sector credit growth from a high of 25.8% as at June 2014 to a low of 1.4% as at July 2017 and came in at 2.0% in October 2017, and (ii) a decline in total amounts of commercial banks loan growth, with listed banks recording a loan growth of 6.3% in Q3’2017, compared to 5-year average loan growth of 14.6%. Fitch, a global rating agency, has previously termed the law as unusual in that it is a blanket rate cap on all loans unlike in other markets where rate caps typically apply only to specific segments, such as retail lending, generally for the purpose of consumer protection. This push comes after the Central Bank of Kenya (CBK) expressed interest to have this law reversed and go back to a regime where interest rates are freely determined, but in a disciplined commercial banking environment. In our view, the following specific actions will ensure banks remain disciplined in pricing of loans:
- Establishment of a strong consumer protection agency to specifically develop and enforce a consumer protection framework for the financial services sector,
- Establishment of a specialized tribunal that shall specifically handle consumer financial services matters and complaints, and,
- Development of capital markets and alternative sources of funding to bring down the 95% business funding dominance by banks compared to 40% business funding by banks in developed markets, in order to spur private sector growth.
For a detailed analysis of the specific actions around consumer protection, see our Cytonn Weekly #37/2017
In order to ensure that the ranking of companies in the Cytonn Corporate Governance Report (CGR) is up to date, we continually update the rankings whenever there are changes on any of the 24 metrics that we track and how they impact on the ranking. During the week, Kenya Power voted in Mr. Mahboub Maalim as the new Chairman of the Board, following the retirement of Mr. Kenneth Marende. The company also appointed Mrs. Zipporah Kering to the Board as a Non-Executive Director. Following these changes, the gender diversity score improved to 20.0% from 18.2%, the ethnic diversity score declined to 40.0% from 33.3% but the scores of the two metrics however maintained at 0.5. The Board composition declined to a score of 0.5 as a result of increase in the board members to an even number of 10 from an odd number of 9. Kenya Power’s score therefore declined slightly to 77.1% from 79.2% and thus the rank declined to Position 14 from Position 13.
Below is our Equities Universe of Coverage:
|
all prices in Kshs unless stated otherwise |
|||||||||
|
No. |
Company |
Price as at 08/12/17 |
Price as at 15/12/17 |
w/w Change |
YTD Change |
Target Price* |
Dividend Yield |
Upside/ (Downside)** |
|
|
1. |
NIC*** |
36.0 |
35.5 |
(1.4%) |
36.5% |
61.4 |
3.5% |
76.4% |
|
|
2. |
KCB Group*** |
42.3 |
42.0 |
(0.6%) |
46.1% |
59.7 |
7.1% |
49.2% |
|
|
3. |
DTBK |
192.0 |
191.0 |
(0.5%) |
61.9% |
281.7 |
1.4% |
48.9% |
|
|
4. |
Barclays |
9.8 |
9.8 |
0.0% |
15.6% |
12.8 |
10.2% |
40.8% |
|
|
5. |
I&M Holdings |
122.0 |
120.0 |
(1.6%) |
33.3% |
150.4 |
2.5% |
27.8% |
|
|
6. |
Liberty |
12.4 |
12.9 |
4.0% |
(2.3%) |
16.4 |
0.0% |
27.1% |
|
|
7. |
Kenya Re |
20.3 |
20.0 |
(1.2%) |
(11.1%) |
24.4 |
3.7% |
25.8% |
|
|
8. |
Jubilee Insurance |
469.0 |
470.0 |
0.2% |
(4.1%) |
575.4 |
1.9% |
24.3% |
|
|
9. |
Co-op Bank |
16.0 |
16.0 |
0.0% |
21.2% |
18.6 |
5.8% |
22.0% |
|
|
10. |
Britam |
14.9 |
14.0 |
(5.7%) |
40.0% |
15.2 |
1.5% |
10.1% |
|
|
11. |
Sanlam Kenya |
30.0 |
28.8 |
(4.2%) |
4.5% |
31.4 |
1.0% |
10.1% |
|
|
12. |
HF Group*** |
11.3 |
10.8 |
(4.4%) |
(23.2%) |
11.7 |
0.8% |
9.8% |
|
|
13. |
Equity Group |
41.0 |
40.3 |
(1.8%) |
34.2% |
42.3 |
4.4% |
9.5% |
|
|
14. |
CIC Group |
5.6 |
5.8 |
4.5% |
52.6% |
6.2 |
1.8% |
8.7% |
|
|
15. |
StanChart |
211.0 |
206.0 |
(2.4%) |
9.0% |
201.1 |
4.2% |
1.8% |
|
|
16. |
Stanbic Holdings |
82.0 |
82.0 |
0.0% |
16.3% |
79.0 |
5.1% |
1.4% |
|
|
17. |
Safaricom |
27.8 |
26.8 |
(3.6%) |
39.7% |
23.0 |
4.7% |
(9.3%) |
|
|
18. |
NBK |
9.8 |
9.6 |
(1.5%) |
33.3% |
5.6 |
0.0% |
(42.0%) |
|
|
*Target Price as per Cytonn Analyst estimates |
|
|
|
|
|
||||
|
**Upside / (Downside) is adjusted for Dividend Yield |
|||||||||
|
***Banks in which Cytonn and/or its affiliates holds a stake |
|||||||||
|
For full disclosure, Cytonn and/or its affiliates holds a significant stake NIC Bank, ranking as the 9th largest shareholder |
|||||||||
We maintain a “NEUTRAL” view on equities for investors with short-term investment horizon since, despite the lower earnings growth prospects for this year, the market has rallied and brought the market P/E back to its’ historical average. Pockets of value exist, with a number of undervalued sectors like Financial Services, which provide an attractive entry point for long-term investors and thus we are positive for investors with a long-term investment horizon.
On the acquisitions front, Nairobi based Shortlist, a tech firm which offers talent sourcing, screening and shortlisting services to corporates, has acquired Nairobi-based talent development firm, Spire Education, for undisclosed amounts. Both firms will however retain their brands. The acquisition was funded by investment from Blue Haven Initiative, a US based private equity fund, which focuses on investments in Sub Saharan Africa, driven by the high growth prospects in Africa as compared to other regions returns in the region. Blue Haven has invested across sectors, with its notable investments in Kenya including investments in as Karibu Homes, M-Kopa Solar, and Twiga Foods. Spire Education is a talent development company that works with employers to design world-class learning programs that enable employees to cultivate the skills such as communication, problem solving and leadership that are essential for success on the job. Earlier this year, Shortlist received Kshs 103.0 mn seed funding from US-based private equity firm University Ventures. The acquisition is strategic for Shortlist as it will now offer (i) talent sourcing services, (ii) screening and shortlisting, (iii) hiring, and (iv) training, which will be provided by Spire, all on one platform. It also gives Shortlist a chance expands its client base by leveraging on Spire Education’s already established networks.
Berkeley Energy, a renewable energy firm focused on investments in Sub-Saharan Africa and Asia, has received Kshs 2.0 bn in equity funding from the International Finance Corporation (IFC). The funding from IFC is meant to boost Berkeley’s first fund, the USD 200.0 mn (Kshs 20.6 bn) Africa Renewable Energy Fund (AREF), which invests in viable wind, hydro, geothermal, biomass and solar projects. Through the fund, the firm whose Sub-Saharan Africa Operations are headquartered in Nairobi, has invested in the 1,000 MW Corbetti Geothermal Project in Southern Ethiopia. The investment indicates continued investor interest in Africa. Investor interest in the renewable energy sector is mainly driven by projected demand for renewable energy, informed by the fact that (i) only 30% of the African population have access to power, and (ii) 315 mn rural citizens are expected to get access to electricity by 2040, with 70% of this population expected to get connected through off-grid systems such as solar power. The investment in M-Kopa also highlights foreign investor interest in Africa driven by expected economic projections in Sub Sahara Africa, which is expected to be better compared to global markets.
Private equity investments in Africa remains robust as evidenced by the growing number of successful exits. The increasing investor interest is attributed to (i) rapid urbanization, a resilient and adapting middle class and increased consumerism, (ii) the attractive valuations in Sub Saharan Africa’s private markets compared to its public markets, (iii) the attractive valuations in Sub Saharan Africa’s markets compared to global markets, and (iv) better economic projections in Sub Sahara Africa compared to global markets. We remain bullish on PE as an asset class in Sub-Sahara Africa. Going forward, the increasing investor interest and stable macro-economic environment will continue to boost deal flow into African markets.
During the week, the Kenyan Government announced an ambitious plan to reduce the housing deficit in the country by 25%, from the estimated 2.0 mn units to 1.5 mn units, by facilitating the construction of 500,000 houses in the next 5-years. The government plans to achieve this through several initiatives, which include: (i) reduction of mortgage costs, though details regarding the percentages have not been disclosed (In December 2015, the government subsidized the mortgage rates for civil servants from market rates of about 14.5% to 5.0% p.a. on reducing balance), (ii) cutting down of construction costs through utilization of innovative construction methods and alternative building technologies, and (iii) reduction of licenses and fees at a County and National level such as the land search fees, which were waived completely, as well as NEMA and NCA submission fees. The government plans to collaborate with private developers, co-operatives, financial institutions and building materials manufacturers to deliver this. This is the latest move by the government following previous initiatives undertaken to mitigate the housing deficit, which include: (i) the digitization of the lands ministry, and (ii) the announcement of a 15% tax cut for developers constructing more than 100 units p.a. Still in their nascent stages of implementation, the effect of the aforementioned regulations in the market is yet to be felt, but in our view, the active involvement by the government to solve challenges in the real estate sector is a move in the right direction. If successfully implemented, the measures will ease transactions in the real estate sector, reduce development costs and consequently increase the affordability of real estate and housing in the country, which currently stands at 66 out of a requisite 100 according to our Mortgage Affordability Index Report 2017. Generally, an index value of 100 or more means the incomes earned by the residents are sufficient to cater for purchasing a house using a mortgage, and a value of less than 100 indicates that mortgages are unaffordable by the population, as is the case in Kenya. The main issue will be how each of the above initiatives shall be actualized as the steps towards it are yet to be released
The Nairobi County Assembly amended the zoning regulations by-laws to allow for densification in some of Nairobi’s high-end suburbs. The suburbs affected are those in Zone 4, consisting of areas such as Spring Valley, Kileleshwa and Riverside Drive, Zone 5 areas like Kyuna, Loresho, Lavington and Upper Spring Valley, and Dagoretti in Zone 15. The zones selected have experienced increased investment in infrastructure including roads and sewerage and are thus capable of accommodating larger populations. In our opinion, this is a move in the right direction as the relaxed zoning will:
- Open up the areas for further real estate development – this is as developers will be able to develop a variety of concepts on the land such as high-rise apartments and commercial buildings; previously development in these suburbs was restricted to stand alone houses and low-rise apartments;
- Increase the affordability of housing in the zones – This is as the number of houses per unit of land will be higher and thus units can be lower in prices; The impact of the increase in land prices will be reduced due to higher number of units as a result of densification;
- Increase the property values in these estates as more value will be able to be derived per unit of land. This was seen in other suburbs such as Kilimani where following relaxation of zoning regulations, land prices have increased by a 5-year CAGR of 17.7%, between 2011 and 2016 as per Cytonn Land Report 2017;
- Reduce the housing shortage in the country by facilitating the development of more houses, and;
- Reduce congestion in the CBD and other estates surrounding the rezoned estates as well as the rise of new business districts. This is due to a shift in population to the newly zones estates. For instance, rezoning of Upperhill and Kilimani enabled companies to migrate to these areas, which have now emerged as new business districts following congestion in the CBD.
However, further infrastructural development should be undertaken in these areas to prevent human and traffic congestion in the newly rezoned suburbs and thus a reduction in the allure of the upper middle income status they currently have.
In the hospitality sector, Kenya was named the world’s top Safari destination during the World Travel Awards held in Phu Quoc Emerald Bay Hotel, Vietnam, ahead of regional competitors such as Botswana, South Africa, Tanzania, Namibia, Zimbabwe, and Uganda. This marks the fourth time Kenya has won the accolade after emerging top in 2016, 2015 and 2013. Other awards won during the event were: i) Africa’s leading National Park, which went to Maasai Mara National Reserve, and ii) Africa’s leading Tourist Board, won by the Kenya Tourism Board (KTB).
Despite a challenging operating environment in the second half of 2017, Kenya’s tourism sector has been on the world map in 2017, with other awards won in the year being:
- Africa’s leading national park, which was won by Maasai Mara National Reserve at the World Travel Awards - Africa Gala 2017;
- Africa’s Leading Tourism Board won by the Kenya Tourism Board (KTB) for the 6th year running at the World Travel Awards - Africa Gala 2017;
- Africa’s luxury adventure destination and luxury tented safari camp won by Sarova Mara Game Camp Hotel in Maasai Mara at the World Luxury Hotels Awards 2017;
- Best luxury hotel in the continent and the luxury spa resort won by The Sarova Stanley and the Sarova Whitesands Beach Resorts, respectively, at the World Luxury Hotels Awards 2017.
In our view, the increased number of international awards accorded to the Kenyan hospitality industry will market it globally increasing the number of arrivals which despite a slowdown between 2011 and 2015 due to security concerns picked up in 2016, increasing by 13.4% y/y. In 2017 the performance was upbeat in the first half with arrivals increasing by 16.7% between January and July compared to a 14.0% increase over the same period in 2016, slowing down in the second half due to the extended electioneering period. We thus have a positive outlook for the hospitality sector for 2018, supported by an increase in international arrivals, increased domestic tourism as Kenyans accounted for 54.2% of total bed nights in 2016 compared to 53.7% in 2015 and continued marketing by the KTB of Kenya as not just a Safari destination but also a Business Tourism and MICE destination which resulted in the number of business travellers increasing by 13.9% from 0.8mn persons in 2015 to 1.0 mn in 2016.
Our outlook for real estate is positive supported by government support as they invest in infrastructure and ease transactions in the land offices, a stable and peaceful country, good demographics and increased international investments in the country. The opportunity in the sector will largely be in the residential sector having a huge backlog of 2.0mn units and in the hospitality sector recovering from the effects of insecurity between 2011 and 2015.
Due to the unusual dominance of one counter in the NSE, this week we seek to examine the evolution of Safaricom’s share price and market capitalisation, its effect on the performance of the NSE, its performance in comparison to other listed Telcos in Sub Saharan Africa, how it is likely to affect portfolio construction decisions and conclude by drawing the key take outs.
The Nairobi Securities Exchange (NSE), with 62 listed companies, has a total market capitalisation of USD 23.4 bn (Kshs 2.4 tn). The 62 listed companies are classified into various sectors with the Telecommunication and Technology sector being the largest by market capitalisation, and Safaricom Limited being the only listed company in the sector. The table below indicates the number of companies in each sector and their corresponding market capitalisation.
|
No. |
Sector |
No. of Companies Listed |
Market Cap. (Kshs bn) As at 15/12/2017 |
Percentage of Total Market Cap. |
|
1. |
Telecommunication and Technology |
1 |
1,061.9 |
44.0% |
|
2. |
Banking |
11 |
662.8 |
27.5% |
|
3. |
Manufacturing and Allied |
9 |
284.6 |
11.8% |
|
4. |
Insurance |
6 |
106.4 |
4.4% |
|
5. |
Energy and Petroleum |
5 |
87.5 |
3.6% |
|
6. |
Construction and Allied |
5 |
80.3 |
3.3% |
|
7. |
Commercial and Services |
10 |
66.8 |
2.8% |
|
8. |
Investment |
5 |
32.0 |
1.3% |
|
9. |
Agricultural |
6 |
16.2 |
0.7% |
|
10. |
Automobiles and Accessories |
3 |
9.5 |
0.4% |
|
11. |
Investment Services |
1 |
3.9 |
0.2% |
|
|
Total |
62 |
2,412.1 |
100.0% |
Safaricom Ltd, went public in 2008 with 40 bn issued shares priced at Kshs 5.0 per share at the time of the Initial Public Offer (IPO), effectively valuing the company at Kshs 200.0 bn. At the time of the IPO, Safaricom accounted for only 10.0% of NSE’s market capitalisation. Over the last 8-years we have seen Safaricom’s share price rally, touching a historical high of Kshs 28.5 per share on 23rd November 2017, effectively valuing the firm at Kshs 1.1 tn; at this valuation, Safaricom accounted for 48.0% of the NSE’s market capitalisation. Safaricom is currently trading at Kshs 26.8 per share, accounting for 44.0% of NSE’s market capitalization (Safaricom’s market capitalisation is Kshs 1.1 tn versus the NSE market capitalisation of Kshs 2.4 tn).
After going public in 2008, Safaricom’s share price hit a low of Kshs 2.95 per share in September 2011 following stiff price rivalry, which marked the lowest share price and market valuation since listing. In that period, the share lost 36.2% following the tough operating environment that was characterised by a high inflationary environment, high interest rates and a weakening shilling, which also affected the company’s earnings, recording an 47.4% decline in earnings, to Kshs 4.0 bn in September 2011 from Kshs 7.6 bn in September 2010. The graph below shows the evolution of Safaricom share price and market capitalisation from 2008, the year Safaricom listed, in comparison to stocks in the Banking Sector, which is the second largest sector by market capitalisation and has traditionally determined the performance of the NSE owing to its size and performance:
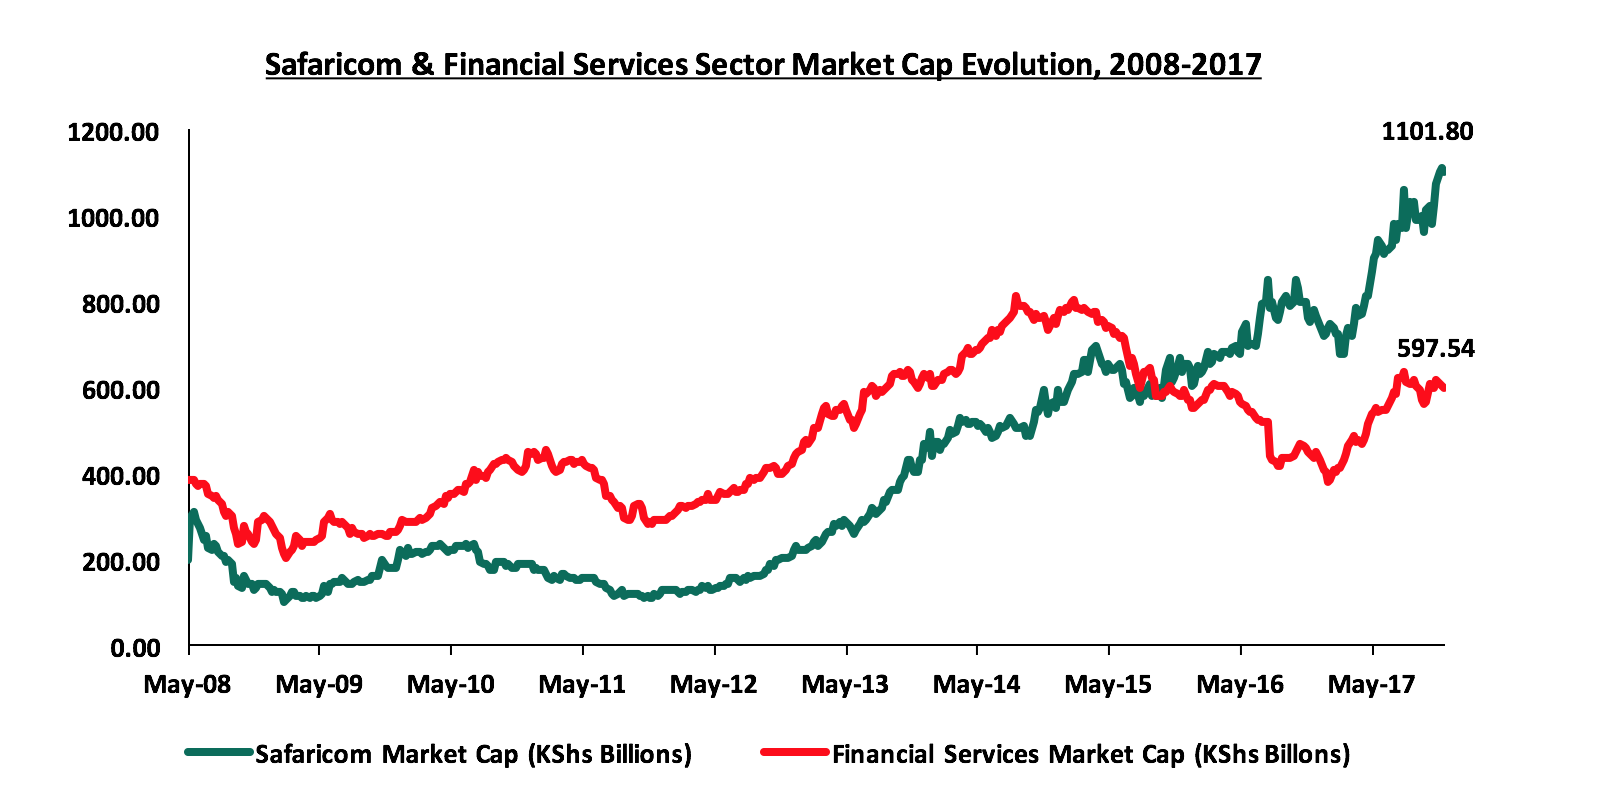
Safaricom’s market value is currently double the market value of the financial services sector
The performance of Safaricom’s stock is mainly attributed to improved investor confidence informed by:
- The growth of M-Pesa - Launched in 2007, M-Pesa is currently the second highest contributor to Safaricom’s total revenue, having contributed 26.2% of their H1’2018 revenue. The integration of M-Pesa onto most mobile banking platforms has also boosted its growth and sustainability;
- Safaricom’s diversification into data – With increased internet penetration, and with Safaricom boasting of up to 77.1% of totals mobile data subscriptions in the market, the company has been able to grow its revenues from mobile data over 5 years from 5.0% contribution to total revenue in H1’2013 to 15.3% in H1’2018;
- Earnings Performance – Over the last 5-years, Safaricom’s earnings have grown at a compounded annual growth rate of 30.9%, indicating the firm’s consistent positive performance.
Safaricom is additionally the most liquid counter at the NSE, and has dominated on both the turnover of trade and also in determining the direction of the market given its weight, liquidity and the number of free float shares. Below we show the annual market turnover for the NSE over the last 10-years compared to that of Safaricom over the same period:
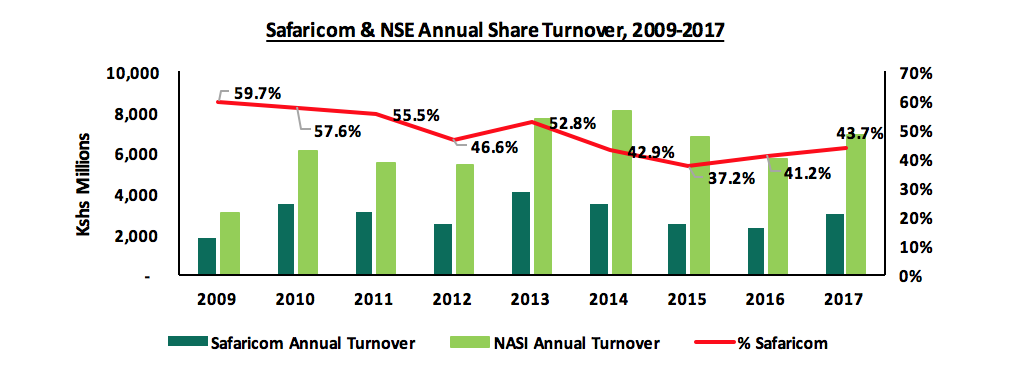
Safaricom has accounted for more than 40% of the Nairobi Stock Exchange’s annual share turnover from 2009
Safaricom’s contribution to overall market performance has been on the rise as illustrated in the charts below, compared to the banking sector, which has traditionally determined the performance of the NSE owing to its size and performance;
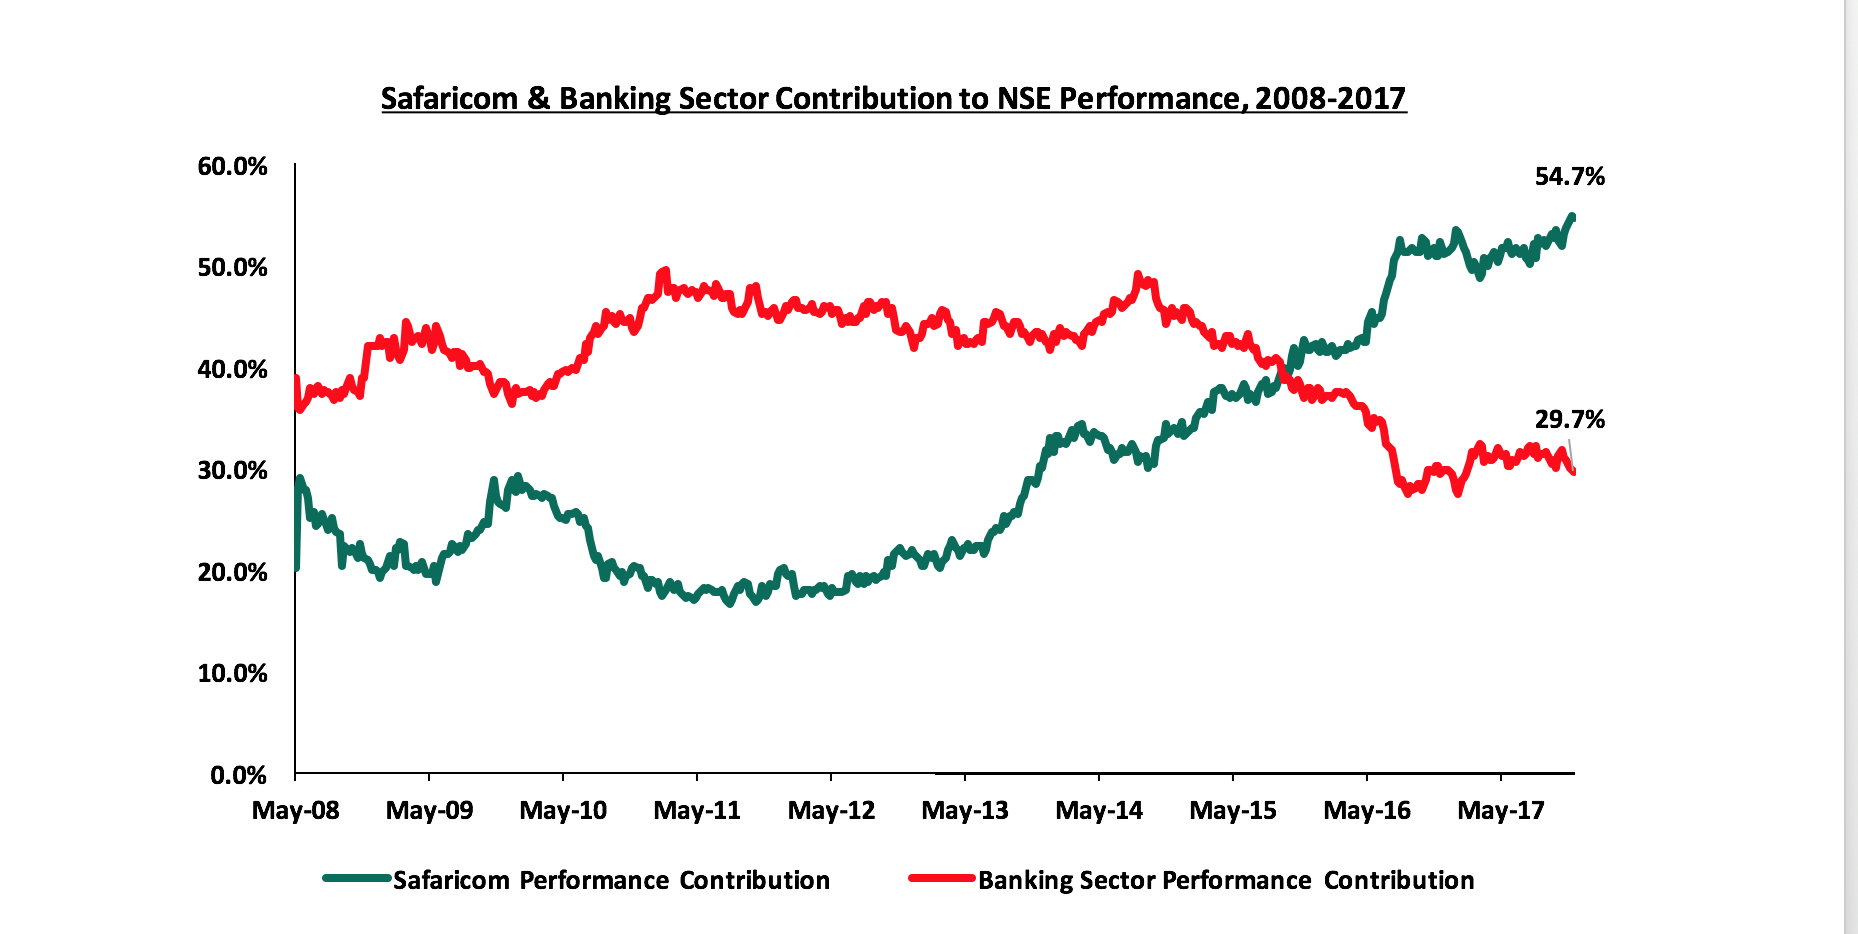
From November 2015 Safaricom overtook the Banking Sector to become the largest contributor to the performance of the Nairobi Stock Exchange
Valuation Relative to Peers and Banking industry: Having analysed the performance of Safaricom, and its contribution to the NSE, we sought to look at its valuation, how it compares to that of the banking sector in Kenya and other listed Telcos in Sub Saharan Africa. Safaricom is currently trading at a trailing P/E of 21.2x as compared to an SSA average of other listed Telcos of 19.2x. In comparison to the Kenyan banking sector, which is trading at a P/E of 8.2x, Safaricom may seem overpriced. However, the listed Telcos in SSA are also trading at a higher P/E of 19.2x compared to the SSA Banking Sector, which is trading at a P/E of 7.9x. This highlights that listed Telcos in SSA have more growth potential compared to banking stocks, hence why investors are willing to pay a premium. In our view, the pricing is mainly driven up by demand of Telcos stocks, with investors expecting future earnings growth, driven by (i) the expected growth in mobile penetration, which is currently at 43.0%, and is expected to hit 51.2% by 2020, and (ii) increased technological advancement in the financial services sector, which is highly dependent on the telco industry.
|
No. |
Telcos |
Bourse |
Current P/E |
Historical P/E |
|
1 |
Onatel |
BRVM Exchange |
37.4x |
13.4x |
|
2 |
MTN South Africa |
Johannesburg Stock Exchange |
32.4x |
17.5x |
|
3 |
Safaricom Limited | Nairobi Securities Exchange |
21.2x |
19.6x |
|
4 |
Crystal Telecom |
Rwanda Stock Exchange |
17.5x |
20.6x |
|
5 |
Airtel networks Zambia |
Zambia Stock Exchange |
17.1x |
15.7x |
|
6 |
Telkom South Africa |
Johannesburg Stock Exchange |
15.9x |
13.3x |
|
7 |
Vodacom Johannesburg |
Johannesburg Stock Exchange |
15.3x |
17.0x |
|
8 |
Sonatel |
BRVM Exchange |
9.6x |
15.9x |
|
9 |
Econet Wireless |
Zimbabwe stock exchange |
6.7x |
13.1x |
|
|
Average P/E |
19.2x |
16.2x |
|
|
|
Kenya Banking Sector |
8.2x |
|
|
|
|
SSA Banking Sector |
7.9x |
|
|
Effect on Portfolio Construction: With the stock’s performance, company size and valuation considered, we now seek to explore how these characteristics of the stock are likely to affect portfolio construction decisions. Given the contribution by Safaricom to the overall market performance, the company seems to be establishing another type of dominance, and this time not the dominance as per Communication Authority of Kenya, but in terms of determining the performance and the direction of the NSE. With the market capitalisation of about 44.0% of the market, and contributing 54.7% of the YTD performance of the NSE, Safaricom has established itself as a stock that investors cannot ignore if they want to outperform the market despite it being more expensive than banking sector stocks from a P/E perspective. This is evident from the fact that Safaricom has attracted the attention of international investors seeing as it is a top 10 constituent of the MSCI Frontier Markets Index and a major holding of 5 frontier markets ETFs and Mutual Funds, namely, (i) the iShares MSCI Frontier 100 ETF, (ii) VanEck Vectors Africa Index ETF, (iii) Guggenheim Frontier Markets ETF, (iv) Columbia Beyond BRICS ETF, and (iv) Global X Next Emerging and Frontier ETF.
In conclusion, Safaricom continues to be a key part of Kenyan equities portfolios because:
- Safaricom’s size and stability anchors the value of local equities given that it has contributed to 54.7% of the YTD performance of the NSE, and,
- Safaricom’s performance is also relatively unaffected by market performance. During periods in which investors in Kenyan banks and large cap non-financials lost value, Safaricom’s value remained steady. In the year 2017 to date for example, Safaricom shares have gained 39.7% while the Nairobi All Share Index has gained 29.1%.
However, portfolio managers should remain cautious on their allocation to Safaricom, so as to maintain diversification. Faced with the dilemma of great returns and diversification, investors in Naspers, a broad-based multinational internet and media group company listed in the Johannesburg Stock Exchange sought for a solution. Naspers accounts for 20.5% of the FTSE/JSE All Share Index, 24.5% of the Top 40 Index and 24.8% of the Shareholders Weighted Index (SWIX), which are the top 3 indices used as benchmarks for investors. To maintain diversification and address the dominance by Naspers, portfolio managers in South Africa are now shifting their benchmark to the Capped SWIX, which was introduced in November 2016. This variation rebalances every quarter to cap stocks at 10% of the index, creating less single-stock concentration. Such a variation is probably necessary for investors in Kenya’s equities market looking to safely have Safaricom on their portfolio.
Investors and portfolio managers are faced with a conundrum: on one hand, they have to continue to allocate Safaricom to their portfolios of Kenyan equities because it makes up almost half of the equities market, offers stability, and has accounted for the growth in Kenyan equities market over the past 10-years, & on the other hand, the allocation to Safaricom in line with its contribution to the NSE causes a risk, and minimises portfolio diversification. In our view, investors should be cautious of the equities market dominance by Safaricom, and in constructing a portfolio, should look for ways to discount allocation to Safaricom to something lower that the 44% it represents in the market, in order to achieve a portfolio that objectifies performance and risk diversification.
Disclaimer: The views expressed in this publication, are those of the writers where particulars are not warranted. This publication, which is in compliance with Section 2 of the Capital Markets Authority Act Cap 485A, is meant for general information only, and is not a warranty, representation, advice or solicitation of any nature. Readers are advised in all circumstances to seek the advice of a registered investment advisor.

- Talk to us
- Kenya
- P.O Box 20695 - 00200, Nairobi, Kenya
- Cell +254709101200
- Tel +254709101200
- WhatsApp +254741676635
- United States
- +254709101200
- DOWNLOAD OUR APP
-


- Kenya
- 8th Floor, Pinetree Plaza, Kaburu Drive, Ngong Road, Nairobi, Kenya
- USA
- Suite 1150, 1775 Eye Street NW, USA, Washington DC 20006, USA
- Investments
- High Yield
- Private Equity
- Real Estate
- Real Estate
- RiverRun Estates
- Cytonn Towers
- The Ridge
- Taraji Heights
- The Alma