Stablecoins and Their Potential Applications in Kenya’s Digital Economy and Cytonn Weekly #10.2026
By Cytonn Research, Mar 15, 2026
Executive Summary
Fixed Income
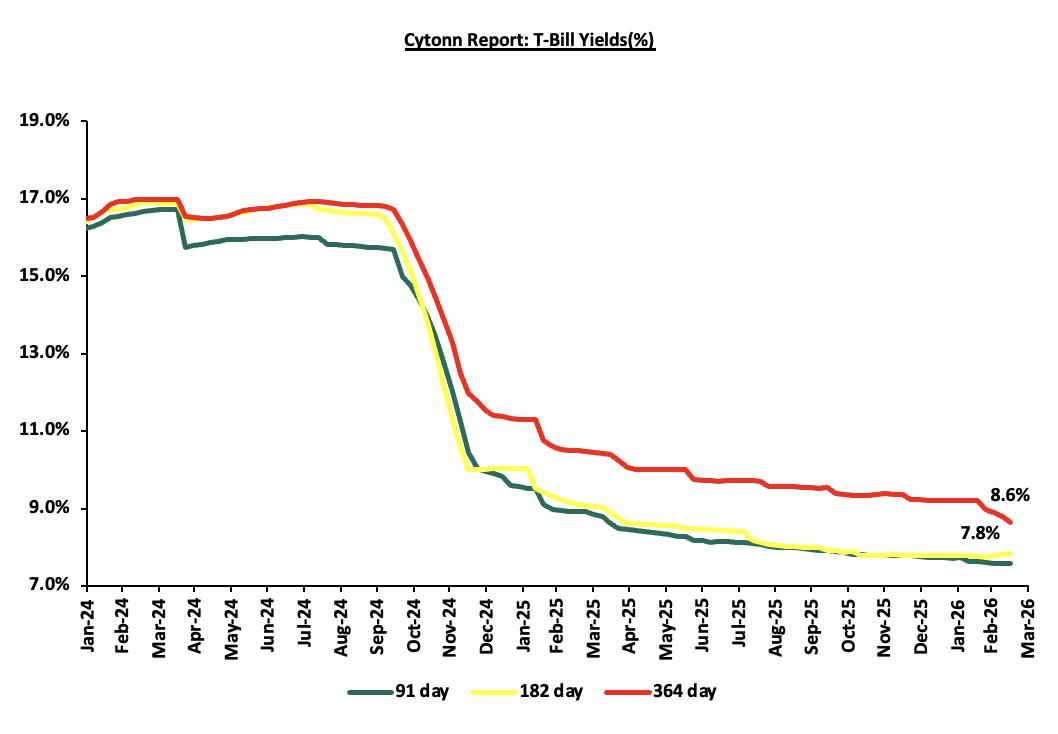
During the week, T-bills were oversubscribed for the seventh consecutive week, with the overall subscription rate coming in at 182.3%, lower than the subscription rate of 418.4% recorded the previous week. Investors’ preference for the shorter 91-day paper persisted, with the paper receiving bids worth Kshs 5.0 bn against the offered Kshs 4.0 bn, translating to a subscription rate of 124.5%, higher than the subscription rate of 48.7%, recorded the previous week. The subscription rate for the 182-day paper and 364-day paper decreased significantly to 78.9% and 308.7% respectively from 151.6% and 833.2% respectively recorded the previous week. The government accepted a total of Kshs 32.3 bn worth of bids out of Kshs 43.7 bn bids received, translating to an acceptance rate of 73.8%. The yields on the government papers registered a mixed performance with the yields on the 182-day papers increasing by 2.4 bps to remain relatively unchanged from the 7.8% recorded the previous week. However, the yields on the 364-day paper decreased the most by 16.3 bps to 8.5% from 8.6% recorded the previous week, while the yields on the 91-day paper decreased by 1.6 bps to remain relatively unchanged from the 7.6% recorded the previous week;
During the week, the Central Bank of Kenya released the auction results for the re-opened treasury bonds FXD1/2019/020 and FXD1/2021/025 with tenors to maturities of 13.1 years and 20.1 years respectively and fixed coupon rates of 12.9% and 13.9% respectively. The bonds were oversubscribed, with the overall subscription rate coming in at 195.7%, receiving bids worth Kshs 117.4 bn against the offered Kshs 60.0 bn. The government accepted bids worth Kshs 61.0 bn, translating to an acceptance rate of 51.9%. The weighted average yield for the accepted bids for the FXD1/2019/020 and FXD1/2021/025 came in at 12.7% and 12.9% respectively. Notably, the 12.7% on FXD1/2019/020 was lower than the 13.3% recorded the last time the bond was reopened in January 2026 as well as the 12.9% on the FXD1/2021/025 which was also lower than the 13.6% recorded the last time the bond was reopened in December 2025. With the Inflation rate at 4.3% as of February 2026, the real returns of the FXD1/2019/020 and FXD1/2021/025 are 8.4% and 8.6%. Given the 10.0% withholding tax on the bonds, the tax equivalent yields for shorter term bonds with 15.0% withholding tax are 13.5% and 13.7% for the FXD1/2019/020 and FXD1/2021/025 respectively;
The National Treasury gazetted the revenue and net expenditures for the eighth month of FY’2025/2026, ending 28th February 2026, highlighting that the total revenue collected as at the end of February 2026 amounted to Kshs 1,613.1 bn, equivalent to 58.6% of the original estimates of Kshs 2,754.7 bn for FY’2025/2026 and is 87.8% of the prorated estimates of Kshs 1,836.5 bn.
During the week, The Energy and Petroleum Regulatory Authority (EPRA) released their monthly statement on the maximum retail fuel prices in Kenya, effective from 15th March 2026 to 14th April 2026. Notably, the maximum allowed prices for Super Petrol, Diesel and Kerosene remain unchanged at Kshs 178.3, Kshs 166.5 and Kshs 152.8 per litre respectively;
Equities
The equities market was on an upward trajectory, with NSE 20, NSE 10, NSE 25, and NASI gaining by 2.4%, 2.3%, 2.1% and 1.4% respectively, taking the YTD performance to gains of 17.5%, 14.9%, 13.9% and 12.8% for NSE 20, NSE 25, NSE 10 and NASI respectively. The equities market performance was mainly driven by gains recorded by large cap stocks such as EABL, BAT and Equity of 5.2%, 4.3% and 3.4% respectively. However, the performance was weighed down by losses recorded by large cap stocks such as Standard Chartered and Co-operative Bank of 1.5% and 0.2% respectively;
Also, during the week, the banking sector index gained by 1.6% to 242.2 from 238.3 recorded the previous week. This is attributable to gains recorded by stocks such as Equity, Absa and KCB of 3.4%, 3.0% and 2.3% respectively. The performance was weighed down by losses recorded by large cap stocks such as Standard Chartered and Co-operative Bank of 1.5% and 0.2% respectively;
During the week KCB Bank released its FY’2025 financial results, KCB Group’s Profit After Tax (PAT) increased by 10.6% to Kshs 68.4 bn, from Kshs 61.8 bn in FY’2024. The performance was mainly driven by a 4.3% increase in Total Operating Income to Kshs 213.8 bn, from Kshs 204.9 bn in FY’2024, coupled with the 0.02% decrease in Total Operating expense to Kshs 122.87 bn in FY’2025, from Kshs 122.89 bn in FY’2024.The decrease in Operating expenses was largely driven by the 2.3% decrease in staff cost to Kshs 39.0 bn from Kshs 39.9 bn in FY’2024. The 4.3% increase in Total Operating Income was supported by an 7.8% increase in Net Interest Income to Kshs 148.0 bn in FY’2025, from Kshs 137.3 bn in FY’2024, which was however weighed down by a 2.6% decrease in Non-Interest income to Kshs 65.8 bn in FY’2025, from Kshs 67.5 bn in FY’2024;
During the week Stanbic Bank released its FY’2025 financial, Profit after Tax increased marginally by 0.02% to remain relatively unchanged at the Kshs 13.7bn recorded in in FY’2024, mainly driven by 5.7% decrease in total operating expense to Kshs 19.6 bn, from Kshs 20.8 bn in FY’2024 which outpaced the 3.1% decrease in total operating income to Kshs 38.5 bn, from Kshs 39.7 bn in FY’ 2024. The decrease in Operating expenses was largely driven by the 47.5% decrease in loan loss provision to Kshs 1.6 bn, from Kshs 3.1 bn in FY’2024. The 3.1% decrease in Total Operating Income was driven by a 6.4% decrease in Non-Interest Income to Kshs 14.4 bn in FY’2025, from Kshs 10.4 bn in FY’2024 coupled with the 1.0% decrease in Net-Interest income to Kshs 24.1 bn in FY’2025, from Kshs 24.3 bn in FY’2024;
During the week, Liberty Kenya Holdings released their FY’2025 results, highlighting that the Profit After Tax decreased by 51.9% to Kshs 0.7 bn, from the Kshs 1.4 bn recorded in FY’2024. The performance was mainly driven by 55.1% decrease in net insurance service revenue to Kshs 0.5 bn in FY’2025, from Kshs 1.1 bn in FY’2024, coupled with 23.0% decrease in net investment revenue to Kshs 1.7 bn, from Kshs 2.1 bn in FY’2024;
During the week, Nation Media Group PLC (NMG) announced that Taarifa Ltd (Taarifa) had served a Notice of Intention not to make a take-over offer, triggered by the proposed indirect acquisition of 54.1% of NMG’s issued share capital through NPRT Holdings Africa Limited (NPRT) from the Aga Khan Fund for Economic Development S.A. (AKFED). NPRT currently holds 92,618,177 ordinary shares in NMG, representing a majority stake, and the acquisition will result in Taarifa obtaining effective control of NMG, while the remaining shares will continue to be listed and publicly traded across the Nairobi Securities Exchange (NSE), Uganda Securities Exchange (USE), Rwanda Stock Exchange (RSE), and Dar es Salaam Stock Exchange (DSE);
During the week, Centum Investment Company Plc successfully completed the sale of its remaining 50.0% stake in Bakki Holdco Limited a holding vehicle through which Centum held a 27.2% indirect interest in Sidian Bank Limited. Following receipt of the necessary regulatory approvals from the Central Bank of Kenya and the Competition Authority of Kenya, and upon fulfillment of all customary conditions precedent, the transaction was concluded. With the completion of this sale, Bakki Holdco Limited will cease to be a subsidiary of Centum, marking the Group’s full exit from Sidian Bank;
Real Estate
During the week, Kenya Mortgage Refinance Company (KMRC) announced plans to raise new debt through a green bond expected to be issued in April. The bond aims to raise funds to support the refinancing of affordable and environmentally sustainable housing projects. The issuance follows strong investor interest in previous KMRC bonds which were oversubscribed by about 480.0% during which it raised Kshs 1.4bn;
During the week, the government announced that the expansion of Jomo Kenyatta International Airport (JKIA) will be the first project financed under the proposed National Infrastructure Fund. The fund, created under the National Infrastructure Fund Bill, aims to provide a new financing model for large national infrastructure projects. It comes after the cancellation of a previous public-private partnership proposal with Adani Group, which faced criticism over transparency and procurement concerns;
On the Unquoted Securities Platform, Acorn D-REIT and I-REIT traded at Kshs 27.4 and Kshs 23.2 per unit, respectively, as per the last updated data on 13th March 2026. The performance represented a 33.4% and 14.5% gain for the D-REIT and I-REIT, respectively, from the Kshs 20.0 inception price. The volumes traded for the D-REIT and I-REIT came in at 13.4 mn and 42.0 mn shares, respectively. Additionally, ILAM Fahari I-REIT traded at Kshs 11.0 per share as of 13th March 2026 representing a 45.0% loss from the Kshs 20.0 inception price;
Focus of the Week
Kenya has established itself as one of Africa’s leading digital finance markets, driven largely by the rapid adoption of mobile money services and fintech innovation. Platforms such as M-Pesa and Airtel Money have transformed how individuals and businesses transact, making digital payments widely accessible and significantly improving financial inclusion. As digital financial infrastructure continues to evolve, new technologies are emerging that could further reshape the country’s financial ecosystem. One such innovation is stablecoins, a category of digital assets designed to maintain a stable value relative to an underlying asset, most commonly a fiat currency such as the US dollar. Stablecoins combine the efficiency and transparency of blockchain technology with price stability, enabling them to function as a potential medium of exchange, store of value, and settlement asset within digital financial systems.
Money Markets, T-Bills Primary Auction:
This week, T-bills were oversubscribed for the seventh consecutive week, with the overall subscription rate coming in at 182.3%, lower than the subscription rate of 418.4%recorded the previous week. Investors’ preference for the shorter 91-day paper persisted, with the paper receiving bids worth Kshs 5.0 bn against the offered Kshs 4.0 bn, translating to a subscription rate of 124.5%, higher than the subscription rate of 48.7%, recorded the previous week. The subscription rate for the 182-day paper and 364-day paper decreased significantly to 78.9% and 308.7% respectively from 151.6% and 833.2% respectively recorded the previous week. The government accepted a total of Kshs 32.3 bn worth of bids out of Kshs 43.7 bn bids received, translating to an acceptance rate of 73.8%. The yields on the government papers registered a mixed performance with the yields on the 182-day papers increasing by 2.4 bps to remain relatively unchanged from the 7.8% recorded the previous week. However, the yields on the 364-day paper decreased the most by 16.3 bps to 8.5% from 8.6% recorded the previous week, while the yields on the 91-day paper decreased by 1.6 bps to remain relatively unchanged from the 7.6% recorded the previous week.
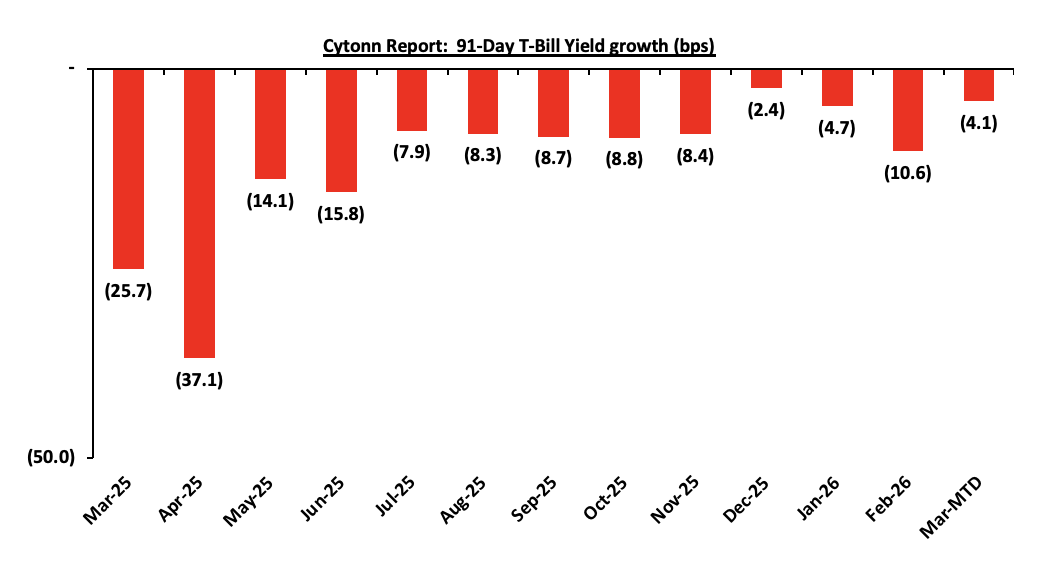
The chart below shows the yield growth rate for the 91-day paper from January 2024 to date:
The charts below show the performance of the 91-day, 182-day and 364-day papers from March 2025 to March 2026
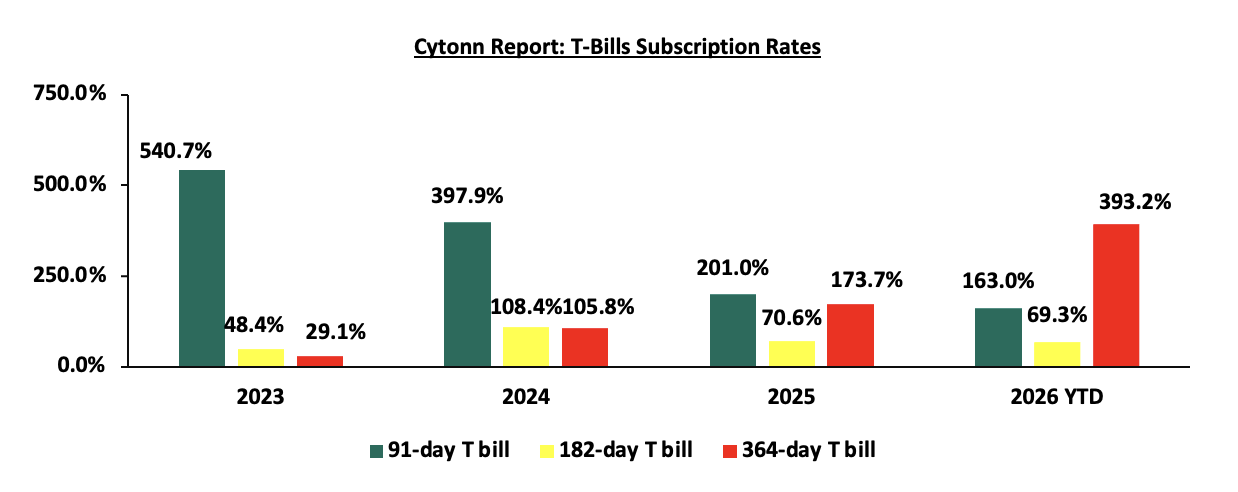
The chart below compares the overall average T-bill subscription rates obtained in 2023, 2024, 2025 and 2026 Year-to-date (YTD):
Money Market Performance:
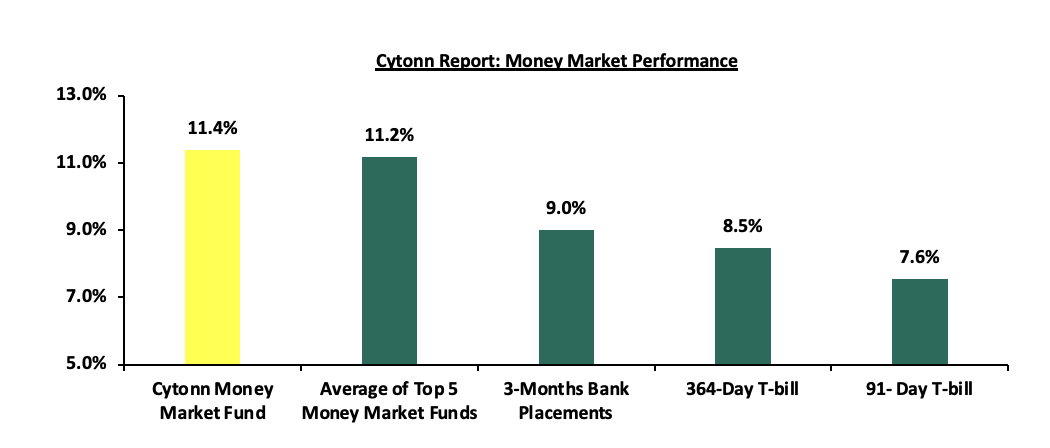
In the money markets, 3-month bank placements ended the week at 9.0% (based on rates offered by various banks). The yields on the 364-day paper decreased by 16.3 bps to 8.5% from 8.6% recorded the previous week, while the yields on the 91-day paper decreased by 1.6 bps to remain relatively unchanged from the 7.6% recorded the previous week. The yield on the Cytonn Money Market Fund remain unchanged at 11.4% recorded the previous week, while the average yields on the Top 5 Money Market Funds decreased by 0.2 bps to remain relatively unchanged at 11.2% recorded the previous week.
The table below shows the Money Market Fund Yields for Kenyan Fund Managers as published on 13th March 2026:
|
Money Market Fund Yield for Fund Managers as published on 13th March 2026 |
||
|
Rank |
Fund Manager |
Effective Annual Rate |
|
1 |
Nabo Africa Money Market Fund |
11.4% |
|
2 |
Cytonn Money Market Fund (Dial *809# or download Cytonn App) |
11.4% |
|
3 |
Gulfcap Money Market Fund |
11.4% |
|
4 |
Arvocap Money Market Fund |
11.0% |
|
5 |
Enwealth Money Market Fund |
10.7% |
|
6 |
Lofty-Corban Money Market Fund |
10.7% |
|
7 |
Ndovu Money Market Fund |
10.5% |
|
8 |
Jubilee Money Market Fund |
10.4% |
|
9 |
Kuza Money Market fund |
10.4% |
|
10 |
Madison Money Market Fund |
10.2% |
|
11 |
Old Mutual Money Market Fund |
10.1% |
|
12 |
Etica Money Market Fund |
10.1% |
|
13 |
Orient Kasha Money Market Fund |
9.9% |
|
14 |
Faulu Money Market Fund |
9.9% |
|
15 |
British-American Money Market Fund |
9.8% |
|
16 |
Dry Associates Money Market Fund |
9.5% |
|
17 |
SanlamAllianz Money Market Fund |
9.5% |
|
18 |
GenAfrica Money Market Fund |
9.4% |
|
19 |
KCB Money Market Fund |
9.3% |
|
20 |
Genghis Money Market Fund |
9.0% |
|
21 |
Apollo Money Market Fund |
8.5% |
|
22 |
CIC Money Market Fund |
8.5% |
|
23 |
ICEA Lion Money Market Fund |
8.4% |
|
24 |
CPF Money Market Fund |
8.4% |
|
25 |
Co-op Money Market Fund |
8.2% |
|
26 |
Mali Money Market Fund |
8.0% |
|
27 |
Absa Shilling Money Market Fund |
7.3% |
|
28 |
Mayfair Money Market Fund |
7.2% |
|
29 |
Ziidi Money Market Fund |
6.2% |
|
30 |
AA Kenya Shillings Fund |
5.9% |
|
31 |
Stanbic Money Market Fund |
5.6% |
|
32 |
Equity Money Market Fund |
4.6% |
Source: Business Daily
Liquidity:
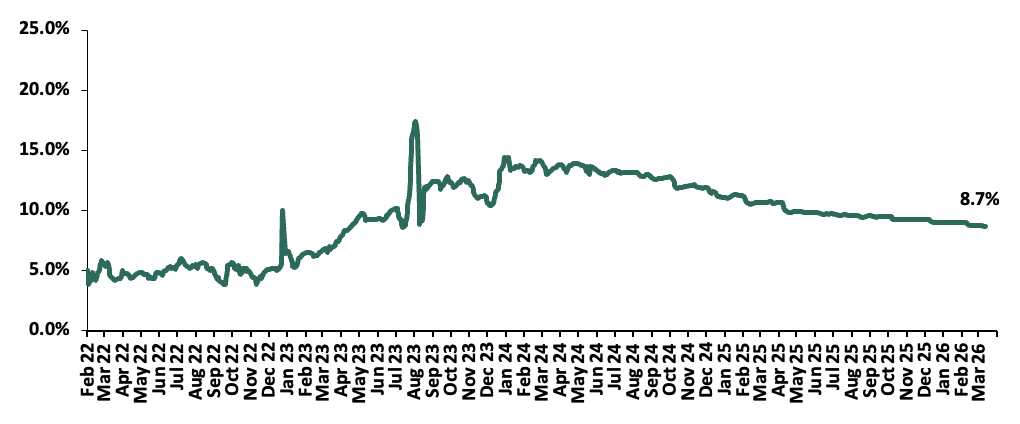
During the week, liquidity in the money markets eased with the average interbank rate decreasing by 7.3 bps to remain relatively unchanged at 8.7% recorded the previous week, partly attributable to government payments that offset tax remittances. The average interbank volumes traded increased by 39.0% to Kshs 12.2 bn from Kshs 8.8 bn recorded the previous week. The chart below shows the interbank rates in the market over the years:
Kenya Eurobonds:
During the week, the yields on the Eurobonds were on an upward trajectory with the yield on the 7-year Eurobond issued in 2024, increasing the most by 50.0 bps to 8.0% from 7.5% recorded the previous week. The table below shows the summary performance of the Kenyan Eurobonds as of 12th March 2026;
|
Cytonn Report: Kenya Eurobonds Performance |
||||||
|
|
2018 |
2019 |
2021 |
2024 |
||
|
Tenor |
10-year issue |
30-year issue |
12-year issue |
13-year issue |
7-year issue |
|
|
Amount Issued (USD) |
1.0 bn |
1.0 bn |
1.0 bn |
1.5 bn |
1.5 bn |
|
|
Years to Maturity |
2.5 |
22.5 |
8.8 |
5.5 |
10.5 |
|
|
Yields at Issue |
7.3% |
8.3% |
6.2% |
10.4% |
9.9% |
|
|
02-Jan-26 |
6.1% |
8.8% |
7.2% |
7.8% |
7.1% |
|
|
27-Feb-26 |
6.0% |
9.0% |
7.1% |
8.1% |
6.9% |
|
|
05-Mar-26 |
6.4% |
9.3% |
7.7% |
8.6% |
7.5% |
|
|
06-Mar-26 |
6.5% |
9.6% |
8.0% |
8.9% |
7.9% |
|
|
09-Mar-26 |
6.7% |
9.7% |
8.2% |
9.2% |
8.2% |
|
|
10-Mar-26 |
6.6% |
9.5% |
8.0% |
8.8% |
7.9% |
|
|
11-Mar-26 |
6.5% |
9.5% |
8.0% |
8.9% |
7.9% |
|
|
12-Mar-26 |
6.6% |
9.6% |
8.0% |
8.9% |
8.0% |
|
|
Weekly Change |
0.3% |
0.3% |
0.3% |
0.3% |
0.5% |
|
|
MTD Change |
0.7% |
0.6% |
0.9% |
0.8% |
1.0% |
|
|
YTD Change |
0.6% |
0.7% |
0.8% |
1.1% |
0.9% |
|
Source: Central Bank of Kenya (CBK) and National Treasury
Kenya Shilling:
During the week, the Kenya Shilling depreciated by 9.3 bps against the US Dollar, to Kshs 129.3 from the Kshs 129.2 recorded the previous week. On a year-to-date basis, the shilling has depreciated by 19.4 bps against the dollar, as compared to the 22.9 bps appreciation recorded in 2025.
We expect the shilling to be supported by:
- Diaspora remittances standing at a cumulative USD 5,020.7 mn in the twelve months to January 2026, 1.2% higher than the USD 4,960.2 mn recorded over the same period in 2025. These have continued to cushion the shilling against further depreciation. In the January 2026 diaspora remittances figures, North America remained the largest source of remittances to Kenya accounting for 51.3% in the period, and,
- Tourism inflows, which strengthened significantly. Tourism receipts reached Kshs 560.0 bn in 2025, up from Kshs 452.2 bn in 2024, representing a 23.9% increase, supported by improved international arrivals through the country’s major airports, and,
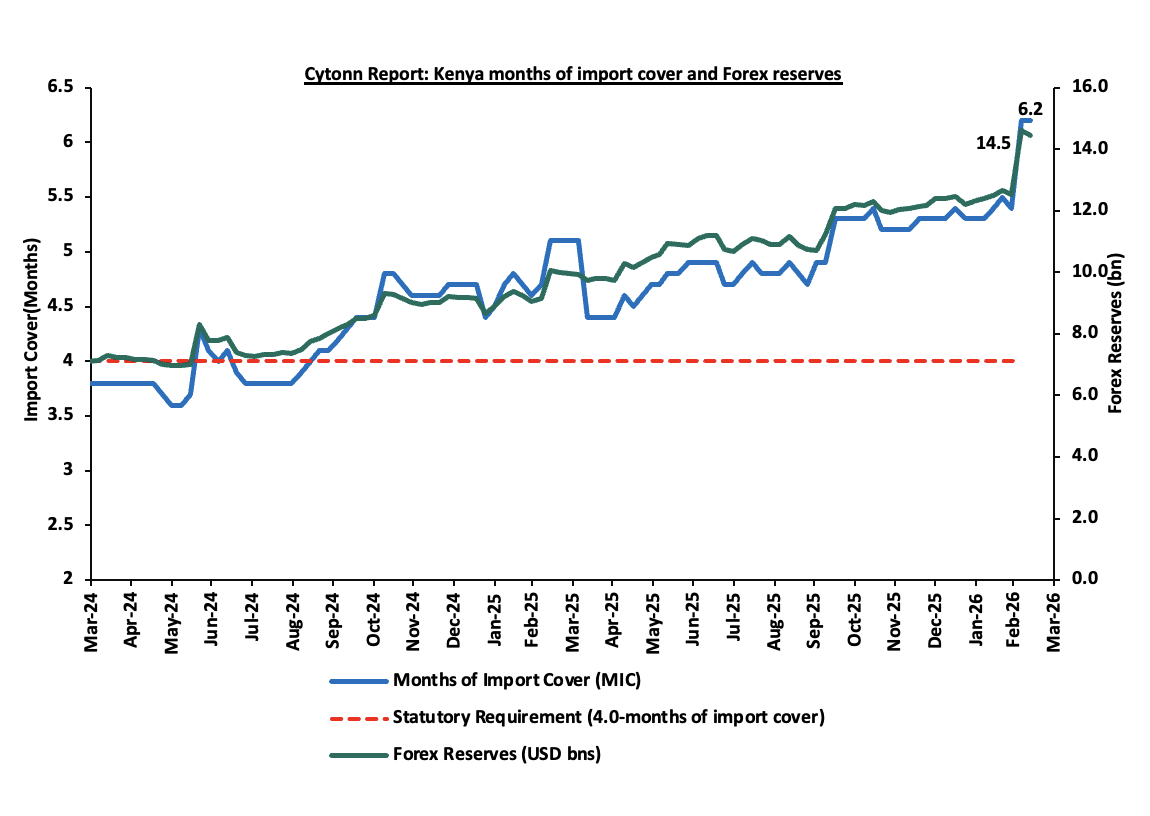
- Improved forex reserves currently at USD 14.5 bn (equivalent to 6.2-months of import cover), which is above the statutory requirement of maintaining at least 4.0-months of import cover and above the EAC region’s convergence criteria of 4.5-months of import cover.
The shilling is however expected to remain under pressure in 2026 as a result of:
- An ever-present current account deficit which came at 2.2% of GDP in the twelve months to October 2025, and,
- The need for government debt servicing, continues to put pressure on forex reserves given that 62.0% of Kenya’s external debt is US Dollar-denominated as of December 2025.
Kenya’s forex reserves decreased by 0.9% during the week to USD 14.5 bn from the USD 14.6 bn recorded the previous week, equivalent to 6.2 months of import cover, and above the statutory requirement of maintaining at least 4.0-months of import cover. This is attributable to Eurobond buyback offer, continued strong diaspora remittance inflows, and foreign exchange purchases by the Central Bank of Kenya and reserve accumulation amid relatively stable currency conditions in Kenya. The chart below summarizes the evolution of Kenya's months of import cover over the years:
Weekly Highlights
- Exchequer Highlight February 2026
The National Treasury gazetted the revenue and net expenditures for the eighth month of FY’2025/2026, ending 28th February 2026, highlighting that the total revenue collected as at the end of February 2026 amounted to Kshs 1,613.1 bn, equivalent to 58.6% of the original estimates of Kshs 2,754.7 bn for FY’2025/2026 and is 87.8% of the prorated estimates of Kshs 1,836.5 bn. Below is a summary of the performance:
|
FY'2025/2026 Budget Outturn - As at 27th February 2026 |
|||||
|
Amounts in Kshs billions unless stated otherwise |
|||||
|
Item |
12-months Original Estimates |
Actual Receipts/Release |
Percentage Achieved |
Prorated |
% achieved of the Prorated |
|
Opening Balance |
6.4 |
||||
|
Tax Revenue |
2,627.1 |
1,516.7 |
57.7% |
1,751.4 |
86.6% |
|
Non-Tax Revenue |
127.6 |
89.94 |
70.5% |
85.1 |
105.7% |
|
Total Revenue |
2,754.7 |
1,613.1 |
58.6% |
1,836.5 |
87.8% |
|
External Loans & Grants |
569.8 |
253.6 |
44.5% |
379.9 |
66.8% |
|
Domestic Borrowings |
1,098.3 |
870.1 |
79.2% |
732.2 |
118.8% |
|
Other Domestic Financing |
10.8 |
21.6 |
199.8% |
7.2 |
299.7% |
|
Total Financing |
1,678.9 |
1,145.3 |
68.2% |
1,119.2 |
102.3% |
|
Recurrent Exchequer issues |
1,470.4 |
1,023.8 |
69.6% |
980.3 |
104.4% |
|
CFS Exchequer Issues |
2,141.0 |
1,294.4 |
60.5% |
1,427.4 |
90.7% |
|
Development Expenditure & Net Lending |
407.1 |
188.5 |
46.3% |
271.4 |
69.4% |
|
County Governments + Contingencies |
415.0 |
240.7 |
58.0% |
276.7 |
87.0% |
|
Total Expenditure |
4,433.6 |
2,747.5 |
62.0% |
2,955.7 |
93.0% |
|
Fiscal Deficit excluding Grants |
1,678.9 |
1,134.4 |
67.6% |
1,119.2 |
101.4% |
|
Total Borrowing |
1,668.1 |
1,123.7 |
67.4% |
1,112.0 |
101.1% |
Amounts in Kshs bns unless stated otherwise
The key take-outs from the release include;
- Total revenue collected as at the end of February 2026 amounted to Kshs 1,613.1 bn, equivalent to 58.6% of the original estimates of Kshs 2,754.7 bn for FY’2025/2026 and is 87.8% of the prorated estimates of Kshs 1,836.5 bn. Cumulatively, tax revenues amounted to Kshs 1,516.7 bn, equivalent to 57.7% of the original estimates of Kshs 2,627.1 bn and 86.6% of the prorated estimates of Kshs 1,751.4 bn,
- Total financing amounted to Kshs 1,145.3 bn, equivalent to 68.2% of the original estimates of Kshs 1,678.9 bn and is equivalent to 102.3% of the prorated estimates of Kshs 1,119.2 bn. Additionally, domestic borrowing amounted to Kshs 870.1 bn, equivalent to 79.2% of the original estimates of Kshs 1,098.3 bn and is 118.8% of the prorated estimates of Kshs 732.2 bn.
- The total expenditure amounted to Kshs 2,747.5 bn, equivalent to 62.0% of the original estimates of Kshs 4,433.6 bn, and is 93.0% of the prorated target expenditure estimates of Kshs 2,955.7 bn. Additionally, the net disbursements to recurrent expenditures came in at Kshs 1,023.8 bn, equivalent to 69.6% of the original estimates of Kshs 1,470.4 and are equivalent to 104.4% of the prorated estimates of Kshs 980.3bn,
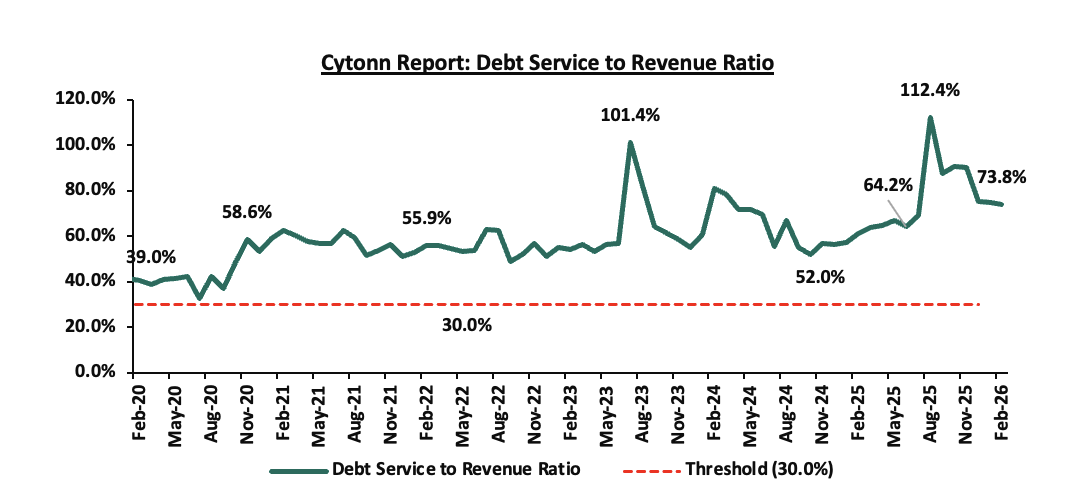
- Consolidated Fund Services (CFS) Exchequer issues came in at Kshs 1,294.4 bn, equivalent to 60.5% of the original estimates of Kshs 2,141.0 bn, and are 90.7% of the prorated amount of Kshs 1,427.4 bn. The cumulative public debt servicing cost amounted to Kshs 1,190.7 bn which is 62.6% of the original estimates of Kshs 1,901.4 bn and is 93.9% of the prorated estimates of Kshs 1,267.6 bn. Additionally, the Kshs 1,190.7 bn debt servicing cost is equivalent to 73.8% of the actual cumulative revenues collected as at the end of February 2026. The chart below shows the debt servicing cost to revenue ratio over the period;
- Total borrowings as at the end of February 2026 amounted to Kshs 1,123.7 bn, equivalent to 67.4% of the original estimates of Kshs 1,668.1 bn for FY’2025/2026 and are 101.1% of the prorated estimates of Kshs 1,112.0 bn. The cumulative domestic borrowing of Kshs 1,098.3 bn comprises of Net Domestic Borrowing Kshs 634.8 bn and Internal Debt Redemptions (Rollovers) Kshs 463.5 bn.
The government underachieved its prorated revenue targets for the eighth month of the FY’2025/2026, achieving 87.8% of the prorated revenue targets in February 2026, lower than the 89.4% recorded in January 2026. This was driven by shortfall in tax revenues, which amounted to Kshs 1,516.7 bn and stood at 86.6% of prorated levels. External loans and grants remained significantly below target at 44.5%, increasing reliance on domestic borrowing, which came in at 118.8% of the prorated target of Kshs 732.2 bn. The business environment, however, showed signs of recovery, with the Purchasing Managers’ Index (PMI) standing at 50.4 in February 2026 despite dropping from 51.9 in January 2026, remaining over the 50.0 neutral mark and signaling a slowdown in the contraction of business activity. Expenditure absorption stood at 93.0% of prorated levels, with development spending still lagging at 69.4%, reflecting slow implementation of capital projects. Future revenue performance will depend on how quickly private sector activity strengthens, supported by a stable Shilling, easing credit conditions following the 25.0 bps reduction in the Central Bank Rate to 8.75% from 9.00% in December 2025, and continued efforts to broaden the tax base, curb evasion, and stimulate economic growth.
- Fuel Prices effective 15th March - 14th April 2026
During the week, The Energy and Petroleum Regulatory Authority (EPRA) released their monthly statement on the maximum retail fuel prices in Kenya, effective from 15th March 2026 to 14th April 2026. Notably, the maximum allowed prices for Super Petrol, Diesel and Kerosene remain unchanged at Kshs 178.3, Kshs 166.5 and Kshs 152.8 per litre respectively.
Other key take-outs from the performance include,
- The average landing cost per cubic metre of Diesel, Kerosene and Super Petrol increased by 8.5%, 6.8% and 1.0% to USD 636.5, USD 639.5 and USD 582.1 in February 2026 from USD 586.8, USD 598.2 and USD 576.3 recorded in January 2026.
- The Kenyan Shilling stabilized against the US Dollar at Kshs 129.4 in February from 129.3 recorded in January
We note that fuel prices in the country have stabilized in recent months largely due to the government's efforts to stabilize pump to cushion the increases applied to the petroleum pump prices, coupled with the stabilization of the Kenyan Shilling against the dollar and other major currencies. Going forward, fuel prices are expected to remain generally stable in the short term due to the government’s continued use of the pump price stabilization mechanism and a relatively stable exchange rate. However, rising global oil prices arising from geopolitical tensions suggest that fuel prices may increase in the coming months if the wars persist. As fuel is a major input cost across the economy, any upward movement could affect production costs and inflationary pressures, although inflation is still expected to remain broadly within the Central Bank of Kenya’s target range of 2.5%-7.5% in the short to medium term.
Rates in the Fixed Income market have been on a downward trend due to high liquidity in the money market which allowed the government to front load most of its borrowing. The government is 128.7% ahead of its prorated net domestic borrowing target of Kshs 634.8 bn, having a net borrowing position of Kshs 1,029.1 bn (inclusive of T-bills). However, we expect a stabilization of the yield curve in the short and medium term, with the government looking to increase its external borrowing to maintain the fiscal surplus, hence alleviating pressure in the domestic market. As such, we expect the yield curve to stabilize in the short to medium-term and hence investors are expected to shift towards the long-term papers to lock in the high returns
Market Performance:
The equities market was on an upward trajectory, with NSE 20, NSE 10, NSE-25, and NASI gaining by 2.4%, 2.3%, 2.1% and 1.4% respectively, taking the YTD performance to gains of 17.5%, 14.9%, 13.9% and 12.8% for NSE 20, NSE 25, NSE 10 and NASI respectively. The equities market performance was mainly driven by gains recorded by large cap stocks such as EABL, BAT and Equity of 5.2%, 4.3% and 3.4% respectively. However, the performance was weighed down by losses recorded by large cap stocks such as Standard Chartered and Co-operative Bank of 1.5% and 0.2% respectively;
Also, during the week, the banking sector index gained by 1.6% to 242.2 from 238.3 recorded the previous week. This is attributable to gains recorded by stocks such as Equity, Absa and KCB of 3.4%, 3.0% and 2.3% respectively. The performance was weighed down by losses recorded by large cap stocks such as Standard Chartered and Co-operative Bank of 1.5% and 0.2% respectively.
During the week, equities turnover increased by 22.6% to USD 48.3 mn from USD 39.4 mn recorded the previous week, taking the YTD total turnover to USD 380.4 mn. Foreign investors remained net sellers for the sixth consecutive week with a net selling position of USD 20.1 mn, from a net selling position of USD 4.3 mn recorded the previous week, taking the YTD foreign net selling position to USD 59.4 mn, compared to a net selling position of USD 92.9 mn recorded in 2025.
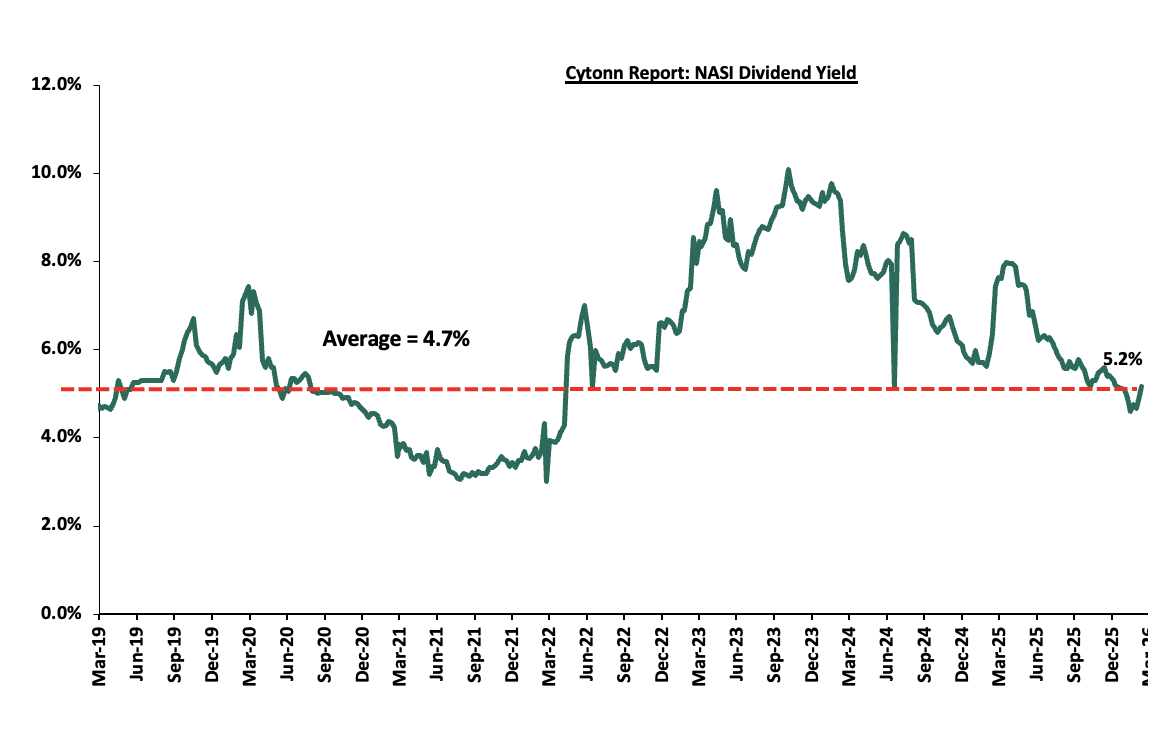
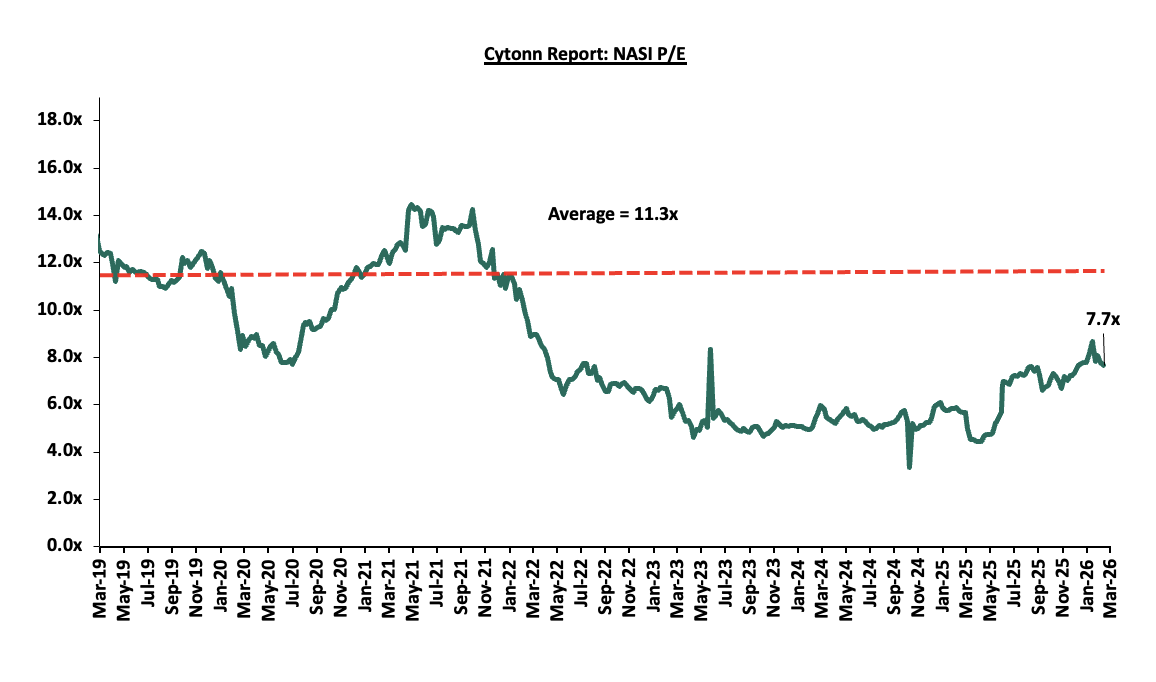
The market is currently trading at a price to earnings ratio (P/E) of 7.7x, 32.3% below the historical average of 11.3x. The dividend yield stands at 5.2%, 0.5% points above the historical average of 4.7. Key to note, NASI’s PEG ratio currently stands at 1.0x, suggesting that the market is fairly valued relative to its expected earnings growth. A PEG ratio greater than 1.0x indicates the market may be overvalued while a PEG ratio less than 1.0x indicates that the market is undervalued.
The charts below indicate the historical P/E and dividend yields of the market.
Universe of Coverage:
|
Cytonn Report: Equities Universe of Coverage |
|||||||||||
|
Company |
Price as at 06/03/2026 |
Price as at 13/03/2026 |
w/w change |
YTD Change |
Year Open 2026 |
Target Price* |
Dividend Yield |
Upside/ Downside** |
P/TBv Multiple |
Recommendation |
|
|
Standard Chartered Bank |
340.3 |
335.0 |
(1.5%) |
11.8% |
299.8 |
366.6 |
13.4% |
22.9% |
1.9x |
Buy |
|
|
NCBA |
88.0 |
88.0 |
0.0% |
3.5% |
85.0 |
101.3 |
6.3% |
21.4% |
1.4x |
Buy |
|
|
I&M Group |
49.6 |
50.8 |
2.4% |
18.6% |
42.8 |
57.4 |
5.9% |
18.9% |
0.9x |
Accumulate |
|
|
KCB Group*** |
77.5 |
79.3 |
2.3% |
20.5% |
65.8 |
86.9 |
8.8% |
18.5% |
1.0x |
Accumulate |
|
|
Equity Group |
74.5 |
77.0 |
3.4% |
14.9% |
67.0 |
84.1 |
5.5% |
14.7% |
1.3x |
Accumulate |
|
|
Stanbic*** Holdings |
255.0 |
260.8 |
2.3% |
31.9% |
197.8 |
275.8 |
8.6% |
14.4% |
1.6x |
Accumulate |
|
|
ABSA Bank*** |
30.2 |
31.1 |
3.0% |
24.9% |
24.9 |
33.0 |
6.6% |
12.9% |
2.0x |
Accumulate |
|
|
Diamond Trust Bank |
157.0 |
157.0 |
0.0% |
36.8% |
114.8 |
170.0 |
4.5% |
12.7% |
0.6x |
Accumulate |
|
|
CIC Group |
4.9 |
5.0 |
2.2% |
10.6% |
4.5 |
5.5 |
2.6% |
12.2% |
1.4x |
Accumulate |
|
|
Co-op Bank |
30.0 |
30.0 |
(0.2%) |
25.3% |
23.9 |
31.9 |
5.0% |
11.4% |
1.3x |
Accumulate |
|
|
Jubilee Holdings |
378.8 |
393.8 |
4.0% |
22.1% |
322.5 |
407.5 |
3.4% |
6.9% |
0.6x |
Hold |
|
|
Britam |
11.6 |
13.1 |
12.5% |
44.0% |
9.1 |
13.5 |
0.0% |
3.4% |
1.2x |
Lighten |
|
|
*Target Price as per Cytonn Analyst estimates **Upside/ (Downside) is adjusted for Dividend Yield ***Dividend Yield is calculated using FY’2025 Dividends Dividend Yield is calculated using FY’2024 Dividends |
|||||||||||
Weekly Highlights
- Earnings Releases
- KCB Bank Kenya’s FY’2025 Performance
During the week, KCB released their FY’2025 financial results. Below is a summary of the performance
|
Balance Sheet Items |
FY'2024 |
FY'2025 |
y/y change |
|
Government Securities |
302.8 |
333.7 |
10.2% |
|
Net Loans and Advances |
990.4 |
1,151.6 |
16.3% |
|
Total Assets |
1,962.3 |
2,147.2 |
9.4% |
|
Customer Deposits |
1,382.0 |
1,592.6 |
15.2% |
|
Deposits per branch |
2.6 |
3.5 |
35.5% |
|
Total Liabilities |
1,679.3 |
1,806.7 |
7.6% |
|
Shareholders’ Funds |
274.9 |
331.5 |
20.6% |
|
Balance Sheet Ratios |
FY'2024 |
FY'2025 |
% point change |
|
Loan to Deposit Ratio |
71.7% |
72.3% |
0.6% |
|
Government Securities to Deposit Ratio |
21.9% |
21.0% |
(1.0%) |
|
Return on average equity |
24.6% |
22.5% |
(2.0%) |
|
Return on average assets |
3.0% |
3.3% |
0.3% |
|
Income Statement (Kshs Bn) |
FY'2024 |
FY'2025 |
y/y change |
|
Net Interest Income |
137.3 |
148.0 |
7.8% |
|
Net non-Interest Income |
67.5 |
65.8 |
(2.6%) |
|
Total Operating income |
204.9 |
213.8 |
4.3% |
|
Loan Loss provision |
(30.0) |
(32.4) |
8.2% |
|
Total Operating expenses |
(122.89) |
(122.87) |
(0.02%) |
|
Profit before tax |
82.0 |
90.9 |
10.9% |
|
Profit after tax |
61.8 |
68.4 |
10.6% |
|
Core EPS (Kshs) |
18.7 |
20.8 |
11.2% |
|
Dividend per share (Kshs) |
3.0 |
7.0 |
133.3% |
|
Dividend Yield |
4.6% |
8.9% |
4.4% |
|
Dividend Payout Ratio |
15.6% |
32.9% |
17.3% |
|
Income Statement Ratios |
FY'2024 |
FY'2025 |
% points change |
|
Yield from interest-earning assets |
12.1% |
12.1% |
0.0% |
|
Cost of funding |
4.6% |
3.8% |
(0.8%) |
|
Net Interest Spread |
7.4% |
8.3% |
0.9% |
|
Net Interest Margin |
7.8% |
8.6% |
0.8% |
|
Cost of Risk |
14.6% |
15.2% |
0.5% |
|
Net Interest Income as % of operating income |
67.0% |
69.2% |
2.2% |
|
Non-Funded Income as a % of operating income |
33.0% |
30.8% |
(2.2%) |
|
Cost to Income Ratio |
60.0% |
57.5% |
(2.5%) |
|
Cost to Income Ratio (without LLP) |
45.4% |
42.3% |
(3.1%) |
|
Capital Adequacy Ratios |
FY'2024 |
FY'2025 |
% points change |
|
Core Capital/Total Liabilities |
19.4% |
19.9% |
0.5% |
|
Minimum Statutory ratio |
8.0% |
8.0% |
0.0% |
|
Excess |
11.4% |
11.9% |
0.5% |
|
Core Capital/Total Risk Weighted Assets |
16.8% |
18.6% |
1.8% |
|
Minimum Statutory ratio |
10.5% |
10.5% |
0.0% |
|
Excess |
6.3% |
8.1% |
1.8% |
|
Total Capital/Total Risk Weighted Assets |
19.4% |
22.3% |
2.9% |
|
Minimum Statutory ratio |
14.5% |
14.5% |
0.0% |
|
Excess |
4.9% |
7.8% |
2.9% |
|
Liquidity Ratio |
47.6% |
50.8% |
3.2% |
|
Minimum Statutory ratio |
20.0% |
20.0% |
0.0% |
|
Excess |
27.6% |
30.8% |
3.2% |
Key Take-Outs:
- Increased earnings - Core earnings per share (EPS) grew by 11.2% to Kshs 20.8, from Kshs 18.7 in FY’2024, driven by the 4.3% increase in total operating income to Kshs 213.8 bn, from Kshs 204.9 bn in FY’2024, coupled with the 0.02% decrease in total operating expenses to Kshs 122.87 bn from Kshs 122.89 bn in FY’2024,
- Improved asset quality –The bank’s Asset Quality improved, with Gross NPL ratio decreasing to 16.2% in FY’2025, from 19.8% in FY’2024, attributable to an 15.0% increase in gross loans to Kshs 1,308.3 bn, from Kshs 1,137.2 bn recorded in FY ‘2024 compared to the 6.1% decrease in Gross non-performing loans to Kshs 211.8 bn, from Kshs 225.7 bn in FY’2024,
- Expanded balanced sheet - The balance sheet recorded an expansion as total assets increased by 9.4% to Kshs 2,147.2 bn, from Kshs 1,962.3 bn in FY’2024, mainly driven by a 16.3% increase in net loans and advances to Kshs 1,151.6 bn, from 990.4 bn in Q3’2024.
For a more detailed analysis, please see the KCB’s FY’2025 Earnings Note
- Stanbic Bank FY’2025 Performance
Below is a summary of Stanbic Bank’s FY’2025 performance:
|
Balance Sheet |
FY'2024 (Kshs bn) |
FY'2025 (Kshs bn) |
y/y change |
|
Net Loans and Advances to Customers |
230.3 |
270.0 |
17.2% |
|
Kenya Government Securities |
75.5 |
103.0 |
36.4% |
|
Total Assets |
454.8 |
541.3 |
19.0% |
|
Customer Deposits |
321.6 |
384.2 |
19.5% |
|
Deposits Per Branch |
10.7 |
12.8 |
19.5% |
|
Total Liabilities |
379.4 |
461.1 |
21.5% |
|
Shareholders' Funds |
75.4 |
80.1 |
6.3% |
|
Balance sheet Ratios |
FY'2024 |
FY'2025 |
% point change |
|
Loan to Deposit ratio |
71.6% |
70.3% |
(1.3%) |
|
Government securities to deposits ratio |
23.5% |
26.8% |
3.3% |
|
Return on average equity |
19.1% |
18.8% |
(0.3%) |
|
Return on average assets |
3.0% |
2.7% |
(0.3%) |
|
Income Statement |
FY'2024 (Kshs bn) |
FY'2025 (Kshs bn) |
y/y change |
|
Net interest Income |
24.3 |
24.1 |
(1.0%) |
|
Non-interest income |
15.4 |
14.4 |
(6.4%) |
|
Total Operating income |
39.7 |
38.5 |
(3.1%) |
|
Loan loss provision |
(3.1) |
(1.6) |
(47.5%) |
|
Total Operating expenses |
(20.8) |
(19.6) |
(5.7%) |
|
Profit before tax |
19.0 |
18.9 |
(0.2%) |
|
Profit after tax |
13.7 |
13.7 |
0.0% |
|
Core EPS |
34.7 |
34.7 |
0.0% |
|
Dividend Per Share |
20.7 |
22.4 |
7.8% |
|
Dividend Yield |
12.9% |
8.6% |
(4.3%) |
|
Payout Ratio |
59.8% |
64.4% |
4.6% |
|
Income Statement Ratios |
FY'2024 |
FY'2025 |
% point change |
|
Yield from interest-earning assets |
12.6% |
10.2% |
(2.5%) |
|
Cost of funding |
7.1% |
3.8% |
(3.3%) |
|
Net Interest Margin |
5.9% |
5.7% |
(0.2%) |
|
Net Interest Income as % of operating income |
61.2% |
62.5% |
1.3% |
|
Non-Funded Income as a % of operating income |
38.8% |
37.5% |
(1.3%) |
|
Cost to Income Ratio |
52.3% |
50.9% |
(1.4%) |
|
CIR without LLP |
44.5% |
46.6% |
2.2% |
|
Cost to Assets |
3.9% |
3.3% |
(0.6%) |
|
Capital Adequacy Ratios |
FY'2024 |
FY'2025 |
% points change |
|
Core Capital/Total Liabilities |
17.1% |
15.9% |
(1.2%) |
|
Minimum Statutory ratio |
8.0% |
8.0% |
0.0% |
|
Excess |
9.1% |
7.9% |
(1.2%) |
|
Core Capital/Total Risk Weighted Assets |
14.9% |
14.0% |
(0.9%) |
|
Minimum Statutory ratio |
10.5% |
10.5% |
0.0% |
|
Excess |
4.4% |
3.5% |
(0.9%) |
|
Total Capital/Total Risk Weighted Assets |
18.4% |
17.4% |
(1.0%) |
|
Minimum Statutory ratio |
14.5% |
14.5% |
0.0% |
|
Excess |
3.9% |
2.9% |
(1.0%) |
|
Liquidity Ratio |
50.5% |
55.5% |
5.0% |
|
Minimum Statutory ratio |
20.0% |
20.0% |
0.0% |
|
Excess |
30.5% |
35.5% |
5.0% |
Key Take-Outs:
- Increased earnings - Core earnings per share increased marginally by 0.02% to remain relatively unchanged at the Kshs 34.7 recorded in in FY’2024, mainly driven by 5.7% decrease in total operating expense to Kshs 19.6 bn, from Kshs 20.8 bn in FY’2024 which outpaced the 3.1% increase in total operating income to Kshs 38.5 bn, from Kshs 39.7 bn in FY’ 2024
- Improved asset quality – The bank’s Asset Quality improved, NPL ratio decreasing to 8.1% in FY’2025, from 9.1% in FY’2024, attributable to an 2.9% increase in Gross non-performing loans to Kshs 23.3 bn, from Kshs 22.6 bn in FY’2024, relative to the 16.8% increase in gross loans to Kshs 289.6 bn, from Kshs 248.1 bn recorded in FY’2024,
- Expanded Balanced sheet - The balance sheet recorded an expansion as total assets increased by 19.0% to Kshs 541.3 bn, from Kshs 454.8 bn in FY’2024, mainly driven by a 17.2% increase in net loans and advances to customers to Kshs 270.0 bn, from 230.3 bn in FY’2024. Government securities increased by 36.4% to Kshs 103.0 bn, from Kshs 75.5 bn in FY’2024
For a more detailed analysis, please see the Stanbic’s FY’2025 Earnings Note
Asset Quality:
The table below shows the asset quality of listed banks that have released their FY’2025 results using several metrics:
|
Cytonn Report: Listed Banks Asset Quality in FY’2025 |
||||||
|
Bank |
FY'2025 NPL Ratio* |
FY'2024 NPL Ratio** |
% point change in NPL Ratio |
FY'2025 NPL Coverage* |
FY'2024 NPL Coverage** |
% point change in NPL Coverage |
|
Absa Bank Kenya |
11.5% |
12.6% |
(1.1%) |
64.6% |
66.0% |
(1.4%) |
|
Stanbic Holdings |
8.0% |
9.1% |
(1.1%) |
84.3% |
78.4% |
5.9% |
|
KCB Group |
16.2% |
19.8% |
(3.7%) |
74.0% |
65.1% |
9.0% |
|
Mkt Weighted Average* |
13.1% |
13.4% |
(0.2%) |
73.0% |
66.7% |
6.4% |
|
*Market cap weighted as at 14/03/2026 |
||||||
|
**Market cap weighted as at 13/03/2025 |
||||||
Key take-outs from the table include;
- Asset quality for the listed banks that have released results increased during FY’2025, with market-weighted average NPL ratio decreasing by 0.2% points to 13.1% from 13.4% in FY’2024 largely due to KCB’s numbers, and,
- Market-weighted average NPL Coverage for the three listed banks increased by 9.0% and 5.9% points to 73.0% in FY’2025 from 66.7% recorded in FY’2024. The increase was attributable to KCB Bank’s coverage ratio increasing by 9.0% points to 74.0% from 65.1% in FY’2024, coupled with Stanbic Bank’s NPL coverage ratio increasing by 5.9% points to 84.3% from 78.4% in FY’2024.
Summary Performance
The table below shows the performance of listed banks that have released their FY’2025 results using several metrics:
|
Cytonn Report: Listed Banks Performance in FY’2025 |
||||||||||||||
|
Bank |
Core EPS Growth |
Interest Income Growth |
Interest Expense Growth |
Net Interest Income Growth |
Net Interest Margin |
Non-Funded Income Growth |
NFI to Total Operating Income |
Growth in Total Fees & Commissions |
Deposit Growth |
Growth in Government Securities |
Loan to Deposit Ratio |
Loan Growth |
Return on Average Equity |
|
|
KCB Group |
11.2% |
(1.7%) |
(18.9%) |
7.8% |
8.6% |
(2.6%) |
30.8% |
0.7% |
15.2% |
10.2% |
72.3% |
16.3% |
22.5% |
|
|
Absa Bank Kenya |
9.7% |
(10.9%) |
(22.2%) |
(6.4%) |
9.1% |
12.2% |
29.4% |
18.8% |
1.4% |
20.7% |
83.8% |
1.0% |
24.7% |
|
|
Stanbic Group |
0.0% |
(17.2%) |
(41.4%) |
(1.0%) |
5.7% |
(6.4%) |
37.5% |
(10.0%) |
19.5% |
36.4% |
70.3% |
17.2% |
18.8% |
|
|
FY'2025 Mkt Weighted Average* |
8.6% |
(7.7%) |
(24.4%) |
1.5% |
8.2% |
1.4% |
31.6% |
4.4% |
11.6% |
18.7% |
75.6% |
11.6% |
22.5% |
|
|
FY'24 Mkt Weighted Average* |
26.2% |
20.5% |
42.6% |
12.0% |
7.6% |
13.9% |
36.1% |
9.2% |
(4.4%) |
18.9% |
66.5% |
(7.6%) |
22.8% |
|
|
*Market cap weighted as at 14/03/2026 |
||||||||||||||
|
**Market cap weighted as at 13/03/2025 |
||||||||||||||
Key take-outs from the table include:
- The listed banks that have released their FY’2025 results recorded a 8.6% growth in core Earnings per Share (EPS) in FY2025, compared to the weighted average growth of 26.2% in FY’2024, an indication of improved performance attributable to the improved operating environment experienced during FY’2025,
- Interest income recorded a weighted average decrease of 7.7% in FY’2025, compared to 20.5% in FY’2024. Similarly, interest expenses recorded a market-weighted average decline of 24.4% in FY’2025 compared to the weighted average growth of 42.6% in FY’2024.
- The Banks’ net interest income recorded a weighted average growth of 1.5% in FY’2025, a decrease from the 12.0% recorded over a similar period in 2024, while the non-funded income grew by 1.4% in FY’2025 slower than the 13.9% growth recorded in FY’ 2024, and,
- The Banks recorded a weighted average deposit growth of 11.6%, compared to the decrease in market-weighted average deposit of 4.4% in FY’2024.
- Liberty FY’2025 results
During the week, Liberty Kenya Holdings released their FY’2025 results, highlighting that the Profit After Tax decreased by 51.9% to Kshs 0.7 bn, from the Kshs 1.4 bn recorded in FY’2024. The performance was mainly driven by 55.1% decrease in net insurance service revenue to Kshs 0.5 bn in FY’2025, from Kshs 1.1 bn in FY’2024, coupled with 23.0% decrease in net investment revenue to Kshs 1.7 bn, from Kshs 2.1 bn in FY’2024.
|
Cytonn Report: Liberty Kenya Holdings Income Statement |
|||
|
Item (All figures in Bns) |
FY'2024 |
FY'2025 |
y/y change |
|
Net Insurance Service Revenue |
1.1 |
0.5 |
(55.1%) |
|
Net Financial Result |
2.1 |
1.7 |
(23.0%) |
|
Total Insurance and Investment Result |
3.2 |
2.1 |
(33.6%) |
|
Other Operating Result |
(1.1) |
(1.0) |
(7.0%) |
|
Profit Before Tax |
2.1 |
1.1 |
(47.8%) |
|
Profit after tax |
1.4 |
0.7 |
(51.9%) |
|
Core EPS |
2.6 |
0.9 |
(67.2%) |
|
Dividend Per Share |
1.0 |
0.5 |
(50.0%) |
|
Dividend Yield |
15.0% |
5.0% |
(10.0%) points |
|
Dividend Payout Ratio |
39.1% |
40.6% |
1.5% points |
|
Cytonn Report: Liberty Kenya Holdings Balance Sheet |
|||
|
Item (All figures in Bns) |
FY'2024 |
FY'2025 |
y/y change |
|
Financial Investments |
28.1 |
33.2 |
17.9% |
|
Reinsurance contract assets |
1.9 |
1.4 |
(24.4%) |
|
Total Assets |
48.1 |
46.3 |
(3.8%) |
|
Insurance contract Liabilities |
18.9 |
20.8 |
9.8% |
|
Total Liabilities |
37.5 |
36.2 |
(3.4%) |
|
Shareholders’ Funds |
10.6 |
10.1 |
(5.3%) |
Key take outs from the results include:
- Core Earnings Per share decreased by 67.2% to Kshs 0.9, from Kshs 2.6 in FY’2024, driven by the 55.1% decrease in net insurance service revenue to Kshs 0.5 bn in FY’2025, from Kshs 1.1 bn in FY’2024, coupled with 23.0% decrease in net investment revenue to Kshs 1.7 bn, from Kshs 2.1 bn in FY’2024,
- Net insurance revenue before reinsurance contracts held decreased by 28.6% to Kshs 1.7 bn in FY’2025 from of Kshs 2.4 bn in FY’2024, while net expense from reinsurance contracts held decreased by 7.8% to Kshs 1.3 bn from Kshs 1.4 bn in FY’2024, this translated to an insurance service result decrease of 55.1% to Kshs 0.5 bn from Kshs 1.1 bn in FY’2024,
- Net Financial Result decreased by 23.0% to Kshs 1.7 bn, from Kshs 2.1 bn in FY’2024.This was majorly attributable 17.8% decrease investment income to Kshs 4.0 bn from Kshs 4.9 bn in FY’2024. The performance was however supported by a 13.8% decrease in net insurance finance expense to Kshs 2.4 bn from Kshs 2.8 bn in FY’2024
- The balance sheet recorded a contraction as total assets decreased by 3.8% to Kshs 46.3 bn in FY’2025, from Kshs 48.1 bn in FY’2024 mainly driven by 24.4% decrease in reinsurance contract assets to Kshs 1.4 bn from Kshs 1.9 bn recorded in FY’2024, which was however supported by 17.9% increase in financial investments to Kshs 33.2 bn, from Kshs 28.1 bn in FY’2024.
- Total liabilities decreased by 3.4% to Kshs 36.2 bn, from Kshs 37.5 bn in FY’2024 attributable to the 46.7% decrease in financial liabilities to Kshs 0.1 bn, from Kshs 0.2 bn in FY’2024. Notably, insurance contract liabilities increased by 9.8% to Kshs 20.8 bn from Kshs 18.9 bn in FY’2024.
- The Board of Directors recommended a dividend of Kshs 0.50 per share from 1.0 in FY’2024, translating to a dividend yield and dividend payout ratio of 5.0% and 40.6% respectively in FY’2025.
Going forward, the factors that would drive the company’s growth would be:
- Unification of Policy Administration Systems – The company is working on integrating its multiple legacy policy administration systems, particularly for Liberty Life, into a single unified platform. This initiative is expected to enhance operational efficiency, streamline underwriting and policy management, improve customer service, and enable faster product rollout, thereby supporting the company’s long-term growth strategy.
- Proposed Indirect Acquisition by Taarifa LTD of 54.1% Stake in Nation Media Group from Agha Khan Fund for Economic Development S.A.
During the week, Nation Media Group PLC (NMG) announced that Taarifa Ltd (Taarifa) had served a Notice of Intention not to make a take-over offer, triggered by the proposed indirect acquisition of 54.1% of NMG’s issued share capital through NPRT Holdings Africa Limited (“NPRT”) from the Aga Khan Fund for Economic Development S.A. (AKFED). NPRT currently holds 92,618,177 ordinary shares in NMG, representing a majority stake, and the acquisition will result in Taarifa obtaining effective control of NMG, while the remaining shares will continue to be listed and publicly traded across the Nairobi Securities Exchange (NSE), Uganda Securities Exchange (USE), Rwanda Stock Exchange (RSE), and Dar es Salaam Stock Exchange (DSE).
Key highlights of the proposed transaction include:
- The acquisition of NPRT constitutes an indirect acquisition of a controlling stake in NMG, effectively granting Taarifa strategic control of the company while leaving the general shareholders’ rights and interests unchanged.
- Taarifa has applied to the Capital Markets Authority of Kenya (CMA), Capital Markets and Securities Authority of Tanzania (CMSA), and Capital Markets Authority of Uganda (CMAU) for exemptions from mandatory take-over procedures, allowing reliance on the primary Kenyan regulatory framework without triggering parallel mandatory offers in other jurisdictions.
- The transaction will be subject to approvals from regional regulatory and competition authorities, including communications regulators and competition commissions in Kenya, Tanzania, Uganda, and across the East African Community and COMESA.
- Taarifa is not acting in concert with any other person or entity in relation to the transaction and currently holds no shares in NMG directly or indirectly
The proposed transaction is expected to preserve NMG’s brand, governance structures, management team, and operational model, with no immediate integration of systems. By retaining NMG’s public listing across multiple East African exchanges, the transaction also supports the development of capital markets in Kenya, Tanzania, Uganda, and Rwanda, reinforcing investor confidence and market depth. The indirect acquisition of a controlling stake in NMG by Taarifa represents a significant strategic development for the East African media sector, constituting a shareholder-level change in control rather than an operational restructuring. The transaction positions NMG to benefit from Taarifa’s capital and media expertise, while providing continuity for consumers, employees, and minority shareholders, and supporting the long-term growth and sustainability of one of East Africa’s most influential media houses.
- Centum Completion of the Sale of Bakki Holdco Limited
During the week, Centum Investment Company Plc successfully completed the sale of its remaining 50.0% stake in Bakki Holdco Limited a holding vehicle through which Centum held a 27.2% indirect interest in Sidian Bank Limited. Following receipt of the necessary regulatory approvals from the Central Bank of Kenya and the Competition Authority of Kenya, and upon fulfillment of all customary conditions precedent, the transaction was concluded. With the completion of this sale, Bakki Holdco Limited will cease to be a subsidiary of Centum, marking the Group’s full exit from Sidian Bank. The disposal aligns with Centum’s broader portfolio management strategy aimed at strengthening liquidity and reallocating capital toward new growth investment opportunities.
Key highlights of the completed transaction include:
- Centum has sold its entire 50.0% stake in Bakki Holdco Limited, formally exiting its indirect 27.2% interest in Sidian Bank Limited, thereby concluding a multi-stage divestment process initiated after the failed Access Bank transaction in 2022.
- The disposal follows receipt of regulatory approvals from the Central Bank of Kenya and the Competition Authority of Kenya, and the fulfilment of all customary conditions precedent, ensuring a compliant and orderly exit.
- The transaction forms part of Centum’s broader portfolio restructuring programme, designed to enhance liquidity and free up capital for new growth opportunities, reflecting a methodical approach to portfolio management.
- Centum’s initial investment in Sidian Bank (then K-Rep Microfinance Bank) began in 2004, growing through multiple capital injections and strategic acquisitions, including majority control in 2014, rebranding to Sidian Bank in 2016, and participation in successive rights issues and share acquisitions, cumulative investments have a carrying value of Kshs 1.1 bn.
- The divestment strategy included phased disposals through direct sales of shares at both Centum and Bakki levels between 2023 and 2025, resulting in a gradual reduction of holdings and mitigation of market impact while preserving value.
- Sidian Bank’s financial position strengthened through Centum’s involvement and subsequent phased exit; by September 2025, assets reached KSh 94.8 billion, deposits KSh 78.1 billion, and nine-month profit after tax KSh 1.4 billion, highlighting the institution’s improved scale and profitability.
- The sale is expected to result in a modest gain above Bakki Holdco Limited’s carrying value of approximately KSh 1.0 billion recorded in early 2025, with final financial effects to be reported in the FY’2026 cycle.
- This divestment concludes Centum’s long-term investment in the East African banking sector and positions the Group to redeploy capital into higher-growth opportunities, while ensuring continuity and stability for Sidian Bank’s operations and stakeholders.
The successful exit from Sidian Bank significantly enhances Centum’s liquidity position, providing capital that can now be redeployed into higher-growth investment opportunities across the Group’s portfolio. This divestment allows Centum to focus on sectors and markets aligned with its strategic priorities, including real estate, private equity, and alternative investments, while reducing exposure to the banking sector. By concluding a long-term investment with a disciplined exit strategy, Centum reinforces its reputation as a proactive portfolio manager capable of generating value through strategic capital allocation. The resources are expected to accelerate the Group’s growth initiatives, improve returns on invested capital, and support long-term shareholder value creation.
We maintain a “cautiously optimistic” short-term outlook supported primarily by earnings-led attractive valuations, lower yields on short-term government papers and expected global and local economic recovery, and, “neutral” in the long term as persistent foreign investor outflows continue to constrain market liquidity and limit broad-based market re-rating. With the market currently trading at par to its future growth (PEG Ratio at 1.0x), where performance will be driven by company-specific fundamentals rather than general market direction, we believe that investors should reposition towards value stocks exhibiting strong earnings growth, attractive dividend yields, solid balance sheets, sustainable competitive advantages and trading at compelling discounts to their intrinsic value. While foreign investor sell-offs are expected to continue exerting pressure in the near term, we believe this will create selective entry opportunities for long-term investors.
- Residential Sector
- KMRC to issue a green bond to support housing finance
During the week, Kenya Mortgage Refinance Company (KMRC) announced plans to raise new debt through a green bond expected to be issued in April. The bond aims to raise funds to support the refinancing of affordable and environmentally sustainable housing projects. The issuance follows strong investor interest in previous KMRC bonds which were oversubscribed by about 480.0% during which it raised Kshs 1.4bn.
KMRC’s main role is to provide long-term, low-cost funding to banks and mortgage lenders so they can offer more affordable home loans to Kenyans. By issuing the green bond, the company intends to attract investors interested in sustainable finance while channeling the funds into climate-friendly housing developments. The initiative aligns with Kenya’s broader efforts to expand access to housing and support sustainable urban development.
We expect this development to have positive implications for the Real Estate sector in Kenya. Increased mortgage refinancing capacity means banks may be able to provide more affordable and longer-tenure home loans, which could boost demand for residential properties. As more financing becomes available for housing projects, developers may be encouraged to build more affordable and environmentally sustainable homes, potentially stimulating growth in the Real Estate and construction sectors while helping reduce the country’s housing deficit.
- Infrastructure Sector
- Expansion of JKIA as the first project under new infrastructure fund
During the week, the government announced that the expansion of Jomo Kenyatta International Airport (JKIA) will be the first project financed under the proposed National Infrastructure Fund. The fund, created under the National Infrastructure Fund Bill, aims to provide a new financing model for large national infrastructure projects. It comes after the cancellation of a previous public-private partnership proposal with Adani Group, which faced criticism over transparency and procurement concerns.
The infrastructure fund is expected to mobilize up to Kshs 1.2 tn from domestic institutional investors such as pension funds, insurance companies, and other long-term investors. By tapping into local capital, the government intends to reduce reliance on expensive external borrowing while still funding major projects in transport, energy, and housing. The JKIA expansion will act as the pilot project demonstrating how the fund can finance strategic infrastructure while maintaining strong governance and accountability standards.
We expect that this development to have positive implications for the Real Estate sector, particularly in areas surrounding the airport and key transport corridors in Nairobi. Improved infrastructure tends to increase economic activity, which may drive demand for commercial developments such as hotels, offices, retail spaces, and logistics facilities. Additionally, the broader infrastructure investments supported by the fund could stimulate urban growth and housing development, potentially raising land values and encouraging new Real Estate projects.
- Real Estate Investments Trusts
- REITs Weekly Performance
On the Unquoted Securities Platform, Acorn D-REIT and I-REIT traded at Kshs 27.4 and Kshs 23.2 per unit, respectively, as per the last updated data on 13th March 2026. The performance represented a 33.4% and 14.5% gain for the D-REIT and I-REIT, respectively, from the Kshs 20.0 inception price. The volumes traded for the D-REIT and I-REIT came in at 13.4 mn and 42.0 mn shares, respectively. Additionally, ILAM Fahari I-REIT traded at Kshs 11.0 per share as of 13th March 2026 representing a 45.0% loss from the Kshs 20.0 inception price. The volume traded to date came in at 1.2 mn shares for the I-REIT, REITs offer various benefits, such as tax exemptions, diversified portfolios, and stable long-term profits. However, the ongoing decline in the performance of Kenyan REITs and the restructuring of their business portfolios are hindering significant previous investments. Additional general challenges include
REITs offer various benefits, such as tax exemptions, diversified portfolios, and stable long-term profits. However, the ongoing decline in the performance of Kenyan REITs and the restructuring of their business portfolios are hindering significant previous investments. Additional general challenges include:
- Insufficient understanding of the investment instrument among investors leading to a slower uptake of REIT products,
- Lengthy approval processes for REIT creation,
- High minimum capital requirements of Kshs 100.0 mn for REIT trustees compared to Kshs 10.0 mn for pension funds Trustees, essentially limiting the licensed REIT Trustee to banks only
- The rigidity of choice between either a D-REIT or and I-REIT forces managers to form two REITs, rather than having one Hybrid REIT that can allocate between development and income earning properties
- Limiting the type of legal entity that can form a REIT to only a trust company, as opposed to allowing other entities such as partnerships, and companies,
- We need to give time before REITS are required to list, they would be allowed to stay private for a few years before the requirement to list given that not all companies maybe comfortable with listing on day one, and,
- Minimum subscription amounts or offer parcels set at Kshs 0.1 mn for D-REITs and Kshs 5.0 mn for restricted I-REITs. The significant capital requirements still make REITs relatively inaccessible to smaller retail investors compared to other investment vehicles like unit trusts or government bonds, all of which continue to limit the performance of Kenyan REITs.
We expect the performance of Kenya’s Real Estate sector to remain resilient, supported by several factors: i) KMRC plans Green Bond to support housing finance ii) Expansion of JKIA as the first project under new infrastructure fund. However, challenges such as, infrastructure constraints, weak investor appetite in listed REITs such as ILAM Fahari I-REIT, oversupply in select real estate classes, and high capital demands will continue to impede the sector’s optimal performance.
Kenya has established itself as one of Africa’s leading digital finance markets, driven largely by the rapid adoption of mobile money services and fintech innovation. Platforms such as M-Pesa and Airtel Money have transformed how individuals and businesses transact, making digital payments widely accessible and significantly improving financial inclusion. As digital financial infrastructure continues to evolve, new technologies are emerging that could further reshape the country’s financial ecosystem. One such innovation is stablecoins, a category of digital assets designed to maintain a stable value relative to an underlying asset, most commonly a fiat currency such as the US dollar. Stablecoins combine the efficiency and transparency of blockchain technology with price stability, enabling them to function as a potential medium of exchange, store of value, and settlement asset within digital financial systems.
Globally, stablecoins have become an increasingly important component of the cryptocurrency ecosystem, supporting activities such as digital asset trading, decentralized finance, and cross-border payments. Their use has grown significantly in recent years as individuals and institutions seek faster and more cost-effective methods of transferring value across borders. For emerging markets such as Kenya, stablecoins could present several potential opportunities. These include reducing the cost of international remittances, supporting digital commerce, improving cross-border payments in terms of speed of transactions and costs, and enhancing access to financial services for individuals who may not be fully served by traditional banking systems.
This topical examines the global stablecoin market, the different types of stablecoins and how they function, the key players in the industry, and the potential applications of stablecoins within Kenya’s digital economy. It also reviews the evolving regulatory landscape globally and within Kenya, highlighting considerations that policymakers may need to address as digital asset adoption continues to expand. This discussion is structured into the following sections:
- Introduction to Stablecoins
- Overview of the Global Stablecoin Market
- Types of Stablecoins and Their Mechanisms
- Potential Applications of Stablecoins in Kenya
- Global regulatory landscape
- Regulatory landscape in Kenya
- Recommendation and Conclusion
Section I. Introduction to Stablecoins
Stablecoins are a category of digital assets designed to maintain a stable value by being pegged to an underlying asset, most commonly a fiat currency such as the US dollar. Unlike traditional cryptocurrencies such as Bitcoin and Ethereum, which experience significant price volatility, stablecoins aim to provide price stability while retaining the advantages of blockchain technology. While there are many types of stablecoins, they typically fall into one of three categories: fiat backed stablecoins, crypto-backed stablecoins, algorithmic stablecoins and commodity backed stablecoins. Further definitions of these categories are provided in section III.
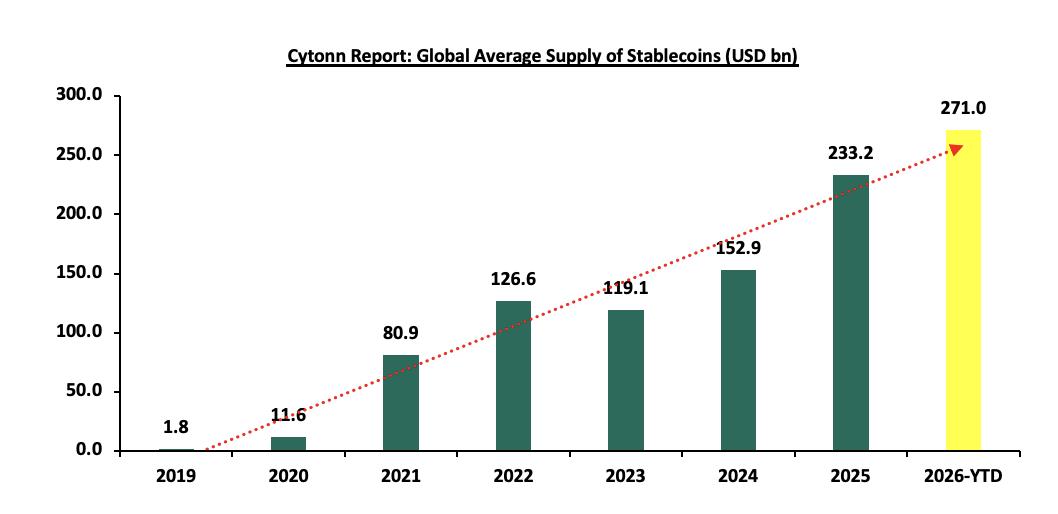
Over the past decade, stablecoins have emerged as one of the fastest-growing segments of the cryptocurrency ecosystem. Their growth has been driven by increasing demand for digital payments, decentralized finance (DeFi), and cross-border financial transactions. By combining the efficiency of blockchain technology with price stability, stablecoins serve as a bridge between traditional financial systems and the digital asset economy. The chart below shows the global average supply of stable coins since 2019;
Source: VISA Onchain Analytics
Stablecoin supply refers to the total number of stablecoin units currently in circulation, designed to be directly tied to the reserve assets backing them to maintain their price stability. The global supply of stablecoins has grown significantly over the past seven years, increasing from USD 1.8 bn in 2019 to USD 271.0 bn in 2026 YTD, representing a compound annual growth rate (CAGR) of 116.8% in the 7-year period between 2019 and 2026. The expansion accelerated particularly between 2020 and 2022, as stablecoins gained popularity within cryptocurrency trading and decentralized finance ecosystems, rising from USD 11.6 bn to USD 126.6 bn over the period. Although there was a slight contraction in 2023 to USD 119.1 bn but the market quickly rebounded, reaching USD 233.2 bn in 2025 and continuing to expand to USD 270.9 bn in 2026 YTD. This shows the rapid and sustained growth of stablecoins globally, highlighting their increasing importance as liquidity instruments in digital asset markets and their growing role in facilitating payments, trading, and decentralized financial services.
Globally, stablecoins are increasingly being used for trading, payments, remittances, and decentralized financial services. In emerging markets such as Kenya, stablecoins may offer opportunities to enhance financial inclusion, reduce the cost of international transfers, and support the growth of digital commerce. Kenya already has one of the most advanced digital financial ecosystems in Africa, largely due to the widespread adoption of mobile money services such as M-Pesa. The integration of stablecoins within this ecosystem could further expand the country’s digital financial capabilities.
Main Stablecoin Companies
Stablecoin companies are firms that issue and manage stablecoins, which are digital currencies designed to maintain a stable value. They create these tokens on blockchain networks and typically peg them to real world assets such as the US dollar to reduce price volatility. To support this value, the companies hold reserves such as cash, government securities, or other liquid assets that back the stablecoins in circulation. They also manage the systems that allow users to issue, redeem, transfer, and store the tokens for payments, trading, and cross border transactions. The table below shows the top 10 stablecoin companies by marketcap as at 13th March 2026:
|
Cytonn Report: Top 10 Stablecoin Companies by Market Cap as at 13th March 2026 |
|||||
|
No |
Company |
Founding year |
Circulation Market Cap (USD) |
Percentage (%) |
|
|
1 |
Tether |
2014 |
184.0 |
61.4% |
|
|
2 |
USDC |
2013 |
78.8 |
26.3% |
|
|
3 |
USDS |
2014 |
11.2 |
3.7% |
|
|
4 |
Ethena USDe |
2023 |
5.9 |
2.0% |
|
|
5 |
Dai |
2014 |
4.3 |
1.4% |
|
|
6 |
Paypal USD |
2012 |
4.1 |
1.4% |
|
|
7 |
Global Dollar |
2012 |
1.7 |
0.6% |
|
|
8 |
Ripple USD |
2012 |
1.6 |
0.5% |
|
|
9 |
USDtb |
2023 |
0.8 |
0.3% |
|
|
10 |
Others |
- |
7.2 |
2.4% |
|
|
Total |
|
|
299.6 |
100% |
|
Source: Forbes
Tether dominates the market with a capitalization of USD 184.0 bn, accounting for 61.4% of the total stablecoin supply, underscoring its position as the primary liquidity provider across most stablecoin exchanges and decentralized finance platforms. It is followed by USD Coin (USDC), which holds USD 78.8 billion or 26.3% of the market, giving the top two issuers a combined market share of nearly 88.0%, indicating a highly concentrated industry. While USDT enjoys more liquidity and has been around for longer, USDC is seen as more transparent and regulatory compliant hence more trusted. The remaining stablecoins including USDS, Ethena USDe, Dai, and PayPal USD, each account for relatively small shares, individually below 4.0% of the market. This distribution shows that while several alternative stablecoins exist, the market is overwhelmingly dominated by a few large issuers, with smaller players collectively making up only a minor portion of the ecosystem.
Section II. Overview of the Global Stablecoin Market
Stablecoins first emerged in the mid-2010s as a solution to the price volatility associated with cryptocurrencies such as Bitcoin. One of the earliest and most widely recognized stablecoins, Tether (USDT), was launched in 2014 by the company Tether Limited. The project was initially developed by entrepreneurs Brock Pierce, Reeve Collins, and Craig Sellars, with early operational links to the crypto exchange Bitfinex. The stablecoin was created in the United States, and its core idea was to maintain a 1:1 peg with the U.S. dollar, allowing users to transact on blockchain networks while avoiding large price swings.
As of 13th March 2026, the global stablecoins market capitalization stood at USD 315.4 bn with the USDT dominating at 58.3% with a market cap of USD 183.9 bn. The USDT (Tether) is a stablecoin pegged to the US dollar designed to maintain price stability in the volatile cryptocurrency market by being backed by Tether's dollar reserves.
Stablecoin participation varies significantly by country, with the highest adoption occurring in economies experiencing currency volatility, high remittance flows, or strong demand for dollar-denominated assets. Countries such as Nigeria, India, Argentina, Brazil, and Turkey are among the most active users of stablecoins, largely driven by inflationary pressures, exchange-rate instability, and limited access to foreign currency. In these markets, stablecoins are increasingly used for remittances, savings in U.S. dollar equivalents, and digital payments.
Source: Allium
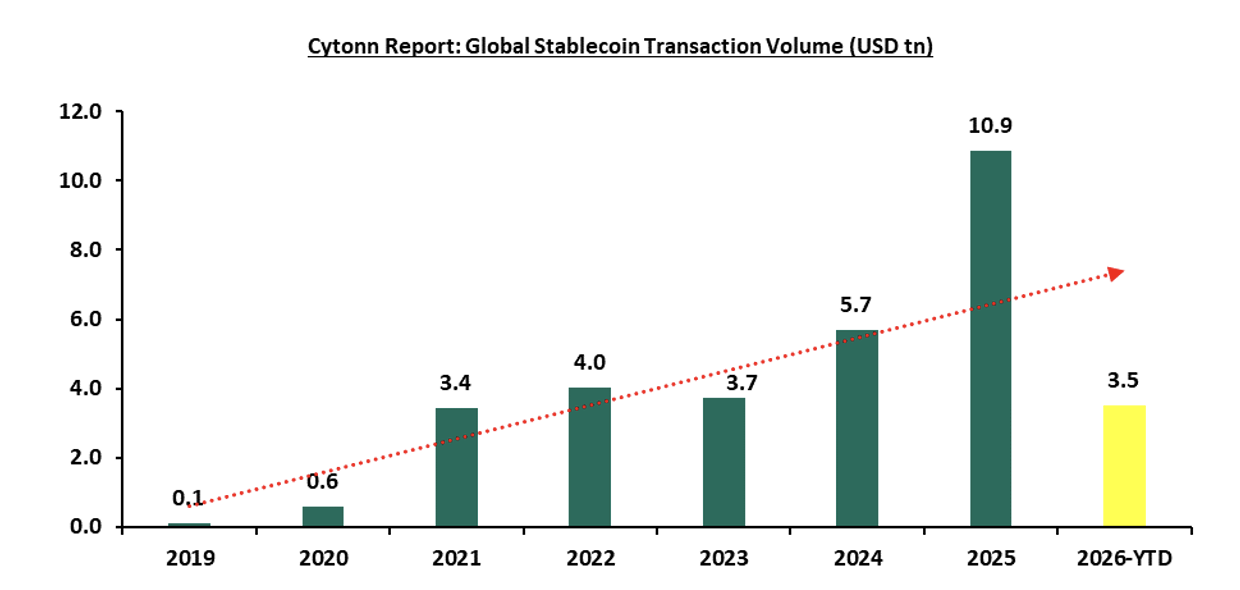
There has been a sharp expansion in global stablecoin transaction volume between 2019 and 2025. Volumes increased from approximately USD 0.1 tn in 2019 to about USD 10.9 tn in 2025, reflecting extremely rapid adoption of stablecoins across digital finance and payments. This represents a compound annual growth rate (CAGR) of 118.0% over the six-year period, indicating that transaction activity more than doubled on average each year. Growth accelerated particularly after 2020, with volumes rising from USD 0.6 tn in 2020 to USD 3.4 tn in 2021 and continuing upward to USD 5.7 tn in 2024 before reaching the peak of USD 10.9 tn in 2025. Although 2023 experienced a slight dip to USD 3.7 tn, the overall trajectory remained strongly upward, highlighting sustained adoption of stablecoins in global financial activity. The 2026 year-to-date volume of USD 3.5 tn suggests continued momentum, though the final yearly total will depend on activity in the remaining months.
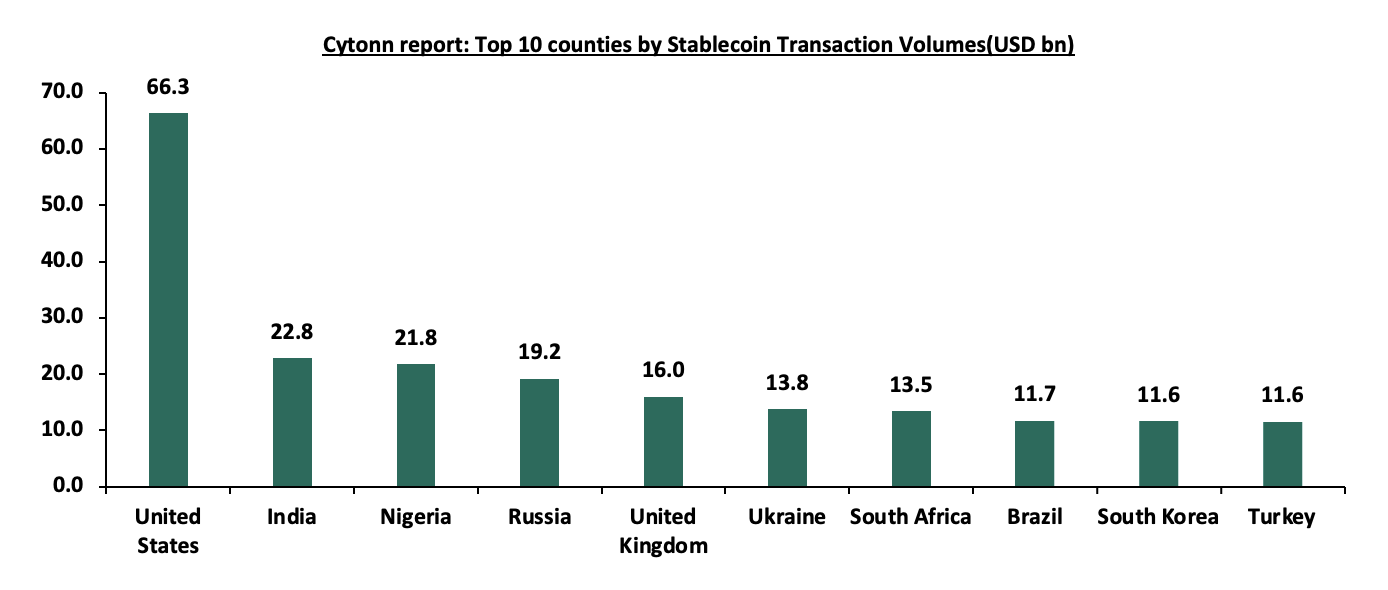
As per the latest published report, the United States records the highest transaction volume at 66.3 USD bn, significantly exceeding the other countries shown. It is followed by India with 22.8 USD bn, and Nigeria at 21.8 USD bn. Russia ranks next with 19.2 USD bn, while Ukraine records 13.8 USD bn. Slightly lower but comparable transaction volumes are observed in Brazil and South Korea, both at 11.7 USD bn, followed by Turkey at 11.6 USD bn. Overall, the chart highlights a substantial gap between the United States and the remaining countries, while most others cluster within a narrower range of approximately 9.2–22.8 USD bn in transaction volume as shown below:
Source: Statista.com, As at September 2024
Today, stablecoins play several key roles within the cryptocurrency ecosystem which include.
- They provide liquidity in digital asset trading. Cryptocurrency exchanges commonly use stablecoins as trading pairs, allowing traders to move funds quickly without converting into fiat currencies.
- Stablecoins are widely used within decentralized finance platforms. These platforms allow users to lend, borrow, and earn yields on digital assets without the need for traditional financial intermediaries.
- Stablecoins are increasingly used for payments and cross-border transfers. Blockchain-based transfers can be completed within minutes and often at significantly lower costs compared to traditional international banking systems.
Section III. Types of Stablecoins and Their Mechanisms
Stablecoins can generally be categorized into four main types based on the mechanisms used to maintain their price stability.
- Fiat-Backed Stablecoins
Fiat-backed stablecoins are supported by reserves of traditional currency held by the issuing organization. Each stablecoin is typically pegged 1:1 to a fiat currency and backed by an equivalent amount of fiat currency, such as the US dollar or Euro, held in bank accounts or short-term financial instruments, which act as collateral. Examples include the Tether (USDT), USD Coin (USDC) and Euro Coin (EURC). This model is widely used because it provides relatively strong price stability and is easier for users to understand.
- Crypto-Backed Stablecoins
Crypto-backed stablecoins are supported by cryptocurrency collateral rather than fiat currency reserves. Because cryptocurrencies can be highly volatile, these stablecoins typically require over-collateralization. This means users must deposit cryptocurrency worth more than the stablecoins they receive. A notable example is DAI which is backed by cryptocurrency such as Ethereum. This model promotes decentralization but introduces risks related to volatility in the collateral assets.
- Algorithmic Stablecoins
Algorithmic stablecoins attempt to maintain price stability through automated supply and demand adjustments rather than collateral reserves. Algorithms increase or decrease the supply of tokens depending on market demand in order to maintain the target price. Because these systems do not hold enough collateral to fully back every coin in circulation, they depend heavily on accurate and reliable market price data. This data helps the system determine when the price has moved away from the intended peg and triggers the mechanisms that restore the stablecoin’s value. However, algorithmic stablecoins have proven to be more vulnerable to market instability, as demonstrated by the collapse of TerraUSD in 2022.
- Commodity backed stablecoins
Commodity-backed stablecoins are a type of digital currency whose value is directly pegged to a tangible asset or commodity, such as gold, oil, or other precious metals. Unlike fiat-backed stablecoins, which are supported by government-issued currencies, commodity-backed stablecoins derive their stability and intrinsic value from the underlying physical asset, which is held in reserve by the issuer. This backing provides investors and users with a hedge against currency volatility and inflation, as the coin’s value is linked to a real-world store of value. By combining blockchain technology with the security of tangible assets, these stablecoins aim to offer price stability, transparency, and trust, enabling their use for payments, remittances, or investment purposes in both domestic and cross-border markets.
Section IV. Potential Applications of Stablecoins in Kenya’s Digital Payments Ecosystem
Stablecoins could have several important applications within Kenya’s digital financial system which may include:
- Cross-Border Remittances
Kenya receives significant remittance inflows from its diaspora community each year. In the month of February 2026 diaspora remittances came in at USD 412.7 mn. Traditional remittance channels can involve high transaction costs and delays. Stablecoins could reduce these costs by enabling direct peer-to-peer transfers through blockchain networks. Diaspora workers could send stablecoins to recipients in Kenya, who could then convert them into Kenyan shillings through digital exchanges or mobile money platforms. The introduction of the remittance taxes by the US provides an opportunity for the use of stablecoins to reduce the costs. Stablecoins can also be used for payment in imports and exports and payment for remote work. Stablecoins can also facilitate payments for imports and exports by enabling faster and lower-cost cross-border transactions compared to traditional banking systems. Businesses can settle international trade payments instantly without relying on correspondent banks or facing delays in foreign currency conversions.
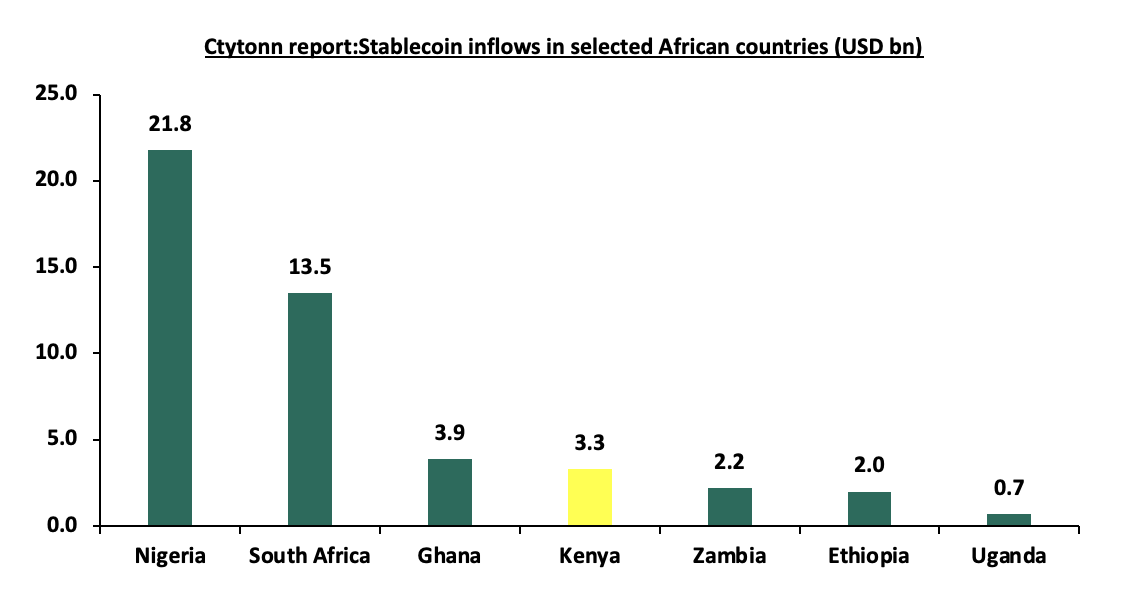
Source: Chainalysis, As at September 2024*
Kenya recorded stablecoin inflows of USD 3.3 bn as at September 2024, making it the fourth-largest recipient among the selected African countries. While the figure is significantly lower than the leading markets Nigeria (USD 21.8 bn) and South Africa (USD 13.5 bn), Kenya still ranks just behind Ghana (USD 3.9 bn) and ahead of Zambia (USD 2.2 bn), Ethiopia (USD 2.0 bn) and Uganda (USD 0.7 bn). This positioning highlights Kenya’s role as a key stablecoin market in East Africa, likely supported by the country’s advanced digital payments ecosystem and high mobile money penetration. The relatively strong inflows suggest growing use of stablecoins for remittances, cross-border transactions, and digital asset trading
- Digital Payments
Stablecoins could also support digital payments for goods and services. Businesses could accept stablecoin payments for international transactions, reducing reliance on costly card networks or international bank transfers.
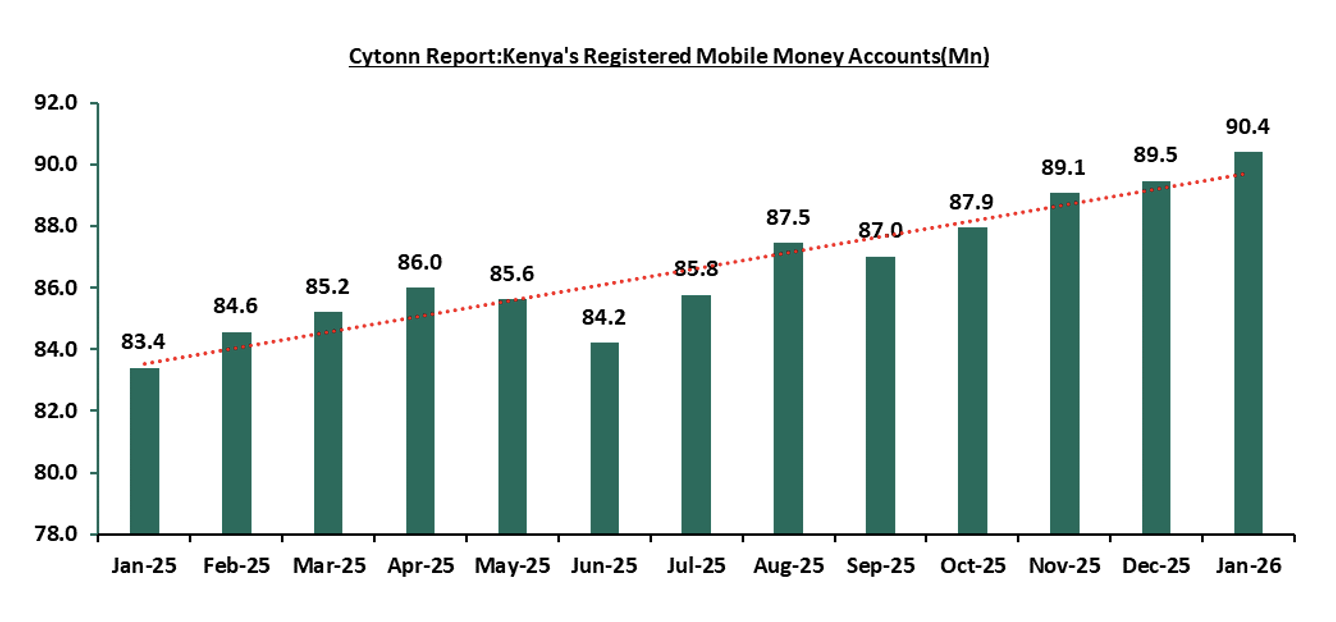
Source: Central Bank of Kenya
The number of mobile money accounts increased by 8.4% overall to 90.4 mn in January 2026 from 83.4 mn in January 2025, indicating steady growth during the period. In 2025, accounts rose gradually to 86.0 mn in April 2025, before slightly declining to 85.6 mn in May 2025 and 84.2 mn in June 2025. Growth resumed thereafter, reaching 85.8 mn in July 25 and 87.5 mn in August 25, followed by a minor dip to 87.0 mn in September 2025. The upward trend continued in the final quarter, increasing to 87.9 mn in Oct-25, 89.1 mn in Nov-25, and 89.5 mn in Dec-25, before peaking at 90.4 Mn in Jan-26.
Stablecoins could be integrated into the digital payments ecosystem in Kenya by linking them with existing mobile money platforms. Through partnerships between fintech firms and mobile network operators, users could convert funds in their mobile wallets into stablecoins pegged to major currencies such as the US dollar. This would enable faster and lower-cost cross-border payments and remittances while still allowing users to transact locally through mobile money.
- Integration with Mobile Money
Kenya’s advanced mobile money infrastructure, led by platforms such as M-Pesa, provides a strong foundation for integrating stablecoin-based services. Stablecoin wallets could potentially be linked to mobile money accounts, allowing users to convert between stablecoins and Kenyan shillings quickly and efficiently.
In January 2026 M-pesa Africa signed a partnership with the Abu Dhabi–based ADI Foundation to introduce stablecoin-powered payments and blockchain infrastructure across its mobile money network in several African markets. The collaboration will deploy the ADI Chain blockchain system to enable faster and cheaper cross-border transactions for individuals and businesses, potentially linking more than 60 million monthly users to digital asset services. The deal marks M-Pesa’s first major move into blockchain and crypto-related payments, coming after years of caution due to regulatory concerns in Kenya. The initiative is expected to support remittances, regional trade, and merchant payments, while operating within new regulatory frameworks such as Kenya’s Virtual Asset Service Providers (VASP) Act, which requires licensing and compliance for stablecoin service providers.
- Corporate Settlement and Treasury Management
Repatriation of Funds: Multinational companies operating in Kenya are increasingly using US dollar-pegged stablecoins as an efficient way to convert local revenues and repatriate funds to their parent companies abroad. In this model, firms collect payments locally in Kenyan shillings (Kshs) often through mobile money or local payment systems, then convert the proceeds into stablecoins such as USDT or USDC via crypto payment infrastructure providers. These digital dollars can then be transferred instantly across borders and converted back into fiat currency in the destination country, significantly reducing the time and cost associated with traditional bank wires and foreign exchange conversions. The internet service provider Starlink, owned by US tycoon Elon Musk, has previously converted payments collected in Kenyan shillings into stablecoins and transferred them to America, where they are exchanged into dollars
Stable Payroll: With the enactment of the Virtual Asset Service Providers (VASP) Act, firms can offer regulated, stablecoin-based payrolls with automatic conversion to local currency for employees. This could specifically work for people with remote jobs or Kenyan companies with foreign employees abroad
- Financial Inclusion
Stablecoins may also support financial inclusion by providing digital financial services to individuals who lack access to traditional banking infrastructure but have access to smartphones and internet connectivity. USD-pegged stablecoins also serve as a practical hedge against inflation and depreciation of the Kenyan shilling (Kshs). Because these digital assets are typically backed 1:1 by the US dollar, their value remains relatively stable compared to local currencies that may experience volatility. As a result, individuals and businesses in Kenya can convert their Kshs holdings into stablecoins to preserve purchasing power, particularly during periods when the shilling weakens against the dollar. This makes stablecoins attractive not only for cross-border transactions and remittances but also as a store of value in dollar terms without requiring access to traditional foreign currency accounts. Additionally, stablecoins can significantly expand financial inclusion by enabling unbanked or underbanked individuals, who may not have access to formal banking services, to participate in the digital economy. With just a smartphone and an internet connection, users can hold digital wallets, receive payments, transact globally, and store value in a dollar-linked asset, thereby accessing financial services that would otherwise be unavailable through conventional banking channels.
Section V. Global Regulatory Landscape
The regulatory landscape for stablecoins has evolved rapidly in recent years as governments and financial authorities respond to the growing adoption of digital assets in global payments and financial markets. As stablecoins increasingly serve as a bridge between traditional finance and the crypto ecosystem, regulators across major jurisdictions have begun introducing dedicated frameworks to address potential risks while supporting innovation. These frameworks typically focus on areas such as consumer protection, reserve transparency, financial stability, and anti-money laundering compliance. The table below highlights key regulatory developments across major markets, illustrating how different regions are approaching the oversight of stablecoins and integrating them into existing financial regulatory structures.
|
Cytonn Report: Global Stablecoin Regulatory Landscape |
|||
|
Country |
Frame work |
Status |
Key Regulator |
|
United States |
Genius Act 2025 |
Signed into law in July 2025 |
OCC, FinCEN, FDIC |
|
European Union |
Markets in Crypto Assets (MiCA) |
Live since June 2024 |
ESMA + National Competent Authorities in each member state |
|
United Kingdom |
The Financial Services and Markets Act 2000 (Cryptoassets) Regulations 2025 |
In development |
FCA, Bank of England |
|
Singapore |
MAS Framework |
Live since August 2023 |
Monetary Authority of Singapore (MAS) |
|
Hong Kong |
Stablecoin Ordinance |
Live since August 2025 |
HKMA |
|
UAE |
Payment Token Regulation |
Live since August 2024 |
CBUAE |
|
Japan |
Payment services Act |
Crypto changes enacted in 2025 |
Financial Services Agency (FSA) |
The global regulatory landscape for stablecoins keeps evolving, showing how major economies are establishing formal frameworks to govern their issuance, use, and oversight.
- In the United States, the Genius Act 2025 has been signed into law, placing stablecoins under clearer federal oversight involving agencies such as the OCC, FinCEN, and FDIC. It stated that stablecoins must be fully backed 1-to-1 by safe assets like U.S. dollars or short-term U.S. Treasury bonds, and the companies issuing them must regularly disclose their reserves and follow strict regulations. The law also requires transparency, consumer protections, and anti-money-laundering compliance, while making it illegal to claim that stablecoins are government-guaranteed, insured, or legal tender. Overall, the act aims to make stablecoins safer and more trustworthy while allowing them to be used as a regulated digital payment system.
- The European Union has already implemented the Markets in Crypto Assets (MiCA) regulation, which has been live since June 2024 and provides a comprehensive framework across all member states with supervision coordinated by ESMA requiring crypto issuers and service providers to obtain authorization, meet capital and consumer-protection standards, publish transparent white papers, and comply with strict rules for stablecoins, reserve backing, and supervision by EU regulators, all aimed at improving market stability, investor protection, and regulatory clarity across the EU crypto market.
- In the United Kingdom, stablecoin regulation is still in development under the proposed Cryptoassets Regulations tied to the Financial Services and Markets Act. This act proposes bringing stablecoins under formal financial regulation by treating certain types, particularly fiat backed “qualifying stablecoins”, as regulated financial instruments. The framework requires firms that issue, manage, or provide custody services for stablecoins to obtain authorization from financial regulators and comply with rules on consumer protection, reserve backing, and operational oversight. It also allows stablecoins to be legally used as a form of payment while ensuring they are backed by assets and supervised similarly to other financial services to maintain financial stability and protect users.
- Meanwhile, several Asian financial hubs have moved ahead with operational frameworks: Singapore’s MAS framework has been active since August 2023, Hong Kong’s Stablecoin Ordinance came into force in August 2025, and the UAE’s payment token regulation has been live since August 2024. Japan has also updated its Payment Services Act, introducing crypto-related regulatory changes in 2025.
Overall, the table illustrates a global shift toward formalizing oversight of stablecoins within existing financial regulatory structures. These regulatory frameworks focus primarily on consumer protection, reserve transparency, anti-money laundering compliance, and financial stability. Going forward, the regulatory trend suggests that stablecoins are increasingly being integrated into the mainstream financial system rather than treated as purely crypto assets. More jurisdictions are likely to adopt frameworks similar to MiCA or payment-focused regulatory models that emphasize consumer protection, reserve backing, transparency, and prudential supervision. As regulatory clarity improves, institutional participation and cross-border stablecoin use in payments, remittances, and financial markets could expand significantly. However, regulatory fragmentation across jurisdictions may still pose challenges for global issuers, making international coordination and standard-setting an important next step in the development of the stablecoin ecosystem.
Section VI. Regulatory Landscape in Kenya
The Central Bank of Kenya has not issued a dedicated press release on stablecoins but has acknowledged their emergence in official publications. In its 2022 Central Bank Digital Currency discussion paper, CBK noted that private digital currencies such as cryptocurrencies and stablecoins are reshaping global payment systems and have prompted central banks to explore Central Bank Digital Currencies (CBDCs). Earlier, CBK had issued a public notice in 2015 cautioning Kenyans against the risks of virtual currencies, noting that they are not legal tender and remain unregulated in the country.
a) Virtual Asset Services Providers Act 2025
The Virtual Asset Service Providers Act, 2025 is Kenya’s first comprehensive legal framework governing digital assets, including cryptocurrencies and stablecoins. The Act was passed by Parliament in October 2025 and subsequently assented to by the President later that month, formally establishing a regulatory structure for the country’s growing digital asset ecosystem. Its introduction reflects Kenya’s shift from a largely cautionary approach to virtual assets toward a more structured regulatory environment aimed at balancing financial innovation with consumer protection and financial stability.
A key feature of the Act is the establishment of a licensing regime for virtual asset service providers (VASPs), which includes entities such as crypto exchanges, custodial wallet providers, token issuers, and digital asset trading platforms. Under the framework, regulatory oversight is shared between the Central Bank of Kenya (CBK) and the Capital Markets Authority (CMA), depending on the nature of the activity. For stablecoins in particular, the Act introduces requirements related to operational transparency, anti-money laundering and counter-terrorism financing compliance, and the safeguarding of customer funds. These provisions aim to ensure that entities dealing with digital assets operate within clear regulatory boundaries.
The legislation also has important implications for the stablecoin market in Kenya, as it lays the groundwork for potential oversight of stablecoin issuance and usage within the financial system. Provisions relating to licensing, disclosure requirements, governance standards, and risk management are expected to apply to firms that issue or facilitate transactions involving stablecoins. By introducing clearer rules around digital asset service providers, the Act could help foster greater confidence among users and institutions while reducing risks associated with fraud, financial crime, and market instability. Over time, the framework may also support the integration of stablecoin-based services into Kenya’s broader digital payments and fintech ecosystem. CBK regulates the creation and management of approved stablecoins. CMA, on the other hand, oversees stablecoin exchanges and provides regulatory oversight of investment advisory services and virtual asset management. However, Kenyan regulators have also acknowledged the importance of financial innovation and the potential benefits of digital financial technologies.
Looking ahead, Kenya’s regulatory approach to stablecoins is likely to evolve gradually as digital asset adoption continues to grow both locally and globally. Policymakers are expected to take a cautious but progressive stance, balancing financial innovation with the need to safeguard financial stability and consumer protection. In the near term, regulators such as the Central Bank of Kenya may focus on strengthening oversight around anti-money laundering compliance, reserve transparency, and the operational standards of stablecoin issuers and service providers. There is also a possibility that stablecoins could eventually be integrated into the broader digital payments ecosystem, particularly given Kenya’s strong mobile money infrastructure. Over the longer term, regulatory clarity may emerge through dedicated digital asset legislation or through amendments to existing financial and payment regulations, helping create a more structured environment for stablecoin use, trading, and innovation within the country’s financial system.
Section VII. Recommendations and Conclusion
For Kenya to fully harness the benefits of stablecoins while safeguarding financial stability, several targeted policy and institutional measures should be considered.
- Establish a Clear Regulatory Framework for Stablecoins
Kenya currently lacks a comprehensive regulatory framework governing stablecoin issuance, custody, and trading. The Central Bank of Kenya should develop a dedicated regulatory framework that defines the legal status of stablecoins and sets operational requirements for issuers and service providers.Such a framework should include requirements on: Reserve asset backing, liquidity management, risk disclosure, and consumer protection measures. Clear regulation would provide legal certainty for investors, fintech firms, and financial institutions seeking to develop stablecoin-based products.
- Introduce Licensing for Stablecoin Service Providers
Kenya could introduce a licensing regime for firms involved in stablecoin-related activities such as issuance, trading platforms, custodial services, and payment processing. The licensing framework could be administered by the Capital Markets Authority and the Central Bank of Kenya through a coordinated regulatory approach. Licensing requirements should include: Minimum capital requirements, operational risk management, cybersecurity standards, compliance reporting obligations. This would help ensure that only credible and well-capitalized institutions operate in the stablecoin ecosystem.
- Promote Integration with Mobile Money Infrastructure, PSPs and Money Market Funds
Kenya’s strong mobile money ecosystem provides a unique opportunity to integrate stablecoins into existing digital payment systems. Partnerships between stablecoin service providers and money platforms such as M-Pesa, PSPs and Money Market Funds could enable users to seamlessly convert stablecoins into Kenyan shillings and vice versa.
Such integration could significantly reduce the cost and processing time of cross-border payments while expanding access to digital financial services.
- Strengthen Anti-Money Laundering and Financial Monitoring Systems
Stablecoins can facilitate fast cross-border transfers, which may create risks related to money laundering and illicit financial flows. To mitigate these risks, regulators should ensure that stablecoin service providers comply with the Anti-Money Laundering and Counter-Terrorism Financing regulations administered by the Financial Reporting Centre. Requirements should include: Know-Your-Customer (KYC) verification, transaction monitoring systems, blockchain analytics integration. These measures would help maintain the integrity of Kenya’s financial system.
- Promote Public Awareness and Financial Literacy
Given the technical complexity of digital assets, public education will be essential for responsible adoption. Government agencies, financial institutions, and fintech firms should collaborate to raise awareness about the benefits and risks associated with stablecoins. Educational initiatives could focus on: Safe digital asset usage, fraud prevention, digital wallet security and responsible investment practices. Improving financial literacy would help consumers make informed decisions when engaging with stablecoin-based services.
- Promote innovation around stable coins to ensure Kenya remains a leader in digital payments in Africa.
Kenya can strengthen its leadership in digital payments by actively promoting innovation around stablecoins through a multi-pronged approach. The government and regulators can create a supportive framework that encourages fintech startups and established financial institutions to experiment with new stablecoin-based payment solutions, while ensuring robust consumer protection and anti-money laundering safeguards. Initiatives such as innovation sandboxes, grants for blockchain and fintech research, and partnerships with global stablecoin players can accelerate adoption. Additionally, integrating stablecoins into existing mobile money platforms, like M-Pesa, and cross-border payment systems can enhance transaction efficiency, reduce costs, and provide financial access to the unbanked, positioning Kenya as a hub for digital payment innovation across Africa
Stablecoins represent an important innovation in the global financial system. By combining price stability with blockchain technology, they provide new opportunities for payments, cross-border transfers, and digital financial services. For Kenya, stablecoins could complement the country’s well-established digital payments ecosystem. The recent ADI Foundation–M-Pesa Africa partnership combined with the enactment of Kenya’s Virtual Asset Service Providers Act, 2025, positions the country’s stablecoin market at a transformative juncture. The partnership integrates blockchain-based settlement infrastructure into M-Pesa’s vast mobile money ecosystem, enabling efficient cross-border payments and expanding financial inclusion, while the VASP Act of 2025 provides a clear regulatory framework that ensures consumer protection, anti-money laundering compliance, and licensing oversight. Together, these developments signal a shift from unregulated experimentation toward a formalized, risk-aware stablecoin environment, creating opportunities for institutional adoption, innovation in payment systems, and Kenya’s potential emergence as a regional hub for digital asset-driven transactions.
Disclaimer: The views expressed in this publication are those of the writers where particulars are not warranted. This publication, which follows Section 2 of the Capital Markets Authority Act Cap 485A, is meant for general information only and is not a warranty, representation, advice or solicitation of any nature. Readers are advised in all circumstances to seek the advice of a registered investment advisor

- Talk to us
- Kenya
- P.O Box 20695 - 00200, Nairobi, Kenya
- Cell +254709101200
- Tel +254709101200
- WhatsApp +254741676635
- United States
- +254709101200
- DOWNLOAD OUR APP
-


- Kenya
- 8th Floor, Pinetree Plaza, Kaburu Drive, Ngong Road, Nairobi, Kenya
- USA
- Suite 1150, 1775 Eye Street NW, USA, Washington DC 20006, USA
- Investments
- High Yield
- Private Equity
- Real Estate
- Real Estate
- RiverRun Estates
- Cytonn Towers
- The Ridge
- Taraji Heights
- The Alma