The Kenyan National Social Security Fund (NSSF), & Cytonn Weekly #38/2024
By Research Team, Sep 22, 2024
Executive Summary
Fixed Income
During the week, T-bills were oversubscribed, with the overall oversubscription rate coming in at 126.4%, a reversal from the undersubscription rate of 89.1% recorded the previous week. Investors’ preference for the shorter 91-day paper persisted, with the paper receiving bids worth Kshs 11.4 bn against the offered Kshs 4.0 bn, translating to an oversubscription rate of 283.9%, albeit lower than the oversubscription rate of 354.7% recorded the previous week. The subscription rates for the 182-day and 364-day papers increased significantly to 84.1% and 105.8% respectively from the 32.7% and 39.2% respectively recorded the previous week. The government accepted a total of Kshs 25.6 bn worth of bids out of Kshs 30.3 bn bids received, translating to an acceptance rate of 84.3%. The yields on the government papers were on a downward trajectory, with the yields on the 364-day, 182-day, and 91-day papers decreasing by 0.4 bps, 0.9 bps, and 0.4 bps to remain relatively unchanged from the 16.8%, 16.6% and 15.8% respectively recorded the previous week;
During the week, the Central Bank of Kenya released the auction results for the re-opened bonds, FXD1/2024/010 with a tenor to maturity of 9.5 years, and a fixed coupon rate of 16.0% and FXD1/2016/020 with a tenor to maturity of 11.9 years, and a fixed coupon rate of 14.0%. The bonds were undersubscribed with the overall subscription rate coming in at 75.5%, receiving bids worth Kshs 22.6 bn against the offered Kshs 30.0 bn. The government accepted bids worth Kshs 19.3 bn, translating to an acceptance rate of 85.1%. The weighted average yield of accepted bids for the FXD1/2024/010 and the FXD1/2016/020 came in at 16.9% and 17.3% respectively, which were slightly above our expectation of within a bidding range of 16.3% - 16.7% for the FXD1/2024/010 and 16.6% - 17.2% for the FXD1/2016/020. Notably, the FXD1/2024/010 registered a yield increase of 0.3% points from the 16.6% registered in July when it was last re-opened. With the Inflation rate at 4.4% as of August 2024, the real return of the FXD1/2024/010 and the FXD11/2016/020 is 12.5% and 12.9% respectively;
During the week, the National Treasury gazetted the revenue and net expenditures for the second month of FY’2024/2025, ending 30th August 2024, highlighting that the total revenue collected as at the end of August 2024 amounted to Kshs 331.6 bn, equivalent to 12.6% of the revised estimates of Kshs 2,631.4 bn for FY’2024/2025 and is 75.6% of the prorated estimates of Kshs 438.6 bn;
Also, during the week, the US Federal Reserve announced their decision to cut its benchmark interest rate by 50 bps, to a range of 4.75%-5.00% from a range of 5.25%-5.50%. The decision came after the Federal Open Market Committee (FOMC) voted eleven to one to lower the federal funds rates after holding it for more than a year at its highest level in two decades. Notably, it was the Fed’s first rate cut in more than four years;
Equities
During the week, the equities market was on an upward trajectory, with NSE 20 gaining the most by 4.5% while NSE 25, NSE 10, and NASI gained by 0.4% 0.3% and 0.1% respectively, taking the YTD performance to gains of 21.5%, 20.1%, 18.7%, and 15.7% for NSE 10, NSE 25, NSE 20, and NASI respectively. The equities market performance was driven by gains recorded by large-cap stocks such as KCB, DTBK, and NCBA of 4.5%, 2.4%, and 1.9% respectively. The performance was, however, weighed down by losses recorded by large-cap stocks such as SCBK, Stanbic, and Equity of 3.4%, 3.3%, and 2.8% respectively;
Real Estate
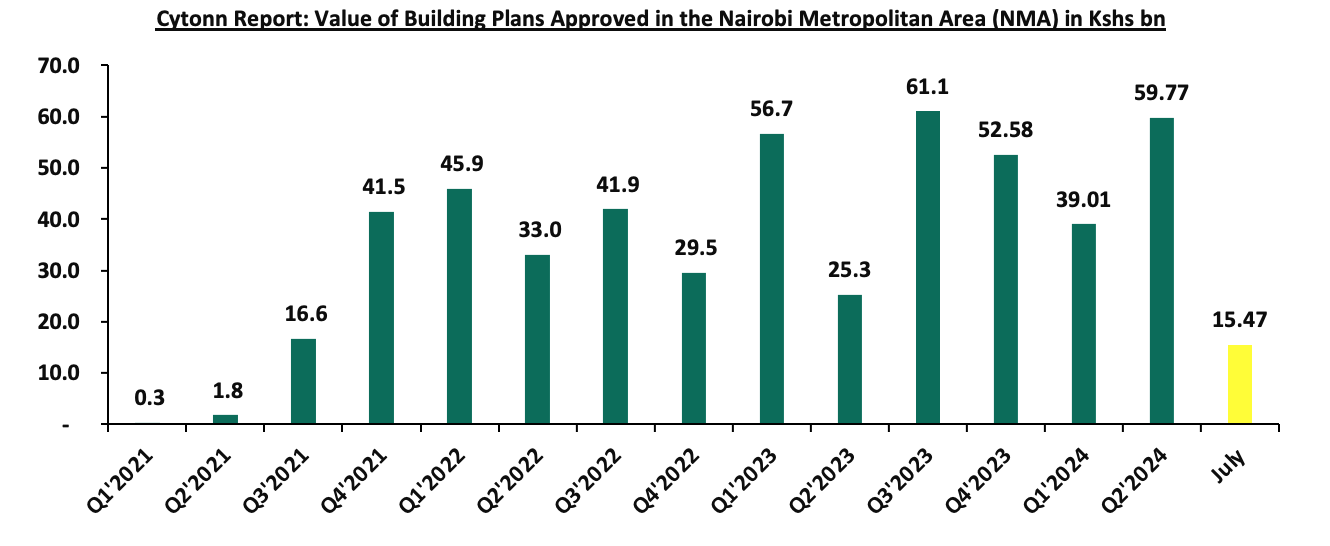
During the week, the Kenya National Bureau of Statistics (KNBS) released the Leading Economic Indicators (LEI) July 2024 Report, which highlighted the performance of major economic indicators. The total value of building plans approved in the Nairobi Metropolitan Area (NMA) decreased on a y/y basis by 38.4% to Kshs 15.5 bn in July 2024, from Kshs 23.2 bn recorded in July 2023;
During the week, Local Authorities Pension Trust (LAPTrust) announced plans to redevelop its seven-acre estate in Changamwe, Mombasa County, at an estimated cost of Kshs 3.5 bn. The company aims to demolish 25 apartment blocks that host a total of 264 one-bedroom units in a bid to construct 5 apartments blocks with a total of 714 units consisting of one, two and three-bedroom typologies.
In the retail sector, French retailer Carrefour Supermarket opened its latest store in Ruiru, Kiambu county marking its 24th outlet in the country. The retail store is situated at the newly developed Nord Mall, Ruiru town, Kiambu. The company aims to continue offering a wide selection of household products to the residents around Ruiru town with items ranging from appliances, furniture, stationary, and groceries among many other items;
Additionally, Acorn Project Two LLP, a special purpose vehicle of Acorn Holdings, announced an early redemption of Kshs 2.6 bn in outstanding notes maturing on 8th November 2024 under the Kshs 5.7 bn medium-term note (MTN) Programme, effective 4th October 2024;
On the Unquoted Securities Platform, Acorn D-REIT and I-REIT traded at Kshs 25.4 and Kshs 22.2 per unit, respectively, as per the last updated data on 13th September 2024. The performance represented a 27.0% and 11.0% gain for the D-REIT and I-REIT, respectively, from the Kshs 20.0 inception price Additionally, ILAM Fahari I-REIT traded at Kshs 11.0 per share as of 13th September, 2024, representing a 45.0% loss from the Kshs 20.0 inception price;
Focus of the Week
National Social Security schemes are created by governments to form the first pillar of social security. In Africa, Kenya was the second country after Ghana to form a national security scheme, The National Social Security Fund (NSSF), done in 1965 through an Act of Parliament (Cap 258). In recent years, discussions around the growth and reform of the NSSF have gained momentum, with key considerations on how to increase coverage, especially for the informal sector, and improve service delivery. The fund has also faced a number of challenges in recent years, with concerns about mismanagement, corruption, and inefficiencies often overshadowing the fund’s broader mission and leading to a decline in public confidence. Most recently, the fund was in the news for yet to be quantified losses associated with questionable bond trading. As such, this week we turn our focus to the Kenyan National Social Security Fund to shed light on its state and what needs to be done to achieve a win-win situation;
Investment Updates:
- Weekly Rates:
- Cytonn Money Market Fund closed the week at a yield of 18.18% p.a To invest, dial *809# or download the Cytonn App from Google Playstore here or from the Appstore here;
- We continue to offer Wealth Management Training every Wednesday, from 9:00 am to 11:00 am. The training aims to grow financial literacy among the general public. To register for any of our Wealth Management Trainings, click here;
- If interested in our Private Wealth Management Training for your employees or investment group, please get in touch with us through wmt@cytonn.com;
- Cytonn Insurance Agency acts as an intermediary for those looking to secure their assets and loved ones’ future through insurance namely; Motor, Medical, Life, Property, WIBA, Credit and Fire and Burglary insurance covers. For assistance, get in touch with us through insuranceagency@cytonn.com;
- Cytonn Asset Managers Limited (CAML) continues to offer pension products to meet the needs of both individual clients who want to save for their retirement during their working years and Institutional clients that want to contribute on behalf of their employees to help them build their retirement pot. To more about our pension schemes, kindly get in touch with us through pensions@cytonn.com;
Hospitality Updates:
- We currently have promotions for Staycations. Visit cysuites.com/offers for details or email us at sales@cysuites.com;
Money Markets, T-Bills Primary Auction:
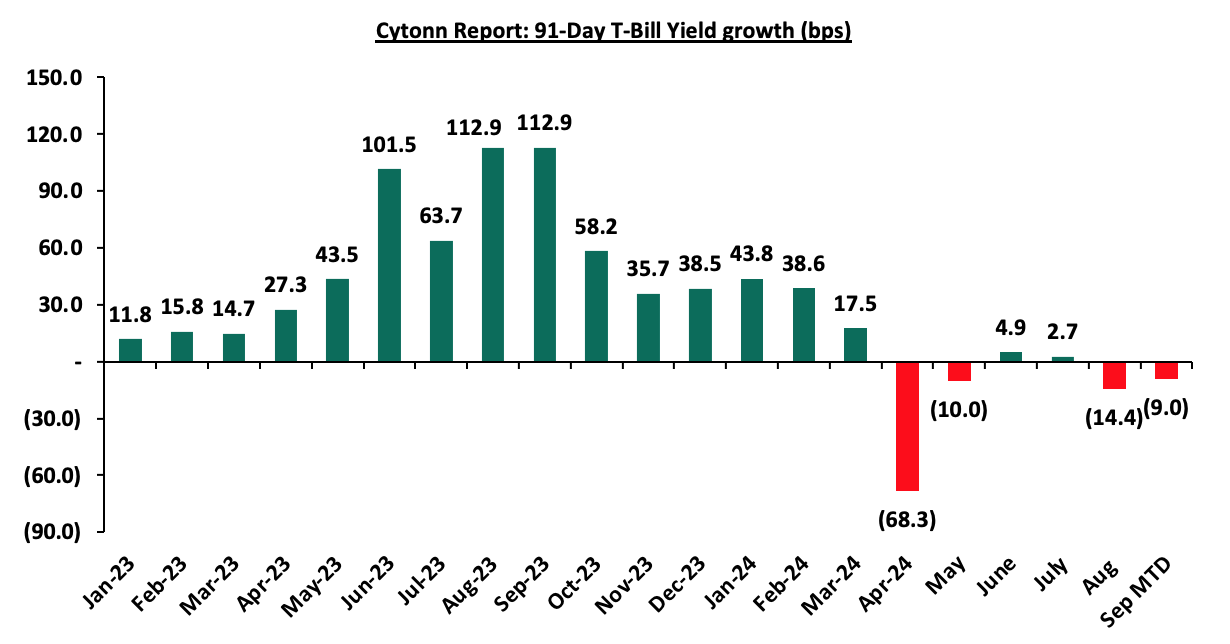
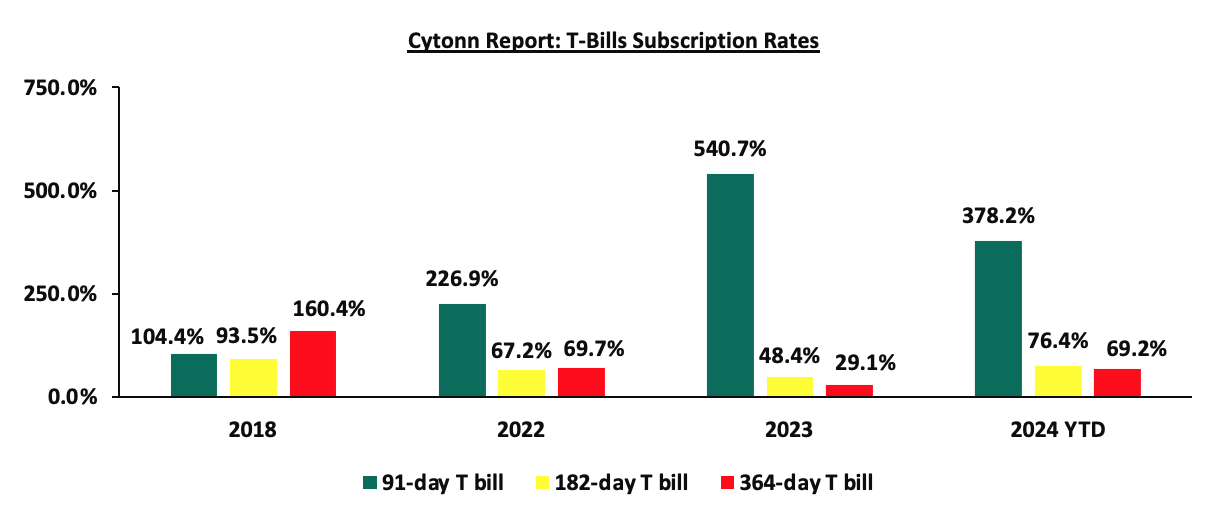
During the week, T-bills were oversubscribed, with the overall oversubscription rate coming in at 126.4%, a reversal from the undersubscription rate of 89.1% recorded the previous week. Investors’ preference for the shorter 91-day paper persisted, with the paper receiving bids worth Kshs 11.4 bn against the offered Kshs 4.0 bn, translating to an oversubscription rate of 283.9%, albeit lower than the oversubscription rate of 354.7% recorded the previous week. The subscription rates for the 182-day and 364-day papers increased significantly to 84.1% and 105.8% respectively from the 32.7% and 39.2% respectively recorded the previous week. The government accepted a total of Kshs 25.6 bn worth of bids out of Kshs 30.3 bn bids received, translating to an acceptance rate of 84.3%. The yields on the government papers were on a downward trajectory, with the yields on the 364-day, 182-day, and 91-day papers decreasing by 0.4 bps, 0.9 bps, and 0.4 bps to remain relatively unchanged from the 16.8%, 16.6% and 15.8% respectively recorded the previous week. The chart below shows the yield growth rate for the 91-day paper over the period:
The chart below compares the overall average T-bill subscription rates obtained in 2018, 2022, 2023, and 2024 Year-to-date (YTD):
During the week, the Central Bank of Kenya released the auction results for the re-opened bonds, FXD1/2024/010 with a tenor to maturity of 9.5 years, and a fixed coupon rate of 16.0% and FXD1/2016/020 with a tenor to maturity of 11.9 years, and a fixed coupon rate of 14.0%. The bonds were undersubscribed with the overall subscription rate coming in at 75.5%, receiving bids worth Kshs 22.6 bn against the offered Kshs 30.0 bn. The government accepted bids worth Kshs 19.3 bn, translating to an acceptance rate of 85.1%. The weighted average yield of accepted bids for the FXD1/2024/010 and the FXD1/2016/020 came in at 16.9% and 17.3% respectively, which were slightly above our expectation of within a bidding range of 16.3% - 16.7% for the FXD1/2024/010 and 16.6% - 17.2% for the FXD1/2016/020. Notably, the FXD1/2024/010 registered a yield increase of 0.3% points from the 16.6% registered in July 2024 when it was last re-opened. With the Inflation rate at 4.4% as of August 2024, the real return of the FXD1/2024/010 and the FXD11/2016/020 is 12.5% and 12.9% respectively.
Money Market Performance:
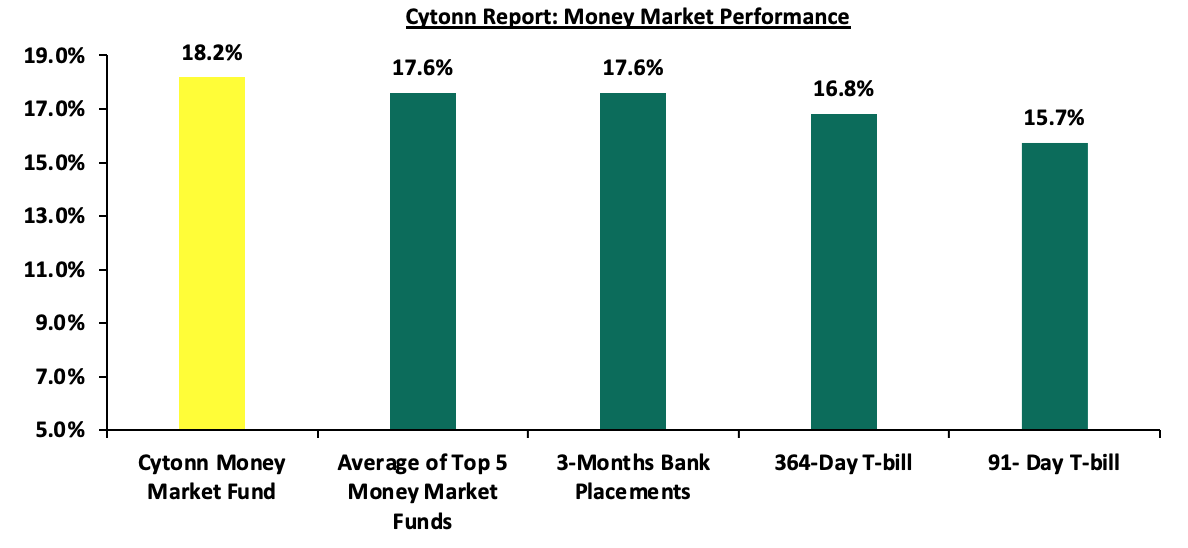
In the money markets, 3-month bank placements ended the week at 17.6% (based on what we have been offered by various banks), and the yields on the government papers were on a downward trajectory, with the yields on the 364-day and 91-day papers decreasing by 0.4 bps each to remain relatively unchanged from the 16.8% and 15.8% recorded the previous week. The yields on the Cytonn Money Market Fund decreased marginally by 2.0 bps to close the week at 18.2% relatively unchanged from the previous week, while the average yields on the Top 5 Money Market Funds decreased by 14.0 bps to 17.6% from the 17.7% recorded the previous week.
The table below shows the Money Market Fund Yields for Kenyan Fund Managers as published on 20th September 2024:
|
Cytonn Report: Money Market Fund Yield for Fund Managers as published on 20th September 2024 |
||
|
Rank |
Fund Manager |
Effective Annual Rate |
|
1 |
Cytonn Money Market Fund (Dial *809# or download the Cytonn App) |
18.2% |
|
2 |
Lofty-Corban Money Market Fund |
18.1% |
|
3 |
Etica Money Market Fund |
17.5% |
|
4 |
Arvocap Money Market Fund |
17.2% |
|
5 |
Kuza Money Market fund |
17.0% |
|
6 |
GenAfrica Money Market Fund |
16.5% |
|
7 |
Absa Shilling Money Market Fund |
16.0% |
|
8 |
Jubilee Money Market Fund |
16.0% |
|
9 |
Nabo Africa Money Market Fund |
16.0% |
|
10 |
Enwealth Money Market Fund |
16.0% |
|
11 |
Madison Money Market Fund |
15.8% |
|
12 |
Co-op Money Market Fund |
15.3% |
|
13 |
KCB Money Market Fund |
15.3% |
|
14 |
Mali Money Market Fund |
15.2% |
|
15 |
Genghis Money Market Fund |
15.2% |
|
16 |
Apollo Money Market Fund |
15.1% |
|
17 |
Sanlam Money Market Fund |
15.1% |
|
18 |
Orient Kasha Money Market Fund |
15.0% |
|
19 |
Mayfair Money Market Fund |
15.0% |
|
20 |
AA Kenya Shillings Fund |
14.9% |
|
21 |
Stanbic Money Market Fund |
14.7% |
|
22 |
Dry Associates Money Market Fund |
14.0% |
|
23 |
Old Mutual Money Market Fund |
14.1% |
|
24 |
ICEA Lion Money Market Fund |
13.9% |
|
25 |
CIC Money Market Fund |
13.7% |
|
26 |
British-American Money Market Fund |
13.2% |
|
27 |
Equity Money Market Fund |
12.7% |
Source: Business Daily
Liquidity:
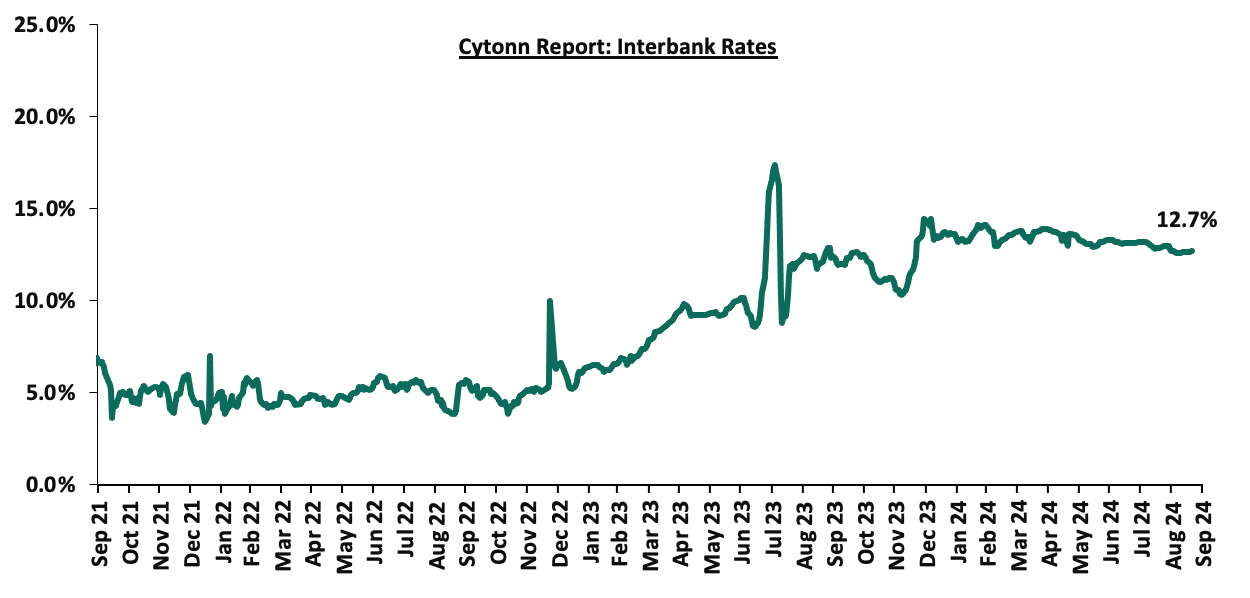
During the week, liquidity in the money markets tightened, with the average interbank rate increasing marginally by 5.2 bps, to 12.7% from the 12.6% recorded the previous week, partly attributable to tax remittances that offset government payments. The average interbank volumes traded decreased by 29.3% to Kshs 24.8 bn from Kshs 35.1 bn recorded the previous week. The chart below shows the interbank rates in the market over the years:
Kenya Eurobonds:
During the week, the yields on Eurobonds were on a downward trajectory, with the yields on the 7-year Eurobond issued in 2019 decreasing the most by 1.4% points to 9.1% from 10.5% recorded the previous week. The table below shows the summary of the performance of the Kenyan Eurobonds as of 19th September 2024;
|
Cytonn Report: Kenya Eurobonds Performance |
||||||
|
|
2018 |
2019 |
2021 |
2024 |
||
|
Tenor |
10-year issue |
30-year issue |
7-year issue |
12-year issue |
13-year issue |
7-year issue |
|
Amount Issued (USD) |
1.0 bn |
1.0 bn |
0.9 bn |
1.2 bn |
1.0 bn |
1.5 bn |
|
Years to Maturity |
3.4 |
23.5 |
2.7 |
7.7 |
9.8 |
6.4 |
|
Yields at Issue |
7.3% |
8.3% |
7.0% |
7.9% |
6.2% |
10.4% |
|
01-Jan-24 |
9.8% |
10.2% |
10.1% |
9.9% |
9.5% |
|
|
02-Sep-24 |
10.2% |
10.7% |
9.9% |
10.4% |
10.3% |
10.5% |
|
12-Sep-24 |
10.8% |
10.9% |
10.5% |
10.8% |
10.6% |
10.5% |
|
13-Sep-24 |
10.6% |
10.8% |
10.2% |
10.5% |
10.5% |
10.1% |
|
16-Sep-24 |
10.5% |
10.6% |
9.7% |
10.3% |
10.2% |
9.8% |
|
17-Sep-24 |
10.5% |
10.5% |
9.3% |
10.1% |
10.0% |
9.4% |
|
18-Sep-24 |
10.2% |
10.5% |
9.4% |
10.2% |
10.0% |
9.5% |
|
19-Sep-24 |
10.1% |
10.4% |
9.1% |
10.0% |
9.9% |
9.3% |
|
Weekly Change |
(0.8%) |
(0.5%) |
(1.4%) |
(0.8%) |
(0.8%) |
(1.2%) |
|
MTD Change |
(0.2%) |
(0.4%) |
(0.8%) |
(0.4%) |
(0.4%) |
(1.2%) |
|
YTD Change |
0.2% |
0.2% |
(1.0%) |
0.1% |
0.4% |
- |
Source: Central Bank of Kenya (CBK) and National Treasury
Kenya Shilling:
During the week, the Kenya Shilling appreciated marginally against the US Dollar by 1.4 bps, to remain relatively unchanged at the Kshs 129.2 recorded the previous week. On a year-to-date basis, the shilling has appreciated by 17.7% against the dollar, a contrast to the 26.8% depreciation recorded in 2023.
We expect the shilling to be supported by:
- Diaspora remittances standing at a cumulative USD 4,645.0 mn in the 12 months to August 2024, 12.7% higher than the USD 4,120.0 mn recorded over the same period in 2023, which has continued to cushion the shilling against further depreciation. In the August 2024 diaspora remittances figures, North America remained the largest source of remittances to Kenya accounting for 56.0% in the period, and,
- The tourism inflow receipts which came in at USD 352.5 bn in 2023, a 31.5% increase from USD 268.1 bn inflow receipts recorded in 2022, and owing to tourist arrivals that improved by 27.2% in the 12 months to June 2024, from the arrivals recorded during a similar period in 2023.
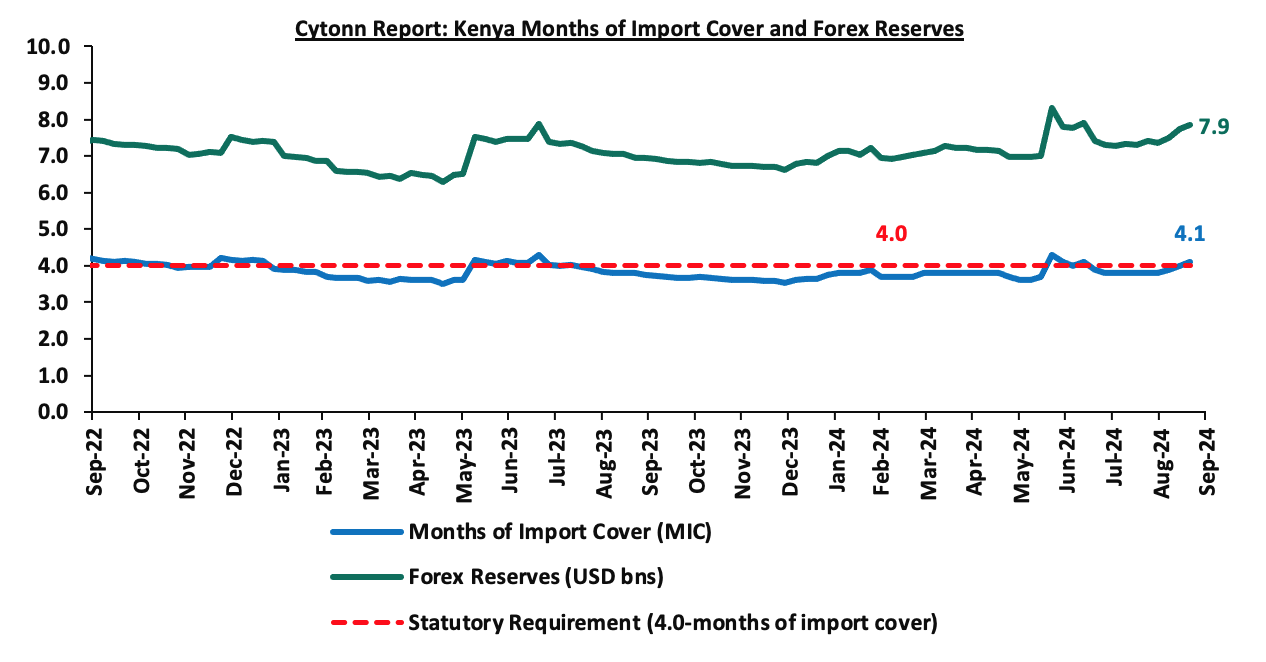
- Improved forex reserves currently at USD 7.9 bn (equivalent to 4.1-months of import cover), which is above the statutory requirement of maintaining at least 4.0-months of import cover, but lower than the EAC region’s convergence criteria of 4.5-months of import cover.
The shilling is however expected to remain under pressure in 2024 as a result of:
- An ever-present current account deficit which came at 3.2% of GDP in Q1’2024 from 3.0% recorded in Q1’2023, and,
- The need for government debt servicing, continues to put pressure on forex reserves given that 67.9% of Kenya’s external debt is US Dollar-denominated as of March 2024.
Key to note, Kenya’s forex reserves increased by 1.5% during the week to close the week at USD 7.9 bn from the USD 7.7 bn recorded the previous week, equivalent to 4.1 months of import cover, up from the 4.0 months recorded last week, and above to the statutory requirement of maintaining at least 4.0-months of import cover. The chart below summarizes the evolution of Kenya's months of import cover over the years:
Weekly Highlights:
- August 2024 Exchequer Release
The National Treasury gazetted the revenue and net expenditures for the second month of FY’2024/2025, ending 30th August 2024. Below is a summary of the performance:
|
Cytonn Report: FY'2024/2025 Budget Outturn - As at 30th August 2024 |
||||||
|
Amounts in Kshs billions unless stated otherwise |
||||||
|
Item |
12-months Original Estimates |
Revised Estimates |
Actual Receipts/Release |
Percentage Achieved of the Revised Estimates |
Prorated |
% achieved of the Prorated |
|
Opening Balance |
1.2 |
|||||
|
Tax Revenue |
2,745.2 |
2,475.06 |
312.8 |
12.6% |
412.5 |
75.8% |
|
Non-Tax Revenue |
172.0 |
156.4 |
17.6 |
11.3% |
26.1 |
67.6% |
|
Total Revenue |
2,917.2 |
2,631.4 |
331.6 |
12.6% |
438.6 |
75.6% |
|
External Loans & Grants |
571.2 |
593.5 |
3.1 |
0.5% |
98.9 |
3.1% |
|
Domestic Borrowings |
828.4 |
978.3 |
102.2 |
10.4% |
163.0 |
62.7% |
|
Other Domestic Financing |
4.7 |
4.7 |
4.3 |
91.3% |
0.8 |
548.0% |
|
Total Financing |
1,404.3 |
1,576.5 |
109.5 |
6.9% |
262.7 |
41.7% |
|
Recurrent Exchequer issues |
1,348.4 |
1,307.9 |
162.4 |
12.4% |
218.0 |
74.5% |
|
CFS Exchequer Issues |
2,114.1 |
2,137.8 |
228.5 |
10.7% |
356.3 |
64.1% |
|
Development Expenditure & Net Lending |
458.9 |
351.3 |
18.3 |
5.2% |
58.5 |
31.2% |
|
County Governments + Contingencies |
400.1 |
410.8 |
30.8 |
7.5% |
68.5 |
45.0% |
|
Total Expenditure |
4,321.5 |
4,207.9 |
439.9 |
10.5% |
701.3 |
62.7% |
|
Fiscal Deficit excluding Grants |
1,404.3 |
1,576.5 |
108.3 |
6.9% |
262.7 |
41.2% |
|
Total Borrowing |
1,399.6 |
1,571.8 |
105.3 |
6.7% |
262.0 |
40.2% |
Amounts in Kshs bns unless stated otherwise
The Key take-outs from the release include;
- Total revenue collected as at the end of August 2024 amounted to Kshs 331.6 bn, equivalent to 12.6% of the revised estimates of Kshs 2,631.4 bn for FY’2024/2025, and is 75.6% of the prorated estimates of Kshs 438.6 bn. Cumulatively, tax revenues amounted to Kshs 312.8 bn, equivalent to 12.6% of the revised estimates of Kshs 2,475.1 bn and 75.8% of the prorated estimates of Kshs 412.5 bn,
- Total financing amounted to Kshs 109.5 bn, equivalent to 6.9% of the revised estimates of Kshs 1,576.5 bn and is equivalent to 41.7% of the prorated estimates of Kshs 262.7 bn. Additionally, domestic borrowing amounted to Kshs 102.2 bn, equivalent to 10.4% of the revised estimates of Kshs 978.3 bn and is 62.7% of the prorated estimates of Kshs 163.0 bn,
- The total expenditure amounted to Kshs 439.9 bn, equivalent to 10.5% of the revised estimates of Kshs 4,207.9 bn, and is 62.7% of the prorated target expenditure estimates of Kshs 701.3 bn. Additionally, the net disbursements to recurrent expenditures came in at Kshs 162.4 bn, equivalent to 12.4% of the revised estimates of Kshs 1,307.9 and 74.5% of the prorated estimates of Kshs 218.0 bn,
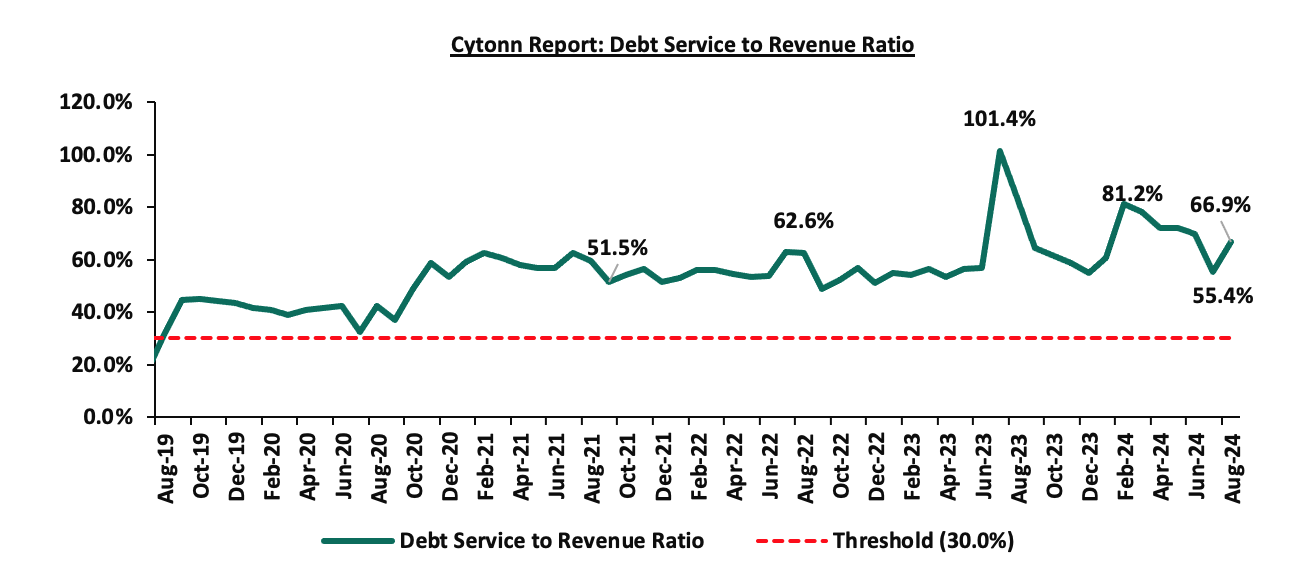
- Consolidated Fund Services (CFS) Exchequer issues came in at Kshs 228.5 bn, equivalent to 10.7% of the revised estimates of Kshs 2,137.8 bn, and are 64.1% of the prorated amount of Kshs 356.3 bn. The cumulative public debt servicing cost amounted to Kshs 221.8 bn which is 11.6% of the revised estimates of Kshs 1,910.5 bn, and is 69.7% of the prorated estimates of Kshs 318.4 bn. Additionally, the Kshs 221.8bn debt servicing cost is equivalent to 66.9% of the actual cumulative revenues collected as at the end of August 2024. The chart below shows the debt serving to revenue ratio;
- Total Borrowings as at the end of August 2024 amounted to Kshs 105.3 bn, equivalent to 6.9% of the revised estimates of Kshs 1,571.8 bn for FY’2024/2025 and are 40.2% of the prorated estimates of Kshs 262.0 bn. The cumulative domestic borrowing of Kshs 978.3 bn comprises of Net Domestic Borrowing Kshs 408.4 bn and Internal Debt Redemptions (Rollovers) Kshs 569.9 bn.
The government was unable to meet its prorated revenue targets for the second consecutive month of the FY’2024/2025, attaining 75.6% of the revenue targets in August 2024, mainly on the back of the tough economic situation exacerbated by the elevated high credit cost in the country that, with the commercial banks weighted average lending rates for the month of July 2024 coming in at 16.8% remaining relatively unchanged from the figure recorded in June. The cost of living remains elevated in the country, which continues to impede revenue collection despite an improvement in business environment with the PMI coming in at 50.6 in August 2024 from the 43.1 recorded in July 2024. In light of this, the government is yet to fully benefit from the strategies put in place to improve revenue collection such as expanding the revenue base and sealing tax leakages, and suspension of tax relief payments. The coming months’ revenue collection performance will largely depend on how quickly the country’s business climate stabilizes. This stabilization is expected to be aided by the ongoing appreciation of the Shilling, which gained by 0.6% against the dollar in the month of August, easing inflationary pressures, and, an ease in the monetary policy in the country, with the Monetary Policy Committee (MPC) announcing a downward revision of the Central Bank Rate (CBR) by 25 bps to 12.75% from 13.00% following their last meeting on 6th August 2024.
- US Federal Reserve Cuts Federal Funds Rates by 50 bps to a Range of 4.75%-5.00%
On September 18th 2024, the US Federal Reserve announced their decision to cut its benchmark interest rate by 50 bps, to a range of 4.75%-5.00% from a range of 5.25%-5.50%. The decision came after the Federal Open Market Committee (FOMC) voted 11 to 1 to lower the federal funds rates after holding it for more than a year at its highest level in two decades. Notably, it was the Fed’s first rate cut in more than four years.
The Fed’s decision to lower rates was driven by the need to support a soft landing for the economy, as inflation showed signs of easing but remained above the 2.0% target. As of August 2024, the y/y inflation rate stood at 2.5%, down from 2.9% in July 2024. The FOMC noted that while inflation has made progress toward its objective, it remains somewhat elevated, and economic growth continues at a solid pace. Despite a slowdown in job gains and a slight rise in the unemployment rate, labor market conditions are still considered strong. The rate cut is seen as a proactive measure to ensure that the economy remains on a stable path toward achieving the dual mandate of maximum employment and stable prices.
In addition to the rate cut, the Fed reaffirmed its commitment to reducing its balance sheet through the continued drawdown of its Treasury securities, agency debt, and mortgage-backed securities holdings. The Committee also indicated that future rate adjustments will depend on the assessment of incoming economic data, reflecting a data-dependent approach to policy decisions.
This move comes after peer central banks in developed economies including the Eurozone cut their rates. Notably, on 12th September 2024, the European Central Bank (ECB) lowered their base rates by 25 bps to 3.5% to ease monetary policy restrictions, reflecting an updated inflation outlook and better transmission of policy. Similarly, in August 2024, the Bank of England announced its decision to cut their base rates by 25 bps to 5.0% from 5.25%, citing persistent inflationary pressures, with the y/y inflation remaining steady at 2.2%, the same as in July 2024 and the need to ensure that inflation expectations remain well anchored.
The Fed’s decision will have a notable impact on the Kenyan economy. One of the most immediate effects could be on the exchange rate between the Kenyan Shilling and the U.S. Dollar. Typically, a Fed rate cut weakens the dollar, which could result in a stronger Shilling, having already appreciated by 17.7% on a YTD basis. Additionally, the lower U.S. rates might reduce the cost of servicing Kenya’s external debt, much of which is denominated in dollars. Moreover, the rate cut could improve Kenya’s external borrowing conditions, especially in terms of its Eurobonds. A lower U.S. rate environment may reduce yield spreads on emerging market debt, making Kenyan Eurobonds more attractive to investors. This increased demand could result in lower borrowing costs for Kenya on future issuances, which may encourage additional external borrowing to finance key development projects. For investors, lower U.S. rates may drive capital out of dollar-denominated assets, increasing the attractiveness of investments in Kenyan markets like the Nairobi Securities Exchange (NSE), which could provide a boost to local businesses.
Going forward, the Federal Reserve indicates the prospects of further cuts in the coming reviews. This could also be pointing towards further cuts in the base lending rate by the Monetary Policy Committee (MPC) in their next meeting on 8th October 2024. Notably, the MPC met in August and lowered the benchmark Central Bank Rate (CBR) to 12.75% from the decade-high of 13.0%. The cut was a 25-basis points slash, and the first one in four years, as the previous slash was last witnessed in March 2020, similar to the trend with the Fed Rate.
Rates in the Fixed Income market have been on an upward trend given the continued high demand for cash by the government and the occasional liquidity tightness in the money market. The government is 131.8% ahead of its prorated net domestic borrowing target of Kshs 94.2 bn, having a net borrowing position of Kshs 218.5 bn. However, we expect a downward readjustment of the yield curve in the short and medium term, with the government looking to increase its external borrowing to maintain the fiscal surplus, hence alleviating pressure in the domestic market. As such, we expect the yield curve to normalize in the medium to long-term and hence investors are expected to shift towards the long-term papers to lock in the high returns.
Market Performance:
During the week, the equities market was on an upward trajectory, with NSE 20 gaining the most by 4.5% while NSE 25, NSE 10, and NASI gained by 0.4% 0.3%, and 0.1% respectively, taking the YTD performance to gains of 21.5%, 20.1%, 18.7%, and 15.7% for NSE 10, NSE 25, NSE 20, and NASI respectively. The equities market performance was driven by gains recorded by large-cap stocks such as KCB, DTBK, and NCBA of 4.5%, 2.4%, and 1.9% respectively. The performance was, however, weighed down by losses recorded by large-cap stocks such as SCBK, Stanbic, and Equity of 3.4%, 3.3%, and 2.8% respectively.
During the week, equities turnover increased by 18.0% to USD 10.9 mn from USD 9.2 mn recorded the previous week, taking the YTD total turnover to USD 474.3 mn. Foreign investors remained net buyers with a net buying position of USD 0.1 mn, from a net buying position of USD 1.2 mn recorded the previous week, taking the YTD foreign net buying to USD 0.9 mn.
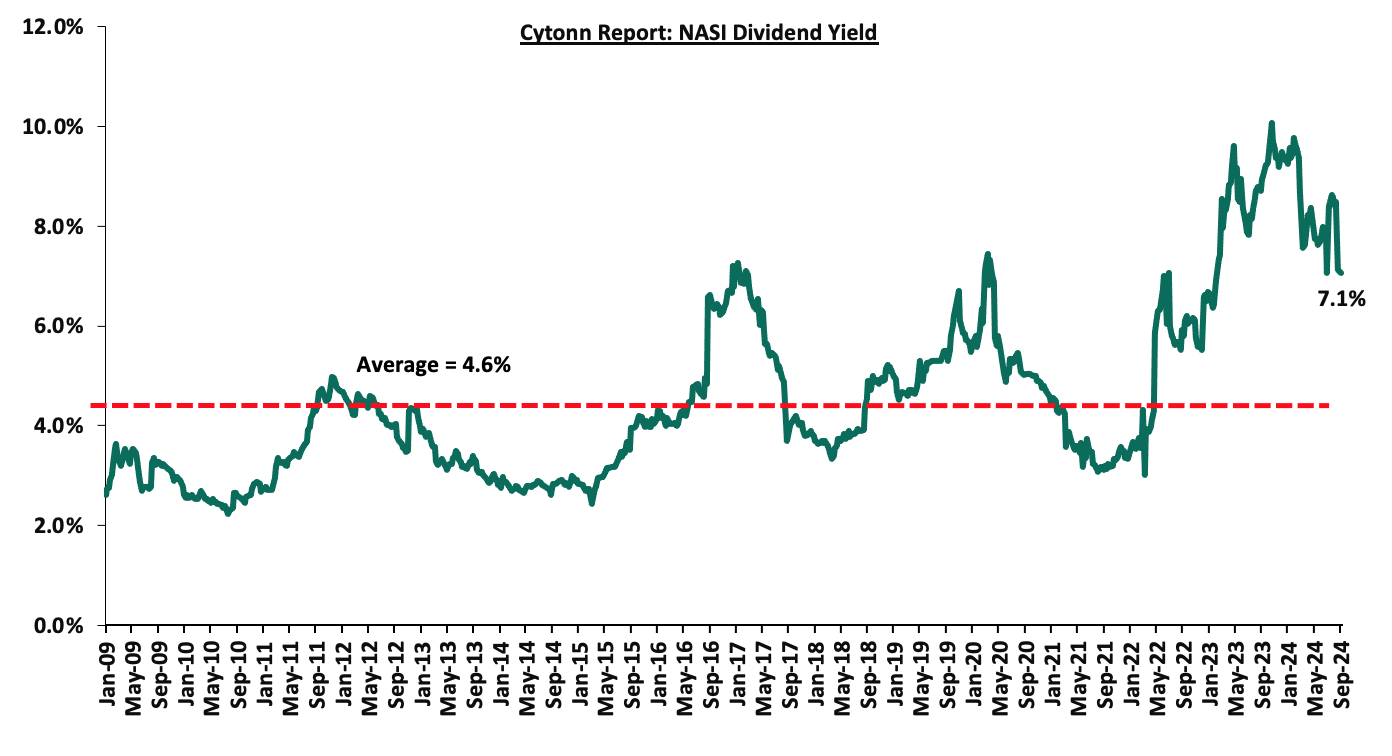
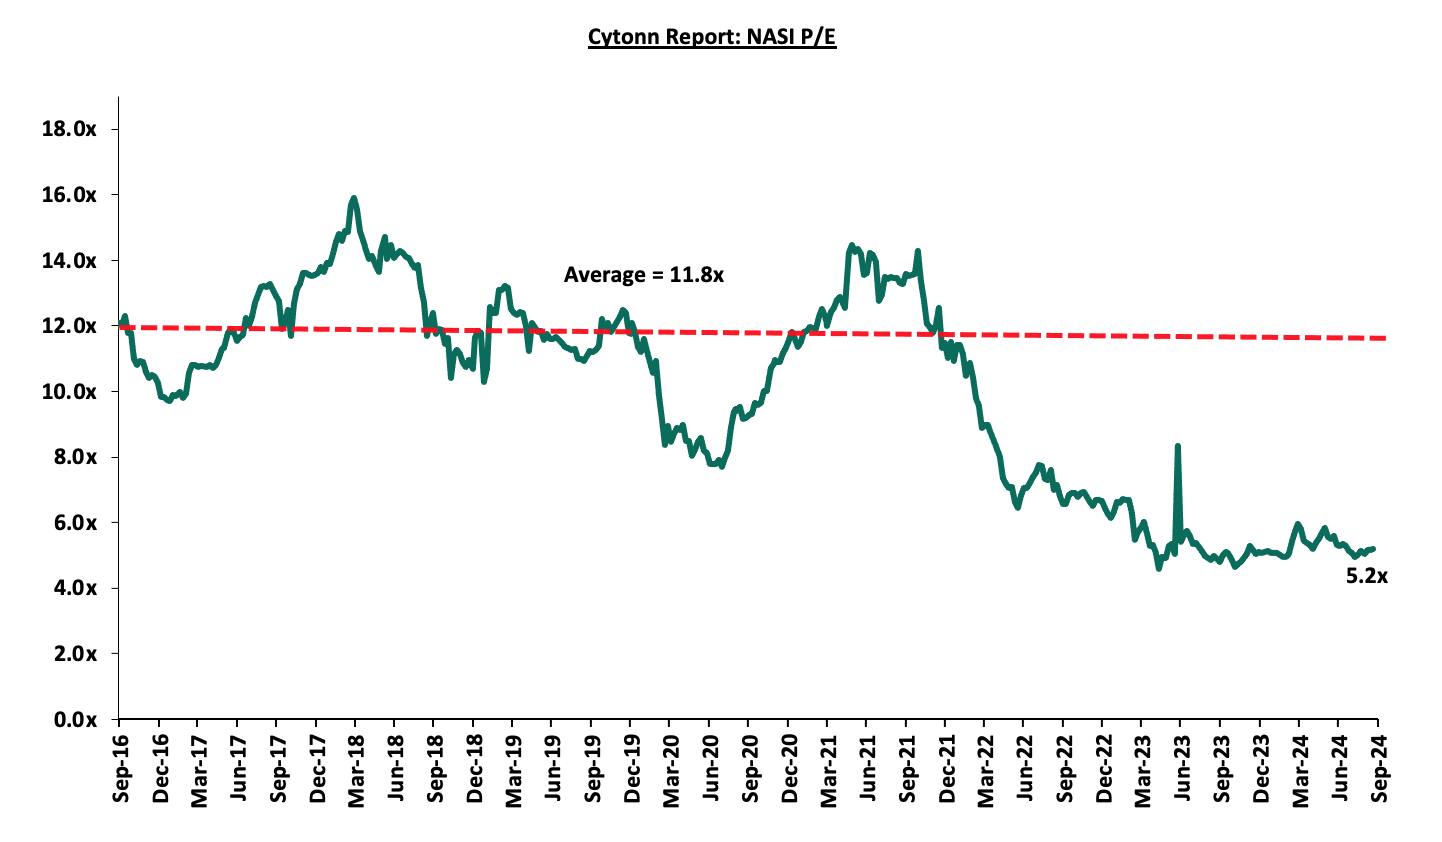
The market is currently trading at a price-to-earnings ratio (P/E) of 5.2x, 55.9% below the historical average of 11.8x. The dividend yield stands at 7.1%, 2.5% points above the historical average of 4.6%. Key to note, NASI’s PEG ratio currently stands at 0.7x, an indication that the market is undervalued relative to its future growth. A PEG ratio greater than 1.0x indicates the market is overvalued while a PEG ratio less than 1.0x indicates that the market is undervalued. The charts below indicate the historical P/E and dividend yields of the market;
Universe of Coverage:
|
Cytonn Report: Equities Universe of Coverage |
||||||||||
|
Company |
Price as at 13/09/2026 |
Price as at 20/09/2027 |
w/w change |
YTD Change |
Year Open 2024 |
Target Price* |
Dividend Yield |
Upside/ Downside** |
P/TBv Multiple |
Average |
|
Jubilee Holdings |
155.0 |
160.0 |
3.2% |
(13.5%) |
185.0 |
260.7 |
8.9% |
71.8% |
0.3x |
Buy |
|
Equity Group*** |
43.2 |
42.0 |
(2.8%) |
22.8% |
34.2 |
60.2 |
9.5% |
52.9% |
0.8x |
Buy |
|
Diamond Trust Bank*** |
45.6 |
46.7 |
2.4% |
4.4% |
44.8 |
65.2 |
10.7% |
50.3% |
0.2x |
Buy |
|
NCBA*** |
40.3 |
41.0 |
1.9% |
5.5% |
38.9 |
55.2 |
11.6% |
46.2% |
0.8x |
Buy |
|
Co-op Bank*** |
13.1 |
13.3 |
1.1% |
16.7% |
11.4 |
17.2 |
11.3% |
41.1% |
0.6x |
Buy |
|
CIC Group |
2.1 |
2.1 |
2.0% |
(8.7%) |
2.3 |
2.8 |
6.2% |
40.2% |
0.7x |
Buy |
|
Stanbic Holdings |
120.0 |
116.0 |
(3.3%) |
9.4% |
106.0 |
145.3 |
13.2% |
38.5% |
0.8x |
Buy |
|
KCB Group*** |
32.4 |
33.9 |
4.5% |
54.2% |
22.0 |
46.7 |
0.0% |
37.8% |
0.5x |
Buy |
|
ABSA Bank*** |
14.2 |
14.3 |
1.1% |
23.8% |
11.6 |
17.3 |
10.8% |
31.8% |
1.1x |
Buy |
|
Britam |
5.7 |
5.8 |
2.1% |
12.8% |
5.1 |
7.5 |
0.0% |
29.3% |
0.8x |
Buy |
|
I&M Group*** |
22.2 |
23.6 |
6.3% |
35.0% |
17.5 |
26.5 |
10.8% |
23.4% |
0.5x |
Buy |
|
Target Price as per Cytonn Analyst estimates **Upside/ (Downside) is adjusted for Dividend Yield ***For Disclosure, these are stocks in which Cytonn and/or its affiliates are invested in |
||||||||||
We are “Neutral” on the Equities markets in the short term due to the current tough operating environment and huge foreign investor outflows, and, “Bullish” in the long term due to current cheap valuations and expected global and local economic recovery. With the market currently being undervalued for its future growth (PEG Ratio at 0.6x), we believe that investors should reposition towards value stocks with strong earnings growth and that are trading at discounts to their intrinsic value. We expect the current high foreign investors’ sell-offs to continue weighing down the equities outlook in the short term.
- Industry report
During the week, the Kenya National Bureau of Statistics (KNBS) released the Leading Economic Indicators (LEI) July 2024 Report, which highlighted the performance of major economic indicators. Key highlights related to the Real Estate sector include;
- The total value of building plans approved in the Nairobi Metropolitan Area (NMA) decreased on y/y basis by 38.4% to Kshs 15.5 bn in July 2024, from Kshs 23.2 bn recorded in July 2023. In addition, on a monthly basis, the performance represented a 33.3% decrease from Kshs 25.7 bn recorded in June 2024. This decrease in performance may be attributable to; delays experienced by developers in acquiring building plan approvals from the county planning department and the clearing of the backlog of pending approvals in June after the county lifted a ban that had stopped new approvals from the previous months. The chart below shows the value of building plans approved in the Nairobi Metropolitan Area (NMA) between Q1’2021 and July 2024;
Source: Kenya National Bureau of Statistics (KNBS)
- Residential Sector
During the week, Local Authorities Pension Trust (LAPTrust), announced plan to redevelop its seven-acre estate in Changamwe, Mombasa County, at an estimated cost of Kshs 3.5 bn. The company aims to demolish 25 apartment blocks that host a total of 264 one-bedroom units in a bid to construct 5 apartment blocks with a total of 714 units of one, two, and three-bedroom typologies. The new project envisions a mixed-use development encompassing hospitality, retail, and residential units aimed at maximizing space which the company reports is underutilized.
LAPtrust currently holds properties with an estimated value of more than Ksh 16.0 bn in various parts of the country including Nairobi, Kajiado, Nakuru, and Mombasa, making rental revenue its second largest source of income earning Kshs 450.0 mn in 2022.
We anticipate that this move by the scheme will significantly expand the trust’s portfolio in Real Estate and subsequently assist in raising its rental income supported by the growing population in Mombasa County.
- Retail Sector
During the week, French retailer Carrefour Supermarket opened its latest store in Ruiru, Kiambu county marking its 24th outlet in the country. The retail store is situated at the newly developed Nord Mall, Ruiru town, Kiambu. The company aims to continue offering a wide selection of household products to the residents around Ruiru town with items ranging from appliances, furniture, stationary, and groceries among many other items.
This move is in line with the company’s expansion strategy in a bid to capture the retail market and also boost its e-commerce service operations around Nairobi Metropolitan area satellite towns. We expect the move by Carrefour will offer employment opportunities, both directly within the store and indirectly through increased business for local suppliers or services. Additionally, the entry of a large retailer like Carrefour may drive up demand for retail spaces in areas surrounding as smaller businesses seek to establish nearby to tap into the increased foot traffic from the outlet. The chart below shows the main local and international retail supermarket chains.
|
Cytonn Report: Main Local and International Retail Supermarket Chains |
||||||||||||
|
# |
Name of retailer |
Category |
Branches as at FY’2018 |
Branches as at FY’2019 |
Branches as at FY’2020 |
Branches as at FY’2021 |
Branches as at FY’2022 |
Branches as at FY’2023 |
Branches opened in FY’2024 |
Closed Branches |
Current Branches |
|
|
1 |
Naivas |
Hybrid* |
46 |
61 |
69 |
79 |
91 |
99 |
6 |
0 |
105 |
|
|
2 |
Quick Mart |
Hybrid** |
10 |
29 |
37 |
48 |
55 |
59 |
1 |
0 |
60 |
|
|
3 |
Chandarana |
Local |
14 |
19 |
20 |
23 |
26 |
26 |
0 |
0 |
26 |
|
|
4 |
Carrefour |
International |
6 |
7 |
9 |
16 |
19 |
22 |
2 |
0 |
24 |
|
|
5 |
Cleanshelf |
Local |
9 |
10 |
11 |
12 |
12 |
13 |
0 |
0 |
13 |
|
|
6 |
Jaza Stores |
Local |
0 |
0 |
0 |
0 |
0 |
4 |
2 |
0 |
6 |
|
|
7 |
Tuskys |
Local |
53 |
64 |
64 |
6 |
6 |
5 |
0 |
59 |
5 |
|
|
8 |
China Square |
International |
0 |
0 |
0 |
0 |
0 |
2 |
2 |
0 |
4 |
|
|
9 |
Uchumi |
Local |
37 |
37 |
37 |
2 |
2 |
2 |
0 |
35 |
2 |
|
|
10 |
Panda Mart |
International |
0 |
0 |
0 |
0 |
0 |
0 |
1 |
0 |
1 |
|
|
11 |
Game Stores |
International |
2 |
2 |
3 |
3 |
0 |
0 |
0 |
3 |
0 |
|
|
12 |
Choppies |
International |
13 |
15 |
15 |
0 |
0 |
0 |
0 |
15 |
0 |
|
|
13 |
Shoprite |
International |
2 |
4 |
4 |
0 |
0 |
0 |
0 |
4 |
0 |
|
|
14 |
Nakumatt |
Local |
65 |
65 |
65 |
0 |
0 |
0 |
0 |
65 |
0 |
|
|
Total |
257 |
313 |
334 |
189 |
211 |
232 |
14 |
181 |
246 |
|||
|
*51% owned by IBL Group (Mauritius), Proparco (France), and DEG (Germany), while 49% owned by Gakiwawa Family (Kenya) |
||||||||||||
|
**More than 50% owned by Adenia Partners (Mauritius), while Less than 50% owned by Kinuthia Family (Kenya) |
||||||||||||
Source: Cytonn Research
- Real Estate Investments Trusts (REITs)
- Acorn Project Two LLP notice of early redemption of Green bond
During the week, Acorn Project Two LLP, a special purpose vehicle of Acorn Holdings announced an early redemption of Kshs 2.6 bn in outstanding notes maturing on 8th November 2024 under the Kshs 5.7 bn medium-term note (MTN) Programme, effective 4th October 2024.
The notice highlighted that the notes will be redeemed at an amount equal to the nominal value of the notes, together with accrued but unpaid interest from the preceding interest payment date up to and including the early redemption date. Additionally, in connection with early redemption, the notes will be delisted from the fixed-income securities market segment of the Nairobi Securities Exchange.
The company had allocated the net proceeds of the Green bond to fund the green-certified development of PBSA properties and to make principal and interest payments to noteholders. However, the early redemption comes after Acorn Holdings Ltd signed a Kshs 23.6 bn financing deal with the U.S. Development Finance Corporation in May 2024 for the construction of 35 hostels adding 48,000 bed capacity to its portfolio
The early redemption reflects strong management by Acorn Holdings and enhances its reputation in the market. Consequently, we anticipate a positive reception of Acorn’s offerings when they decide to return to the market with another bond. Furthermore, we expect both Acorn D-REIT and I-REIT to maintain their positive growth, showcasing resilience on the back of several key factors. Firstly, the Purpose-Built Student Accommodation (PBSA) market presents an investment opportunity due to a shortage of quality, affordable student housing. Additionally, enrollment into universities and tertiary institutions remains resilient, as highlighted by the Kenya National Bureau of Statistics (KNBS). University enrollment for the 2023/2024 academic year increased by 3.0% year-on-year to 579,046 students from 561,674 in 2022/2023. For Technical, Vocational Education, and Training (TVET) institutions, student enrollment in 2023/2024 increased by 14.0% year-on-year to 642,726 students from 552,744 in 2022/2023.
- REIT Weekly Performance
On the Unquoted Securities Platform, Acorn D-REIT and I-REIT traded at Kshs 25.4 and Kshs 22.2 per unit, respectively, as per the last updated data on 13th September 2024. The performance represented a 27.0% and 11.0% gain for the D-REIT and I-REIT, respectively, from the Kshs 20.0 inception price. The volumes traded for the D-REIT and I-REIT came in at Kshs 12.3 mn and Kshs 31.6 mn shares, respectively, with a turnover of Kshs 311.5 mn and Kshs 702.7 mn, respectively, since inception in February 2021. Additionally, ILAM Fahari I-REIT traded at Kshs 11.0 per share as of 13th September, 2024, representing a 45.0% loss from the Kshs 20.0 inception price. The volume traded to date came in at 138,600 for the I-REIT, with a turnover of Kshs 1.5 mn since inception in November 2015.
REITs offer various benefits, such as tax exemptions, diversified portfolios, and stable long-term profits. However, the ongoing decline in the performance of Kenyan REITs and the restructuring of their business portfolios are hindering significant previous investments. Additional general challenges include; i) insufficient understanding of the investment instrument among investors, ii) lengthy approval processes for REIT creation, iii) high minimum capital requirements of Kshs 100.0 mn for trustees, and iv) minimum investment amounts set at Kshs 5.0 mn for the Investment REITs, all of which continue to limit the performance of the Kenyan REITs market.
We expect the performance of Kenya’s real estate sector to be sustained by: i) increased investment from local and international investors, particularly in the retail, and residential sectors ii) Favorable demographics in the country, leading to higher demand for housing and Real Estate, and iii) ongoing residential developments under the Affordable Housing Agenda, aiming to reduce the housing deficit in the country iv) increased recognition of Nairobi as a shopping hub boosting the retail sector, v) increased infrastructural development in the country opening up satellite towns for more investment opportunities, vi) a growing middle-class; creating demand for retail commodities, and vii) growth and expansion efforts by both local and international retailers vii) Improved enrollment into university and tertiary institutions. However, challenges such as rising construction costs, an oversupply in select Real Estate classes, strain on infrastructure development, and high capital demands in the REITs sector will continue to impede the real estate sector’s optimal performance by restricting developments and investments.
National Social Security schemes are created by governments to form the first pillar of social security. In Africa, Kenya was the second country after Ghana to form a national security scheme, The National Social Security Fund (NSSF), done in 1965 through an Act of Parliament (Cap 258). It is a provident fund, which provides benefits to retiring members as a lump sum rather than through periodic payments. In recent years, discussions around the growth and reform of the NSSF have gained momentum, with key considerations on how to increase coverage, especially for the informal sector, and improve service delivery. The fund has also faced a number of challenges in recent years, with concerns about mismanagement, corruption, and inefficiencies often overshadowing the fund’s broader mission and leading to a decline in public confidence. Most recently, the fund was in the news for yet to be quantified losses associated with questionable bond trading. As such, we saw it fit to cover a topical on the Kenyan National Social Security Fund to shed light on the recent developments and look at whether NSSF has been able to meet its objectives in terms of reducing the dependency of retirees. We shall do this by taking a look into the following;
- Introduction to the National Social Security Fund,
- Recent Developments at the National Social Security Fund,
- Effectiveness of the National Social Security Fund,
- Factors hindering growth of the NSSF,
- Key considerations to improving NSSF in Kenya, and,
- Conclusion.
Section I: Introduction to the National Social Security Fund
Social security is defined as any programme of social protection established by legislation, or any other mandatory arrangement, that provides individuals with a degree of income security when faced with the contingencies of old age, survivorship, incapacity, disability, or unemployment. In Kenya, the National Social Security Fund (NSSF) offers social protection to all Kenyan workers in the formal and informal sectors by providing a platform to make contributions during their productive years to cater for their livelihoods in old age and the other consequences resulting from unprecedented occurrences such as death or invalidity among others.
The National Social Security Fund (NSSF) has evolved over time having been established in 1965 through an Act of Parliament Cap 258 of the Laws of Kenya. The Fund initially operated as a Department of the Ministry of Labor until 1987 when the NSSF Act was amended transforming the Fund into a State Corporation under the Management of a Board of Trustees. The Act was established as a mandatory national scheme whose main objective was to provide basic financial security benefits to Kenyans upon retirement. The Fund was set up as a Provident Fund providing benefits in the form of a lump sum. Thereafter, the National Social Security Fund (NSSF) Act, No.45 of 2013 was assented to on 24th December 2013 and commenced implementation on February 2023 thereby transforming NSSF from a Provident Fund to a Pension Scheme. Every Kenyan with an income was required to contribute a percentage of his/her gross earnings so as to be guaranteed basic compensation in case of permanent disability, basic assistance to needy dependents in case of death, and a monthly life pension upon retirement. The Act establishes two Funds namely;
- Pension Fund, and,
- Provident Fund.
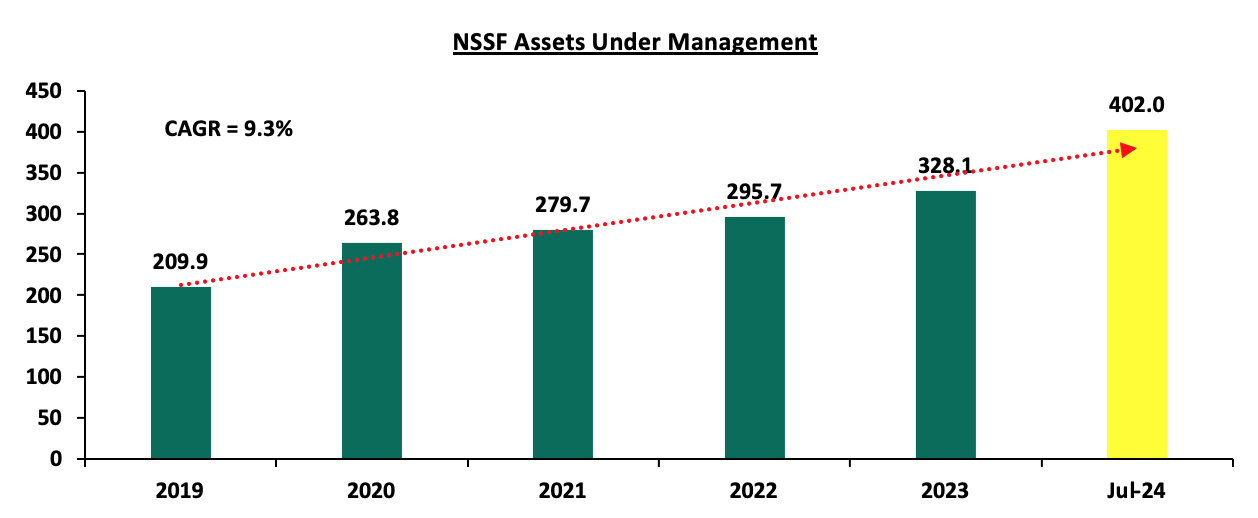
NSSF has gained traction over the years, but particularly in the last year, owing to implementation of the NSSF Act of 2013, which came into effect in February last year. The Act increased contributions to the fund from the initial Kshs 400.0 to 12.0% of individuals' income, with the employee and employers both contributing 6.0%. In December 2023, total investments held by NSSF increased by 6.4% to stand at Kshs 328.1 bn, from Kshs 308.3 bn in December 2022. As of the half year ended July 2024, the assets held by NSSF stood at Kshs 402.0 bn. The graph below shows the movement of the fund’s Assets Under Management in the last five years:
Source: RBA Annual Reports
Notably, 75.6% of NSSF Assets are managed by six external fund managers, while the remaining 24.4% are held internally by the fund. This translated to NSSF internally managing Kshs 80.3 bn, while the remaining Kshs 247.9 bn is held by six external fund managers as of 2023, with the largest share held by Gen Africa Asset Managers. The table below shows the distribution of the NSSF funds managed by different fund managers:
|
Cytonn Report: NSSF Portfolio Managed by External Fund Managers |
|||||
|
Fund Manager |
Assets in bn |
||||
|
Dec-19 |
Dec-20 |
Dec-21 |
Dec-22 |
Dec-23 |
|
|
British America Asset Managers Limited |
76.7 |
82.3 |
- |
- |
- |
|
Gen Africa Asset Managers |
44.1 |
47.8 |
56.4 |
57.3 |
59.2 |
|
Old Mutual Asset Managers |
37.8 |
42.2 |
48.3 |
49.2 |
52.9 |
|
Africa Alliance Kenya Investment Bank |
33.1 |
37.5 |
42.6 |
43.8 |
21.2 |
|
Sanlam Investments East Africa Ltd |
- |
- |
46 |
39.5 |
30.2 |
|
Co-op Trust |
- |
- |
46.9 |
47.8 |
52.9 |
|
CIC Asset Managers Ltd. |
- |
- |
0.1 |
12.5 |
31.4 |
|
TOTAL |
191.7 |
209.8 |
240.3 |
250.1 |
247.9 |
Source: RBA Annual Reports
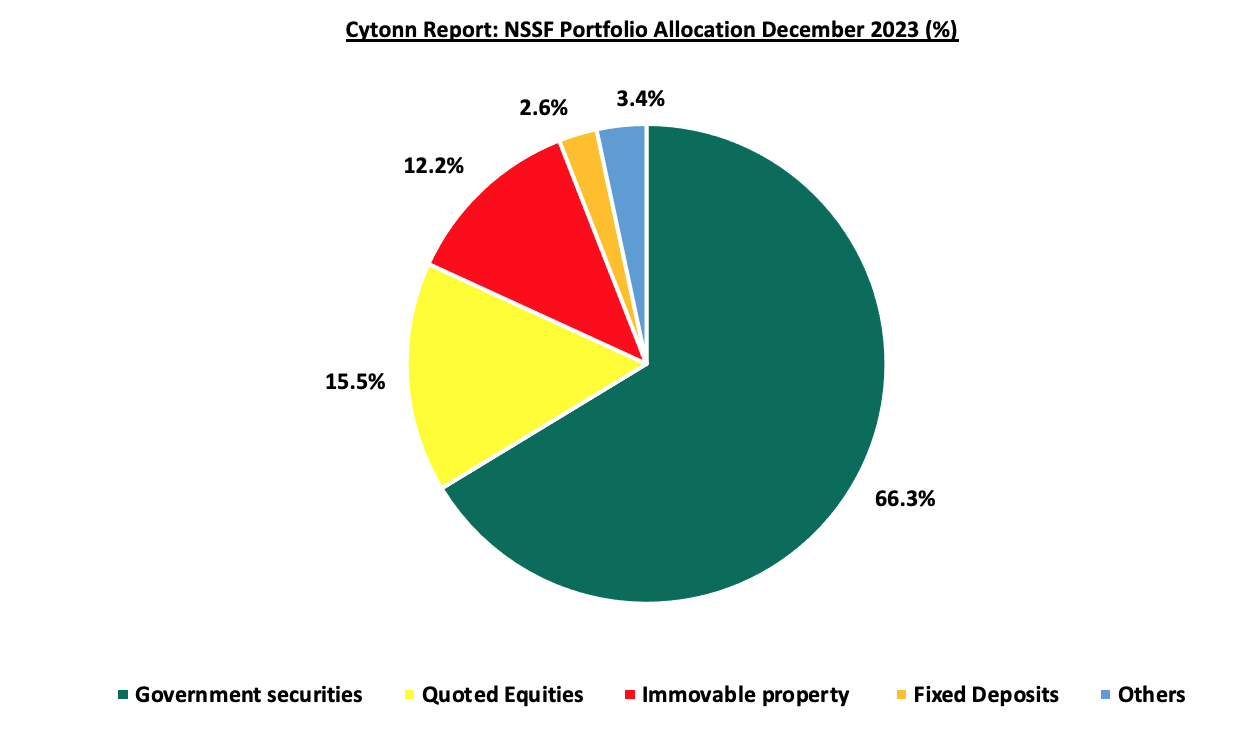
From their 2023 data, NSSF's portfolio is heavily invested in government securities representing 66.3% of the total assets. This exposure is understandable, and actually common for most other pension schemes because of the safety, stability, and credibility associated with government bonds. This was followed by quoted equities and immovable property at 15.5% and 12.2%, respectively.
Source: RBA Annual Reports
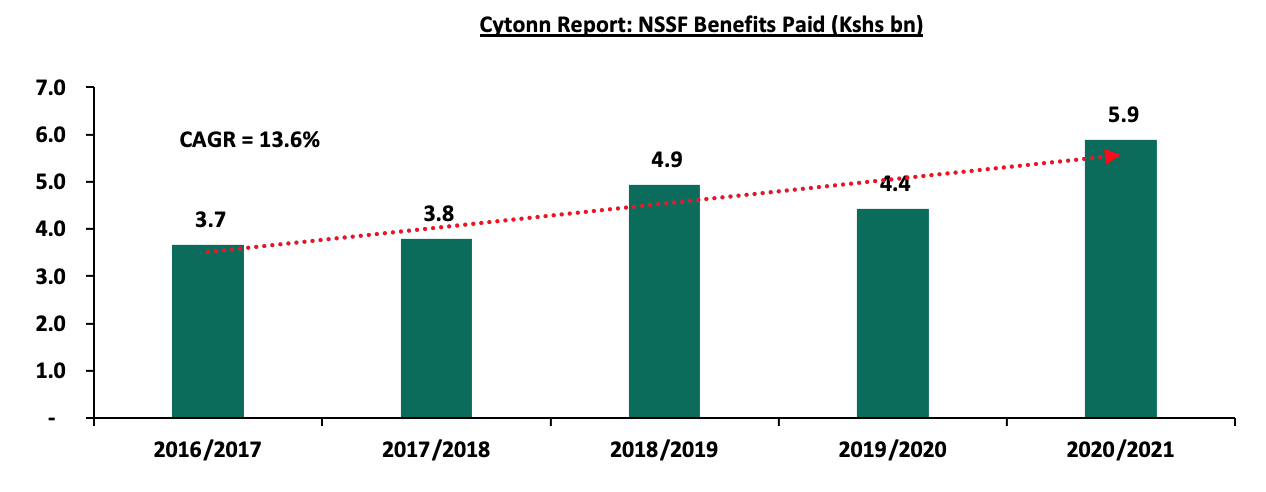
Payment of claims after retirement has also evolved over time growing at a 5-year CAGR of 13.6% to Kshs 5.9 bn in FY’2020/2021 from Kshs 3.1 bn recorded in FY’2015/2016, from their last published annual report. The graph below shows the benefits payout over the last reported periods;
Source: NSSF Annual Reports
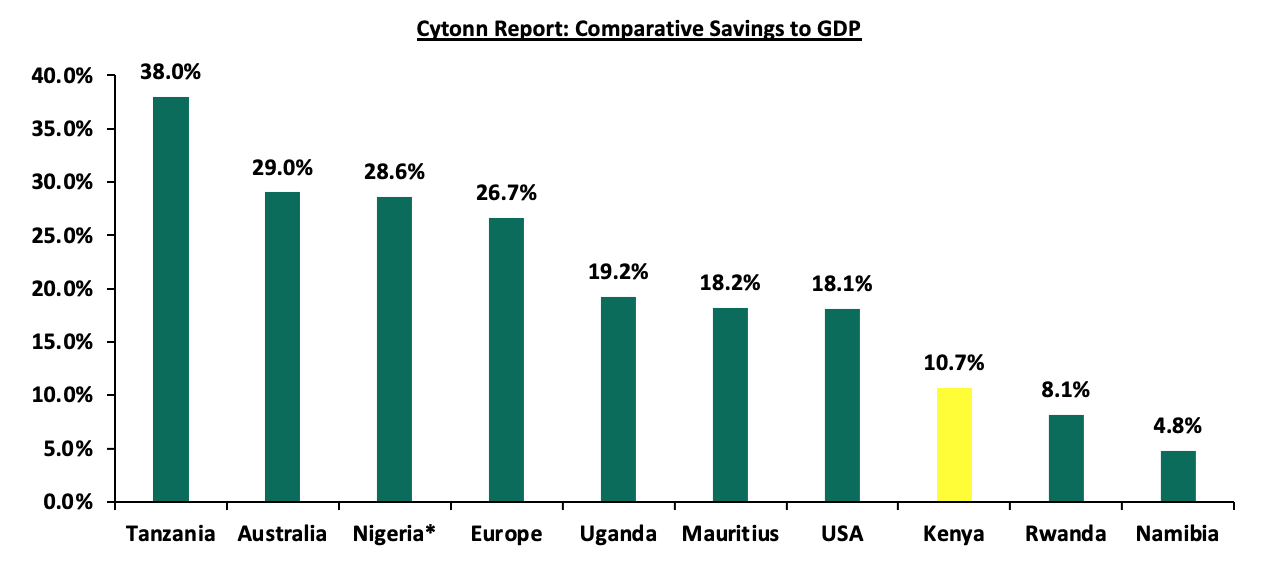
Despite the government making NSSF mandatory, Kenya’s saving culture still lags behind in comparison to other more developed countries partly attributable to low disposable income with 35.1% of the Kenyan population as of 2023 living below the poverty line coupled with lack of sufficient knowledge on the importance of saving for retirement. The graph below shows the gross savings to GDP of select countries in the Sub-Saharan Africa Region and the developed economies;
*Figures as of 2023
Source: World Bank
Section II: Recent Developments at the National Social Security Fund
The National Social Security Fund (NSSF) has recently found itself under intense scrutiny due to a series of troubling developments. First, data from the Controller of Budget for the last financial year which ended in June indicates that government defaults to NSSF and NHIF almost tripled, reaching Kshs 716.0 mn in 2023 from Kshs 215.0 in the previous year. Earlier this month, The Central Bank of Kenya (CBK) also raised serious concerns regarding irregular trading activities involving the National Social Security Fund (NSSF), prompting a request for the Capital Markets Authority (CMA) to conduct a thorough investigation.
- Government Default on Remittance: Unremitted contributions to both the NSSF and the National Hospital Insurance Fund (NHIF) surged from Kshs 215.0 mn to Kshs 716.0 mn within a single fiscal year, according to the Controller of Budget. NSSF, by itself, had its unremitted contributions from the government increase by 251.7% to Kshs 182.0 bn from Kshs 64.0 bn in the previous financial year. These form part of the larger pending bills issue that the government has been dealing with, following intense pressure on the exchequer from debt repayments.
While this pressure on the exchequer is understandable, the default on retirement funds contributions has to be worrying. For many retirees, the NSSF is not just a fund; it represents the culmination of years of hard work and savings. When defaults like these lead to delays in payments of their benefits, it makes them even more vulnerable and uncertain. Having to deal with delayed disbursements on top of the bureaucratic inefficiencies isn’t a good look for our system. - Irregular bond trading: Earlier this month, the Central Bank of Kenya (CBK) initiated an investigation, through a request to the Capital Markets Authority, into irregular trading activities involving the NSSF, where bonds were allegedly bought at inflated prices and sold at losses. This raises serious concerns about market integrity and investment management within institutions like the National Social Security Fund (NSSF). Surprisingly, this isn’t the first of such cases, in 2008, the Kenya Anti-Corruption Commission – as it was then known – received a report that the National Social Security Fund (NSSF) had lost Kshs 1.6 bn of pension funds through irregular trading in shares by Discount Securities Limited. Investigations were done for these, and seven directors at the fund were prosecuted and found guilty of illegally acquiring Kshs 1.2 bn meant for shares that was paid by NSSF, with each getting different sentences.
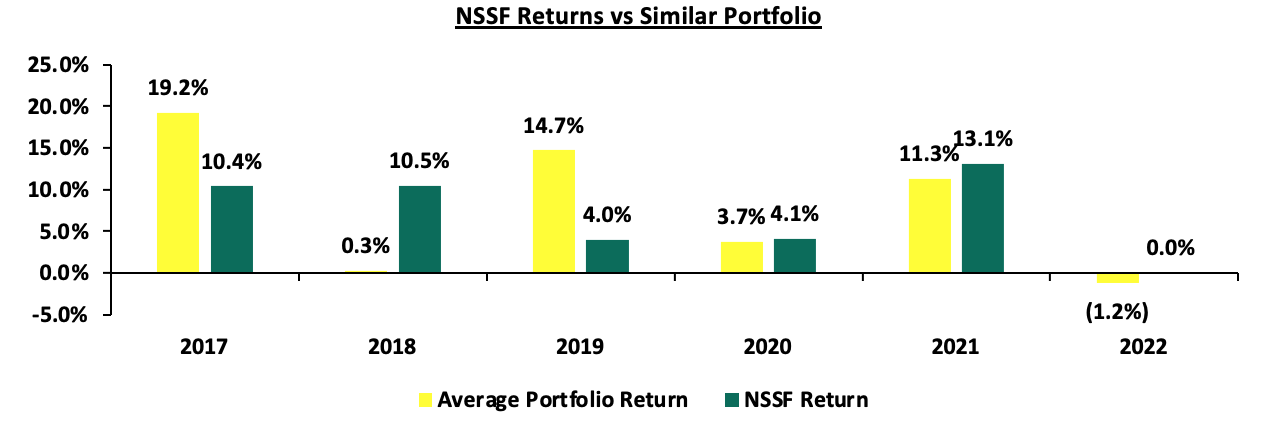
The recurrence of such issues emphasizes the urgent need for enhanced oversight and accountability within the NSSF. Selling bonds at a loss has serious consequences. First, it directly harms the fund's financial health, leading to lower returns and less money available for member payouts. This is what makes Kenyans doubt the ability of the fund's management. As we become more skeptical, the fund continues to face reputational damage. Notably, the fund hasn’t released their performance report since 2022, and the last reported performance was 0.0% in 2022. Below is the performance summary for the last few years, compared to the estimated returns from a portfolio of 60% bonds and 40% equities:
Source: NSSF strategic plan 2023-2027
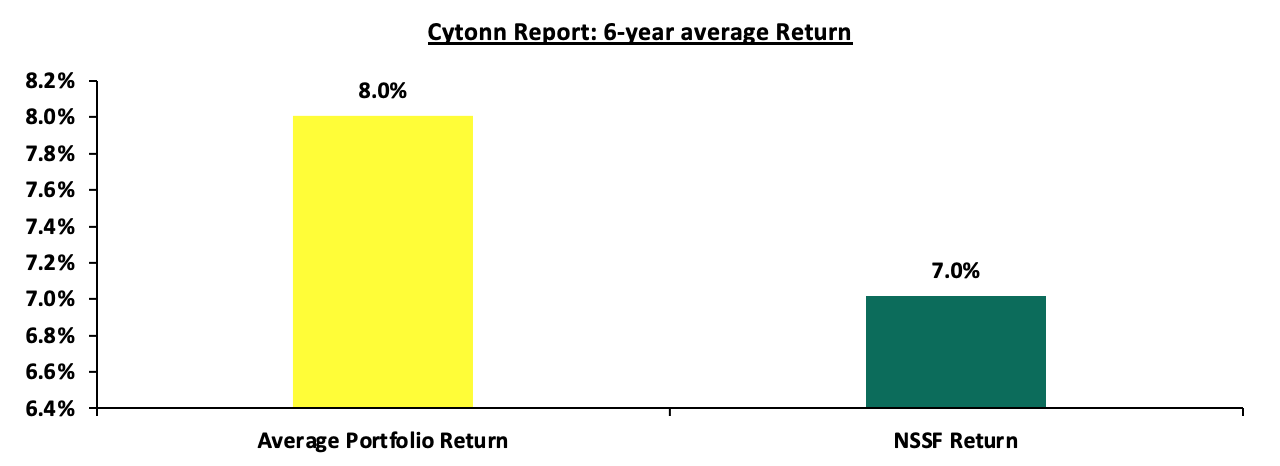
On average, the NSSF portfolio has underperformed by 1.0 percentage point compared to a comparable benchmark. While NSSF recorded a return of 7.0%, a similarly constructed portfolio—split between 60% government bonds and 40% equities from the NASI—achieved 8.0% over the same period. While there may be a number of reasons for this, occurrences such as the irregular bond trades could definitely have contributed to this.
Section III: Effectiveness of the National Social Security Fund
One of the main objectives of the National Social Security fund is to provide a source of income to retirees and improve the adequacy of benefits paid out to the beneficiaries. According to the Retirement Benefits Authority (RBA), the retirement benefits industry in Kenya has a membership of over 7.3 mn with a coverage of 25.0% of the working-age population, with the mandatory scheme, National Social Security Fund (NSSF), accounting for over 80.0% of the total membership as of 2021. Despite this, Kenya has an Income replacement ratio of 43.0% compared to the recommended ratio of 75.0%, indicating that most retirees in Kenya are likely to remain financially dependent after retiring.
To shed more light on the adequacy of NSSF savings in reducing the dependence of retirees, we compare three scenarios as follows;
- Individual A who relies purely on NSSF contributions (a standard contribution of Kshs 200.0 per month which is matched by the employer),
- Individual B who relies on NSSF but tops up the contribution with Kshs 1,000.0 every month as additional voluntary contributions, and,
- Individual C tops up their NSSF with an additional Kshs 5,000.0. We also assume the following;
|
Cytonn Report: Adequacy of NSSF savings in catering for post-retirement, |
|
|
Start Working Age (Years) |
25 |
|
Retirement Age (Years) |
60 |
|
Savings Period (Years) |
35 |
|
Assumed Constant Annual Interest Rate |
7.0% |
|
Average Salary (Kshs) |
50,000.0 |
|
Cytonn Report: Income Replacement |
|||
|
Monthly Pension Contribution (Kshs) |
Amount At Maturity (Before Tax) (Kshs) |
Number of Years post Retirement one can maintain the same living standard |
|
|
Individual A |
400.0 |
724,624.0 |
1.7 |
|
Individual B |
1,400.0 |
2,536,185.1 |
6.0 |
|
Individual C |
5,400.0 |
9,782,428.1 |
23.3 |
Generally, one needs about 70.0% of what they make at the peak of their career to maintain the same standard of living in retirement. By this finding, we can estimate roughly the number of years post-retirement that the three individuals in the table above can live comfortably on their pension money. As per the table above, individual A will have a consistent income for 1.7 years.
Evidently, NSSF savings (as in for Individuals A and B) are not adequate to cater to their post-retirement assuming that they live for more than 15 years after retirement, an indication that NSSF does not meet its objective of alleviating poverty and reduction of dependency post-retirement.
Section IV: Factors Hindering the Growth of NSSF
The growth of the National Social Security Fund (NSSF) in Kenya has been hindered by a range of interrelated factors that have affected its efficiency, financial stability, and ability to provide adequate retirement benefits. In this regard, we analyze the factors that have hindered growth of the fund as follows:
- Leadership and Governance Issues: The NSSF has faced persistent governance issues, including allegations of mismanagement and corruption. Investigations into corruption allegations involving senior officials at the NSSF have undermined confidence in the fund’s management and led to calls for reforms. However, these reforms have faced delays due to bureaucratic hurdles and resistance from entrenched interests. The lack of effective governance has contributed to inefficiencies and mismanagement,
- Investment Return Challenges: The fund has faced challenges in achieving satisfactory investment returns due to ineffective asset management and underperforming investments. This has hindered the National Social Security Fund (NSSF)’s ability to grow its asset base and provide adequate benefits to its members. Moreover, the fund has struggled with unremitted contributions from state corporations, government-owned enterprises, and semi-autonomous agencies. By the end of FY’2023/24, unremitted contributions to NSSF reached Kshs 182.0 mn, a significant 251.7% increase from the Kshs 64.0 mn recorded at the end of FY’2022/23. This surge in unremitted contributions highlights the growing funding gap that threatens NSSF’s ability to meet its retirement obligations,
- Slow Economic Growth: Kenya’s economy has faced persistent slow growth, with an average GDP growth rate of 4.5% over the last 5 years. This slow economic performance has resulted in low-income levels for many citizens, directly impacting their ability to make regular contributions to the National Social Security Fund (NSSF). Furthermore, inflation and increasing cost of living have reduced disposable income, making it difficult for both individuals and employers to meet their NSSF obligations. This economic stagnation has contributed to lower contribution inflows, limiting the fund's ability to grow its asset base and deliver adequate retirement benefits,
- High Unemployment Rate in Kenya: The unemployment rate in Kenya stood at 5.6% at the end of 2023, and is projected at 6.6% by the end of 2024; primarily due to the challenges facing the country’s economic development, alongside a rising youth population. This has increased the dependency ratio of the working population, making it difficult for them to commit to social security contributions towards their retirement. Consequently, this hinders the National Social Security Fund (NSSF)'s growth as fewer people are able to contribute to the fund, limiting its ability to expand its asset base,
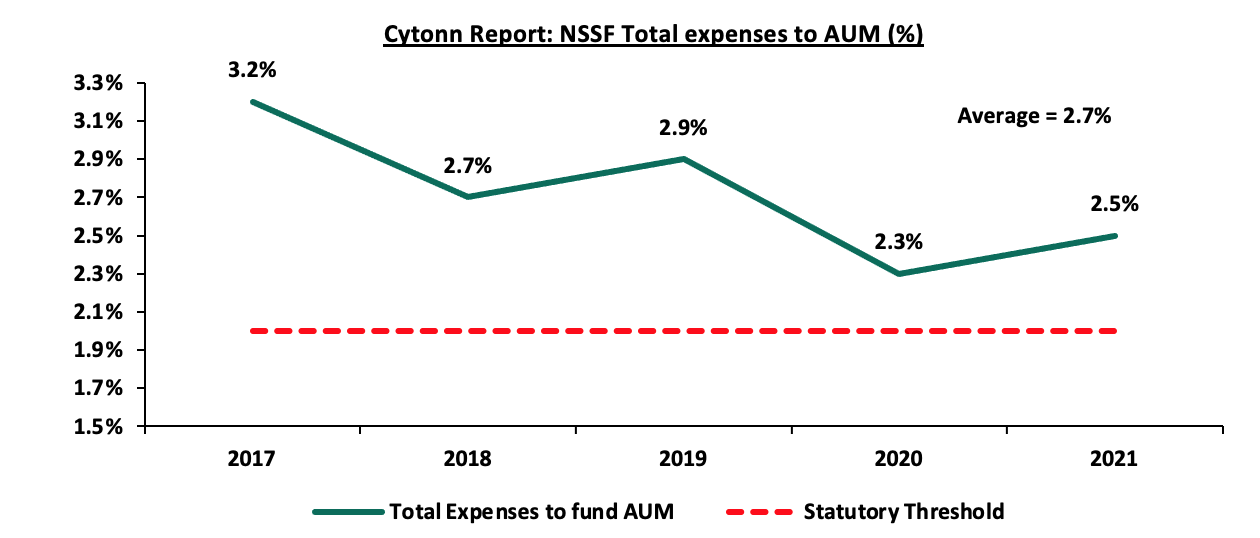
- Inefficiencies: Section 50 of the National Social Security Fund Act, 2013, stipulates that the fund shall not pay out more that 2.0% of its total assets in the first six years of its operation, and thereafter, its capped at 1.5%, However, the fund has consistently breached this guideline, with the average payout for the last reported 5 years, coming in at 2.7%. This breach signals inefficiency, especially in management of costs in the fund, which continues to erode member’s savings and subsequently their trust in the fund. The graph below shows the expenses of the fund as a percentage of its Assets in the last five reported years:
- Openness and Transparency - Transparency is critical in enhancing trust and ensuring that members are informed about how their contributions are managed and invested. The fund should, therefore, aim to release its financials on time. On their website, the last available reports are from 2021, two and a half years ago.
- Government Interference - Given that NSSF is a government-owned institution, it often makes decision with politics in the background hence the poor returns and many incidences of corruption and mismanagement.
Section V: Key Considerations for Improving NSSF in Kenya
We note that the government has continually tried to enforce a savings culture in the country through various reforms such as an increase in contributions as well as making the contributions mandatory. For instance, in the NSSF Act 2013, the government recommended a mandatory registration contribution to NSSF by employees and employers. The Act aimed to enhance the sustainability of retirement benefits for Kenyan workers. Key provisions of the Act include an increase in contribution rates, from a flat rate of Kshs 400.0 to 12.0% of an employee's monthly earnings, with 6.0% contributed by the employee and an equal amount by the employer.
However, the enactment of the Act has faced legal challenges. Multiple petitions were filed questioning its constitutionality, leading to a decision by the Employment and Labor Relations Court (ELRC). On September 19th, 2022, in Kenya Tea Growers Association & 8 Others v. NSSF Board & Others, the ELRC ruled that the Act was unconstitutional on the basis of;
- The provisions of the NSSF Act, 2013 were not subjected to public participation and were not tabled before the Senate prior to its enactment as per constitutional requirements,
- Imposing mandatory registration and contribution to NSSF would have overburdened employees and consequently reduce disposable income since a vast majority of employees have their pay slips already strained due to their various financial commitments with other institutions and their subscription to other pensions schemes, and,
- The provisions of the Act would have given NSSF a competitive advantage thus making the Fund a monopoly in the provision of pension and social security services in the country.
Following this ruling, the NSSF Board of Trustees appealed, and the case eventually reached the Supreme Court of Kenya. The Supreme Court examined whether the ELRC had the jurisdiction to rule on the Act's constitutionality. Ultimately, the court affirmed the ELRC’s jurisdiction but remitted the case to the Court of Appeal for further consideration. In our view, the following are some of the actionable steps that can be taken into consideration to ensure growth of the NSSF while working towards meeting its objective and achieving a win-win situation for the government, employers and employees;
- Ensure involvement of all stakeholders in NSSF reforms - The general public and all stakeholders need to be involved whenever there is a recommendation for reforms in the NSSF. As stated above, the High Court stopped the NSSF Act of 2013 which included a bid to increase monthly contributions to Kshs 2,068.0 from the current Kshs 200.0 as it was not subjected to public participation in breach of the Constitution which demands public input before major decisions are taken. Additionally, the promoters of the Act failed to get approval from the Senate despite the law affecting county employees and the finances of the devolved governments. The higher pension contributions would have boosted the growth of NSSF by building a bigger retirement pot and offering workers better replacement ratios as opposed to the current plan,
- Mass education on developing a savings culture - There is a need to educate Kenyans on developing a savings culture given that the majority of Kenyans including young people in the informal sector believe that they are too young to start saving for retirement and it is only the older people who should have retirement benefit schemes. Additionally, the majority of Kenyans usually worry less about their retirements because of the belief in assistance by their children as they have invested in them. Such attitude hinders people from voluntarily joining schemes such as the NSSF when they have a source of regular income;
- Enforcement of compliance from employers - The NSSF should seal all loopholes in order to ensure full compliance by all employers in remitting NSSF contributions. This can be done by incorporating technologies that allow payroll-related contributions under one platform in order to improve efficiency and reconcile the records while identifying employers who remit some payments and leave out others,
- Improved openness & transparency - Transparency is critical in enhancing trust and ensuring that members are informed about how their contributions are managed and invested. The fund should, therefore, aim to release its financials on time. On their website, the last available reports are from 2021, two and a half years ago. This will help boost confidence among members and stakeholders. It would be a good sign if both 2022 and 2023 financials were then concurrently published,
- Induce operational efficiency – In the financial year ended 30th June 2021, NSSF’s total expenses amounted to Kshs 6.6 bn, equivalent to 45.4% of the members' contributions of Kshs 14.5 bn, with the total expenses to AUM ratio increasing by 0.1% points to 2.3% in FY’2020/2021 from 2.2% FY’2019/2020. Key to note, total expenses increased by 21.5% in the year ended 30th June 2021, while members' contributions declined by 1.8% to Kshs 14.5 bn from Kshs 14.7 bn in the year ended 30th June 2020. For NSSF to better serve the interests of all stakeholders, there needs to be proactive measures around increasing efficiency and cutting down on unnecessary expenditure,
- Make NSSF Autonomous from Political Interference: We should consider a governance model that makes NSSF a semi-autonomous body insulated from government interreference, and,
- NSSF should invest the savings in high-yielding investments – In the last five financial years, the average interest on members’ funds has come in at 6.8%. When compared against the average inflation during the same period of 5.9%, this presents real returns of a paltry 0.9%. The fund should continually seek to raise the interest on the savings in order to motivate employees in formal and informal sectors to save for their retirement. This can only be achieved through improving its financial security by investing in worthwhile ventures that will have maximum returns so that its members can benefit maximally.
Section V: Conclusion
The National Social Security Fund (NSSF) is at a pivotal moment, grappling with significant challenges that threaten both its credibility and the financial security of its members. For many retirees, the NSSF embodies years of hard work and sacrifice, making the protection of their benefits paramount. To restore trust, it is essential to implement robust oversight mechanisms, including independent audits and strict enforcement of remittance timelines. The time has come for all stakeholders—government, regulators, and fund management—to unite in a concerted effort to revitalize the NSSF, ensuring it can fulfill its vital role in safeguarding the retirement futures of millions of Kenyans. Immediate action is not just necessary, it is mandatory. This will aid in reducing poverty in old age as well as providing regular income to replace earnings in retirement.
Disclaimer: The views expressed in this publication are those of the writers where particulars are not warranted. This publication, which is in compliance with Section 2 of the Capital Markets Authority Act Cap 485A, is meant for general information only and is not a warranty, representation, advice or solicitation of any nature. Readers are advised in all circumstances to seek the advice of a registered investment advisor.

