
The Rise of Satellite Towns in Nairobi Metropolitan Area, & Cytonn Weekly #28/2026
By Research Team, Jul 19, 2026
Executive Summary
Fixed Income
During the week, T-bills were oversubscribed for the seventh consecutive week, with the overall subscription rate coming in at 157.2% albeit lower than the subscription rate of 177.6%, recorded the previous week. Investors’ preference for the shorter 91-day paper persisted, with the paper receiving bids worth Kshs 24.4 bn against the offered Kshs 8.0 bn, translating to a subscription rate of 304.4%, lower than the the subscription rate of 435.0% recorded the previous week. The subscription rate for the 364-day paper decreased to 45.1% from 60.4%recorded the previous week, while that of the 182-day paper increased to 151.5% from 88.8% recorded the previous week. The government accepted a total of Kshs 30.6 bn worth of bids out of Kshs 44.0 bn bids received, translating to an acceptance rate of 69.6%. The yields on the government papers showed a mixed performance with the yields on the 364-day paper increasing the most by 4.9 bps to 9.04% from 8.99% recorded the previous week. The yield on the 91-day paper decreased by 2.6 bps to 8.80% from 8.83% recorded the previous week, while the yield on the 182-day paper decreased by 0.2 bps to remain relatively unchanged at 8.97% compared to the previous week;
During the week, the Central Bank of Kenya released the auction results for the switch of treasury bonds from FXD1/2021/005, with a tenor to maturity of 0.6 years and a fixed coupon rate of 11.3%, to FXD1/2012/020, a with a tenor to maturity of 6.3 years and a fixed coupon rate of 12.0%. This marks the fifth bond switch, following the switches to IFB1/2022/06, IFB1/2020/06, FXD1/2022/015 and FXD3/2019/015 in December 2022, June 2020, January 2026 and March 2026 respectively. The bond was undersubscribed, with the overall subscription rate coming in at 81.6%, receiving bids worth Kshs 8.2 bn against the offered Kshs 10.0 bn. The government accepted bids worth Kshs 8.0 bn, translating to an acceptance rate of 97.5%. The weighted average yield for the accepted bids for the FXD1/2012/020 came in at 12.8%. Notably, the 12.8% on the switch to FXD1/2012/020 was slightly higher than the 12.5% recorded the last time the bond was reopened in May 2026. With the Inflation rate at 6.4% as of June 2026, the real return of the FXD1/2012/020 was 6.4%. Given the 10.0% withholding tax on the bonds, the tax equivalent yields for shorter term bonds with 15.0% withholding tax is 12.7% for the FXD1/2012/020;
The government is also looking to raise Kshs 40.0 bn through the reopened twenty years and twenty- five years fixed coupon bonds FXD1/2019/020 and FXD1/2022/025 with fixed coupon rates of 12.9% and 14.2% respectively and tenors to maturity of 12.8 years and 21.4 years respectively. The period of sale for the two bonds opened on Tuesday 14th July 2026 and will close on Wednesday 22nd July 2026. Our bidding ranges for the reopened bonds FXD1/2019/020 and FXD1/2022/025 is 12.90%-13.30% and 13.80% - 14.20% respectively;
During the week, The Energy and Petroleum Regulatory Authority (EPRA) released their monthly statement on the maximum retail fuel prices in Kenya, effective from 15th July 2026 to 14th August 2026. Notably, the maximum allowed prices for Super Petrol, Diesel and Kerosene remain unchanged at Kshs 214.0, Kshs 222.9 and Kshs 191.4 respectively recorded last month;
During the week, The National Treasury gazetted the revenue and net expenditures for the twelfth month of FY’2025/2026, ending 30th June 2026, highlighting that the total revenue collected as at the end of June 2026 amounted to Kshs 2,607.3 bn, equivalent to 98.7% of the revised estimates of Kshs 2,640.6 bn for FY’2025/2026 and is 98.7% of the prorated estimates of Kshs 2,640.6 bn.
Equities
During the week, the equities market was on an upward trajectory, with NSE 20, NASI, NSE 25 and NSE 10 gaining by 3.0%, 1.1%, 0.9% and 0.4% respectively, taking the YTD performance to gains of 26.0%, 25.5%, 25.4% and 23.6% for NSE 20, NSE 10, NSE 25 and NASI respectively. The week-on-week equities market performance was mainly driven by gains recorded by large cap stocks such as EABL, SCBK and ABSA of 5.1%, 0.7% and 0.3% respectively. However, the performance was weighed down by losses recorded by large cap stocks such as NCBA, Stanbic and Safaricom of 2.0%, 1.4% and 1.3% respectively;
During the week, the banking sector index increased marginally by 1.0% to 264.2 from the 261.5 recorded the previous week. This is attributable to gains recorded by large cap stocks such as SCBK and ABSA of 0.7% and 0.3% respectively. However, the performance was weighed down by losses recorded by large cap stocks such NCBA, Stanbic and Cooperative Bank of 2.0%, 1.4% and 1.0% respectively;
Real Estate
During the week, KNBS released their Q1’2026 Kenya Residential Property Price Index (RPPI), which indicated that overall Residential Property Price Index (RPPI) increased by 4.8% to 118.4 in Q1'2026 from 113.0 in Q1'2025. On a quarter-on-quarter basis, the index increased marginally by 0.6% from 117.7 in Q4'2025;
On the Unquoted Securities Platform Acorn D-REIT and I-REIT traded at Kshs 29.6 and Kshs 23.8 per unit, respectively, as per the last updated data on 3rd July 2026. The performance represented a 48.0% and 18.8% gain for the D-REIT and I-REIT, respectively, from the Kshs 20.0 inception price. The volumes traded for the D-REIT and I-REIT came in at 13.5 mn and 43.3 mn shares, respectively. Additionally, ILAM Fahari I-REIT traded at Kshs 13.8 per share as of 3rd July 2026, representing a 31.0% loss from the Kshs 20.0 inception price. The volume traded to date came in at 1.2 mn shares for the I-REIT;
Digital Payments
During the week, Visa announced the launch of the Visa Stablecoin Platform (VSP), a new infrastructure layer that lets banks, fintechs, and other payment providers issue, move, and manage stablecoins directly through Visa's network. The platform will initially support Open USD, the industry stablecoin. Rather than building and running their own blockchain infrastructure from scratch, financial institutions can now plug into Visa's existing rails to come "onchain" and handle stablecoin operations custody, settlement, and movement within a single, trusted environment;
During the week, Mastercard Incorporated announced a major expansion of its artificial intelligence infrastructure in the United Kingdom, highlighted by the upcoming August launch of Proto, a dedicated sandbox testing environment within its broader enterprise Agent Suite. This rollout introduces a specialized trifecta of AI agents specifically a shopping agent for intelligent customer engagement, an onboarding agent to reduce friction between banks and merchants, and a dispute agent to streamline consumer resolutions while simultaneously slating the UK for the 2027 debut of its "Virtual CFO" platform tailored for small-and-medium enterprises;
During the week, JPMorgan issued a research note warning that stablecoin issuer Circle and cryptocurrency exchange Coinbase face mounting pressure on their underlying business models due to a newly revised partnership agreement with exchange platform Hyperliquid. The new arrangement alters how interest income generated by the cash and Treasury reserves backing USD Coin (USDC) is shared, forcing Circle to cede a larger portion of its core revenue to distribution partners like Hyperliquid and Coinbase to maintain its competitive market share;
The digital payment stocks we track (AXP, Visa, Mastercard, Circle, Block and PayPal) are currently trading at an average P/E of 19.6x, implying that investors are pricing in strong future earnings growth expectations and are willing to pay a significant premium for current earnings, which may also suggest that valuations may be stretched relative to near-term fundamentals;
FOTW: Rise of Satellite Towns in Nairobi Metropolitan Area
This week, we shift our focus to the rising satellite towns within the Nairobi Metropolitan areas and the opportunities they present to investors. The rapid expansion of Nairobi over the past two decades has fundamentally transformed the spatial structure of the Nairobi Metropolitan Area (NMA), leading to the emergence and accelerated growth of satellite towns surrounding the capital city. Driven by rapid urbanization, population growth, infrastructure development, and the rising cost of land and housing within Nairobi's core, these towns have evolved from predominantly rural settlements into vibrant residential, commercial, and industrial centres. Today, satellite towns play a critical role in accommodating Nairobi's growing population, supporting economic decentralization, and providing relatively affordable housing alternatives to households and businesses that are increasingly priced out of the city.
Investment Updates:
- Weekly Rates: Cytonn Money Market Fund closed the week at a yield of 11.69% p.a. To invest, dial *809# or download the Cytonn App from Google Play store here or from the Appstore here;
- We continue to offer Wealth Management Training every Tuesday, from 7:00 pm to 8:00 pm. The training aims to grow financial literacy among the general public. To register for any of our Wealth Management Trainings, click here. If interested in our Private Wealth Management Training for your employees or investment group, please get in touch with us through wmt@cytonn.com;
- Cytonn Insurance Agency acts as an intermediary for those looking to secure their assets and loved ones’ future through insurance namely; Motor, Medical, Life, Property, WIBA, Credit and Fire and Burglary insurance covers. For assistance, get in touch with us through insuranceagency@cytonn.com;
- Cytonn Asset Managers Limited (CAML) continues to offer pension products to meet the needs of both individual clients who want to save for their retirement during their working years and Institutional clients that want to contribute on behalf of their employees to help them build their retirement pot. To more about our pension schemes, kindly get in touch with us through pensions@cytonn.com;
Hospitality Updates:
- We currently have promotions for Staycations. Visit cysuites.com/offers for details or email us at sales@cysuites.com;
Money Markets, T-Bills Primary Auction:
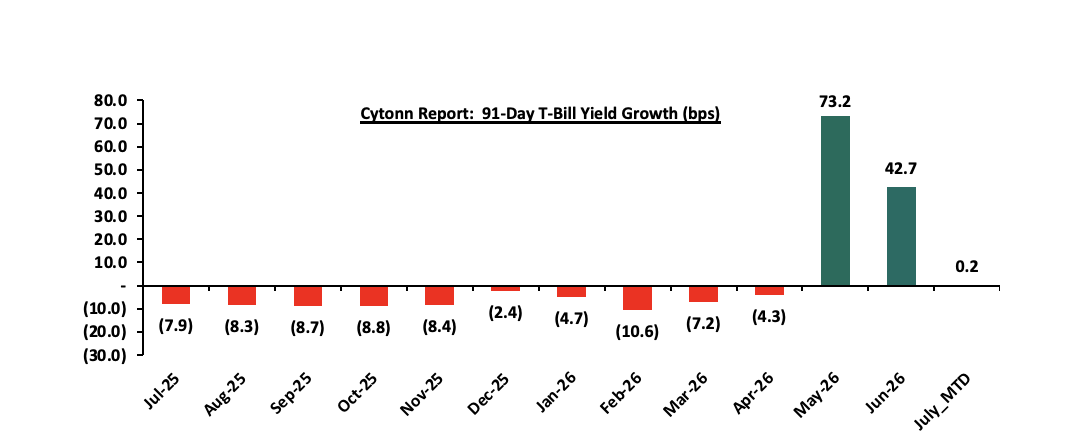
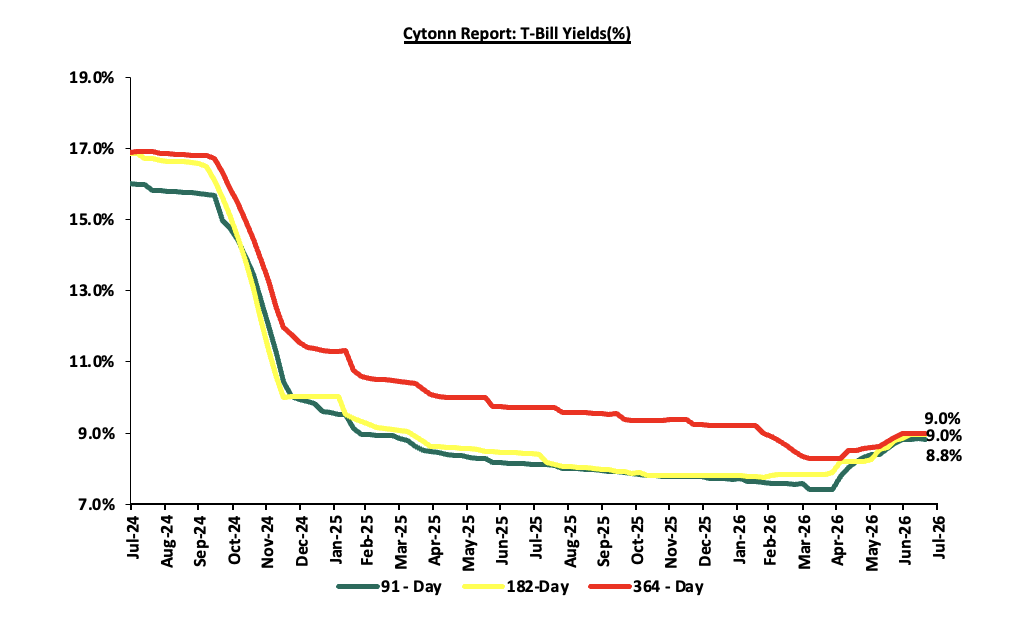
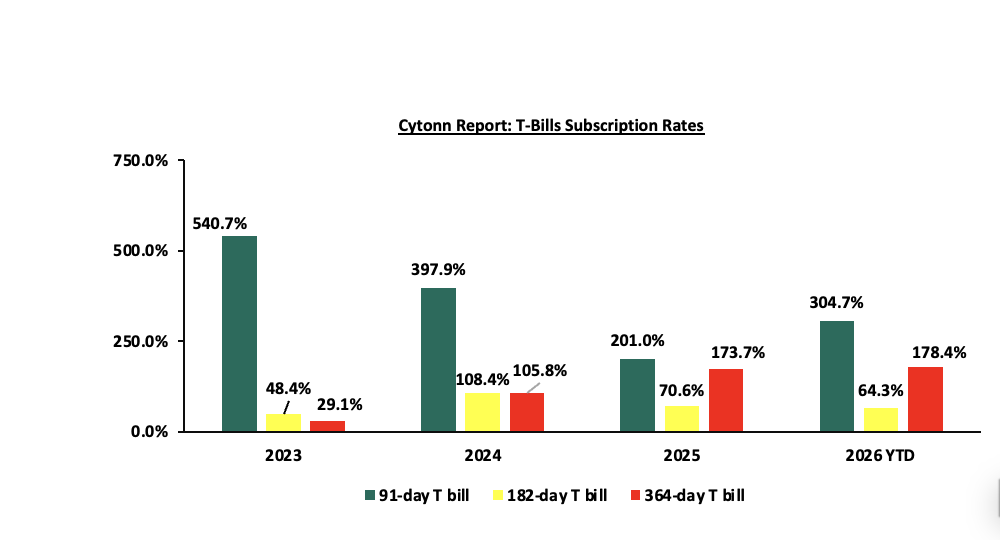
This week, T-bills were oversubscribed for the seventh consecutive week, with the overall subscription rate coming in at 157.2% albeit lower than the subscription rate of 177.6%, recorded the previous week. Investors’ preference for the shorter 91-day paper persisted, with the paper receiving bids worth 24.4 bn against the offered Kshs 8.0 bn, translating to a subscription rate of 304.4%, lower than the the subscription rate of 435.0% recorded the previous week. The subscription rate for the 364-day paper decreased to 45.1% from 60.4%recorded the previous week, while that of the 182-day paper increased to 151.5% from 88.8% recorded the previous week. The government accepted a total of Kshs 30.6 bn worth of bids out of Kshs 44.0 bn bids received, translating to an acceptance rate of 69.6%. The yields on the government papers showed a mixed performance with the yields on the 364-day paper increasing the most by 4.9 bps to 9.04% from 8.99% recorded the previous week. The yield on the 91-day paper decreased by 2.6 bps to 8.80% from 8.83% recorded the previous week, while the yield on the 182-day paper decreased by 0.2 bps to remain relatively unchanged at 8.97% compared to the previous week. The chart below shows the yield growth rate for the 91-day paper from July 2025 to date:
The chart below shows the performance of the 91-day, 182-day and 364-day papers from July 2024 to July 2026:
The chart below compares the overall average T-bill subscription rates obtained in 2023, 2024, 2025 and 2026 Year-to-date (YTD):
T-Bonds Primary Auction:
The Central Bank of Kenya released the auction results for the switch of treasury bonds from FXD1/2021/005, with a tenor to maturity of 0.6 years and a fixed coupon rate of 11.3%, to FXD1/2012/020, a with a tenor to maturity of 6.3 years and a fixed coupon rate of 12.0%. This marks the fifth bond switch, following the switches to IFB1/2022/06, IFB1/2020/06, FXD1/2022/015 and FXD3/2019/015 in December 2022, June 2020, January 2026 and March 2026 respectively. The bond was undersubscribed, with the overall subscription rate coming in at 81.6%, receiving bids worth Kshs 8.2 bn against the offered Kshs 10.0 bn. The government accepted bids worth Kshs 8.0 bn, translating to an acceptance rate of 97.5%. The weighted average yield for the accepted bids for the FXD1/2012/020 came in at 12.8%. Notably, the 12.8% on the switch to FXD1/2012/020 was slightly higher than the 12.5% recorded the last time the bond was reopened in May 2026. With the Inflation rate at 6.4% as of June 2026, the real return of the FXD1/2012/020 was 6.4%. Given the 10.0% withholding tax on the bonds, the tax equivalent yields for shorter term bonds with 15.0% withholding tax is 12.7% for the FXD1/2012/020.
The government is also looking to raise Kshs 40.0 bn through the reopened twenty years and twenty- five years fixed coupon bonds FXD1/2019/020 and FXD1/2022/025 with fixed coupon rates of 12.9% and 14.2% respectively and tenors to maturity of 12.8 years and 21.4 years respectively. The period of sale for the two bonds opened on Tuesday 14th July 2026 and will close on Wednesday 22nd July 2026. Our bidding ranges for the reopened bonds FXD1/2019/020 and FXD1/2022/025 is 12.90%-13.30% and 13.80% - 14.20% respectively.
Money Market Performance:
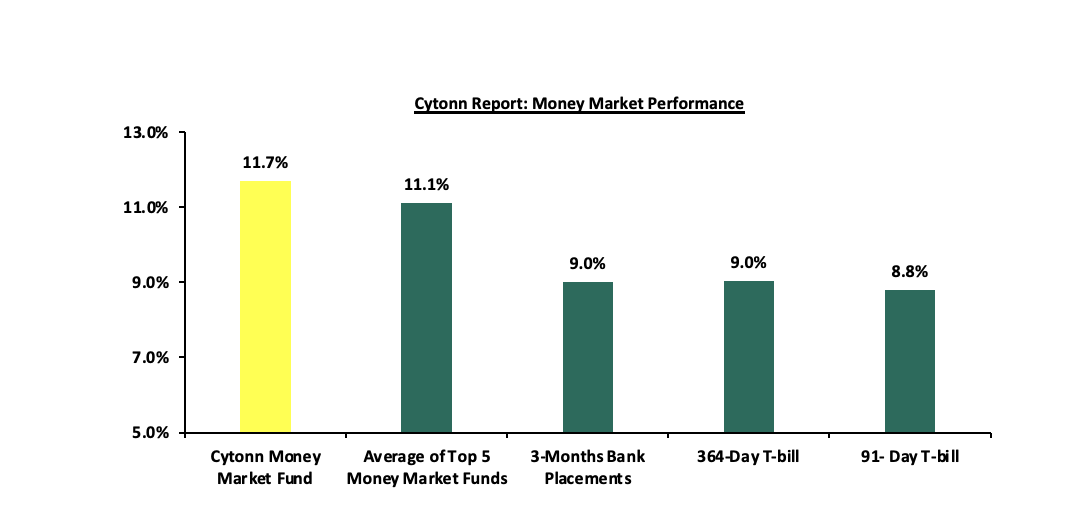
In the money markets, 3-month bank placements ended the week at 9.0% (based on rates offered by various banks). The yield on the 91-day paper decreased by 2.6 bps to remain relatively unchanged from the 8.8% recorded the previous week, while the yield on the 364-day paper increased by 4.9 bps to remain relatively unchanged from 9.0% recorded the previous week. The yield on the Cytonn Money Market Fund remained relatively unchanged from the 11.7% recorded the previous week, while the average yields on the Top 5 Money Market Funds decreased by 32.2 bps to 11.1% from 11.4% recorded the previous week.
The table below shows the Money Market Fund Yields for Kenyan Fund Managers as published on 17th July 2026:
|
Money Market Fund Yield for Fund Managers as published on 17th July 2026 |
||
|
Rank |
Fund Manager |
Effective Annual Rate |
|
1 |
Nabo Africa Money Market Fund |
12.3% |
|
2 |
Cytonn Money Market Fund (Dial *809# or download Cytonn App) |
11.7% |
|
3 |
Lofty-Corban Money Market Fund |
10.6% |
|
4 |
Enwealth Money Market Fund |
10.5% |
|
5 |
Ndovu Money Market Fund |
10.5% |
|
6 |
Kuza Money Market fund |
10.5% |
|
7 |
Madison Money Market Fund |
10.5% |
|
8 |
Etica Money Market Fund |
10.4% |
|
9 |
Faulu Money Market Fund |
10.3% |
|
10 |
Jubilee Money Market Fund |
10.2% |
|
11 |
Old Mutual Money Market Fund |
10.2% |
|
12 |
Gulfcap Money Market Fund |
10.1% |
|
13 |
Orient Kasha Money Market Fund |
10.1% |
|
14 |
British-American Money Market Fund |
10.0% |
|
15 |
Arvocap Money Market Fund |
9.8% |
|
16 |
GenAfrica Money Market Fund |
9.4% |
|
17 |
KCB Money Market Fund |
9.2% |
|
18 |
Apollo Money Market Fund |
9.2% |
|
19 |
SanlamAllianz Money Market Fund |
9.1% |
|
20 |
Dry Associates Money Market Fund |
8.9% |
|
21 |
Genghis Money Market Fund |
8.5% |
|
22 |
CIC Money Market Fund |
8.4% |
|
23 |
CPF Money Market Fund |
8.3% |
|
24 |
Co-op Money Market Fund |
8.0% |
|
25 |
ICEA Lion Money Market Fund |
8.0% |
|
26 |
Mali Money Market Fund |
8.0% |
|
27 |
Mayfair Money Market Fund |
7.9% |
|
28 |
Absa Shilling Money Market Fund |
7.2% |
|
29 |
AA Kenya Shillings Fund |
6.3% |
|
30 |
Ziidi Money Market Fund |
6.0% |
|
31 |
Stanbic Money Market Fund |
5.2% |
|
32 |
Equity Money Market Fund |
|
Source: Business Daily
Liquidity:
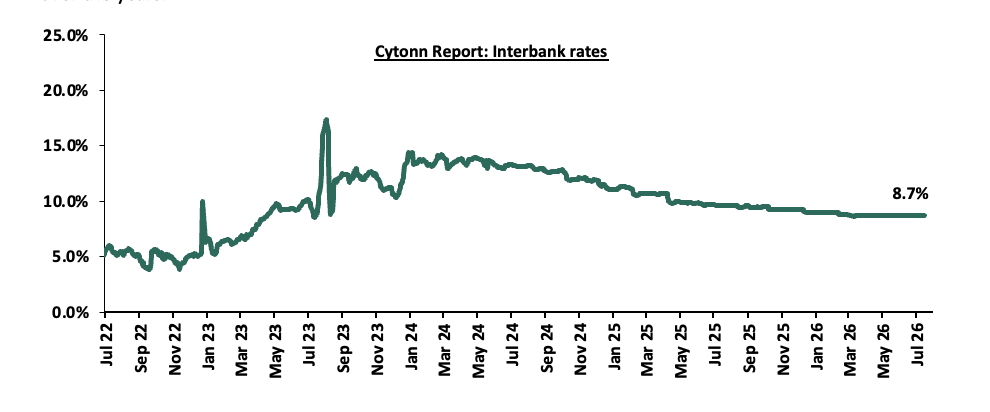
During the week, liquidity in the money markets eased with the average interbank rate decreasing marginally by 0.1 bps to 8.7% from 8.8% recorded last week, partly attributable to tax remittances that offset government payments. The average interbank volumes traded increased by 78.9% to Kshs 7.6 bn from Kshs 4.2 bn recorded the previous week. The chart below shows the interbank rates in the market over the years:
Kenya Eurobonds:
During the week, the yields on the Eurobonds were on an upward trajectory with the yield on the 11-year Eurobond issued in 2025, increasing the most by 26.3 bps to 7.6% from 7.4% recorded the previous week. The table below shows the summary performance of the Kenyan Eurobonds as of 16th July 2026
|
Cytonn Report: Kenya Eurobonds Performance |
||||||
|
|
2018 |
2019 |
2021 |
2024 |
||
|
Tenor |
10-year issue |
30-year issue |
12-year issue |
13-year issue |
7-year issue |
|
|
Amount Issued (USD) |
1.0 bn |
1.0 bn |
1.0 bn |
1.5 bn |
1.5 bn |
|
|
Years to Maturity |
2.5 |
22.5 |
8.8 |
5.5 |
10.5 |
|
|
Yields at Issue |
7.3% |
8.3% |
6.2% |
10.4% |
9.9% |
|
|
2-Jan-26 |
6.1% |
8.8% |
7.2% |
7.8% |
7.1% |
|
|
2-Jul-26 |
6.8% |
8.8% |
7.6% |
8.0% |
7.1% |
|
|
9-Jul-26 |
6.7% |
8.8% |
7.7% |
8.1% |
7.4% |
|
|
10-Jul-26 |
6.8% |
8.8% |
7.7% |
8.1% |
7.3% |
|
|
13-Jul-26 |
6.9% |
8.9% |
7.8% |
8.3% |
7.5% |
|
|
14-Jul-26 |
6.9% |
8.9% |
7.9% |
8.3% |
7.5% |
|
|
15-Jul-26 |
6.9% |
8.9% |
7.9% |
8.3% |
7.5% |
|
|
16-Jul-26 |
7.0% |
8.9% |
7.9% |
8.3% |
7.6% |
|
|
Weekly Change |
0.2% |
0.2% |
0.2% |
0.2% |
0.3% |
|
|
MTD Change |
0.2% |
0.2% |
0.3% |
0.3% |
0.5% |
|
|
YTD Change |
0.9% |
0.1% |
0.7% |
0.5% |
0.5% |
|
Source: Central Bank of Kenya (CBK) and National Treasury
Kenya Shilling:
During the week, the Kenya Shilling depreciated against the US Dollar by 8.5 bps to Kshs 129.3 from Kshs 129.2 recorded the previous week. On a year-to-date basis, the shilling has depreciated by 19.4 bps against the dollar, as compared to the 22.9 bps appreciation recorded in 2025.
We expect the shilling to be supported by:
-
Diaspora remittances standing at a cumulative USD 4,960.4 mn in the twelve months to June 2026, slightly lower than the USD 5,084.1 mn recorded over the same period in 2025. These have continued to cushion the shilling against further depreciation. In the June 2026 diaspora remittances figures, North America remained the largest source of remittances to Kenya accounting for 50.8% in the period,
-
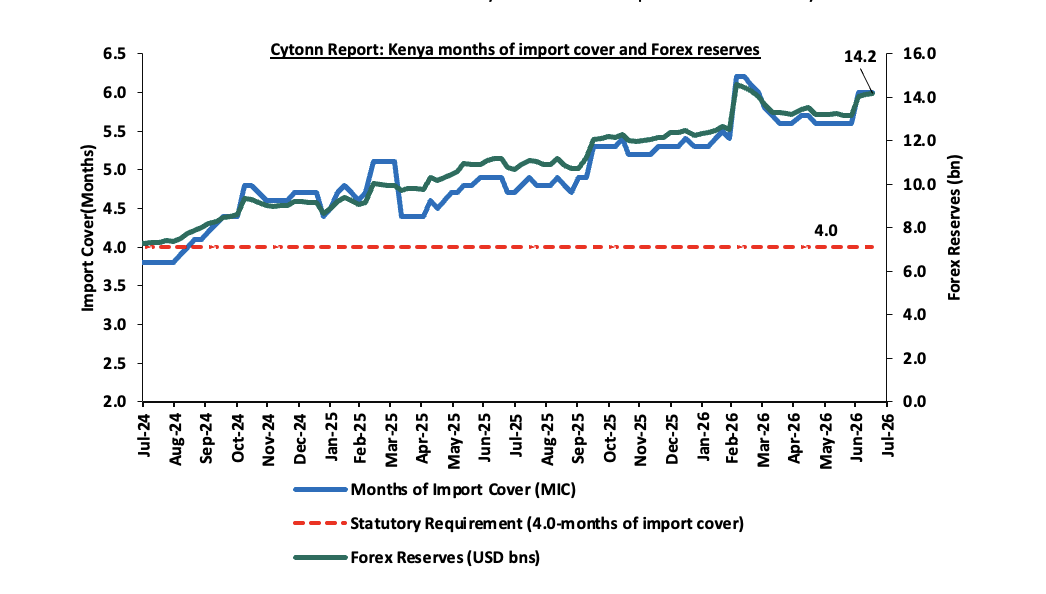
Improved forex reserves currently at USD 14.2 bn (equivalent to 6.0-months of import cover), which is above the statutory requirement of maintaining at least 4.0-months of import cover and above the EAC region’s convergence criteria of 4.5-months of import cover.
The shilling is however expected to remain under pressure in 2026 as a result of:
-
An ever-present current account deficit which is estimated at 2.6% of GDP in the 12 months to April 2026 compared to 1.7 percent of GDP in a similar period in 2025 and,
-
The need for government debt servicing, continues to put pressure on forex reserves given that 53.0% of Kenya’s external debt is US Dollar-denominated as of December 2025
Kenya’s forex reserves increased by 0.30% during the week to USD 14.2 bn from USD 14.1 bn recorded the previous week, equivalent to 6.0 months of import cover, and above the statutory requirement of maintaining at least 4.0-months of import cover.
The chart below summarizes the evolution of Kenya's months of import cover over the years:
Weekly Highlights
-
Fuel Prices effective 15th July – 14th August 2026
During the week, The Energy and Petroleum Regulatory Authority (EPRA) released their monthly statement on the maximum retail fuel prices in Kenya, effective from 15th July 2026 to 14th August 2026. Notably, the maximum allowed prices for Super Petrol, Diesel and Kerosene remain unchanged at Kshs 214.0, Kshs 222.9 and Kshs 191.4 respectively recorded last month.
Other key take-outs from the performance include,
-
The average landing cost per cubic metre of Diesel, Kerosene and Super Petrol decreased by 24.0%, 22.6% and 1.6% to USD 984.4, USD 1028.2 and USD 886.9 in June 2026 from USD 1,294.7, USD 1328.4 and USD 901.2 in May 2026.
-
The Kenyan Shilling appreciated against the US Dollar by 7.7 bps to Kshs 129.7 in June from 129.8 recorded in May 2026.
-
The Authority calculated the prices based on 8.0% Value Added Tax (VAT) on petroleum products, extending the tax relief for an additional three months to cushion consumers from elevated global oil prices. In addition, it has utilized Kshs 945.0 mn from the Petroleum Development Levy (PDL) to keep retail fuel prices stable.
-
The international petroleum prices per cubic metre of Diesel, Kerosene and Super Petrol decreased by 19.8%, 18.3% and 15.8% to USD 889.6, USD 951.5 and USD 948.7 in June 2026 from USD 1108.6, USD 1,164.1 and USD 1127.1 in May 2026.
We note that while fuel prices have seen a mild downward adjustment in the June 2026 cycle. The government continues intervention through the price stabilization mechanism, with the government utilizing approximately Kshs 945.0 mn of the Petroleum Development Levy (PDL) Fund to stabilize the prices and a stable Kenyan Shilling have prevented even steeper increases. Without these efforts, the record surges in landing costs for Kerosene, Diesel and Super Petrol, would have dealt a far more severe blow to the economy.
Going forward, the outlook for fuel prices remains cautious. While the government's stabilization framework provides a cushion, persistent geopolitical tensions in the Middle East suggest that global oil prices may remain volatile. Given Diesel's role as a key input in production and transportation, the recent stability in diesel prices is expected to ease cost push pressures across sectors, particularly in manufacturing, agriculture, and logistics, by lowering transportation and operational costs. However, diesel prices remain relatively high at Kshs 222.9 per litre, suggesting that the relief to businesses and consumers may be gradual rather than immediate. Additionally, with inflation at 6.4%, close to the upper limit of the Central Bank of Kenya's target range of 2.5% to 7.5%, the inflation outlook remains sensitive to prevailing fuel costs, exchange rate movements, and food price dynamics. Consequently, while the stability in diesel prices may help moderate inflationary pressures, maintaining inflation within the target range could prove increasingly challenging in the near term.
-
Exchequer Highlight June 2026
The National Treasury gazetted the revenue and net expenditures for the twelfth month of FY’2025/2026, ending 30th June 2026, highlighting that the total revenue collected as at the end of June 2026 amounted to Kshs 2,607.3 bn, equivalent to 98.7% of the revised estimates of Kshs 2,640.6 bn for FY’2025/2026 and is 98.7% of the prorated estimates of Kshs 2,640.6 bn. Below is a summary of the performance:
|
Cytonn Report:FY'2025/2026 Budget Outturn - As at 30th June 2026 |
||||||
|
Amounts in Kshs billions unless stated otherwise |
||||||
|
Item |
12-months Original Estimates |
Revised Estimates |
Actual Receipts/Release |
Percentage Achieved |
Prorated |
% achieved of the Prorated |
|
Opening Balance |
6.4 |
|||||
|
Tax Revenue |
2,627.1 |
2,457.4 |
2,450.5 |
99.7% |
2,457.4 |
99.7% |
|
Non-Tax Revenue |
127.6 |
183.2 |
150.3 |
82.0% |
183.2 |
82.0% |
|
Total Revenue |
2,754.7 |
2,640.6 |
2,607.3 |
98.7% |
2,640.6 |
98.7% |
|
External Loans & Grants |
569.8 |
831.0 |
697.5 |
83.9% |
831.0 |
83.9% |
|
Domestic Borrowings |
1,098.3 |
1,440.5 |
1,297.6 |
90.1% |
1,440.5 |
90.1% |
|
Other Domestic Financing |
10.8 |
10.8 |
8.7 |
80.4% |
10.8 |
80.4% |
|
Total Financing |
1,678.9 |
2,282.2 |
2,003.8 |
87.8% |
2,282.2 |
87.8% |
|
Recurrent Exchequer issues |
1,470.4 |
1,684.3 |
1,673.5 |
99.4% |
1,684.3 |
99.4% |
|
CFS Exchequer Issues |
2,141.0 |
2,336.1 |
2,036.2 |
87.2% |
2,336.1 |
87.2% |
|
Development Expenditure & Net Lending |
407.1 |
487.5 |
457.2 |
93.8% |
487.5 |
93.8% |
|
County Governments + Contingencies |
415.0 |
415.0 |
415.0 |
100.0% |
415.0 |
100.0% |
|
Total Expenditure |
4,433.6 |
4,922.9 |
4,581.9 |
103.3% |
93.1% |
|
|
Fiscal Deficit excluding Grants |
1,678.9 |
2,282.2 |
1,974.6 |
86.5% |
2,282.2 |
86.5% |
|
Total Borrowing |
1,668.1 |
2,271.4 |
1,995.1 |
87.8% |
2,271.4 |
87.8% |
The key take-outs from the release include;
-
Total revenue collected as at the end of June 2026 amounted to Kshs 2,607.3 bn, equivalent to 98.7% of the revised estimates of Kshs 2,640.6 bn for FY’2025/2026 and is 98.7% of the prorated estimates of Kshs 2,640.6 bn. Cumulatively, tax revenues amounted to Kshs 2,450.5 bn, equivalent to 99.7% of the revised estimates of Kshs 2,457.4 bn and 99.7% of the prorated estimates of Kshs 2,457.4 bn,
-
Total financing amounted to Kshs 2,003.8 bn, equivalent to 87.8% of the revised estimates of Kshs 2,282.2 bn and is equivalent to 87.8% of the prorated estimates of Kshs 2,282.2 bn. Additionally, domestic borrowing amounted to Kshs 1,297.6 bn, equivalent to 90.1% of the revised estimates of Kshs 1,440.5 bn and is 90.1% of the prorated estimates of Kshs 1,440.5 bn.
-
The total expenditure amounted to Kshs 4,581.9 bn, equivalent to 103.3% of the revised estimates of Kshs 4,922.9 bn, and is 93.1% of the prorated target expenditure estimates of Kshs 4,922.9 bn. Additionally, the net disbursements to recurrent expenditures came in at Kshs 1,673.5 bn, equivalent to 99.4% of the revised estimates of Kshs 1,684.3 bn and are equivalent to 99.4% of the prorated estimates of Kshs 1,684.3 bn,
-
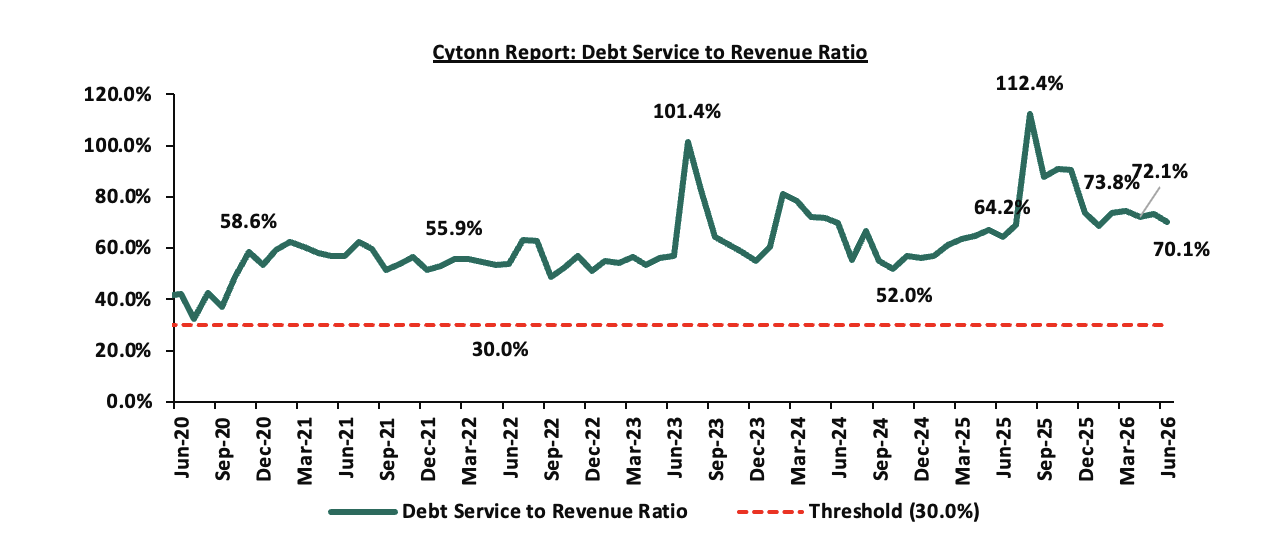
Consolidated Fund Services (CFS) Exchequer issues came in at Kshs 2,036.2 bn, equivalent to 87.2% of the revised estimates of Kshs 2,336.1 bn, and are 87.2% of the prorated amount of Kshs 2,336.1 bn. The cumulative public debt servicing cost amounted to Kshs 1,826.5 bn which is 87.1% of the revised estimates of Kshs 2,096.1 bn and is 87.1% of the prorated estimates of Kshs 2,096.1 bn. Additionally, the Kshs 1,826.5 bn debt servicing cost is equivalent to 70.1% of the actual cumulative revenues collected as at the end of June 2026. The chart below shows the debt servicing cost to revenue ratio over the period;
-
Total borrowings as at the end of June 2026 amounted to Kshs 1,995.1 bn, equivalent to 87.8% of the revised estimates of Kshs 2,271.4 bn for FY’2025/2026 and are 87.8% of the prorated estimates of Kshs 2,271.4 bn. The cumulative domestic borrowing of Kshs 1,440.5 bn comprises of Net Domestic Borrowing Kshs 994.8 bn and Internal Debt Redemptions (Rollovers) Kshs 445.7 bn.
The government underachieved its prorated revenue targets for the twelfth month of the FY’2025/2026, achieving 98.7% of the prorated revenue targets in June 2026, higher than 91.1% achieved in May 2026. This was driven by shortfall in tax revenues and non-tax revenues, which stood at 99.7% and 82.0% of prorated levels respectively, with collections amounting to Kshs 2,450.5 bn in tax revenue and Kshs 150.3 bn in non-tax revenue. External loans and grants were behind target at 83.9%, reducing reliance on domestic borrowing, which came in at 90.1% of the prorated target of Kshs 1,440.5 bn. The business environment showed signs of expansion, with the Purchasing Managers’ Index (PMI) standing at 50.0 in June 2026 from 46.6 in May 2026, being at par with the 50.0 neutral mark and signaling a cautious recovery of business activity. Expenditure absorption stood at 93.1% of prorated levels, with development spending at 93.8%, reflecting slow implementation of capital projects. Future revenue performance will depend on how quickly private sector activity strengthens, supported by a stable Shilling, easing credit conditions following the decision to maintain the Central Bank Rate at 8.75% in June 2026, and continued efforts to broaden the tax base, curb evasion, and stimulate economic growth. However, the outlook remains vulnerable to external shocks, particularly the ongoing Iran-Israel conflict, which has heightened global oil price volatility and supply chain disruptions, posing upside risks to inflation and production costs, and potentially constraining private sector expansion and revenue mobilization.
Rates in the fixed income market have been on an upward trend, reversing the sharp declines seen through the CBK's easing cycle. The shift has been driven by the CBK's decision to pause its rate-cutting cycle, alongside a resurgence in inflation. The government is 62.7% ahead of its prorated net domestic borrowing target of Kshs 53.8 bn, having a net borrowing position of Kshs 87.5 bn (inclusive of T-bills). We expect investors to maintain a preference for short to medium-term papers as they monitor the pace of government issuance and the path of inflation before committing further out on the curve, with the yield curve likely to remain under upward pressure rather than stabilize, at least until the inflation trajectory becomes clearer.
During the week, the equities market was on an upward trajectory, with NSE 20, NASI, NSE 25 and NSE 10 gaining by 3.0%, 1.1%, 0.9% and 0.4% respectively, taking the YTD performance to gains of 26.0%, 25.5%, 25.4% and 23.6% for NSE 20, NSE 10, NSE 25 and NASI respectively. The week-on-week equities market performance was mainly driven by gains recorded by large cap stocks such as EABL, SCBK and ABSA of 5.1%, 0.7% and 0.3% respectively. However, the performance was weighed down by losses recorded by large cap stocks such as NCBA, Stanbic and Safaricom of 2.0%, 1.4% and 1.3% respectively.
During the week, the banking sector index increased marginally by 1.0% to 264.2 from the 261.5 recorded the previous week. This is attributable to gains recorded by large cap stocks such as SCBK and ABSA of 0.7% and 0.3% respectively. However, the performance was weighed down by losses recorded by large cap stocks such NCBA, Stanbic and Cooperative Bank of 2.0%, 1.4% and 1.0% respectively.
During the week, equities turnover decreased by 35.7% to USD 18.6 mn from USD 28.9 mn recorded the previous week, taking the YTD total turnover to USD 2550.4 mn. Foreign investors became net sellers for the first time in two weeks with a net selling position of USD 2.3 mn, from a net buying position of USD 0.5 mn recorded the previous week, taking the YTD foreign net selling position to USD 78.2 mn, compared to a net selling position of USD 92.9 mn recorded in 2025.
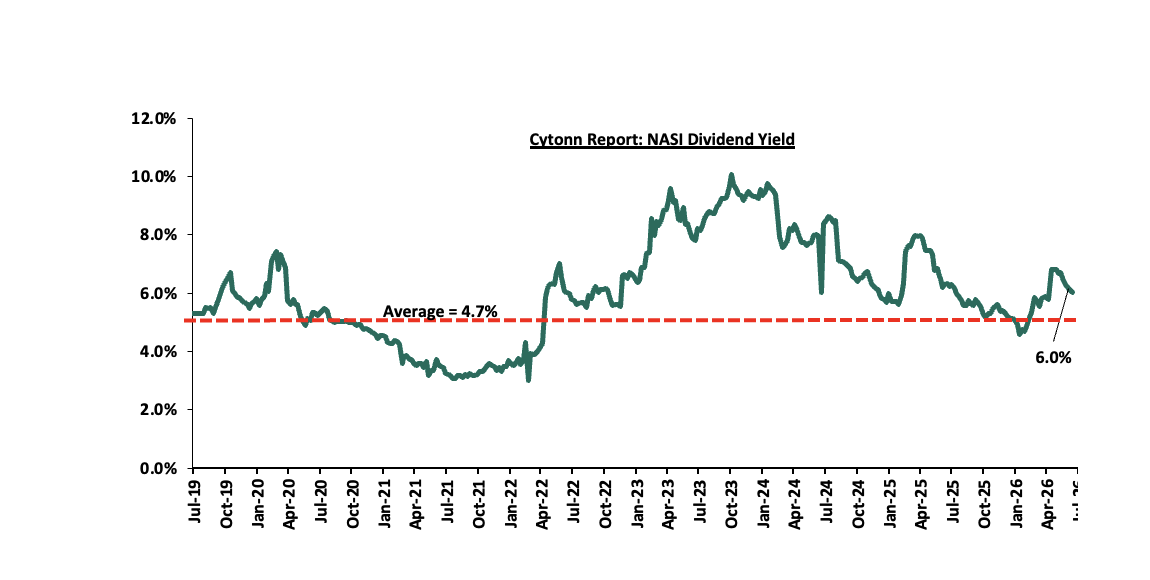
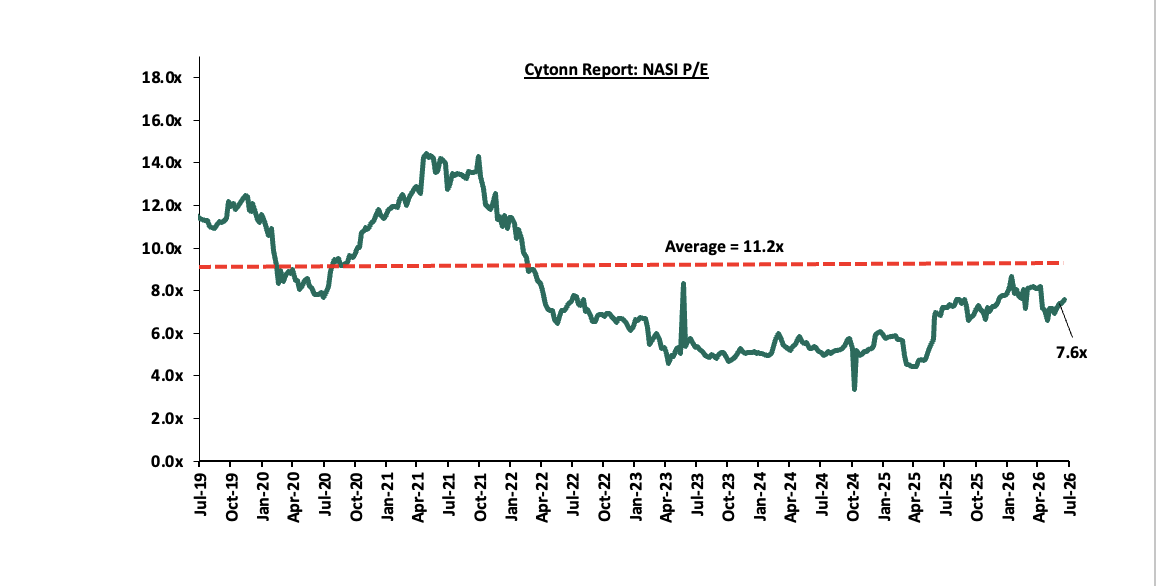
The market is currently trading at a price to earnings ratio (P/E) of 7.6x, 32.6% below the historical average of 11.2x, and a dividend yield of 6.0%, 1.3% points above the historical average of 4.7%. Key to note, NASI’s PEG ratio currently stands at 0.9x, an indication that the market is slightly undervalued relative to its future growth. A PEG ratio greater than 1.0x indicates the market may be overvalued while a PEG ratio less than 1.0x indicates that the market is undervalued. The charts below indicate the historical P/E and dividend yields of the market:
Universe of Coverage:
|
Cytonn Report: Equities Universe of Coverage |
|||||||||||
|
Company |
Price as at 10/07/2026 |
Price as at 17/07/2027 |
w/w change |
m/m change |
YTD Change |
Year Open 2026 |
Target Price* |
Dividend Yield |
Upside/ Downside** |
P/TBv Multiple |
Recommendation |
|
NCBA |
87.0 |
88.8 |
2.0% |
(0.8%) |
4.4% |
85.0 |
108.9 |
8.0% |
30.8% |
1.2x |
Buy |
|
ABSA Bank |
33.5 |
33.4 |
(0.3%) |
4.1% |
34.2% |
18.0 |
36.8 |
6.1% |
16.6% |
1.8x |
Accumulate |
|
Diamond Trust Bank |
145.3 |
146.3 |
0.7% |
0.9% |
27.5% |
114.8 |
161.4 |
6.2% |
16.5% |
0.4x |
Accumulate |
|
Family Bank |
24.3 |
25.0 |
2.9% |
3.3% |
38.9% |
24.9 |
27.6 |
4.8% |
15.2% |
1.3x |
Accumulate |
|
KCB Group |
80.0 |
80.8 |
0.9% |
2.5% |
22.8% |
65.8 |
83.9 |
8.7% |
12.6% |
0.8x |
Accumulate |
|
Co-op Bank |
34.9 |
35.3 |
1.0% |
2.8% |
47.5% |
4.5 |
36.9 |
7.1% |
11.8% |
1.3x |
Accumulate |
|
Standard Chartered Bank |
339.3 |
337.0 |
(0.7%) |
2.8% |
12.4% |
23.9 |
345.8 |
9.2% |
11.8% |
2.1x |
Accumulate |
|
CIC Group |
4.5 |
4.6 |
2.0% |
0.7% |
0.7% |
299.8 |
5.0 |
2.8% |
11.4% |
1.2x |
Accumulate |
|
Jubilee Holdings |
381.3 |
380.5 |
(0.2%) |
5.5% |
18.0% |
322.5 |
407.5 |
3.9% |
11.0% |
0.5x |
Accumulate |
|
Stanbic Holdings |
291.5 |
295.5 |
1.4% |
5.4% |
49.4% |
197.8 |
300.3 |
7.6% |
9.2% |
1.7x |
Hold |
|
Equity Group |
86.0 |
86.5 |
0.6% |
8.1% |
29.1% |
42.8 |
87.5 |
6.6% |
7.8% |
1.1x |
Hold |
|
I&M Group |
65.5 |
68.0 |
3.8% |
(2.2%) |
58.9% |
67.0 |
67.9 |
5.5% |
5.4% |
1.1x |
Hold |
|
Britam |
14.6 |
18.4 |
26.1% |
46.2% |
102.5% |
9.1 |
18.5 |
0.0% |
0.5% |
1.4x |
Lighten |
|
*Target Price as per Cytonn Analyst estimates **Upside/ (Downside) is adjusted for Dividend Yield ***Dividend Yield is calculated using FY’2025 Dividends |
|||||||||||
We maintain a “cautiously optimistic” short-term outlook supported primarily by earnings-led attractive valuations, despite rising yields on short-term government papers, which increase competition for capital by drawing investors towards risk-free government securities, as well as heightened geopolitical risks such as Iran war that may weigh on investor sentiment, and, “neutral” in the long term as persistent foreign investor outflows continue to constrain market liquidity and limit broad-based market re-rating. With the market currently trading at a discount to its future growth (PEG Ratio at 0.9x), where performance will be driven by company-specific fundamentals rather than general market direction, we believe that investors should reposition towards value stocks exhibiting strong earnings growth, attractive dividend yields, solid balance sheets, sustainable competitive advantages and trading at compelling discounts to their intrinsic value. While foreign investor sell-offs are expected to continue exerting pressure in the near term, we believe this will create selective entry opportunities for long-term investors.
-
Industry Report
-
KNBS’ Q1’2026 Kenya Residential Property Price Index (RPPI) Report
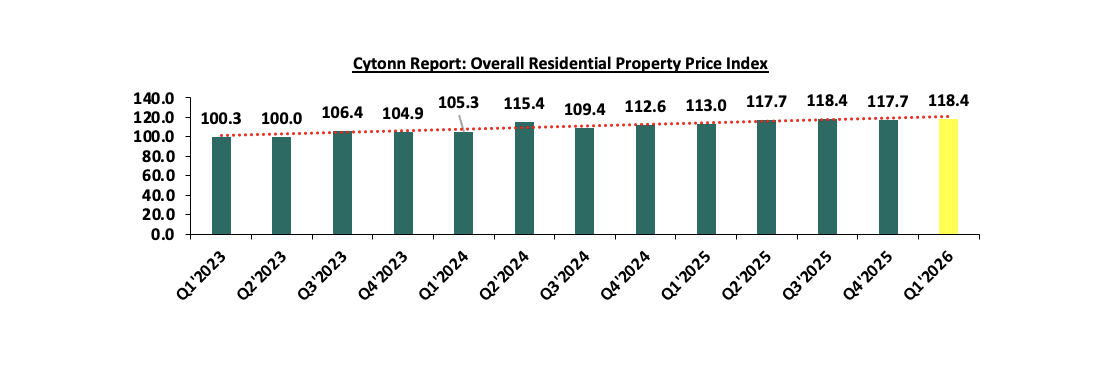
According to KNBS’ Q1’2026 Kenya Residential Property Price Index (RPPI) overall Residential Property Price Index (RPPI) increased by 4.8% to 118.4 in Q1'2026 from 113.0 in Q1'2025. On a quarter-on-quarter basis, the index increased marginally by 0.6% from 117.7 in Q4'2025.
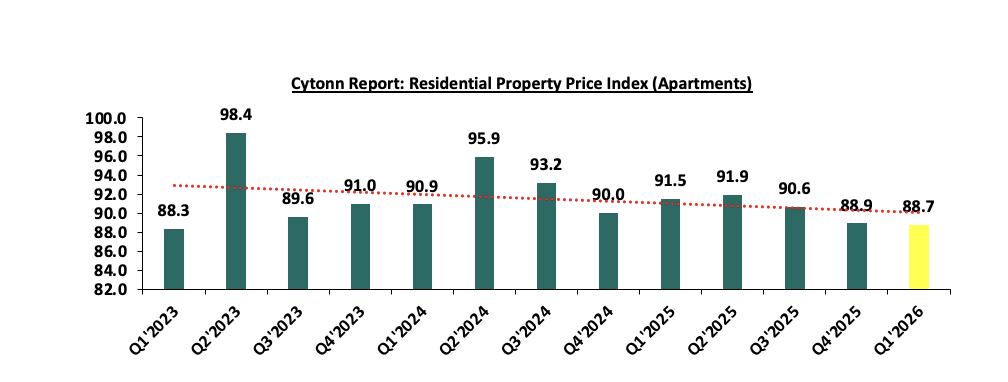
The Residential Property Price Index for apartments decreased by 3.0% to 88.7 in Q1'2026 from 91.5 in Q1'2025. On a quarter-on-quarter basis, the index decreased marginally by 0.2% from 88.9 in Q4'2025. The continued decline reflects persistent supply-demand imbalances within the apartment market, particularly in Nairobi's upper- and middle-income suburbs, where prices remained under pressure. However, apartment prices in Nairobi's peri-urban areas and other regions registered gains, indicating relatively stronger demand outside the traditional urban apartment market. Overall, the apartment segment continues to lag the broader residential market, reflecting slower absorption of existing supply amid subdued investor and owner-occupier demand.
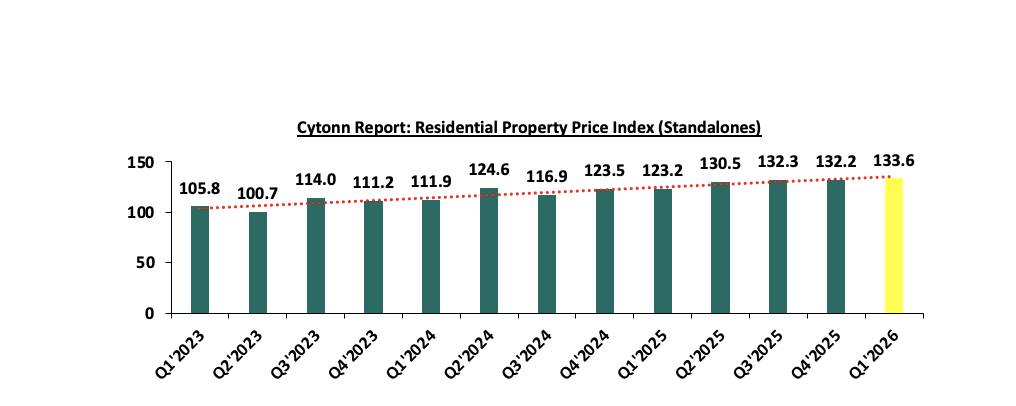
The Residential Property Price Index for standalone houses increased by 8.5% to 133.6 in Q1'2026 from 123.2 in Q1'2025. On a quarter-on-quarter basis, the index decreased marginally by 1.0% from 132.2 in Q4'2025. The sustained growth reflects resilient demand for standalone housing, supported by continued preference for lower-density developments and expanding suburban residential markets. Notably, all standalone housing strata recorded annual price appreciation, highlighting broad-based strength across the segment. The continued outperformance of standalone houses relative to apartments underscores an increasingly segmented residential market, with buyers and investors exhibiting stronger preference for standalone developments.
The Q1'2026 RPPI data points to an increasingly segmented residential property market, with standalone houses continuing to outperform apartments. While the overall residential market remained resilient, the contrasting performance across the two segments suggests that demand continues to favour lower-density housing developments, whereas the apartment market remains constrained by oversupply in selected urban markets and relatively subdued purchasing activity. Going forward, we expect standalone housing to remain the primary driver of residential price growth, supported by continued suburbanization, infrastructure development and sustained end-user demand. Conversely, recovery in the apartment segment is likely to remain gradual until existing supply is absorbed and financing conditions become more accommodative.
-
Real Estate Investments Trusts
-
REITs Weekly Performance
On the Unquoted Securities Platform Acorn D-REIT and I-REIT traded at Kshs 29.6 and Kshs 23.8 per unit, respectively, as per the last updated data on 3rd July 2026. The performance represented a 48.0% and 18.8% gain for the D-REIT and I-REIT, respectively, from the Kshs 20.0 inception price. The volumes traded for the D-REIT and I-REIT came in at 13.5 mn and 43.3 mn shares, respectively. Additionally, ILAM Fahari I-REIT traded at Kshs 13.8 per share as of 3rd July 2026, representing a 31.0% loss from the Kshs 20.0 inception price. The volume traded to date came in at 1.2 mn shares for the I-REIT, REITs offer various benefits, such as tax exemptions, diversified portfolios, and stable long-term profits. However, the ongoing decline in the performance of Kenyan REITs and the restructuring of their business portfolios are hindering significant previous investments. Additional general challenges include:
-
Insufficient understanding of the investment instrument among investors leading to a slower uptake of REIT products,
-
Lengthy approval processes for REIT creation,
-
High minimum capital requirements of Kshs 100.0 mn for REIT trustees compared to Kshs 10.0 mn for pension funds Trustees, essentially limiting the licensed REIT Trustee to banks only
-
The rigidity of choice between either a D-REIT or and I-REIT forces managers to form two REITs, rather than having one Hybrid REIT that can allocate between development and income earning properties
-
Limiting the type of legal entity that can form a REIT to only a trust company, as opposed to allowing other entities such as partnerships, and companies,
-
We need to give time before REITS are required to list – they would be allowed to stay private for a few years before the requirement to list given that not all companies maybe comfortable with listing on day one, and,
-
Minimum subscription amounts or offer parcels set at Kshs 0.1 mn for D-REITs and Kshs 5.0 mn for restricted I-REITs. The significant capital requirements still make REITs relatively inaccessible to smaller retail investors compared to other investment vehicles like unit trusts or government bonds, all of which continue to limit the performance of Kenyan REITs.
We expect the performance of Kenya's Real Estate sector to remain resilient, supported by several factors: i) Residential properties recording increase in in overall prices in Q1'2026. However, challenges such the weak investor appetite in listed REITs like ILAM Fahari I-REIT and high capital requirements will continue to constrain the sector's optimal performance.
-
Visa Announces the Launch of the Visa Stablecoin Platform
During the week, Visa announced the launch of the Visa Stablecoin Platform (VSP), a new infrastructure layer that lets banks, fintechs, and other payment providers issue, move, and manage stablecoins directly through Visa's network. The platform will initially support Open USD, the industry stablecoin backed by a 140-plus company consortium that includes Visa itself, Mastercard, and BlackRock among others. Rather than building and running their own blockchain infrastructure from scratch, financial institutions can now plug into Visa's existing rails to come onchain and handle stablecoin operations custody, settlement, and movement within a single, trusted environment. This is a significant strategic move because it positions Visa not just as a supporter of stablecoins like Open USD, but as critical infrastructure for the entire stablecoin economy, meaning it stands to earn fees regardless of which specific stablecoin ultimately wins market share. It also lowers the barrier to entry for smaller banks and fintechs who lack the technical expertise to build stablecoin capabilities on their own, likely accelerating institutional adoption of digital dollars for cross-border payments and settlement and cementing Visa's relevance in a payments landscape that is increasingly shifting from card-based rails toward blockchain-based money movement.
-
Mastercard Announces Expansion of its AI infrastructure in the United Kingdom
During the week, Mastercard Incorporated announced a major expansion of its artificial intelligence infrastructure in the United Kingdom, highlighted by the upcoming August launch of Proto, a dedicated sandbox testing environment within its broader enterprise Agent Suite. This rollout introduces a specialized trifecta of AI agents specifically a shopping agent for intelligent customer engagement, an onboarding agent to reduce friction between banks and merchants, and a dispute agent to streamline consumer resolutions while simultaneously slating the UK for the 2027 debut of its Virtual CFO platform tailored for small-and-medium enterprises. By embedding these secure simulation grounds and autonomous financial tools directly into the UK’s payment ecosystem, Mastercard can transition agentic AI from theoretical lab concepts into practical, scaled retail environments. This will give domestic financial institutions, mainstream retailers, and small businesses the compliant tools and data-fuelled insights needed to automate complex daily decision-making, optimize working capital, and safely unlock a projected 10.3% boost to the local economy by 2030.
-
JPMorgan Warns of Margin Pressure on Circle and Coinbase
During the week, JPMorgan issued a research note warning that stablecoin issuer Circle and cryptocurrency exchange Coinbase face mounting pressure on their underlying business models due to a newly revised partnership agreement with exchange platform Hyperliquid. The new arrangement alters how interest income generated by the cash and Treasury reserves backing USD Coin (USDC) is shared, forcing Circle to cede a larger portion of its core revenue to distribution partners like Hyperliquid and Coinbase to maintain its competitive market share. By detailing this shift alongside the aggressive rise of Open USD a rival stablecoin backed by Visa, Mastercard, and BlackRock that offers partners free minting and immediate profit-sharing JPMorgan highlights a structural prisoner's dilemma where Circle must choose between eroding its own profitability or risking distribution loss to rivals. This will likely compress profit margins for both Circle and Coinbase over the long term, signalling that while USDC transaction volumes may remain stable, the broader ecosystem is shifting toward heavy revenue redistribution that permanently challenges the monetization of asset-backed digital currencies.
-
Digital Payments Stock Performance
Cytonn Report: Digital Payments NYSE stock perfomance
Company
Year Open 2026
Price 7/3/2026
Price 7/10/2027
w/w change
YTD change
P/E
American Express
372.7
352.0
350.6
(0.4%)
(5.9%)
28.4
Visa
346.5
362.1
348.9
(3.7%)
0.7%
28.2
Mastercard
563.1
539.4
526.7
(2.4%)
(6.5%)
42.6
Circle
83.5
64.6
66.1
2.4%
(20.8%)
5.4
Block
65.2
78.8
77.3
(1.9%)
18.6%
6.3
Paypal Holdings
58.1
45.5
46.3
1.8%
(20.4%)
3.7
Average
19.1
Source: Visa, AXP, Circle, Mastercard, Block and Paypal financials. NYSE
The stocks are currently trading at an average P/E multiple of 19.1x, indicating that investors are pricing in strong future earnings growth and are prepared to pay a substantial premium for current earnings. This also suggests that valuations may be stretched relative to near-term fundamentals.
We expect the global digital payments sector to continue evolving toward greater payment sovereignty, digital infrastructure modernization, and reduced reliance on traditional card-based payment networks as governments and financial institutions increasingly prioritize control over domestic payment ecosystems. Recent developments, particularly the European Central Bank’s progress toward launching the Digital Euro, signal a growing global shift toward central bank-backed digital payment infrastructure aimed at enhancing financial resilience, improving transaction efficiency, and strengthening monetary independence in an increasingly digital economy. This trend is likely to accelerate competition between public-sector digital currencies and established private payment networks such as Visa Inc. and Mastercard Incorporated, while driving broader innovation across digital finance infrastructure. However, despite these favorable long-term structural tailwinds, valuations within the sector remain relatively elevated, with the companies under coverage currently trading at an average P/E of 19.1x, suggesting that a significant portion of future growth expectations may already be priced in. As such, we expect near-term performance to remain sensitive to regulatory developments, execution risk, and the pace at which both incumbents and emerging digital payment infrastructure providers adapt to the rapidly changing payments landscape.
Introduction
Section I: Introduction and Overview of Satellite Towns in the Nairobi Metropolitan Area
The rapid expansion of Nairobi over the past two decades has fundamentally transformed the spatial structure of the Nairobi Metropolitan Area (NMA), leading to the emergence and accelerated growth of satellite towns surrounding the capital city. Driven by rapid urbanization, population growth, infrastructure development, and the rising cost of land and housing within Nairobi's core, these towns have evolved from predominantly rural settlements into vibrant residential, commercial, and industrial centres. Today, satellite towns play a critical role in accommodating Nairobi's growing population, supporting economic decentralization, and providing relatively affordable housing alternatives to households and businesses that are increasingly priced out of the city.
The Nairobi Metropolitan Area remains Kenya's primary economic hub, accounting for a significant share of the country's Gross Domestic Product (GDP) – with Nairobi City County contributing approximately 27.5% of the country’s GDP, employment opportunities, and formal Real Estate activity. However, increasing congestion, limited availability of development land, escalating property prices, and strained infrastructure within Nairobi have prompted both public and private sector investments to shift towards surrounding urban centres. Improved road networks, the expansion of commuter transport systems, and enhanced social infrastructure have further strengthened the attractiveness of satellite towns, allowing residents to live outside Nairobi while maintaining access to employment and business opportunities within the city.
Satellite towns are urban centres located outside the principal city but within its sphere of economic and social influence. They function as independent municipalities with their own residential neighbourhoods, commercial districts, educational institutions, healthcare facilities, and employment centres, while remaining closely integrated with the central city through transport networks and daily commuting patterns. Unlike suburbs, which form part of the city's continuous urban fabric, satellite towns are geographically distinct settlements that have developed into self-sustaining urban nodes while maintaining strong functional linkages with Nairobi.
Within the Kenyan context, satellite towns generally fall within the Nairobi Metropolitan Area, which encompasses Nairobi City County and parts of Kiambu, Machakos, Kajiado, and Murang'a counties. These towns have experienced rapid population growth as households seek larger living spaces, lower land prices, and improved quality of life compared to the increasingly dense urban environment within Nairobi. Consequently, they have become focal points for residential development, commercial investments, logistics facilities, educational institutions, and industrial parks, making them integral to the region's urban growth strategy.
-
Major satellite towns in the NMA
This report focuses on ten major satellite towns that have emerged as important Real Estate and investment destinations within the Nairobi Metropolitan Area. Although each town exhibits unique development characteristics, they collectively illustrate the diverse dynamics shaping Nairobi's metropolitan expansion.
-
Kikuyu, located along the Southern Bypass and Waiyaki Way corridor, has become one of the fastest-growing residential markets owing to improved connectivity, relatively affordable land prices, and increasing demand for middle-income housing developments.
-
Ngong, situated in Kajiado County, continues to attract residential developments due to its cooler climate, expanding road infrastructure, and availability of relatively affordable land, particularly for low- and middle-income households.
-
Kitengela has transformed from a small trading centre into one of Kenya's largest satellite towns. Its strategic location along the Nairobi-Namanga Highway, relatively affordable land, and increasing commercial activity have supported rapid residential and mixed-use development.
-
Ruiru, located along the Thika Superhighway, has emerged as one of the country's leading investment destinations. The town benefits from proximity to Nairobi, strong infrastructure, numerous universities, manufacturing facilities, and large-scale residential developments that continue to drive population growth.
-
Athi River has traditionally served as Kenya's industrial hub due to its concentration of manufacturing plants and logistics facilities. More recently, the town has experienced significant residential growth, supported by improved transport infrastructure and relatively lower housing costs.
-
Syokimau has established itself as an upper-middle-income residential suburb characterized by gated communities, apartment developments, and close proximity to Jomo Kenyatta International Airport (JKIA), the Nairobi Expressway, and the Standard Gauge Railway (SGR) terminus.
-
Ongata Rongai remains one of the most densely populated satellite towns, primarily driven by strong demand for affordable housing from commuters working within Nairobi. Continuous residential development has significantly increased its population over the last decade.
-
Juja has experienced sustained growth largely due to the presence of higher learning institutions, particularly Jomo Kenyatta University of Agriculture and Technology (JKUAT), which has stimulated demand for student accommodation, retail facilities, and mixed-use developments.
-
Utawala has evolved into a major residential destination along the eastern corridor of Nairobi. Improved road infrastructure and relatively affordable housing have attracted significant investment in apartments, maisonettes, and gated communities targeting middle-income households.
-
Ruai, located along Kangundo Road, represents one of Nairobi's emerging growth frontiers. The availability of large tracts of comparatively affordable land has encouraged extensive residential developments, institutional investments, and speculative land acquisitions, positioning the area for long-term urban expansion.
-
Role of satellite towns in Nairobi's growth and housing market
-
Satellite towns play a vital role in absorbing Nairobi's rapid urban expansion. By drawing population and development outward, they ease intense pressure on the city's core infrastructure, land resources, and services. This outward growth helps manage congestion and allows Nairobi proper to focus on commercial and high-value activities.
-
They support balanced metropolitan development. Satellite towns accommodate a mix of residential, commercial, industrial, and institutional projects, fostering polycentric growth across the wider Nairobi Metropolitan Area (NMA) rather than concentrated development in the CBD.
-
They significantly increase housing supply across income levels. By providing land for various housing typologies (from affordable units to mid-market estates) satellite towns help address Nairobi’s chronic housing deficit and cater to diverse socioeconomic groups.
-
Satellite towns offer more affordable land and housing options. Compared to prime Nairobi suburbs like Karen, Westlands, or Kilimani, where prices are prohibitive for many, satellite locations such as Ruiru, Juja, Syokimau, Athi River, and Ongata Rongai provide relatively lower entry costs for both land acquisition and home construction.
-
They enhance homeownership opportunities for middle- and lower-middle-income households. Lower land prices and growing availability of developer projects, combined with government initiatives like the Affordable Housing Programme (AHP), make owning a home more attainable for these segments.
-
Satellite towns drive land value appreciation and attract private investment. As infrastructure improves and populations grow, land values in these areas rise steadily, creating attractive returns for investors and encouraging further private-sector participation in housing and commercial projects.
-
They promote decentralization of residential, commercial, and economic activities. By pulling people and businesses away from the overcrowded Nairobi CBD, satellite towns reduce commuting pressures and help distribute economic activity more evenly across the metropolis.
-
Many are evolving into self-sustaining urban centres. With the addition of industrial parks, logistics hubs, retail malls, schools, hospitals, hotels, and office spaces, towns like Ruiru and Athi River are transforming from dormitory settlements into fully functional urban nodes.
-
They generate local employment and reduce reliance on Nairobi’s CBD. The emergence of industries, businesses, and services within satellite towns creates jobs closer to where people live, shortening commutes and improving quality of life.
-
Satellite towns support Kenya’s broader urbanization and regional development goals. They align with national policies aimed at managing urban growth, decongesting major cities, and spurring economic activity in surrounding regions.
Section II: Recent Developments Shaping Satellite Town Growth
The growth trajectory of satellite towns within the Nairobi Metropolitan Area (NMA) has accelerated considerably over the past decade, driven by a combination of infrastructure investments, supportive government policies, demographic shifts, and changing consumer preferences. While affordability remains a key driver of migration from Nairobi to its surrounding towns, recent developments have transformed many of these settlements from commuter towns into vibrant mixed-use urban centres capable of supporting residential, commercial, industrial, and institutional activities. Improved accessibility, enhanced public infrastructure, and increasing private sector investments have continued to strengthen the competitiveness of satellite towns, making them attractive destinations for both homebuyers and Real Estate investors. Consequently, understanding these underlying growth drivers is critical in assessing future development prospects and investment opportunities across the Nairobi Metropolitan Area.
-
Infrastructure developments driving expansion
Infrastructure remains the single most significant catalyst for Real Estate growth within Nairobi's satellite towns. Historically, the growth of many of these towns was constrained by poor road connectivity, inadequate public transport, limited utility services, and insufficient social infrastructure. However, substantial public investment in transport corridors and supporting infrastructure has significantly improved accessibility, reduced commuting times, and unlocked new areas for development.
|
# |
Infrastructure Project |
Satellite Town(s) Benefiting |
Key Impact on Growth and Real Estate |
|
|
Thika Superhighway |
Ruiru, Juja |
Improved accessibility to Nairobi CBD, accelerated residential and commercial developments, increased land values, attracted mixed-use, retail and industrial investments. |
|
|
Nairobi Expressway |
Syokimau, Athi River, Kitengela |
Reduced travel time to Nairobi CBD, JKIA and Westlands, boosting residential developments, logistics parks, warehouses and mixed-use projects. |
|
|
Southern Bypass |
Kikuyu |
Enhanced connectivity to Nairobi and western suburbs, stimulating residential expansion, gated communities and commercial developments. |
|
|
Eastern Bypass |
Ruai, Utawala, Ruiru, Athi River |
Improved inter-town connectivity, reduced reliance on Nairobi CBD, encouraged suburban expansion and commercial investments. |
|
|
Northern Bypass |
Ruiru, Ruaka (broader corridor), Juja |
Enhanced regional connectivity, supported residential growth and eased movement across northern metropolitan areas. |
|
|
Western Bypass |
Kikuyu, Ngong (indirectly) |
Improved accessibility between western satellite towns and Nairobi, supporting residential and mixed-use developments. |
|
|
Greater Eastern Bypass |
Ruai, Utawala, Athi River |
Opened up emerging growth areas, improved accessibility and increased investor interest in residential and industrial developments. |
|
|
Standard Gauge Railway (SGR) – Syokimau Terminus |
Syokimau, Athi River |
Improved regional connectivity, supported commuter mobility and increased attractiveness for residential and hospitality developments. |
|
|
Nairobi Commuter Rail Network |
Ruiru, Kikuyu, Athi River, Syokimau |
Provided alternative commuter transport, reduced travel costs and supported transit-oriented residential growth. |
|
|
Electricity Distribution Expansion |
All major satellite towns |
Improved reliability of power supply, enabling larger residential estates, commercial centres and industrial developments. |
|
|
Water Supply & Sewerage Infrastructure |
All satellite towns (varying levels) |
Enhanced service delivery, improved living standards and enabled higher-density residential and mixed-use developments. |
|
|
Fibre Optic & Telecommunications Networks |
All major satellite towns |
Improved digital connectivity, supported remote working, business operations and increased attractiveness to residents and investors. |
|
|
Social Infrastructure (Universities, Hospitals, Shopping Malls & Recreation Facilities) |
Juja (JKUAT), Ruiru, Kitengela, Athi River, Kikuyu, Syokimau and other satellite towns |
Created self-sustaining urban centres, generated employment, reduced dependence on Nairobi CBD and stimulated demand for surrounding real estate. |
-
Policy and regulatory developments affecting land use and housing
Government policy has become an increasingly important driver of satellite town development. National and county governments have introduced several policy initiatives aimed at addressing housing deficits, improving urban planning, promoting infrastructure development, and encouraging private sector participation in the housing market.
-
The government's Affordable Housing Programme (AHP) has emerged as one of the most influential housing policies shaping demand across satellite towns. Through public-private partnerships and supportive financing initiatives, the programme seeks to increase the supply of affordable housing while encouraging developments in areas where land remains relatively affordable. Several satellite towns have consequently become attractive locations for affordable housing projects due to lower land acquisition costs and improved infrastructure connectivity.
-
Land administration reforms have also improved investor confidence, although challenges remain. Continued digitization of land records through the National Land Information Management System (ArdhiSasa) has enhanced transparency in selected jurisdictions by improving access to land ownership records, reducing transaction timelines, and minimizing incidences of fraudulent transactions. While implementation remains gradual, digitization represents an important step toward improving efficiency within Kenya's property market.
-
County governments have equally continued reviewing zoning regulations and physical planning frameworks to accommodate rapid urban growth. The implementation of the Physical and Land Use Planning Act, 2019 has strengthened requirements for integrated spatial planning, environmental considerations, and orderly urban development. Several counties within the Nairobi Metropolitan Area have revised development control regulations to support higher residential densities, mixed-use developments, and improved infrastructure coordination in response to increasing urbanization.
-
Government investment in trunk infrastructure has further supported private sector participation by reducing development costs in emerging growth areas. Water supply expansions, sewer infrastructure, road improvements, electricity connectivity, and public transport investments have collectively increased the feasibility of large-scale residential developments across satellite towns.
Despite these positive developments, several regulatory challenges continue to affect development activity such as; i) Lengthy development approval processes ii) inconsistent zoning enforcement iii) infrastructure deficits in rapidly urbanizing areas iv) land ownership disputes, and v) overlapping institutional mandates continue to increase project timelines and development costs. Addressing these bottlenecks remains critical in sustaining long-term urban growth.
-
Emerging demographic trends and consumer preferences
-
Demographic changes continue to reshape housing demand across Nairobi's satellite towns. with relatively high urbanization and population growth rates of 2.9% p.a and 1.9% p.a, respectively, against the global average of 1.4% p.a and 1.0% p.a, respectively, as at 2025. Kenya's youthful population, rising household formation, and expanding middle-income population have sustained demand for residential developments outside Nairobi's traditional urban core. As housing affordability within Nairobi continues to deteriorate, an increasing number of households are relocating to satellite towns where they can access relatively larger homes, lower land prices, and improved living environments.
-
Affordability has become one of the strongest determinants of residential location. Many homebuyers are increasingly willing to commute longer distances in exchange for larger housing units and lower purchase prices. This trend has significantly benefited towns such as Kitengela, Ruiru, Juja, Kikuyu, and Ruai, where residential developments remain considerably more affordable than comparable developments within Nairobi.
-
Consumer preferences have also evolved beyond affordability alone. Modern homebuyers increasingly prioritize secure gated communities, reliable infrastructure, proximity to schools and healthcare facilities, recreational amenities, green spaces, and integrated neighbourhood planning. Consequently, developers are increasingly shifting from standalone housing projects toward master-planned mixed-use developments that combine residential, commercial, educational, and recreational facilities within a single community.
-
Changing work patterns have further influenced housing demand. The adoption of hybrid and remote working arrangements following the COVID-19 pandemic has reduced the importance of living close to Nairobi's CBD for many professionals. Instead, households increasingly value larger living spaces, dedicated home offices, better environmental quality, and improved neighbourhood amenities. This has strengthened demand for developments located within satellite towns offering higher quality of life and lower population densities.
-
The growing influence of technology has also transformed consumer behaviour within the property market. Digital property listing platforms, virtual property tours, online mortgage applications, and increased access to market information have made property transactions more transparent and efficient. Buyers are increasingly conducting extensive online research before making purchasing decisions, encouraging developers to adopt digital marketing strategies and data-driven customer engagement.
-
Another emerging trend is the increasing demand for investment-oriented housing. Rising rental demand from students, young professionals, industrial workers, and expanding urban populations has encouraged investors to acquire apartments, serviced units, and rental housing within high-growth satellite towns. Areas such as Ruiru, Juja, Syokimau, Athi River, and Kitengela continue to attract investor interest due to their strong rental demand and long-term capital appreciation potential.
Overall, the combined effects of demographic expansion, evolving lifestyle preferences, technological adoption, and improving infrastructure continue to reinforce the strategic importance of satellite towns within Nairobi's urban development landscape. As these trends persist, satellite towns are expected to remain at the forefront of Kenya's residential and commercial Real Estate growth, providing significant opportunities for developers, investors, policymakers, and financial institutions seeking to capitalize on the next phase of metropolitan expansion.
Section III: Satellite Town Market Performance
Satellite towns have played a pivotal role in supporting the growth of the Nairobi Metropolitan Area (NMA) real estate market by offering relatively affordable residential developments and land compared to Nairobi's established urban nodes. This affordability, combined with sustained infrastructure development and rapid urbanization, has positioned these towns as attractive destinations for both developers and homebuyers. The table below summarizes the five-year performance of the residential and land sectors across the NMA satellite towns, providing insights into their market trends and investment potential.
-
Residential sector performance trends (2022–2026)
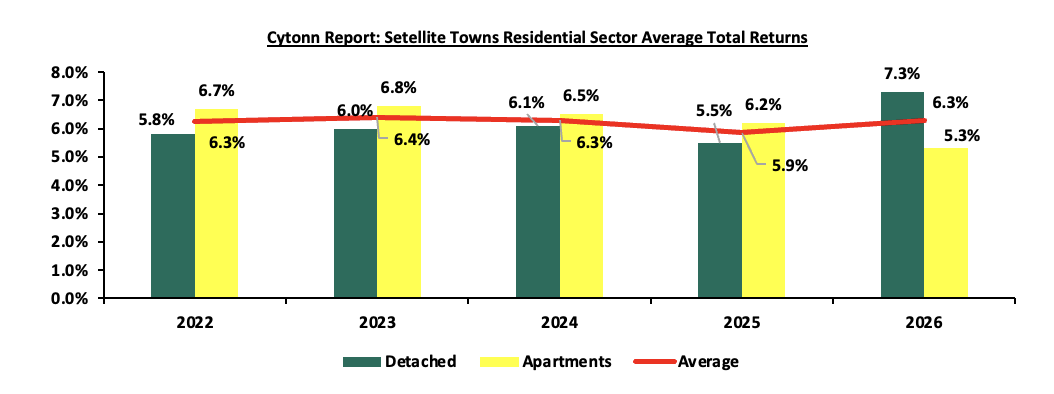
The residential sector in Nairobi's satellite towns has demonstrated remarkable resilience, maintaining an average rental yield of 6.2% over the five-year period despite periods of macroeconomic uncertainty, rising construction costs, elevated interest rates, and changing consumer preferences. While the overall market remained relatively stable, performance differed between detached units and apartments, reflecting changing housing demand and market dynamics.
Detached housing recorded an average rental yield of 6.1%, with yields increasing from 5.8% in 2022 to 7.3% in 2026, representing the strongest performance among the two residential segments. The 4.7% CAGR indicates consistent long-term growth in rental returns. This upward trajectory can largely be attributed to growing demand for larger living spaces, particularly following the COVID-19 pandemic, as households increasingly preferred standalone homes offering more privacy, outdoor space, and dedicated home offices. Additionally, detached houses are generally concentrated within gated communities in satellite towns where land availability remains relatively higher than within Nairobi, making them attractive to middle- and upper-middle-income households seeking improved living environments.
In contrast, apartment developments recorded the highest rental yields at the beginning of the review period, averaging 6.7% in 2022, but gradually declined to 5.3% in 2026, resulting in a negative CAGR of 4.6%. This decline suggests that apartment supply has grown faster than effective rental demand in several satellite towns. Increased construction activity over recent years has led to heightened competition among landlords, placing downward pressure on rental yields. At the same time, rising mortgage interest rates and higher household living costs have constrained tenants' affordability, limiting landlords' ability to significantly increase rents despite continued population growth.
Consequently, while apartments continue to offer relatively attractive rental returns, the market has become increasingly competitive, particularly in mature satellite towns where substantial apartment developments have been completed. Developers are therefore placing greater emphasis on product differentiation through improved amenities, mixed-use developments, and integrated community planning to remain competitive.
Overall, the residential market recorded an average rental yield of 6.2% during the review period, with annual yields fluctuating within a relatively narrow range of 5.9% to 6.4%. The overall compound annual growth rate (CAGR) of 0.2% indicates that the satellite towns residential market has largely stabilized, with rental performance remaining resilient despite changing economic conditions. The stability reflects sustained housing demand driven by continued urbanization, infrastructure development, and population growth, although future performance is likely to depend increasingly on location, product quality, affordability, and supporting infrastructure rather than broad market appreciation. The graph below shows satellite towns residential sector average total returns between 2022 and 2026.
Source: Cytonn Research
-
Satellite towns land sector performance in the Nairobi Metropolitan Area (2021–2025)
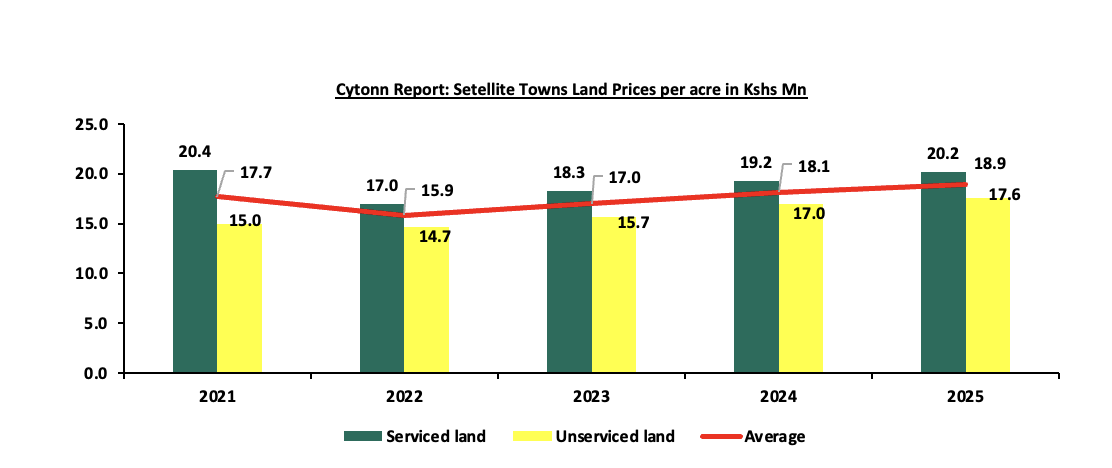
The satellite towns land market within the Nairobi Metropolitan Area (NMA) demonstrated steady recovery and resilience over the five-year review period, with the average land price increasing from Kshss 17.7 mn per acre in 2021 to Kshss 18.9 mn per acre in 2025, translating to a Compound Annual Growth Rate (CAGR) of 1.3%. This moderate appreciation reflects sustained investor confidence, supported by rapid urbanization, infrastructure expansion, and increasing demand for residential and mixed-use developments across key satellite towns. However, the performance varied between serviced and unserviced land due to differences in infrastructure availability, development readiness, and investor preferences.
Serviced land remained the highest-valued segment throughout the review period, averaging Kshs 19.0 mn per acre. Prices declined from Kshs 20.4 mn per acre in 2021 to Kshs 17.0 mn in 2022, largely reflecting subdued market activity following the COVID-19 pandemic, high construction costs, and cautious investment sentiment. Thereafter, the market gradually recovered, with prices rising to Kshs 20.2 mn per acre in 2025 as infrastructure investments, housing demand, and renewed developer activity strengthened the market. Despite this recovery, serviced land recorded a marginal negative CAGR of 0.2%, indicating that prices had only returned to near pre-2022 levels by the end of the review period.
Conversely, unserviced land exhibited stronger long-term growth, recording the highest CAGR of 3.2% among the two segments. Prices increased steadily from Kshs 15.0 mn per acre in 2021 to Kshs 17.6 mn per acre in 2025, with an average price of Kshs 16.0 mn per acre. The stronger appreciation reflects growing investor interest in emerging satellite towns where land remains relatively affordable and infrastructure projects are expected to unlock future value. Many investors adopted land banking strategies, acquiring undeveloped parcels in anticipation of future urban expansion, road infrastructure improvements, and increased development activity. This trend was particularly evident in towns such as Ruai, Kitengela, Juja, Athi River, and Ngong, where infrastructure development continues to open new investment frontiers.
The divergence in performance between serviced and unserviced land also reflects changing investment strategies. While serviced land continues to attract developers seeking immediate construction opportunities due to existing infrastructure and lower development risk, rising land prices have encouraged investors to shift towards unserviced land, where acquisition costs remain lower and capital appreciation prospects are relatively stronger. As major infrastructure projects continue to expand into peripheral areas, previously unserviced locations are increasingly transitioning into development-ready investment destinations.
Overall, the performance of the satellite towns land market highlights continued confidence in the long-term growth of the Nairobi Metropolitan Area. Although serviced land remains the preferred option for immediate development, unserviced land has emerged as the faster-growing investment segment due to its affordability and higher appreciation potential. Going forward, continued investment in transport infrastructure, utilities, and public services, coupled with sustained urban population growth and increasing housing demand, is expected to support further land value appreciation across Nairobi's satellite towns. The graph below shows satellite towns land sector average price per acre between 2021 and 2025.
Source:Cytonn Research
Section IV: Challenges and Risks Facing the Growth of Satellite Towns in NMA
The rapid expansion of satellite towns within the Nairobi Metropolitan Area (NMA) has significantly transformed Kenya's urban landscape, providing alternative locations for residential, commercial, and industrial developments while easing development pressure on Nairobi's Central Business District. Setellite towns have experienced sustained growth driven by infrastructure investments, relatively affordable land, and increasing housing demand. However, this rapid urbanization has also exposed several structural weaknesses that threaten the long-term sustainability of these emerging urban centres. Unless adequately addressed through coordinated planning, infrastructure investment, and sound governance, these challenges could undermine the competitiveness and livability of satellite towns while reducing investor confidence and long-term Real Estate returns.
-
Infrastructure and service provision gaps
Despite significant improvements in transport infrastructure over the last decade, the provision of supporting urban services has not kept pace with the rapid rate of development across many satellite towns. Population growth has consistently outpaced public investment in essential infrastructure, resulting in increasing pressure on existing road networks, water supply systems, sewerage infrastructure, electricity distribution, drainage systems, healthcare facilities, and educational institutions.
-
Traffic congestion has become one of the most visible consequences of rapid urban growth. Although major highways such as the Thika Superhighway, Nairobi Expressway, Southern Bypass, and Mombasa Road have improved regional connectivity, many internal road networks within satellite towns remain poorly developed. Residents of Ruiru, Kitengela, Ongata Rongai, Syokimau, and Utawala continue to experience significant traffic delays during peak commuting hours due to inadequate feeder roads, limited public transport integration, and increasing vehicle ownership. As urban populations continue to expand, congestion is likely to worsen unless investments are extended beyond trunk infrastructure into local transport systems.
-
Water scarcity and inadequate sewerage infrastructure present equally significant challenges. Several satellite towns continue to rely on boreholes, water vendors, septic tanks, and private waste management systems due to insufficient public utility infrastructure. In rapidly growing areas such as Ruai, Kitengela, Juja, and Ngong, inconsistent water supply has become a major constraint to both residential occupancy and large-scale Real Estate development. Similarly, inadequate sewer connectivity has increased environmental and public health risks while raising development costs for private investors who are often required to install independent utility systems.
-
Electricity distribution has improved considerably in recent years, but occasional power interruptions, limited transformer capacity in newly developed neighbourhoods, and delays in utility connections continue to affect commercial operations and residential developments. Digital infrastructure has similarly improved through increased fibre optic connectivity; however, disparities remain between established and emerging neighbourhoods.
-
Social infrastructure has struggled to keep pace with population growth. The demand for public schools, healthcare facilities, recreational amenities, security services, and emergency response infrastructure continues to increase, placing considerable pressure on county governments. In many satellite towns, private sector providers have filled these gaps, but access remains constrained for lower-income households due to affordability considerations.
Collectively, these infrastructure deficits reduce the quality of life for residents, increase operational costs for businesses and developers, and limit the long-term competitiveness of satellite towns as sustainable urban centres.
-
Planning, governance and environmental concerns
Rapid urban expansion has exposed significant weaknesses in spatial planning and urban governance across several counties within the Nairobi Metropolitan Area. In many instances, development has occurred faster than the preparation and implementation of integrated physical development plans, resulting in fragmented urban growth, incompatible land uses, and inefficient infrastructure provision.
-
One of the most significant planning challenges is urban sprawl. Low-density developments spreading over large geographical areas increase infrastructure costs while making the provision of roads, water, sewerage, electricity, and public transport less efficient. Rather than developing compact and well-integrated urban centres, many satellite towns have experienced scattered developments that are difficult and expensive for governments to service.
-
Weak enforcement of zoning regulations has also contributed to uncoordinated development. Residential developments frequently emerge alongside industrial facilities, commercial centres, or environmentally sensitive areas without adequate planning controls. Such incompatible land uses reduce environmental quality, increase traffic congestion, and negatively affect long-term property values.
-
Land administration challenges remain another major concern. Although digitization initiatives such as ArdhiSasa have improved transparency in some areas, land ownership disputes, fraudulent transactions, overlapping titles, and lengthy approval processes continue to delay developments and increase investment risks. Developers often incur substantial legal and due diligence costs before acquiring development sites, particularly in rapidly urbanizing towns where historical land ownership records may be incomplete.
-
Environmental sustainability is becoming an increasingly important consideration. The conversion of agricultural land, wetlands, forests, and open spaces into residential developments has accelerated across several satellite towns, reducing ecological resilience and increasing vulnerability to flooding and environmental degradation. Inadequate stormwater drainage, poor solid waste management, and encroachment onto riparian reserves have further compounded environmental risks.
-
Climate change introduces additional long-term challenges. Increasingly frequent flooding events, prolonged droughts, rising temperatures, and changing rainfall patterns require urban planning approaches that prioritize resilient infrastructure, sustainable drainage systems, green spaces, and environmentally responsible development practices. Failure to incorporate these considerations may expose both public infrastructure and private Real Estate investments to increasing climate-related risks.
-
Affordability, speculative activity and market sustainability
Although satellite towns initially emerged as affordable alternatives to Nairobi's increasingly expensive property market, affordability pressures have gradually intensified as demand has continued to rise. Improved infrastructure, growing investor interest, and speculative land acquisitions have significantly increased land prices across many satellite towns, reducing the affordability advantage that originally attracted many homebuyers.
-
Land speculation remains one of the defining characteristics of several emerging growth areas. Investors frequently acquire undeveloped land in anticipation of future infrastructure projects or urban expansion rather than immediate development. While speculative investment can contribute to capital appreciation, excessive speculation often distorts land prices, reduces the availability of development land, and delays productive investment. Large portions of serviced land therefore remain idle for extended periods despite growing housing demand.
-
The rising cost of construction materials, labour, financing, and infrastructure provision has further increased housing prices. Elevated interest rates and tighter lending conditions have reduced mortgage affordability for many households, limiting effective demand despite continued population growth. As a result, some residential developments have experienced slower sales absorption rates, while developers have increasingly shifted toward phased construction to manage market risks.
-
Another emerging concern relates to market oversupply within certain property segments. In selected satellite towns, rapid construction of apartments has exceeded effective demand, resulting in increasing vacancy rates, longer selling periods, and downward pressure on rental yields. Conversely, other market segments such as affordable housing, logistics facilities, student accommodation, and serviced industrial developments continue to exhibit relatively strong demand. This divergence highlights the importance of market research and demand-driven development rather than speculative construction.
-
The sustainability of long-term growth will therefore depend on maintaining an appropriate balance between supply and demand. Developers who rely solely on expectations of future appreciation without considering market fundamentals may face reduced returns as competition intensifies and buyers become increasingly price-sensitive. Sustainable urban growth requires developments that respond to genuine demographic needs, employment creation, infrastructure availability, and household purchasing power rather than speculative market sentiment alone.
Despite their remarkable transformation into some of Kenya's fastest-growing urban centres, satellite towns within the Nairobi Metropolitan Area continue to face significant structural challenges that could constrain their future development if left unaddressed. Infrastructure deficits, weak urban planning, governance inefficiencies, environmental degradation, affordability constraints, and speculative market behaviour collectively present risks to sustainable urbanization and long-term Real Estate performance. Nevertheless, these challenges are not insurmountable. Through coordinated investment in infrastructure, stronger planning and governance frameworks, improved land administration, environmental stewardship, and demand-driven development strategies, satellite towns can continue to evolve into resilient, competitive, and sustainable urban centres capable of supporting Nairobi's future population growth while delivering attractive long-term investment opportunities.
Section V: Conclusion, Outlook and Investment Opportunities
The sustained growth of satellite towns within the Nairobi Metropolitan Area (NMA) reflects the continued transformation of Kenya's urban landscape as population growth, infrastructure investment, and changing housing preferences reshape the geography of Real Estate development. Over the past decade, towns such as Ruiru, Kikuyu, Kitengela, Athi River, Syokimau, Ngong, Ongata Rongai, Juja, Utawala, and Ruai have evolved from largely commuter settlements into increasingly diversified urban centres supporting residential, commercial, industrial, educational, and logistics activities. Improved connectivity through major road networks, expanding utility infrastructure, and continued public and private sector investment have significantly enhanced their attractiveness, positioning satellite towns as an integral component of Nairobi's future urban expansion.
Infrastructure development remains the single most influential driver of growth across the metropolitan region. Major projects including the Thika Superhighway, Nairobi Expressway, Southern Bypass, Eastern Bypass, Western Bypass, Greater Eastern Bypass, and the Standard Gauge Railway have substantially improved accessibility, reduced commuting times, and unlocked significant development potential along key transport corridors. At the same time, supportive government initiatives such as the Affordable Housing Programme (AHP), continued investment in trunk infrastructure, and gradual improvements in land administration have further strengthened investor confidence and stimulated residential development across several satellite towns.
Despite this positive momentum, several structural challenges that require careful consideration remain. Infrastructure provision continues to lag behind population growth in many towns, particularly regarding water supply, sewerage systems, feeder roads, drainage infrastructure, and social amenities. Urban planning challenges, speculative land acquisitions, affordability pressures, environmental degradation, and governance inefficiencies remain significant risks that could constrain sustainable long-term growth if not adequately addressed. Consequently, future success will depend not only on continued infrastructure investment but also on stronger planning frameworks, coordinated metropolitan governance, and greater emphasis on sustainable urban development.
-
Short- to medium-term growth prospects
Looking ahead, the outlook for Nairobi's satellite towns remains positive, supported by favourable demographic trends, sustained urbanization, improving infrastructure, and continued housing demand. Kenya's growing urban population, expanding middle-income segment, and persistent housing deficit are expected to continue driving residential demand beyond Nairobi's traditional urban core. As land prices within Nairobi remain relatively high and developable land becomes increasingly scarce, satellite towns are expected to remain the preferred destinations for both owner-occupiers and Real Estate developers.
In the short term (1–3 years), demand is likely to remain strongest in towns that combine affordability with excellent transport connectivity. Areas benefiting from existing road infrastructure and proximity to major employment centres are expected to continue attracting residential developments, particularly apartments, gated communities, and mixed-use projects targeting middle-income households.
Over the medium term (3–7 years), continued government investment in transport infrastructure, industrial parks, affordable housing, logistics facilities, and public utilities is expected to strengthen the self-sufficiency of satellite towns. Rather than functioning solely as commuter settlements, many are likely to evolve into independent economic hubs offering employment opportunities, commercial services, healthcare, education, and recreational facilities, thereby reducing dependence on Nairobi's Central Business District.
Furthermore, the continued adoption of hybrid working arrangements, increasing digital connectivity, and changing lifestyle preferences are expected to reinforce demand for larger residential developments located within well-planned suburban environments. These structural shifts suggest that satellite towns will remain central to Kenya's long-term urbanization strategy.
-
Strategic considerations for developers, investors and policymakers
The continued success of satellite towns will depend on coordinated action by developers, investors, financial institutions, and policymakers to ensure that growth remains sustainable, inclusive, and economically viable.
-
For developers, future competitiveness will increasingly depend on delivering integrated, demand-driven developments rather than speculative projects. Mixed-use communities incorporating residential, commercial, educational, healthcare, and recreational facilities are likely to outperform standalone developments as consumers increasingly prioritize convenience, accessibility, and quality of life. Developers should also prioritize sustainable construction practices, efficient infrastructure provision, and market-driven product design that aligns with evolving household affordability levels.
-
For investors, satellite towns continue to offer attractive opportunities for both capital appreciation and rental income. However, investment decisions should be guided by rigorous market research, infrastructure readiness, demographic trends, and long-term demand fundamentals rather than short-term speculative expectations. Corridors benefiting from major infrastructure investments, employment growth, and diversified economic activity are likely to deliver more resilient long-term returns than areas driven primarily by speculative land appreciation.
-
For policymakers, sustaining metropolitan growth will require continued investment in transport infrastructure, water and sewerage systems, public transport integration, social amenities, and digital infrastructure. Strengthening metropolitan governance, improving land administration systems, streamlining development approvals, enforcing planning regulations, and promoting environmentally sustainable urban development will be essential in supporting orderly urban expansion. Greater collaboration between national government, county governments, and the private sector will also be necessary to ensure infrastructure provision keeps pace with rapid population growth.
Conclusion:
The future of Nairobi's Real Estate market increasingly lies beyond the city's traditional boundaries. Satellite towns have emerged as the primary engines of metropolitan expansion, offering the land, affordability, and development capacity needed to accommodate Kenya's growing urban population. While infrastructure deficits, planning challenges, and affordability pressures remain important considerations, the long-term fundamentals underpinning these markets remain strong.
As Nairobi continues to expand outward, investment activity is expected to become increasingly concentrated along well-serviced transport corridors and emerging mixed-use urban centres. Developers who align projects with genuine market demand, investors who prioritize infrastructure-led growth locations, and policymakers who strengthen planning and service delivery will be best positioned to capitalize on the next phase of metropolitan development. Ultimately, satellite towns are no longer peripheral markets, they are becoming the new growth centres of Kenya's urban economy and will play a defining role in shaping the future of the country's Real Estate sector.
Disclaimer: The views expressed in this publication are those of the writers where particulars are not warranted. This publication is meant for general information only and is not a warranty, representation, advice or solicitation of any nature. Readers are advised in all circumstances to seek the advice of a registered investment advisor.

- Talk to us
- Kenya
- P.O Box 20695 - 00200, Nairobi, Kenya
- Cell +254709101200
- Tel +254709101200
- WhatsApp +254741676635
- United States
- +254709101200
- DOWNLOAD OUR APP
-


- Kenya
- 8th Floor, Pinetree Plaza, Kaburu Drive, Ngong Road, Nairobi, Kenya
- USA
- Suite 1150, 1775 Eye Street NW, USA, Washington DC 20006, USA
- Investments
- High Yield
- Private Equity
- Real Estate
- Real Estate
- RiverRun Estates
- Cytonn Towers
- The Ridge
- Taraji Heights
- The Alma