Unit Trust Fund Performance Q3’2020, & Cytonn Weekly #07/2021
By Cytonn Research, Feb 21, 2021
Executive Summary
Fixed Income
During the week, T-bills were oversubscribed with the overall subscription rate increasing to 124.9%, from 90.6% recorded the previous week. This is mainly attributable to improved liquidity in the market as evidenced by interbank rates declining to 3.9%, from 4.9% the previous week. Investors continued their preference for the 364-day paper which had the highest subscription rate of 139.0%, down from 160.8% recorded the previous week. The Central Bank of Kenya opened two bonds on tap sale, FXD1/2013/15 and FXD1/2012/20, with effective tenors of 7.1 years and 11.8 years, and coupons of 11.3% and 12.0%, respectively. The bonds traded at a rate of 11.8% for FXD1/2013/15 and 12.6% for FXD1/2012/20. Notably, the issues recorded low demand, with the overall subscription rate coming in at 62.4%, mainly attributable to the short bidding period. The Energy and Petroleum Regulatory Authority (EPRA) released their monthly statement on fuel prices, the Maximum wholesale and retail prices, indicating a 7.6% , 5.7% and 6.1% increase in petrol, Diesels and Kerosene prices to Kshs 115.3, Kshs 101.9, and Kshs 92.4 per litre, from Kshs 107.1, Kshs 96.4, and Kshs 87.1 respectively . Additionally, the Kenyan authorities and the International Monetary Fund (IMF) mission team reached an agreement on economic and structural policies that would reinforce a 38-month program under the Extended Fund Facility (EFF) and Extended Credit Facility (ECF) arrangements for approximately USD 2.4 bn (Kshs 262.9 bn);
Equities
During the week, the equities market recorded mixed performance, with NASI and NSE 25 gaining by 0.9% and 0.7% respectively, while NSE 20 declined marginally by 0.1%, taking their YTD performance to gains of 8.9%,0.9% and 6.7% for NASI, NSE 20 and NSE 25 respectively. The equities market performance was driven by gains recorded by large-cap stocks such as BAT, KCB Group, Bamburi and DTB-K of 14.1%, 3.9%, 3.1% and 2.5%, respectively. The gains were however weighed down by losses recorded by stocks such as EABL and NCBA Group which declined by 2.3% and 1.6%, respectively;
Real Estate
During the week, Kenya National Bureau of Statistics (KNBS) released the Leading Economic Indicators December (LEI) 2020, highlighting that the number of international arrivals rose by 48.7% from 31,875 in November 2020 to 47,406 in December 2020. In the residential sector, Unity Homes, a Kenyan residential property developer, announced plans to develop a Kshs 4.0 bn, 576-unit apartment complex dubbed Universal One, in the Lekki Free Zone in Lagos City in Nigeria in an international expansion drive. In the retail sector, French retailer Carrefour opened a new outlet at Centre Point Mall in Diani, Kwale County, in an expansion drive that saw it take up 1,000 SQFT of space previously occupied by retail giant Nakumatt;
Focus of the Week
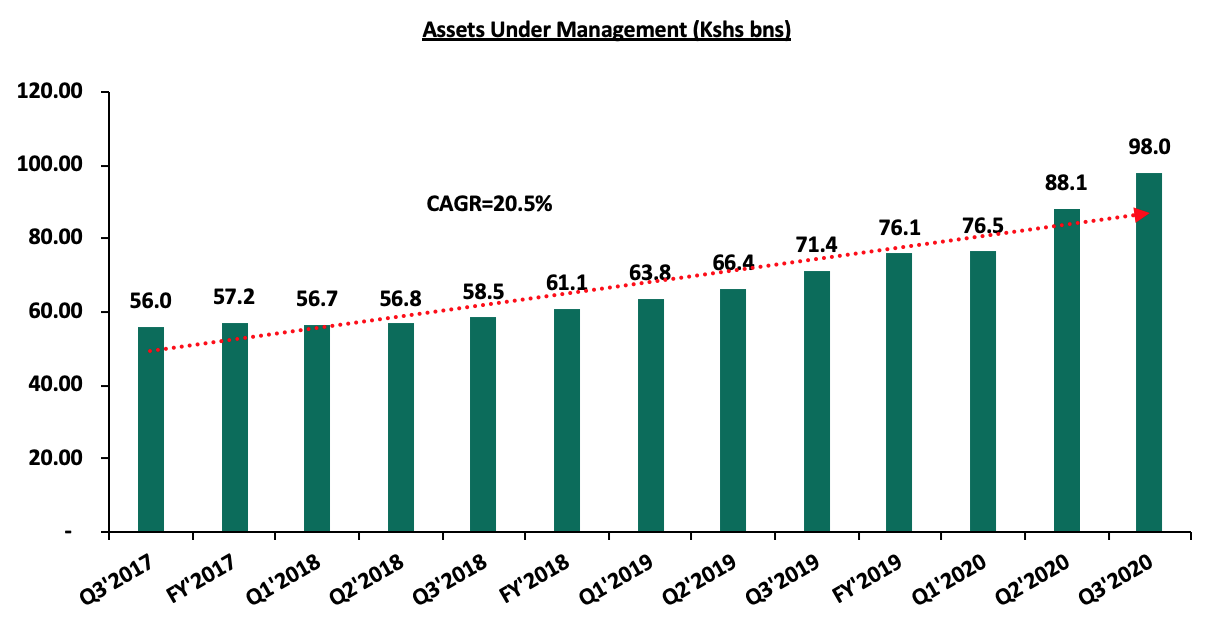
Following the release of the Capital Markets Authority (CMA) Quarterly Statistical Bulletin – Q4’2020, we examine the performance of Unit Trust Funds, as the total Assets Under Management (AUM) of Unit Trust Funds has been steadily increasing and they are among the most popular investment options in the Kenyan market. According to the Capital Markets Authority, as at the end of Q3’2020, there were 19 active collective investment schemes. During the period under review, total Assets Under Management grew by 11.2% to Kshs 98.0 bn in Q3’2020, from Kshs 88.1 bn as at Q2’2020.
- Weekly Rates:
- Cytonn Money Market Fund closed the week at a yield of 10.57%. To invest, just dial *809#;
- Cytonn High Yield Fund closed the week at a yield of 13.53% p.a. To invest, email us at sales@cytonn.com and to withdraw the interest you just dial *809#;
- For an exclusive tour of Cytonn’s real estate developments, visit: Sharp Investor's Tour and for more information, email us at sales@cytonn.com;
- We continue to offer Wealth Management Training daily, from 9:00 am to 11:00 am, through our Cytonn Foundation. The training aims to grow financial literacy among the general public. To register for any of our Wealth Management Training, click here;
- If interested in our Private Wealth Management Training for your employees or investment group, please get in touch with us through wmt@cytonn.com;
- We have 10 investment-ready projects, offering attractive development and buyer targeted returns. See further details here: Summary of Investment-ready Projects;
- For recent news about the company, see our news section here.
Money Markets, T-Bills & T-Bonds Primary Auction:
During the week, T-bills were oversubscribed with the overall subscription rate increasing to 124.9%, from 90.6% recorded the previous week. This is mainly attributable to improved liquidity in the market as evidenced by interbank rates declining to 3.9%, from 4.9% recorded the previous week. Investors continued their preference on the 364-day paper which had the highest subscription rate of 139.0%, down from 160.8% recorded the previous week. This is mainly attributable to investor preference for medium-term papers as they now believe that the pandemic has been contained but are still worried about possible effects of the current rising political temperatures preceding the elections in August 2022. The subscription rate for the 182-day and 91-day papers increased to 114.0% and 116.9%, from 47.0% and 23.9% recorded the previous week, respectively. The yields on 364-day, 182-day and 91-day papers rose by 10.7 bps, 4.0 bps and 0.6 bps to 8.9%, 7.7% and 6.9%, respectively. The government received bids worth Kshs 30.0 bn, accepting only Kshs 28.8 bn, translating to an acceptance rate of 96.1%.
The Central Bank of Kenya opened two bonds on tap sale, FXD1/2013/15 and FXD1/2012/20, with effective tenors of 7.1 years and 11.8 years, and coupons of 11.3% and 12.0%, respectively. The bonds had an average rate of 11.8% for FXD1/2013/15 and 12.6% for FXD1/2012/20. The issues recorded low demand, with the overall subscription rate coming in at 62.4%, mainly attributable to the short bidding period. The government received bids worth Kshs 11.2 bn, lower than the Kshs 18.0 bn offered and accepted only Kshs 10.9 bn. The acceptance rate came in at 97.1%, with the weighted average rate of accepted bids being 11.8% and 12.6%, respectively.
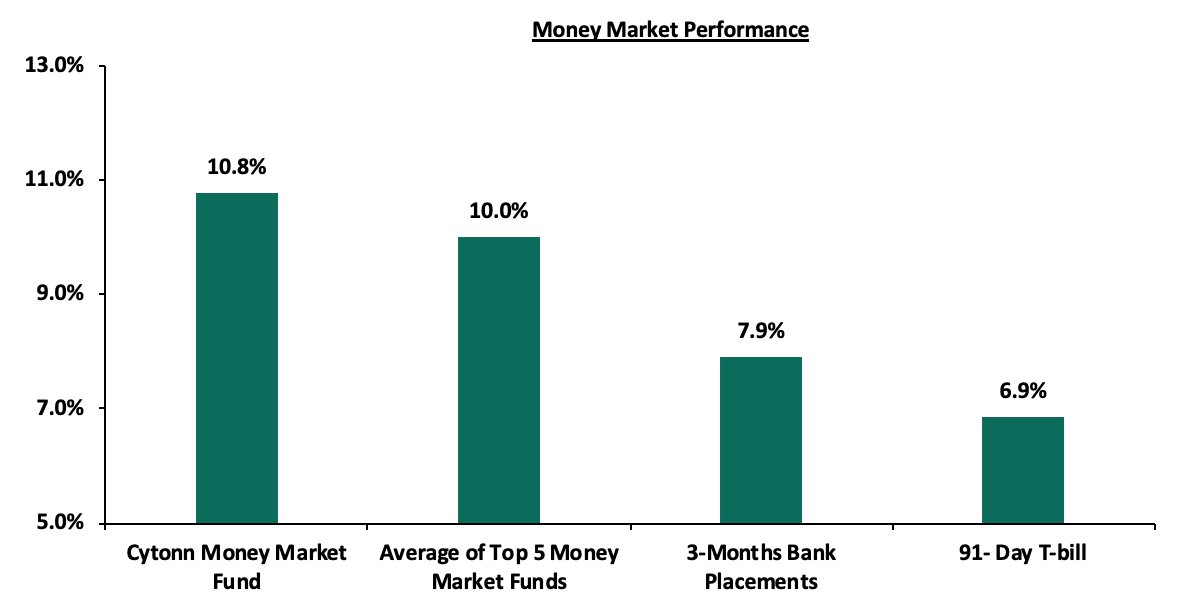
In the money markets, 3-month bank placements ended the week at 7.9% (based on what we have been offered by various banks), while the yield on the 91-day T-bill rose by 0.6 bps to 6.9%. The average yield of the Top 5 Money Market Funds rose by 0.1% points to 10.0% from the 9.9% recorded last week. The yield on the Cytonn Money Market increased by 21.0 bps to 10.8%, from 10.6% recorded the previous week.
Liquidity:
During the week, liquidity in the money market improved, with the average interbank rate declining to 3.9% from the 4.9% recorded the previous week, as the government payments were offset by tax remittances. The average interbank volumes declined by 7.0% to Kshs 12.0 bn, from Kshs 12.9 bn recorded the previous week. According to the Central Bank of Kenya’s weekly bulletin released on 19th February 2021, commercial banks’ excess reserves came in at Kshs 10.9 bn in relation to the 4.25% Cash Reserve Ratio.
Eurobonds performance:
During the week, the yields on Eurobonds recorded mixed performances. According to Reuters, the yields on the 10-year Eurobond issued in June 2014 declined by 0.1% points to 3.4% from 3.5% as was recorded the previous week. The yields on the 10-year and 30-year Eurobonds issued in 2018 both increased by 0.2% points to 5.2% and 7.2%, respectively. On the other hand, the yields on the 7-year bond issued in 2019 increased by 0.1% points to 4.6% from 4.5% recorded the previous week while the yields on the 12-year bond increased by 0.4% points to 6.2% from 5.8% recorded the previous week.
|
Kenya Eurobond Performance |
|||||
|
|
2014 |
2018 |
2019 |
||
|
Date |
10-year issue |
10-year issue |
30-year issue |
7-year issue |
12-year issue |
|
31-Dec-2020 |
3.9% |
5.2% |
7.0% |
4.9% |
5.9% |
|
12-Feb-2021 |
3.5% |
5.0% |
7.0% |
4.5% |
5.8% |
|
15-Feb-2021 |
3.5% |
5.1% |
7.0% |
4.5% |
6.0% |
|
16-Feb-2021 |
3.5% |
5.0% |
7.0% |
4.6% |
5.9% |
|
17-Feb-2021 |
3.7% |
5.3% |
7.2% |
4.7% |
6.2% |
|
18-Feb-2021 |
3.5% |
5.2% |
7.2% |
4.7% |
6.2% |
|
19-Feb-2021 |
3.4% |
5.2% |
7.2% |
4.6% |
6.2% |
|
Weekly Change |
(0.1%) |
0.2% |
0.2% |
0.1% |
0.4% |
|
YTD Change |
(0.4%) |
0.0% |
0.2% |
(0.3%) |
0.3% |
Source: Reuters
Kenya Shilling:
During the week, the Kenyan shilling depreciated by 0.1% against the US dollar to Kshs 109.6, from Kshs 109.5 recorded the previous week. This was mainly attributable to increased dollar demand from the energy sector and other general goods importers. On a YTD basis, the shilling has depreciated by 0.3% against the dollar, in comparison to the 7.7% depreciation recorded in 2020. We expect continued pressure on the Kenyan shilling due to:
- Demand from merchandise traders as they beef up their hard currency positions,
- A slowdown in foreign dollar currency inflows due to reduced dollar inflows from sectors such as tourism and horticulture, and,
- Continued uncertainty globally making people prefer holding dollars and other hard currencies.
However, in the short term, the shilling is expected to be supported by:
- The Forex reserves which are currently at USD 7.6 bn (equivalent to 4.7-months of import cover), which is above the statutory requirement of maintaining at least 4.0-months of import cover, and the EAC region’s convergence criteria of 4.5-months of import cover,
- The improving current account position which narrowed to 4.8% of GDP in the 12 months to December 2020 compared to 5.8% of GDP during a similar period in 2019, and,
- Improving diaspora remittances evidenced by a 19.7% y/y increase to USD 299.6 mn in December 2020, from USD 250.3 mn recorded over the same period in 2019, has cushioned the shilling against further depreciation.
Weekly Highlights:
A: The Energy and Petroleum Regulatory Authority (EPRA)
During the week, the Energy and Petroleum Regulatory Authority (EPRA) released their monthly statement on the Maximum wholesale and retail prices for fuel prices in Kenya effective 15th February 2021 to 14th March 2021. Below are the key take-outs from the statement:
- Petrol prices increased by 7.6% to Kshs 115.3 per litre, from Kshs 107.1 per litre previously, while diesel prices increased by 5.7% to Kshs 101.9 per litre, from Kshs 96.4 per litre. Kerosene prices also increased by 6.1% to Kshs 92.4 per litre, from Kshs 87.1 per litre.
- The changes in prices have been attributed to:
- An increase in the average landed cost of imported super petrol by 20.9% to USD 391.2 per cubic meter in January 2021, from USD 323.5 per cubic meter in December 2020,
- Average landed costs for diesel increased by 13.6% to USD 377.6 Per cubic meter, from USD 332.2 per cubic meter in December 2020,
- Landed costs for kerosene also increased by 14.6% to USD 347.2 per cubic meter from USD 303.0 Per cubic meter in December 2020,
- An 11.5% increase in Free on Board (FOB) price of Murban crude oil lifted in January 2021 to USD 55.3 per barrel, from USD 49.6 per barrel in December 2020, and,
- The Kenyan shilling appreciation by 0.6% against the dollar to close at Kshs 109.9 in January 2021, from Kshs 110.5 in December 2020.
We expect an increase in the transport and fuel index which carries a weighting of 8.7% in the total consumer price index (CPI) as a result of the increase in petrol and diesel prices at 7.6% and 5.7% respectively which will consequently result in an increase in the prices of other commodity baskets like food prices due to higher transport costs.
B: The International Monetary Fund (IMF)
During the week, the Kenyan authorities and the International Monetary Fund (IMF) mission team reached an agreement on economic and structural policies that would reinforce a 38-month program under the Extended Fund Facility (EFF) and Extended Credit Facility (ECF). Notably, the credit facility is of approximately USD 2.4 bn (Kshs 262.9 bn) and is meant help Kenya respond to the unprecedented shock of the COVID-19 pandemic as well as reduce Kenya’s debt levels. The agreement is subject to approval from IMF’s Management and Executive Board consideration, which is expected to happen in the coming weeks. The authorities’ program aims at:
- Reducing debt vulnerabilities through a multi-year fiscal consolidation effort, focused on raising revenue collection and tight control of spending which will deliver a primary balance that would stabilize the debt as a share of GDP and put it firmly on a downward trajectory. In return, resources for private investment will be endorsed, setting a strong base for durable growth,
- Advancing the structural reform and governance agenda, by addressing the shortcomings in some State-Owned Enterprises (SOEs) and ongoing efforts to strengthen transparency and accountability through the anti-corruption framework among others, and,
- Strengthening the monetary policy framework underpinning financial stability.
Given the uncertainty on the tenor of the pandemic and the continued effects of COVID-19 on the economy, risks abound on the gradual economic recovery. To this regard, the authority indicates that the program charts a clear path that will not only reduce Kenya’s debt vulnerabilities but also work towards freeing up investment resources that will provide a strong footing for sustained economic growth in the long term. We believe that the approval of the program will support Kenya’s COVID-19 response as well as support the government’s fiscal consolidation efforts that were clouded following the pandemic. Additionally, we believe that the switch from expensive commercial debts to concessional loans will help save on the cost of borrowing since such loans have more favourable terms and conditions than those offered by the commercial finance markets including the lower interest rate and deferred or income-contingent repayments. Moreover, revenue performance rate will continue being supported by further implementation of the post Covid-19, 2020-2022 Economic Recovery strategy.
Rates in the fixed income market have remained relatively stable due to the discipline by the Central Bank as they reject expensive bids. The government is 13.3% behind its prorated borrowing target of Kshs 527.7 bn having borrowed Kshs 305.6 bn. In our view, due to the current subdued economic performance brought about by the effects of the COVID-19 pandemic, the government will record a shortfall in revenue collection with the target having been set at Kshs 1.9 tn for FY’2020/2021, thus leading to a larger budget deficit than the projected 7.5% of GDP, ultimately creating uncertainty in the interest rate environment as additional borrowing from the domestic market may be required to plug the deficit. Owing to this uncertain environment, our view is that investors should be biased towards short-term to medium-term fixed income securities to reduce duration risk.
Market Performance:
During the week, the equities market recorded mixed performance, with NASI and NSE 25 gaining by 0.9% and 0.7% respectively, while NSE 20 declined marginally by 0.1 taking their YTD performance to gains of 8.9%,0.9% and 6.7% for NASI, NSE 20 and NSE 25 respectively. The equities market performance was driven by gains recorded by large-cap stocks such as BAT, KCB Group, Bamburi and DTB-K of 14.1%, 3.9%, 3.1% and 2.5%, respectively. The gains were however weighed down by losses recorded by stocks such as EABL and NCBA Group which declined by 2.3% and 1.6%, respectively.
Equities turnover declined by 19.1% during the week to USD 22.1 mn, from USD 18.6 mn recorded the previous week, taking the YTD turnover to USD 149.6 mn. Foreign investors turned net sellers, with a net selling position of USD 2.5 mn, from a net buying position of USD 1.3 mn recorded the previous week, taking the YTD net buying position to USD 0.1 mn.
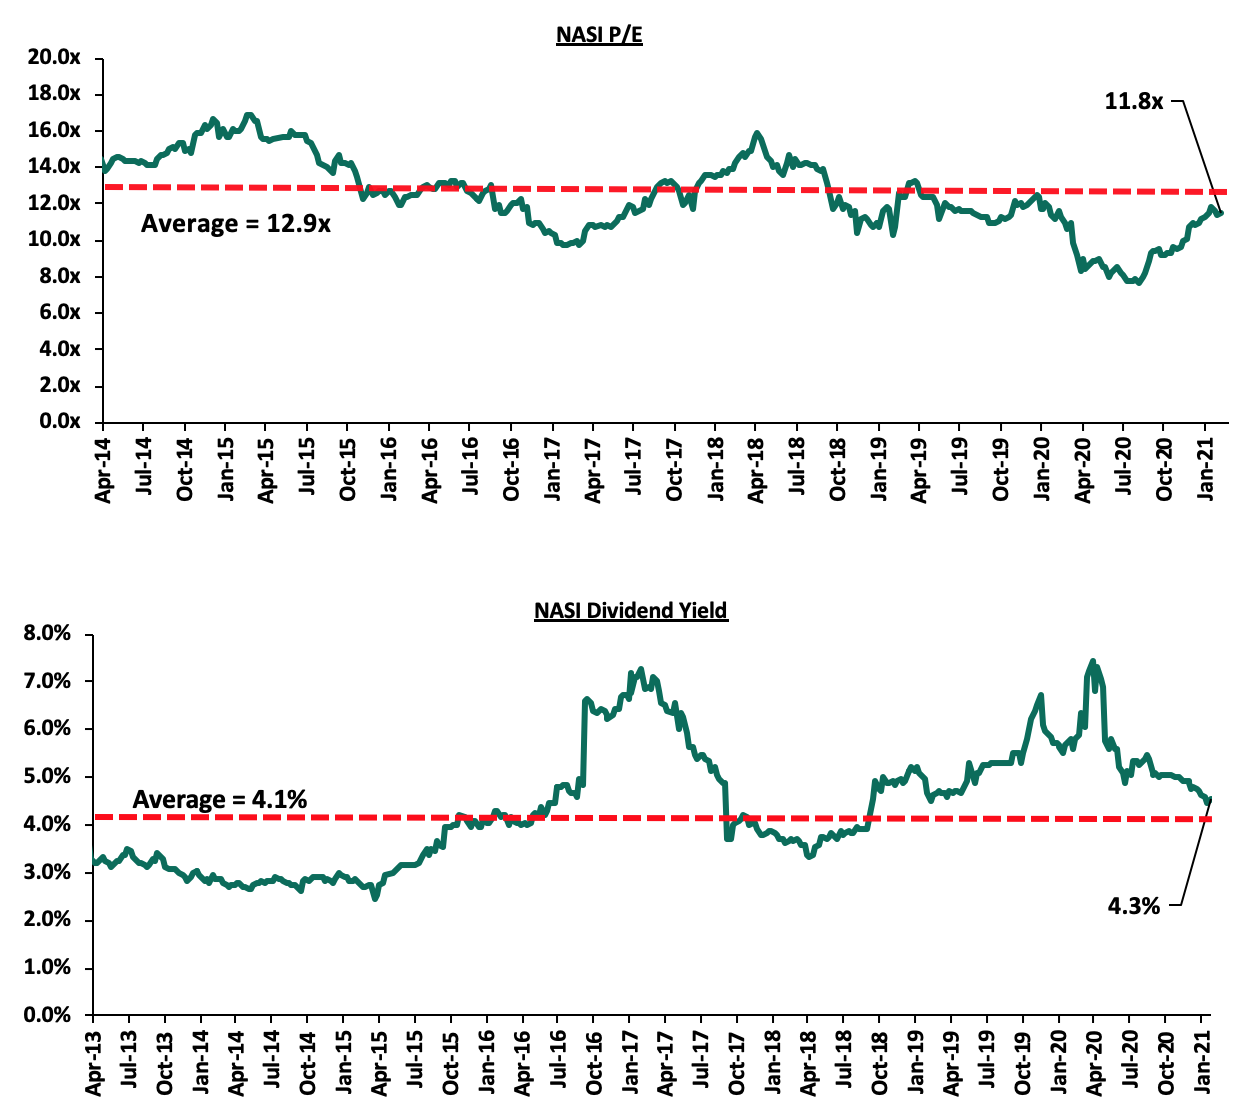
The market is currently trading at a price to earnings ratio (P/E) of 11.8x, 8.4% below the 11-year historical average of 12.9x. The average dividend yield is currently at 4.3%, unchanged from what was recorded the previous week, and 0.2% points above the historical average of 4.1%.
With the market trading at valuations below the historical average, we believe that there are pockets of value in the market for investors with a higher risk tolerance. The current P/E valuation of 11.8x is 53.8% above the most recent valuation trough of 7.7x experienced in the first week of August 2020. The charts below indicate the market’s historical P/E and dividend yield.
Universe of Coverage:
|
Banks |
Price at 12/02/2021 |
Price at 19/02/2021 |
w/w change |
YTD Change |
Year Open |
Target Price* |
Dividend Yield |
Upside/ Downside** |
P/TBv Multiple |
Recommendation |
|
Diamond Trust Bank*** |
69.0 |
70.8 |
2.5% |
(7.8%) |
76.8 |
105.1 |
3.8% |
52.4% |
0.3x |
Buy |
|
I&M Holdings*** |
45.0 |
44.8 |
(0.4%) |
(0.1%) |
44.9 |
60.1 |
5.7% |
39.8% |
0.7x |
Buy |
|
Sanlam |
11.3 |
10.1 |
(10.6%) |
(22.3%) |
13.0 |
14.0 |
0.0% |
38.6% |
1.1x |
Buy |
|
Kenya Reinsurance |
2.5 |
2.5 |
0.8% |
7.4% |
2.3 |
3.3 |
4.4% |
37.5% |
0.3x |
Buy |
|
Liberty Holdings |
7.5 |
7.5 |
(0.3%) |
(3.1%) |
7.7 |
9.8 |
0.0% |
31.4% |
0.6x |
Buy |
|
Britam |
7.3 |
7.0 |
(4.1%) |
0.0% |
7.0 |
8.6 |
3.6% |
26.4% |
0.8x |
Buy |
|
KCB Group*** |
38.0 |
39.5 |
3.9% |
2.9% |
38.4 |
46.0 |
8.9% |
25.3% |
1.0x |
Buy |
|
Standard Chartered*** |
135.0 |
135.0 |
0.0% |
(6.6%) |
144.5 |
153.2 |
9.3% |
22.7% |
1.1x |
Buy |
|
Jubilee Holdings |
276.0 |
265.3 |
(3.9%) |
(3.8%) |
275.8 |
313.8 |
3.4% |
21.7% |
0.7x |
Buy |
|
Co-op Bank*** |
12.7 |
12.8 |
0.8% |
2.0% |
12.6 |
14.5 |
7.8% |
21.1% |
1.0x |
Buy |
|
ABSA Bank*** |
9.6 |
9.6 |
0.2% |
1.1% |
9.5 |
10.5 |
11.4% |
20.6% |
1.2x |
Buy |
|
Equity Group*** |
37.9 |
38.5 |
1.6% |
6.1% |
36.3 |
43.0 |
5.2% |
17.0% |
1.1x |
Accumulate |
|
Stanbic Holdings |
85.0 |
84.0 |
(1.2%) |
(1.2%) |
85.0 |
84.9 |
8.4% |
9.5% |
0.8x |
Hold |
|
NCBA*** |
24.5 |
24.1 |
(1.6%) |
(9.6%) |
26.6 |
25.4 |
1.0% |
6.7% |
0.7x |
Hold |
|
CIC Group |
2.1 |
2.1 |
0.0% |
0.5% |
2.1 |
2.1 |
0.0% |
(0.9%) |
0.8x |
Sell |
|
HF Group |
3.5 |
3.5 |
0.3% |
11.8% |
3.1 |
3.0 |
0.0% |
(14.5%) |
0.1x |
Sell |
|
*Target Price as per Cytonn Analyst estimates **Upside/ (Downside) is adjusted for Dividend Yield ***Banks in which Cytonn and/ or its affiliates are invested in |
||||||||||
We are “Neutral” on the Equities markets in the short term. We expect the recent discovery of a new strain of COVID-19 coupled with the introduction of strict lockdown measures in major economies to continue dampening the economic outlook. However, we maintain our bias towards a “Bullish” equities markets in the medium to long term. We believe there exist pockets of value in the market, with a bias on financial services stocks given the resilience exhibited in the sector. The sector is currently trading at historically cheaper valuations and as such, presents attractive opportunities for investors.
Real Estate
- Industry Reports
During the week, the Kenya National Bureau of Statistics(KNBS) released the Leading Economic Indicators December 2020. The key take outs were as follows:
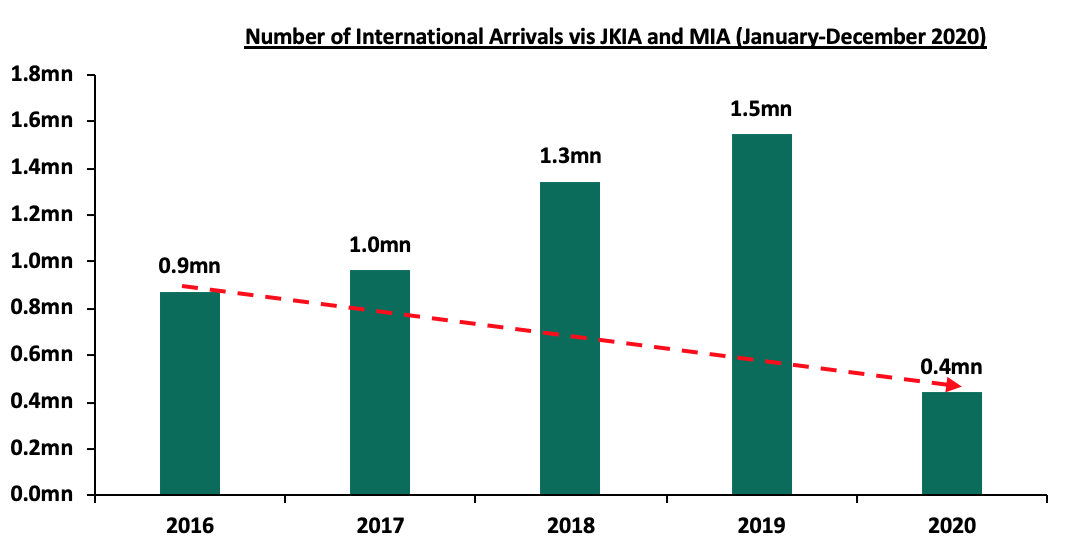
- The total number of international arrivals through Jomo Kenyatta International Airport (JKIA) and Moi International Airport (MIA) rose by 48.7% from 31,875 persons in November 2020 to 47,406 persons in December 2020. This is an indication of gradual recovery in the tourism industry which expected to boost the performance of the hospitality sector. The Hospitality sector which was the worst hit real estate by COVID-19 pandemic is expected to recover largely supported by government strategies such as the Ministry of Tourism post-corona recovery funds aimed at offering financial aid to hotel and other establishments in the hospitality industry through the Tourism Finance Corporation (TFC), recognition of Nairobi as a regional hub, repackaging of the tourism sector products to appeal to domestic tourists, and, relaxation of travel advisories and reopening of Kenya’s key tourism markets.
The graph below shows the number of international arrivals in Kenya in the last five years;
Source: Kenya National Bureau of Statistics
- Consumption of cement decreased by 6.9% from 760,769 metric tonnes in October 2020 to 710,685 metric tonnes in November 2020. However, in the entire year, consumption of rose by 19.6% from 5.4 mn metric tonnes in 2019 to 6.5 mn metric tonnes in 2020, attributed to the ongoing mega infrastructural projects such as the construction of the 21.7-kilometre Nairobi Expressway, 17-kilometre Western Bypass, and, the Lamu Port project among many others.
Given the above statistics, we expect the real estate sector to continue recording increased activities in the hospitality front supported by gradual recovery in the tourism industry, and, the expected increase in the number of building approvals following increase in development activities, which will translate to increased cement consumption.
- Residential Sector
A notable highlight during the week is;
- Unity Homes, a Kenyan residential property developer, announced plans to develop a Kshs 4.0 bn, 576-unit apartment complex dubbed Universal One, in the Lekki Free Zone in Lagos City, Nigeria in an international expansion drive. The units will be set up in Alaro City, a mixed-use master planned development featuring industries, logistics centres, offices and homes. The development will be backed by Rendeavour, an international urban real estate developer. The move by Unity Homes to expand their reach to other countries besides Kenya is an indication of investor confidence in the trend towards master planned developments, supported by: i) high developer returns, ii) security of returns for investors with a guarantee of increased value, and, iii) demand for investment grade real estate offering the live, work and play setting.
- Retail Sector
During the week, French Retailer Carrefour opened a new outlet at Centre Point Mall in Diani, Kwale County, in an expansion drive that saw it take up approximately 10,000 SQFT of space previously occupied by retail giant Nakumatt. This brings the retailers number of operational outlets to 11 having opened its first outlet outside Nairobi, in Mombasa County at City Mall in Nyali during the month of November 2020 and another outlet at Nextgen Mall along Mombasa Road, Nairobi, in January 2021.
The retailer aims to serve an even bigger customer base in Kwale County at the coastal region of Kenya supported by ; i) positive demographics with Kwale having a population of 866,820 as of 2019 which was a 33.4% growth from the 649,931 recorded in 2009, ii) a growing middle class with increased consumer purchasing power, iii) the area’s recognition as a major tourist destination in Kenya, due to its rich cultural heritage and proximity to the Indian Ocean, and, iv) improved infrastructure such as the ongoing construction of the Dongo- Kundu bypass enhancing ease of accessibility.
The table below shows the number of stores of key local and international retail supermarket chains in Kenya;
|
Main Local and International Retail Supermarket Chains |
||||||
|
Name of Retailer |
Initial number of branches |
Number of branches opened in 2021 |
Closed branches |
Current number of Branches |
Branches expected to be opened / closed |
Projected total number of branches 2021 |
|
Naivas Supermarket |
69 |
0 |
0 |
69 |
1 |
70 |
|
Tuskys |
52 |
0 |
14 |
52 |
27 |
25 |
|
QuickMart |
35 |
0 |
0 |
35 |
0 |
35 |
|
Chandarana Foodplus |
20 |
0 |
0 |
20 |
0 |
20 |
|
Carrefour |
9 |
2 |
0 |
11 |
0 |
11 |
|
Uchumi |
37 |
0 |
33 |
4 |
0 |
4 |
|
Game Stores |
3 |
0 |
0 |
3 |
0 |
3 |
|
Choppies |
15 |
0 |
13 |
2 |
0 |
2 |
|
Shoprite |
4 |
0 |
2 |
2 |
0 |
2 |
|
Nakumatt |
65 |
0 |
65 |
0 |
0 |
0 |
|
Total |
309 |
2 |
127 |
197 |
28 |
172 |
Source: Online Research
The taking up of space left by troubled retailers such as Nakumatt, and the continued expansion by local and international retailers is expected to cushion the retail sector, however, we expect the trend towards online shopping to continue affecting uptake of physical space whose oversupply in the Kenyan retail market currently stands at 2.0 mn SQFT.
The real estate sector is expected to continue recording activities supported by the gradual recovery of the tourism industry thus supporting the performance of the hospitality sector, and the expansion by international retailers.
Unit Trust Funds (UTFs) are collective investment schemes that pool funds from many different investors and are managed by professional Fund Managers. The fund managers invest the pooled funds in a portfolio of securities with the aim of generating returns in line with the specific objectives of the fund. Following the release of the Capital Markets Authority (CMA) Quarterly Statistical Bulletin – Q4’2020, we examine the performance of Unit Trust Funds, as the total Assets Under Management (AUM) have been steadily increasing and they are among the most popular investment options in the Kenyan market. We will further analyze the performance of Money Market Funds, a product under Unit Trust Funds. In our previous focus on Unit Trust Funds, we looked at the Q2’2020 Performance by Unit Trust Fund Managers. In this topical, we focus on the Q3’2020 performance of Unit Trust by Fund Managers, where we shall analyze the following:
- Performance of the Unit Trust Funds Industry,
- Performance of Money Market Funds,
- Comparing Unit Trust Funds AUM Growth with Bank Deposits Growth, and,
- Conclusion
Section I: Performance of the Unit Trust Funds Industry
Unit Trust Funds are investment schemes that pool funds from investors and are managed by professional Fund Managers. The fund manager invests the pooled funds with the aim of generating returns in line with the specific objectives of the fund. The Unit Trust funds earn returns in the form of dividends, interest income and/or capital gains depending on the asset class the funds are invested in. The main types of Unit Trust Funds include:
- Money Market Fund – This fund invests in short-term debt securities with high credit quality such as fixed deposits, treasury bills and commercial papers. Money Market Funds are suitable for risk averse investors as they provide stable fixed income returns with minimal risk while providing easy access to the cash,
- Equity Fund – This fund aims to offer superior returns over the medium to longer-term by maximizing capital gains and dividend income through investing in listed equity securities. The funds invest in various sectors to reduce concentration of risk and maintain some portion of the fund’s cash in liquid fixed income investments to be able to pay investors if need be without losing value,
- Balanced Fund – These are funds in whose investments are diversified across the Equities and the fixed income market. The Balanced Fund offers investors long-term growth as well as reasonable levels of stability of income,
- Fixed Income Fund – This fund invests in interest-bearing securities, which include treasury bills, treasury bonds, preference shares, corporate bonds, loan stock, approved securities, notes and liquid assets consistent with the portfolio’s investment objective, and,
- Sector Funds – These are funds that invest primarily in a particular sector or industry. The funds provide a greater measure of diversification within a given sector than may be otherwise possible for individual investors.
In line with Capital Market Regulations (2002) Part IV (32), Unit Trust Funds Managers released their Q3’2020 results. As per the Capital Markets Authority (CMA) Quarterly Statistical Bulletin – Q4’2020, the industry’s overall Assets Under Management (AUM) grew by 11.2% to Kshs 98.0 bn as at the end of Q3’2020, from Kshs 88.1 bn as at the end of Q2’2020. In the last three years, Assets Under Management of the Unit Trust Funds have grown at a CAGR of 20.5% to Kshs 98.0 bn in Q3’2020, from Kshs 56.0 bn recorded in Q3’2017.
This growth can be largely attributable to:
- Low Investments minimums: Unit Trust Funds have become more accessible to retail investors, with a majority of the Collective Investment Schemes’ (CIS) in the market requiring an initial investment ranging between Kshs 100.0 - Kshs 10,000.0,
- Investor Knowledge: There has been a drive towards investor education that has meant that more people are more aware and are taking advantage of this and investing,
- Diversified product offering: Unit Trust Funds are also advantageous in terms of offering investors the opportunity of diversifying their portfolios by providing them with access to a wider range of investment securities through pooling of funds, which would have not been accessible if they invested on their own,
- Efficiency and ease of access to cash/High Liquidity: Compared to other investment options such as equities, unit trusts are liquid, as it is easy to sell and buy units without depending on demand and supply at the time of investment or exit. Furthermore, the advent of digitization and automation within the industry has enhanced liquidity, enabling investors to receive their funds within 3 to 5 working days if they are withdrawing to their bank accounts, and immediate access to funds when withdrawing via M-Pesa, and,
- Emergence of Fintech: The financial services industry in the country is seeing its traditional model disrupted by technology and regulations; from March 2020 when the pandemic hit, many individuals and businesses have been forced to resort to technological avenues to curb the spread of the virus as they enforce social distancing. With the value of mobile money transactions growing at a 5-year CAGR of 10.4% to Kshs 4.6 bn from Kshs 2.8 in 2015, the reception of mobile money technology has increased financial inclusion, providing financial services to the ‘unbanked’, and as such, investing and divesting has been made easy for investors. Additionally, Fintech Inclusion has increased the efficiency of processing both payments and investments for fund managers.
According to the Capital Markets Authority, as at the end of Q3’2020 there were 19 active collective investment schemes. During the period under review, total Assets Under Management grew by 11.2% to Kshs 98.0 bn in Q3’2020, from Kshs 88.1 bn as at Q2’2020. The table below outlines the performance of Fund Managers of Unit Trust Funds in terms of Assets under Management:
|
Assets Under Management (AUM) for the Approved and Active Collective Investment Schemes |
||||||
|
No. |
Fund Managers |
Q2’2020 AUM |
Q2’2020 |
Q3’2020 AUM |
Q3’2020 |
AUM Growth |
|
(Kshs mns) |
Market Share |
(Kshs mns) |
Market Share |
Q2’2020 – Q3’2020 |
||
|
1 |
CIC Asset Managers |
36,313.7 |
41.2% |
40,524.2 |
41.4% |
11.6% |
|
2 |
BRITAM |
10,444.7 |
11.9% |
11,335.1 |
11.6% |
8.5% |
|
3 |
Commercial Bank of Africa |
9,263.0 |
10.5% |
11,040.0 |
11.3% |
19.2% |
|
4 |
ICEA Lion |
9,801.9 |
11.1% |
10,637.0 |
10.9% |
8.5% |
|
5 |
Old Mutual |
6,129.0 |
7.0% |
6,131.0 |
6.3% |
0.0% |
|
6 |
Sanlam Investments |
4,328.5 |
4.9% |
5,735.4 |
5.9% |
32.5% |
|
7 |
Dry Associates |
1,947.9 |
2.2% |
2,133.4 |
2.2% |
9.5% |
|
8 |
African Alliance Kenya |
1,907.4 |
2.2% |
1,785.6 |
1.8% |
(6.4%) |
|
9 |
Madison Asset Managers |
1,481.0 |
1.7% |
1,611.5 |
1.6% |
8.8% |
|
10 |
Co-op Trust Investment Services Limited |
1,156.4 |
1.3% |
1,474.8 |
1.5% |
27.5% |
|
11 |
Nabo Capital (Centum) |
1,284.4 |
1.5% |
1,456.4 |
1.5% |
13.4% |
|
12 |
Zimele Asset Managers |
1,206.2 |
1.4% |
1,275.8 |
1.3% |
5.8% |
|
13 |
Cytonn Asset Managers |
951.6 |
1.1% |
1,009.2 |
1.0% |
6.1% |
|
14 |
Genghis Capital |
655.4 |
0.7% |
556.0 |
0.6% |
(15.2%) |
|
15 |
Apollo Asset Managers |
498.4 |
0.6% |
549.5 |
0.6% |
10.3% |
|
16 |
Equity Investment Bank |
329.7 |
0.4% |
318.0 |
0.3% |
(3.5%) |
|
17 |
Amana Capital |
203.5 |
0.2% |
221.8 |
0.2% |
9.0% |
|
18 |
Alpha Africa Asset Managers |
192.4 |
0.2% |
203.4 |
0.2% |
5.7% |
|
19 |
Wanafunzi Investments |
0.2 |
0.0% |
0.7 |
0.0% |
316.9% |
|
|
Total |
88,095.1 |
100.0% |
97,998.6 |
100.0% |
11.2% |
Key to note from the above table:
- Assets Under Management: CIC Asset Managers remained the largest overall Unit Trust Fund Manager with an AUM of Kshs 40.5 bn in Q3’2020, from an AUM of Kshs 36.3 bn as at Q2’2020 translating to an 11.6% AUM growth,
- Market Share: CIC Asset Managers remained the largest overall Unit Trust with a market share of 41.4%, an increase from 41.2% in Q2’2020. Key to note, Sanlam Investments recorded the highest increase in its market share with the market share increasing by 1.0% points to 5.9% from 4.9% in Q2’2020, and,
- Growth: In terms of AUM growth, Wanafunzi Investments recorded the strongest growth of 316.9%, with its AUM increasing to Kshs 0.7 mn, from Kshs 0.2 mn in Q2’2020 due to the low base effect. Genghis Capital recorded the largest decline of 15.2%, with its market share declining to 0.6% from 0.7% in Q2’2020.
Section II: Performance of Money Market Funds
Money Market Funds (MMFs) in the recent past have gained popularity in Kenya, with one of the main reasons is the higher returns from money market funds compared to the returns on bank deposits. According to the Central Bank of Kenya data, the average deposit rate during the quarter declined to 6.4%, post the removal of the deposit rate cap floor in August 2018, from an average of 7.8% when the legislation was in place.
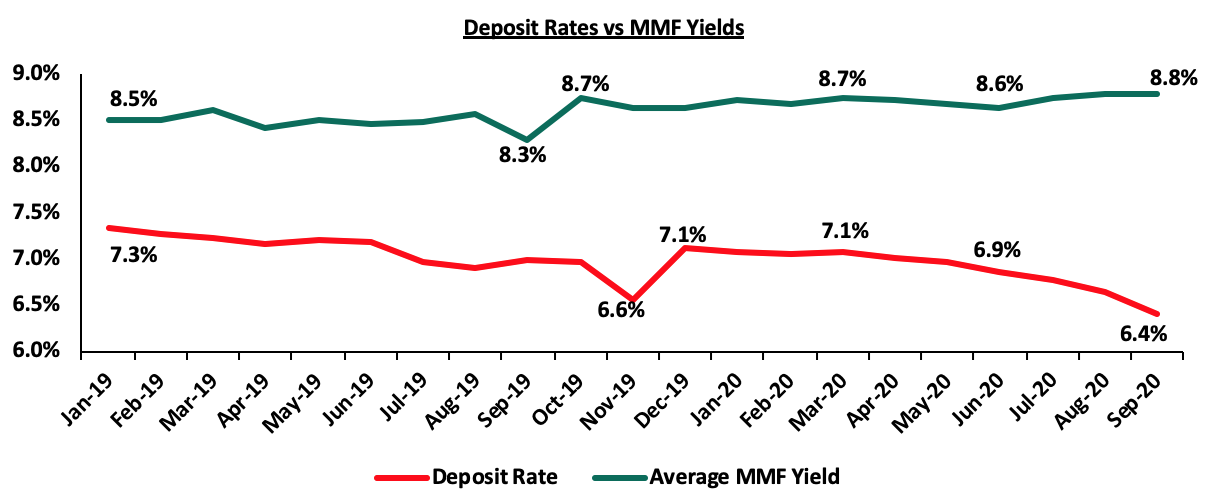
Source: CBK
As per regulations, funds in MMFs should be invested in liquid interest-bearing securities that have a weighted average maturity of less than 13 months. These securities include bank deposits, securities listed on NSE, and securities issued by the Government of Kenya. The Fund is best suited for investors who require a low-risk investment that offers capital stability, liquidity, and require a high-income yield. The Fund is also a good safe haven for investors who wish to switch from a higher risk portfolio to a low risk portfolio, especially during times of uncertainty.
Top Five (5) Money Market Funds by Yields:
During the period under review, the following Money Market Funds had the highest average effective annual yield declared, with the Cytonn Money Market Fund having the highest effective annual yield at 10.6% against the industrial average of 8.8%.
|
Top 5 Money Market Funds by Yield in Q3’2020 |
||
|
Rank |
Money Market Funds |
Effective Annual Rate (Average Q3’2020) |
|
1 |
Cytonn Money Market Fund |
10.6% |
|
2 |
GenCapHela Imara Money Market Fund |
10.2% |
|
3 |
Zimele Money Market Fund |
9.9% |
|
4 |
Alphafrica Kaisha Money Market Fund |
9.7% |
|
5 |
Nabo Africa Money Market Fund |
9.5% |
|
6 |
Madison Money Market Fund |
9.5% |
|
|
Industrial Average |
8.8% |
Section III: Comparing Unit Trust Funds AUM Growth with Bank Deposits Growth
Unit Trust Funds assets recorded a q/q growth of 11.2% in Q3’2020, compared to a q/q growth of 15.1% in Q2’2020, while the listed bank deposits recorded a q/q growth of 5.8% in Q3’2020, compared to a q/q growth of 6.6% recorded in Q2’2020. The chart below highlights the Unit Trust Funds AUM growth vs bank deposits growth over the last 3 years;

As shown in the above chart, the Unit Trust Funds’ growth of 11.2% outpaced the listed banking sector’s deposit growth of 5.8% in Q3’2020, an indication that there is increasing investor confidence in our capital markets. Since Q2’2020, UTF AUM growth outpaced bank deposits’ growth, attributable to improved investor knowledge coupled with the liquidity and higher yields offered by Unit Trust Funds over bank deposits. The 0.5% growth recorded in Q1’2020, which was 3.6% points lower than the listed banking sector’s growth is attributable to investor flight caused by the onset of the pandemic in the country which impacted the disposable income of individuals due to the subdued economic environment.
Despite Unit Trust Funds’ AUM growth outpacing that of listed banks, their AUM as at Q3’2020 stood at 2.8% of the listed banking sector’s deposits, which translates to the fact that businesses locally are still largely funded by banks which is not in line with the World Bank data, that shows that in well-functioning economies, businesses should rely get only 40.0% of their funding from banks and the larger percentage of 60.0% from Capital Markets. In Kenya, businesses rely on banks for a staggering 99.0% of their funding; with less than 1.0% coming from Capital Markets. Additionally, Kenya’s Mutual Funds / UTFs to GDP ratio at 5.4% is still very low compared to global average of 61.8%, showing that we still have room to improve and enhance our capital markets.
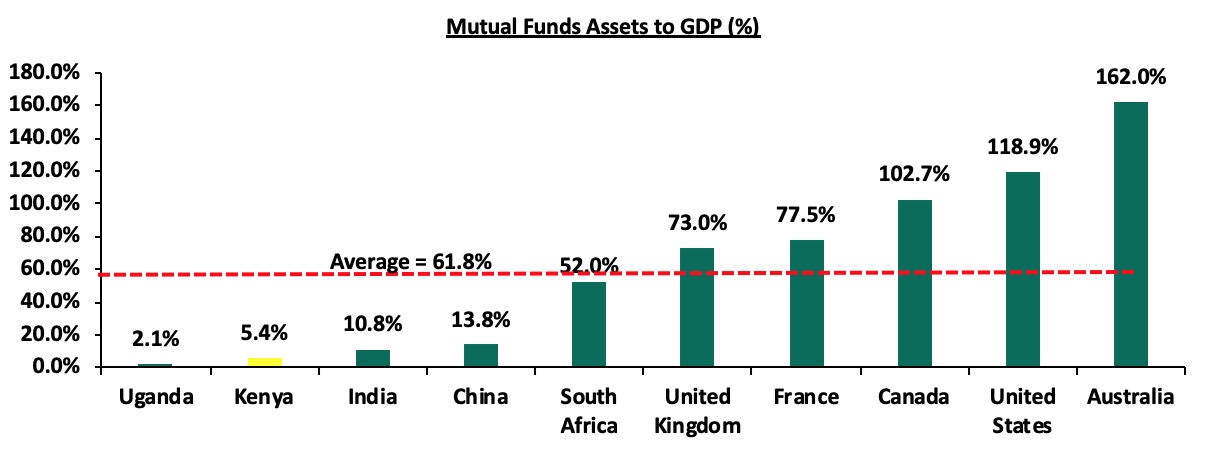
Source: World Bank Data
In order to improve our Capital Markets and stimulate its growth, we recommend the following actions:
- Improve fund transparency to provide investors with more information: Each Unit Trust Fund should be required to publish their portfolio holdings on a quarterly basis to enhance transparency for investors,
- Allow for sector funds: The current capital markets regulations require that funds must diversify. Consequently, one has to seek special dispensation in form of sector funds such as a financial services fund, a technology fund or a real estate UTF fund. Regulations allowing unit holders to invest in sector funds would expand the scope of unit holders interested in investing,
- Reduce the minimum investments to reasonable amounts: Currently, the minimum investment for sector specific funds is Kshs 1.0 mn, while that for Development REITS is currently at Kshs 5.0 mn. With the national median income for employed people estimated at around Kshs 50,000, the high minimum initial and top up investments amounts are unreasonably high and therefore lock out a lot of potential investors. Additionally, as compared to the Yu’eBao investment fund in China where the minimum investment is Kshs 17.5 (USD 0.16), these high amounts discriminate against most retail investors giving them fewer investment choices,
- Invest in more public training on matters capital markets so that we have more players coming into the market: The Capital Markets Authority and Unit Trust funds should increase their efforts in training investors on the various products offered in the market so as to increase investor knowledge and consequently increase investments in Unit Trust Funds,
- Eliminate conflicts of interest in the governance of capital markets: The capital markets regulations should enable a governance structure that is more responsive to market participants and market growth, and,
- Create increased competition in the market by encouraging different players to set shop and offer different services such as the opening up of Trustees to non-financial institutions: Competition in capital markets will not only push Unit Trust Fund managers to provide higher returns for investors but will also eliminate conflicts of interest in markets and enhance the provision of innovative products and services.
The Capital Markets Authority’s move to be more accommodative and expand the eligibility of trustees to include non-bank trustees such as corporate trustees is a step in the right direction for the growth of capital markets, since it eliminates the conflict of interest that existed where banks were mandatory trustees in a market where they are also competing for funds. The move also facilitates the development of complex financial products compared to plain vanilla investments such as bank deposits and government debt that banks invest in. The current review of the capital markets masterplan with the CMA bringing on board a consultant is also commendable since it will ensure the further development of the country’s capital markets.
Section IV: Conclusion
For continued growth of the capital markets, there is a need to leverage more on innovation and digitization in order to further propel the growth of UTFs in Kenya. For instance, China’s first online money market fund known as Yu’eBao has explosively grown into one of the world’s largest MMF with an AUM of USD 174.4 bn as at 30th September 2020, despite being launched in 2013. Yu’eBao of Tianhong Asset Management was launched as a spare cash management platform, allowing users to transfer idle cash as low as Kshs 17.5 (USD 0.16) into the money market fund, with the use of the Alipay e-wallet. The use of technology as a distribution channel for mutual fund products opened up the fund manager to the retail segment, which is characterized by strong demand among retail clients for convenient and innovative products.
Cytonn Asset Managers, which also leverages on technology such as USSD and digital platforms, experienced a growth of 42.9% to Kshs 1.0 bn in Q3’2020 from Kshs 0.7 bn in FY’2019. The advent of digitization and automation within the industry has also enhanced liquidity. Cytonn Money Market Fund clients can issue withdrawal instructions and have funds remitted to their bank accounts within 2–4 working days while funds withdrawn through the USSD or digital platforms are remitted to their M-Pesa and Bank accounts within 5 minutes and 2 working days respectively; the Cytonn Money Market Fund is accessible through dialing *809#. As highlighted in our topical Potential Effects of COVID-19 on Money Market Funds, we believe that amidst the Coronavirus pandemic, returns for Money Market Funds will remain stable with a bias to a slight increase upwards should rates on government securities increase. They will also remain the most liquid of all mutual funds providing a short-term parking bay that earns higher income yields compared to deposits and savings accounts. UTFs provide a more convenient platform in terms of accessibility and liquidity with the additional benefit of higher returns for investors.
Disclaimer: The views expressed in this publication are those of the writers where particulars are not warranted. This publication, which is in compliance with Section 2 of the Capital Markets Authority Act Cap 485A, is meant for general information only and is not a warranty, representation, advice or solicitation of any nature. Readers are advised in all circumstances to seek the advice of a registered investment advisor.

- Talk to us
- Kenya
- P.O Box 20695 - 00200, Nairobi, Kenya
- Cell +254709101200
- Tel +254709101200
- WhatsApp +254741676635
- United States
- +254709101200
- DOWNLOAD OUR APP
-


- Kenya
- 8th Floor, Pinetree Plaza, Kaburu Drive, Ngong Road, Nairobi, Kenya
- USA
- Suite 1150, 1775 Eye Street NW, USA, Washington DC 20006, USA
- Investments
- High Yield
- Private Equity
- Real Estate
- Real Estate
- RiverRun Estates
- Cytonn Towers
- The Ridge
- Taraji Heights
- The Alma