Unit Trust Funds Performance in First Half 2019, & Cytonn Weekly #38/2019
By Research Team, Sep 22, 2019
Executive Summary
Fixed Income
During the week, T-bills were oversubscribed, with the overall subscription rate rising to 103.7%, from 78.6% recorded the previous week. The oversubscription is partly attributable to favourable liquidity in the money market, following the end of the previous month’s Cash Reserve Requirement (CRR) cycle on 14th September. The yields on all the papers were on the rise, with the 91-day, 182-day and 364-day papers rising by 5.3 bps, 0.7 bps and 12.3 bps to 6.4%, 7.2% and 9.7%, respectively. For the month of September, the Kenyan Government re-opened two 15-year bonds, (FXD 1/2018/15) and (FXD 2/2019/15) in a bid to raise a total of Kshs 50.0 bn for budgetary support. The issue was undersubscribed, recording a subscription rate of 65.3%. The government accepted a yield of 12.6% and 12.7% for the FXD 1/2018/15 and FXD 2/2019/15, respectively. The Monetary Policy Committee (MPC) is set to meet on Monday, 23rd September 2019, to review the prevailing macro-economic conditions and decide on the direction of the Central Bank Rate (CBR). We expect the MPC to maintain the current policy stance due to the current uncertainty in the market around the Finance Bill 2019, which proposes removal of the interest rate cap law, but has been rejected by the National Assembly’s Departmental Committee on Finance and Planning. We are projecting the Y/Y inflation rate for the month of September to come in within the range of 4.0% - 4.4%, compared to 5.0% recorded in August;
Equities
During the week, the equities market was on an upward trend with NASI, NSE 25 and NSE 20 gaining by 0.8%, 0.9% and 0.5%, respectively, taking their YTD performance to gains / (declines) of 3.2%, (13.8%) and (2.2%), for NASI, NSE 20 and NSE 25, respectively. During the week, the proposal to repeal the interest rate cap in the Finance Bill 2019 was rejected, with Members of Parliament arguing it will subject Kenyans to expensive loans from commercial banks;
Private Equity
The Danish SDG (Sustainable Development Goals) Investment Fund has invested Danish Krone (DKK) 45.0 mn (Kshs 692.5 mn) in Africa Education Holding, which offers affordable high-quality programmes in labour market relevant studies of medicine, business, IT, law and social sciences. The investment was done in collaboration with Proparco, the French development agency and Finnfund, the Finnish development financier. FairMoney, a Paris-based FinTech startup focused on Nigeria, closed a Series A round of investment, raising USD 10.0 mn (Kshs 1.0 bn), led by Flourish, a venture of The Omidyar Group;
Real Estate
During the week, Sun Africa Hotels Group announced plans to put up luxury serviced apartments within Kilimani, set to be completed by Q3’2020, testament to the widely spreading serviced apartments concept in Kenya. In the industrial sector, Hotpoint, a local home electronics firm, launched an own-built business park off the Eastern Bypass, as more firms continue to relocate to less congested areas to develop custom-built industrial parks with modern logistics systems;
Focus of the Week
Following the release of Unit Trust Fund Managers' results for H1’2019, we examine the performance of Unit Trust Funds, “UTFs” as they are among the most popular investment options in the Kenyan market, with current Assets Under Management of Kshs 66.3 bn, up from Kshs 61.0 bn as at FY’2018, an annualized growth rate of 17.3%. Further, we narrow down our analysis to the performance of Money Market Funds, which are currently the most popular in terms of Assets Under Management, with 85.2% of UTFs being Money Market Funds. Lastly, we briefly look at the growth opportunity available when Money Market Funds optimally leverage on technology.
- Cytonn Money Market Fund closed the week at an average yield of 11.0% p.a. You can now invest and withdraw by dialing *809#;
- Edwin H. Dande, Chief Executive Officer, was at Zetech University to discuss the entrepreneurial mindset. Read the event note here.
- Caleb Mugendi, Assistant Manager – Public Markets, was on CNBC to discuss NSE performance. Watch Caleb here.
- Following the licensing of our regulated affiliate, Cytonn Asset Managers Limited, we are transitioning to an agency model and are looking for agents for our regional markets – Kisumu, Nakuru, Mt. Kenya, and Mombasa. If you have an existing financial services sales business and interested in being an agent in any of these regions, please email us at ifa@cytonn.com;
- Phase 1 of The Alma is now 100% sold with early buyers having achieved over 55% capital appreciation. We are now running a promotion in Phase 2: Buy a unit in Phase 2 with a 15-year payment plan and 0% deposit. For inquiries, please email us on clientservices@cytonn.com. The site is open between 8 am - 5 pm, 7-days a week for site visits;
- For an exclusive tour of Cytonn’s real estate developments, visit: Sharp Investor’s Tour and for more information, email us at sales@cytonn.com;
- Following the completion and handover of Amara Ridge in Karen, we have now launched our next Karen project, dubbed Applewood, a Kshs 2.5 bn residential development located in Miotoni, Karen. This signature development shall comprise luxury homes, each sitting on 1/2 acre. We invite you to the exhibition of Applewood which is ongoing at the Amara Ridge Clubhouse (Location pin: https://goo.gl/maps/B3GVnu8pHyn) or at the Applewood Sales Centre on Miotoni Road (Location pin: https://goo.gl/maps/ZfABuGjFo1z) from 9:00 am to 5:00 pm daily. Call 0709 101 000 or email resales@cytonn.comto reserve a villa! See Video here;
- We continue to hold weekly workshops and site visits on how to build wealth through real estate investments. The weekly workshops and site visits target both investors looking to invest in real estate directly and those interested in high yield investment products to familiarize themselves with how we support our high yields. Watch progress videos and pictures of The Alma, Amara Ridge, and The Ridge;
- We continue to see very strong interest in our weekly Private Wealth Management Training (largely covering financial planning and structured products). The training is at no cost and is open only to pre-screened participants. We also continue to see institutions and investment groups interested in the training for their teams. Cytonn Foundation, under its financial literacy pillar, runs the Wealth Management Training. If interested in our Private Wealth Management Training for your employees or investment group, please get in touch with us through wmt@cytonn.com. To view the Wealth Management Trainingtopics, click here;
- For recent news about the company, see our news section here;
- We have 10 investment-ready projects, offering attractive development and buyer targeted returns. See further details here: Summary of Investment-Ready Projects.
Money Markets, T-Bills & T-Bonds Primary Auction:
During the week, T-bills were oversubscribed, with the overall subscription rate rising to 103.7%, from 78.6% recorded the previous week. The oversubscription is partly attributable to favourable liquidity in the money market following the end of the previous month’s Cash Reserve Requirement (CRR Cycle) on 14th September. The yields on all the papers were on the rise, with the 91-day, 182-day and 364-day papers rising by 5.3 bps, 0.7 bps and 12.3 bps to 6.4%, 7.2% and 9.7%, respectively. The acceptance rate also rose to 85.4%, from 77.3% recorded the previous week, with the government accepting Kshs 21.3 bn out of the Kshs 24.9 bn worth of bids received.
For the month of September, the Kenyan Government re-opened two 15-year bonds, (FXD 1/2018/15) and (FXD 2/2019/15) in a bid to raise a total of Kshs 50.0 bn for budgetary support. The issue was undersubscribed recording a subscription rate of 65.3%, with the government receiving bids totalling to Kshs 32.6 bn against the Kshs 50.0 bn on offer. The government accepted a yield of 12.6% and 12.7% for the FXD 1/2018/15 and FXD 2/2019/15, respectively. The acceptance rate came in at 100.0%, with the government accepting the entire Kshs 32.6 bn worth of bids received.
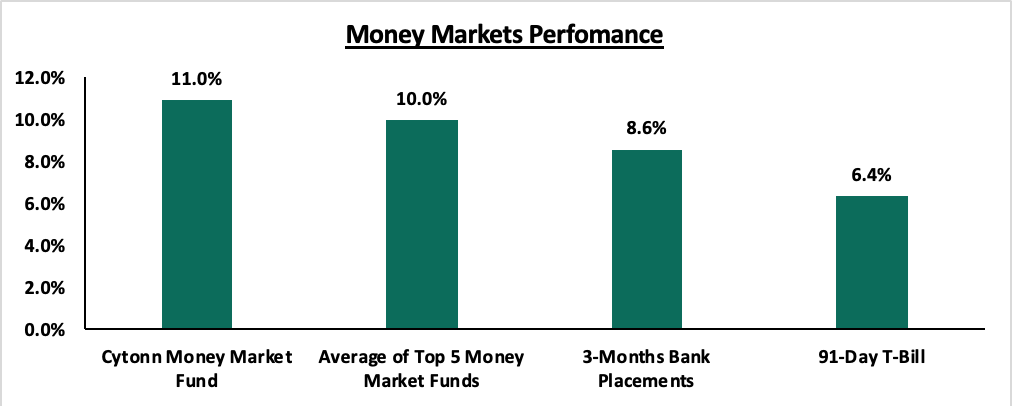
In the money markets, 3-month bank placements ended the week at 8.6% (based on what we have been offered by various banks), the 91-day T-bill came in at 6.4%, while the average of Top 5 Money Market Funds came in at 10.0%, unchanged from the previous week, with the Cytonn Money Market Fund closing the week at 11.0%, from 10.9% the previous week.
Liquidity:
During the week, liquidity was relatively favourable despite the average interbank rate increasing to 6.6%, from 6.4% recorded the previous week, following the end of the previous month’s Cash Reserve Requirement (CRR) cycle on 14th September. Pressure on liquidity however emanated from tax payments during the week with VAT having been due on 20th September. This saw commercial banks’ excess reserves increase to come in at Kshs 11.4 bn in relation to the 5.25% cash reserves requirement (CRR), from Kshs 4.1 bn the previous week. The average volumes traded in the interbank market declined by 46.2% to Kshs 5.4 bn, from Kshs 10.1 bn the previous week.
Kenya Eurobonds:
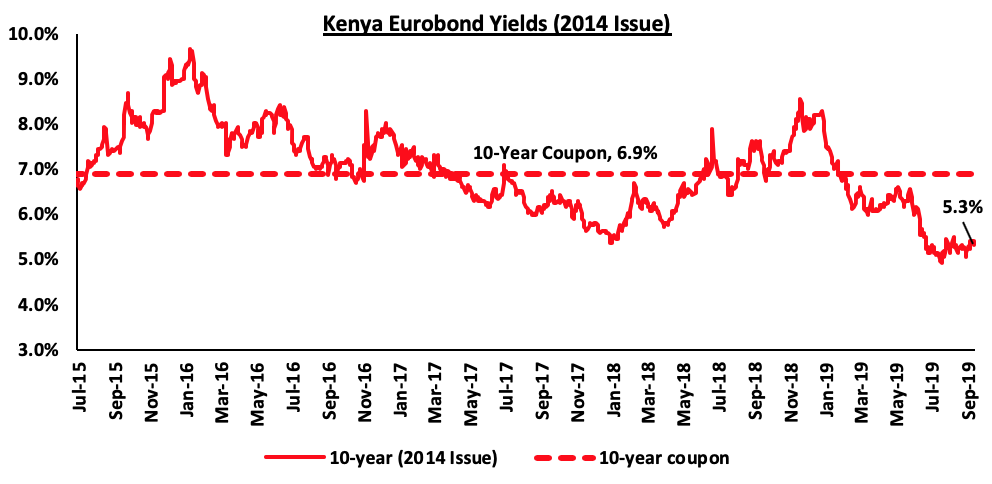
According to Reuters, the yield on the 10-year Eurobond issued in 2014 increased by 0.1% points to 5.3% during the week, from 5.2% the previous week. The rise in Eurobond yields in the past two weeks has been attributable to news that global rating firm Moody’s could further lower Kenya’s creditworthiness currently at ‘B2 stable’ following the completion of their periodic review on Kenya, where they raised concern over the country's very low fiscal strength, ballooning debt and rampant corruption.
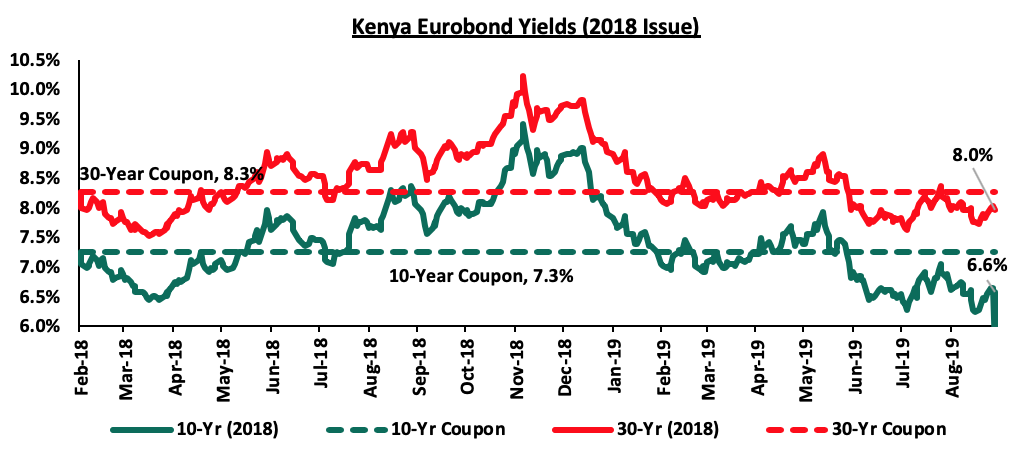
During the week, the yield on 2018, 10-year and 30-year Eurobond both increased by 0.2% points to 6.6% and 8.0%, from 6.4% and 7.8% recorded the previous week, respectively.
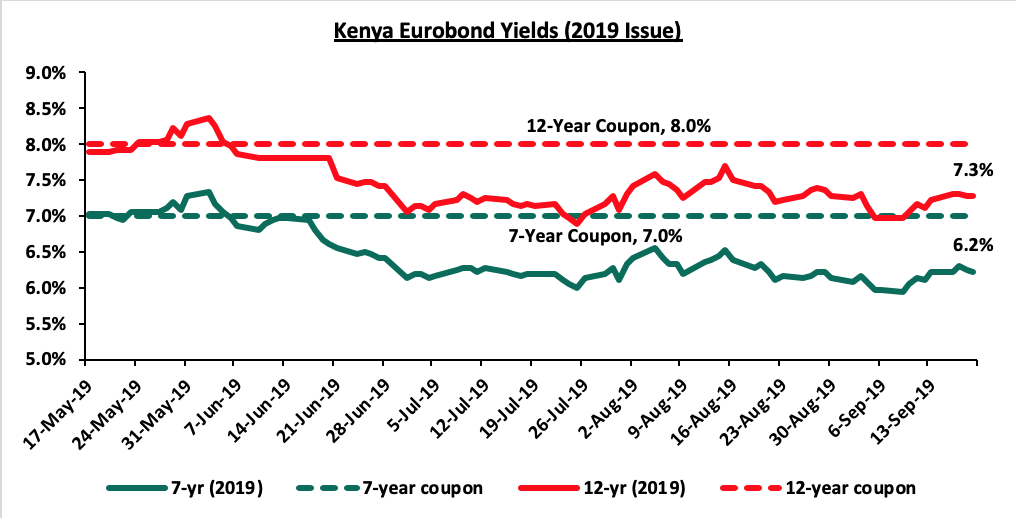
During the week, the yield on the 7-year Eurobond rose by 0.1% points to 6.2%, from 6.1% recorded the previous week, while the yield on the 12-year Eurobonds rose by 0.2% points to come in at 7.3%, from 7.1% recorded the previous week.
Kenya Shilling:
During the week, the Kenya Shilling remained stable against the US Dollar to close at Kshs 103.8, unchanged from the previous week, supported by inflows from diaspora remittances and inflows from offshore investors buying government debt, which aided in mitigating the pressure from liquidity in the local money market. On an YTD basis, the shilling has depreciated by 2.0% against the dollar, in comparison to the 1.3% appreciation in 2018. In our view, the shilling should remain relatively stable against the dollar in the short term, supported by:
- The narrowing of the current account deficit, with preliminary data indicating that the current account deficit narrowed to 4.2% of GDP in the 12-months to July 2019, from 5.0% recorded in December 2018. The decline has been attributed to the resilient performance of exports particularly horticulture and coffee, strong diaspora remittances, and higher receipts from tourism and transport services. Growth of imports also slowed mainly due to lower imports of food,
- Improving diaspora remittances, which have increased cumulatively by 8.9% in the 12-months to August 2019 to USD 2.8 bn, from USD 2.6 bn recorded in a similar period of review in 2018. The rise is due to:
- Increased uptake of financial products by the diaspora due to financial services firms, particularly banks, targeting the diaspora, and,
- New partnerships between international money remittance providers and local commercial banks making the process more convenient,
- CBK’s supportive activities in the money market, such as repurchase agreements and selling of dollars, and,
- High levels of forex reserves, currently at USD 9.1 bn (equivalent to 5.7-months of import cover), above the statutory requirement of maintaining at least 4.0-months of import cover, and the EAC region’s convergence criteria of 4.5-months of import cover.
Monetary Policy:
The Monetary Policy Committee (MPC) is set to meet on Monday, 23rd September 2019, to review the prevailing macro-economic conditions and decide on the direction of the Central Bank Rate (CBR). In their previous meeting held on 24th July 2019, the MPC maintained the CBR at 9.0%, citing that the economy was operating close to its potential and inflation expectations remained anchored within the target range, despite the possible spill-overs of the food and fuel price increases, thus the prevailing monetary policy stance remained appropriate. This was in line with our expectations as per our MPC Note, informed by the country’s macroeconomic fundamentals, which had remained stable as well as sustained optimism on the economic growth prospects, as evidenced by:
- Inflation expectations, which had remained within the target range of 2.5% - 7.5%, coming in at 5.7% in June, from 5.5% in May, mainly due to the base effect and a rise in the transport index, and,
- Increased private sector optimism as per the MPC Private Sector Market Perception Survey conducted in July 2019, which indicated that the private sector was optimistic about local economic prospects. The private sector expects stronger economic growth in 2019, supported by the continuing payment of pending bills, implementation of the Big 4 agenda projects, improved weather conditions and ongoing investments in public infrastructure.
The Monetary Policy Committee also noted that the current account deficit had narrowed to 4.2% of GDP in the 12-months to June 2019, compared to 5.4% in June 2018, supported by strong growth in diaspora remittances and resilient performance of horticultural exports. The decline was also partly supported by the slower growth in imports of food and equipment for the SGR project.
We expect the MPC to hold the CBR at 9.0% with their decision being supported by:
- Considering the heavy domestic debt maturities, which currently stand at Kshs 817.7 bn for FY’2019/20, we believe the MPC will maintain the CBR at the current rate, in order for the government to continue accessing domestic debt at cheaper rates. This however might have adverse effects of further crowding out of the private sector, and,
- Expectations of inflationary pressures remaining within the government set range of 2.5% - 7.5%. This is mainly due to expectations of lower food prices following improved weather conditions and lower electricity prices with the reduced reliance on expensive power sources.
We also expect the MPC to maintain the current policy stance due to the current uncertainty in the market around the Finance Bill 2019 that is proposing the removal of interest rate caps, which has been rejected by the National Assembly’s Departmental Committee on Finance and Planning. If it is repealed, the expectations are that the banks will have a bias in lending to the private sector, as banks would be able to price for risk even for more risky borrowers. This would have an impact on the yields on government securities, as they would have to adjust upwards in order to incentivize investors so that the government can meet its domestic borrowing target. With the uncertainty still in place, we expect the MPC to take a wait and see approach and thus maintain the CBR at 9.0%.
For our detailed MPC analysis, please see our MPC Note for the 23rd September 2019 meeting here.
Inflation Projections:
We are projecting the Y/Y inflation rate for the month of September to come in within the range of 4.0% - 4.4%, compared to 5.0% recorded in August. The Y/Y inflation for the month of September is expected to decline due to the base effect, with inflation having rocketed in September 2018 to 5.7%, from 4.0% in August 2018, due to an 8.0% % rise in the transport index following the implementation of VAT on fuel as well as:
- A decline in the food and non-alcoholic beverages index, which has a weighting of 36.0%, mainly driven by the low food prices especially grain and flour prices, with maize imports from Uganda having helped to stabilize flour prices ahead of the harvest season,
- We expect a marginal rise in the transport index following the 0.2% and 2.4% rise in petrol and diesel prices, respectively, during the month, and,
- A decline in the housing, water, electricity, gas, and other fuels index due to the 3.2% decline in kerosene prices to Kshs 100.6, from Kshs 104.0 in August.
Going forward, we expect the inflation rate to remain within the government set range of 2.5% - 7.5%.
Rates in the fixed income market have remained relatively stable as the government rejects expensive bids. A budget deficit is likely to result from depressed revenue collection with the revenue target for FY’2019/2020 at Kshs 2.1 tn, creating uncertainty in the interest rate environment as additional borrowing from the domestic market goes to plug the deficit. Despite this, we do not expect upward pressure on interest rates due to increased demand for government securities, driven by improved liquidity in the market owing to the relatively high debt maturities. Our view is that investors should be biased towards medium-term fixed income instruments to reduce duration risk associated with long-term debt, coupled with the relatively flat yield curve on the long-end due to saturation of long-term bonds.
Market Performance:
During the week, the equities market was on an upward trend with the NASI, NSE 25 and NSE 20 gaining by 0.8%, 0.9% and 0.5%, respectively, taking their YTD performance to gains/ (declines) of 3.2%, (13.8%) and (2.2%), for NASI, NSE 20 and NSE 25, respectively. The performance in NASI was driven by gains in NIC Group, KCB Group, Bamburi and Barclays Bank, which rose by 6.6%, 4.0%, 3.8% and 1.4%, respectively. The gains were weighed down by declines recorded in EABL, British American Tobacco (BAT) and Standard Chartered Bank Kenya, which recorded declines of 1.1%, 1.0% and 1.0%, respectively.
Equities turnover increased by 58.2% during the week to USD 27.3 mn, from USD 17.2 mn the previous week, taking the YTD turnover to USD 1.0 bn. Foreign investors turned net buyers for the week, with a net buying position of USD 5.5 mn, from a net selling position of USD 1.3 mn the previous week.
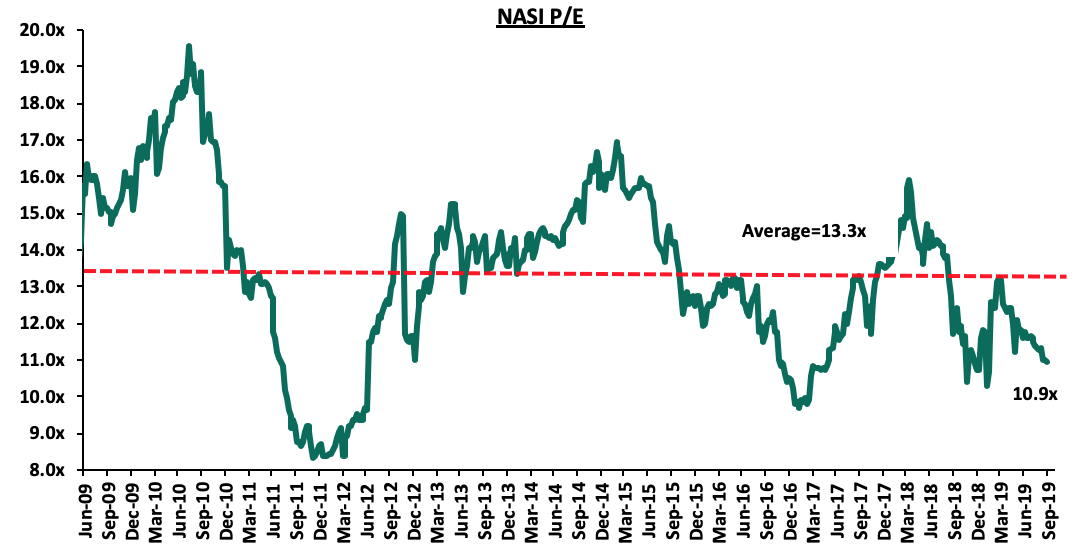
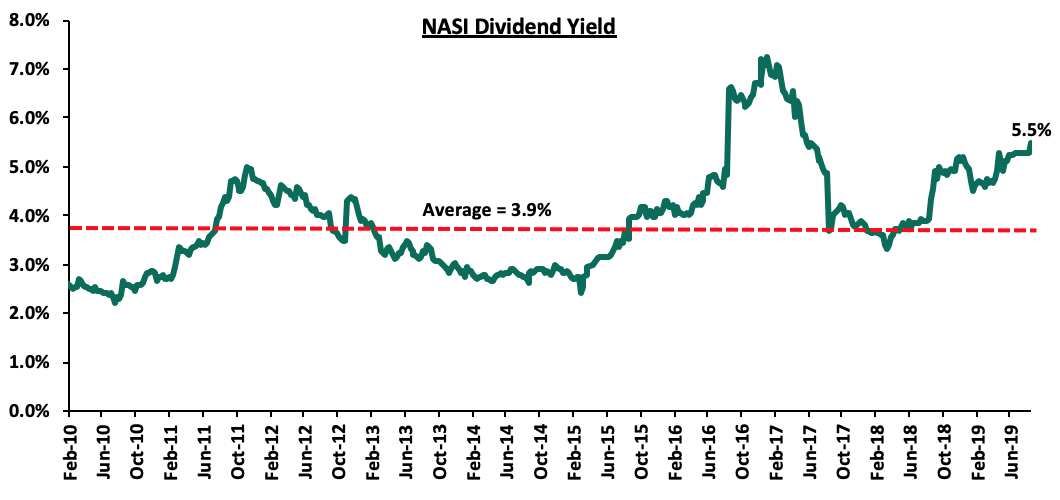
The market is currently trading at a price to earnings ratio (P/E) of 10.9x, 17.9% below the historical average of 13.3x, and a dividend yield of 5.5%, above the historical average of 3.9%. With the market trading at valuations below the historical average, we believe there is value in the market. The current P/E valuation of 10.9x is 12.6% above the most recent trough valuation of 9.7x experienced in the first week of February 2017, and 31.6% above the previous trough valuation of 8.3x experienced in December 2011. The charts below indicate the historical P/E and dividend yields of the market.
Weekly Highlights
During the week, the proposal by The National Treasury in the Finance Bill 2019 to repeal the current interest rate cap was rejected on grounds that it will subject Kenyans to expensive loans from commercial banks. The proposal, which involved amending section 33B of the Banking Act, was included in the Finance Bill 2019 that is currently before the National Assembly. Members of Parliament also cited that banks have continued to be profitable in the interest rate cap regime, and there is no guarantee from banks that a repeal would lead to increased lending to Micro, Small and Medium Enterprises (MSMEs), who have been the most affected by the rate cap. We however are of the view that banks’ profitability has largely come from a change in their business model to focus on the Non-Funded Income (NFI) segment, which increased by 16.8% in H1’2019 for listed banks, to contribute 37.7% of total income. On the other hand, profitability margins from the funded income segment have declined, as shown by the decline in Net Interest Margin (NIM) to 7.5% as at H1’2019, from 9.2% as at FY’2016. With a repeal of the law becoming seemingly unlikely, banks have been pushing to have the margin increased from the current 4.0% above the Central Bank Rate (CBR), with this proposal having been presented by a Member of Parliament in January of 2019. The proposal was to increase the margin from 4.0% above the CBR, to 6.0% above the current ceiling, implying the new cap would be at 19.0%, under the current CBR of 9.0%. The wider margin will likely allow borrowers to negotiate with banks their lending rate, depending on their credit score. We view this as a more tenable solution, which will likely see credit extension to those currently priced out under the current margins. As at June 2019, private sector credit growth stood at 5.2%, which is 6.4% points lower than the five-year average of 11.6%. Given that the law was meant to lower the cost of credit as well as improve accessibility of loans, it has had an adverse effect. In the current environment, banks have continued to prefer lending to the government, which offers higher risk adjusted returns. We thus continue to emphasize the need to repeal the interest rate cap as earlier highlighted in our topical Review of the Interest Rate Cap and promote competing sources of financing, thereby reducing the pricing monopoly by banks.
Universe of Coverage
|
Banks |
Price as at 13/09/2019 |
Price at 20/9/2019 |
w/w change |
YTD Change |
Target Price |
Dividend Yield |
Upside/ Downside |
P/TBv Multiple |
Recommendation |
|
KCB Group*** |
38.5 |
40.1 |
4.0% |
6.9% |
56.3 |
8.7% |
55.9% |
1.2x |
Buy |
|
Diamond Trust Bank |
110.5 |
112 |
1.4% |
(28.4%) |
180.8 |
2.3% |
55.9% |
0.8x |
Buy |
|
Sanlam |
19.0 |
17.9 |
(5.5%) |
(18.6%) |
29.0 |
0.0% |
53.0% |
0.7x |
Buy |
|
Kenya Reinsurance |
2.8 |
2.9 |
2.1% |
(16.9%) |
3.8 |
5.2% |
37.2% |
0.3x |
Buy |
|
Equity Group*** |
37.9 |
37.9 |
0.0% |
8.8% |
49.2 |
5.3% |
31.7% |
1.8x |
Buy |
|
Britam |
7.0 |
7.0 |
0.3% |
(31.0%) |
8.8 |
5.0% |
31.1% |
0.8x |
Buy |
|
CIC Group |
3.1 |
3.3 |
5.5% |
(15.8%) |
3.8 |
4.0% |
27.4% |
1.2x |
Buy |
|
Co-operative Bank*** |
12.0 |
12.1 |
1.3% |
(15.4%) |
14.1 |
8.3% |
25.5% |
1.1x |
Buy |
|
Barclays Bank*** |
10.8 |
10.9 |
1.4% |
(0.5%) |
12.0 |
10.1% |
25.2% |
1.5x |
Buy |
|
I&M Holdings |
45.7 |
45.0 |
(1.4%) |
5.9% |
63.5 |
7.8% |
23.2% |
1.2x |
Buy |
|
NIC Group |
28.1 |
29.9 |
6.6% |
7.6% |
36.3 |
3.3% |
22.1% |
0.7x |
Buy |
|
Liberty Holdings |
10.0 |
10.5 |
5.2% |
(18.6%) |
11.3 |
4.8% |
18.0% |
0.8x |
Accumulate |
|
Jubilee holdings |
370.0 |
350.0 |
(5.4%) |
(13.5%) |
418.5 |
2.6% |
15.7% |
1.1x |
Accumulate |
|
Stanbic Holdings |
96.0 |
96.0 |
0.0% |
5.8% |
94.9 |
6.1% |
1.9% |
0.8x |
Lighten |
|
Standard Chartered |
196.0 |
193.0 |
(1.5%) |
(0.8%) |
183.5 |
6.5% |
0.8% |
1.4x |
Lighten |
|
National Bank |
4.1 |
4.1 |
0.0% |
(22.6%) |
3.5 |
0.0% |
(15.4%) |
0.3x |
Sell |
|
HF Group |
5.5 |
5.8 |
5.5% |
4.7% |
2.9 |
0.0% |
(47.3%) |
0.3x |
Sell |
|
*Target Price as per Cytonn Analyst estimates **Upside / (Downside) is adjusted for Dividend Yield ***Banks in which Cytonn and/or its affiliates are invested in |
|||||||||
We are “Positive” on equities for investors as the sustained price declines has seen the market P/E decline to below its historical average. We expect increased market activity, and possibly increased inflows from foreign investors, as they take advantage of the attractive valuations, to support the positive performance.
During the week, there was private equity activity in the education sector, with the Danish SDG (Sustainable Development Goals) Investment Fund investing Danish Krone (DKK) 45.0 mn (Kshs 692.5 mn) in Africa Education Holding, which offers affordable high-quality programmes in labour market relevant studies of medicine, business, IT, law and social sciences, for an undisclosed stake. This was done in collaboration with Proparco, the French development agency, who invested USD 7.0 mn (Kshs 726.9 mn) as well as Finnfund, the Finnish development agency which invested an undisclosed amount.
The Danish SDG Investment Fund, a DKK 4.1 bn (Kshs 63.1 bn) fund, was launched in June 2018 by the Danish government in collaboration with six top pension funds from Denmark, with the aim of promoting the United Nation’s 17 global goals, which includes inclusive and equitable quality education. The fund is managed by the IFU, which also manages the Danish Climate Investment Fund and the Danish Agribusiness Fund. This will be the first investment by the fund in Africa, and its second overall, with its previous investment being DKK 37.0 mn (Kshs 569.4 mn) in an Ukranian solar power plant in January 2019.
Africa Education Holding owns and operates two universities: Cavendish University Uganda and Cavendish University Zambia. The company intends to use part of the capital raised to increase its portfolio of universities in East and West Africa, improve the quality of education, and increase university intake, thereby complementing public universities that can only admit around one third of all applicants. The investment will also enable Africa Education Holding to train nearly 43,000 students over the next five-years and to support more than 2,000 direct and indirect jobs.
In the FinTech sector, FairMoney, a Paris-based FinTech startup focused on Nigeria, closed a Series A round of investment, raising USD 10.0 mn (Kshs 1.0 bn), led by Flourish, a venture of The Omidyar Group, a family-founded impact investment firm with operations in Asia, North America and Africa. The funding round was also boosted by existing seed investors; DST Global, a Hong Kong-based investment company that funds late-stage ventures in the global internet industry, Newfund, and Le Studio VC, French venture capital firms, and Speedinvest, an Austrian venture capital firm.
Launched in 2017, FairMoney started as a mobile app that uses alternative smartphone data to underwrite micro-credit in Nigeria. It has grown to its current portfolio of over 200,000 customers, mostly SMEs who are looking to expand their businesses. Its value proposition is the underwriting process that enables the loans to be disbursed in five minutes, thus improving access to capital for the unbanked population in Nigeria. The funds raised from this round of financing are expected to be channelled to scale the company’s engineering team in order to develop a fully-fledged mobile banking offering in Nigeria and beyond, being part of its larger vision of building a holistic financial platform for underserved customers in emerging markets.
The continued increase in investments and funding of mobile lending apps is an indicator of the positive investor sentiment in the FinTech sector. One of the biggest drivers in this sector is the provision of access to credit, which we expect to grow, fuelled by the expected increase in demand for mobile loans.
Private equity investments in Africa remain robust as evidenced by the increasing investor interest, which is attributed to; (i) rapid urbanization, a resilient and adapting middle class and increased consumerism, (ii) the attractive valuations in Sub Saharan Africa’s private markets compared to its public markets, (iii) the attractive valuations in Sub Saharan Africa’s markets compared to global markets, and (iv) better economic projections in Sub Sahara Africa compared to global markets. We remain bullish on PE as an asset class in Sub-Sahara Africa. Going forward, the increasing investor interest and stable macro-economic environment will continue to boost deal flow into African markets.
Hospitality Sector
During the week, Sun Africa Hotels Group announced plans to put up luxury serviced apartments in Hurlingham, Kilimani, at an estimated total cost of Kshs 1.0 bn. The project whose completion is set for Q3’2020, will comprise of twenty studios and one-bedroom units (unit sizes undisclosed) and will target business and leisure travelers. Serviced apartments have continued to gain traction in Kenya especially for use by holiday guests who are travelling as families and for business travelers looking for mid to long-term accommodation. Unlike a hotel, a serviced apartment can easily accommodate a family in addition to giving occupants the comfort and permanence of a home but with the full benefits offered by a hotel. Generally, the demand for high-end hospitality facilities in Nairobi has been high evidenced by data from the KNBS Economic Survey Report 2019, according to which, upmarket facilities recorded 1.4 mn bed-nights in 2018, 108.7% higher than other lower class facilities within Nairobi, which recorded 657,000 bed-nights. Investors are therefore increasingly focusing on serviced apartments due to their enhanced performance, which is driven by:
- Higher Occupancy – As per the KNBS Statistical Abstract 2017, serviced apartments registered average occupancy of 70.0%, in comparison to traditional hotels with 35.5% (KNBS). This means higher revenues for serviced apartments investors,
- Diversification – Renowned brands stand to benefit from branded serviced apartments as they attract brand-loyal clientele. Other notable hotel groups with a serviced apartments pipeline include Marriott and Radisson Group,
- Demand by High Net Worth Individuals – According to AfrAsia Bank Wealth Report 2019, Kenya had 8,600 high net worth individuals, out of which 6,200 were from Nairobi, with a total wealth of USD 93.0 bn, the fifth highest in Africa after South Africa, Egypt, Morocco, and Nigeria. According to the report, prime residential property constitutes 25.0% - 30.0% of these individuals’ wealth, and,
- Growth of Meetings, Incentive, Conferences and Exhibitions (MICE) Tourism in Kenya - According to Economic Survey 2019, the number of international conferences held in Kenya expanded by 6.8% to 204 in 2018 compared to 191 in 2017. This was boosted by high profile international conferences held in the country and visits by foreign dignitaries during the year.
In terms of performance, according to our 2018 Serviced Apartments Report, studios and one-bedroom units were the best performing with relatively high yields of 13.5% and 9.4%, respectively, in comparison to the overall market average of 7.4%. Kilimani and Westlands were the best performing nodes with yields of 10.9% and 10.6%, respectively, an indicator of their potential as investment opportunities for serviced apartments.
(all values in Kshs unless stated otherwise)
|
2018 Serviced Apartments Performance |
||
|
Node |
Occupancy 2018 |
Rental Yield 2018 |
|
Kilimani |
86.0% |
10.9% |
|
Westlands& Parklands |
76.0% |
10.6% |
|
Limuru Road |
84.0% |
9.7% |
|
Kileleshwa& Lavington |
83.0% |
7.8% |
|
Nairobi CBD |
74.0% |
5.7% |
|
Upperhill |
60.0% |
5.3% |
|
Mombasa Road |
85.0% |
5.0% |
|
Thika Road |
90.0% |
4.4% |
|
Average |
80.0% |
7.4% |
|
Kilimani was the best performing node recording high occupancy rates of 86.0%, and rental yields of 10.9%. |
||
Cytonn Research - 2018
Other Highlights:
Hotpoint, a locally-based home electronics firm, launched its new headquarters in Sukari Industrial Estate, off the Eastern Bypass. The complex (size undisclosed) will house the firm’s main offices as well as industrial park. The move is testament to the continued relocation by big firms and industrial investors in Kenya to less crowded areas such as Ruiru for development of customized industrial spaces that are in line with modern business requirements such as modernized logistics system, incorporation of mixed-use (office and industrial), and ease of access especially to key logistic hubs such as the Jomo Kenyatta International Airport, the Inland Container Depot (ICD), and the Standard Gauge Railway (SGR) station, which is facilitated by the ongoing infrastructural improvements such as the Eastern Bypass.
We remain neutral on the real estate sector’s performance largely due to reduced activity from major sectors as investors realign with alternative concepts such as serviced apartments and affordable housing. We also expect more investor focus towards mixed-use developments as a means to diversify their returns.
Unit Trust Funds, “UTFs”, are collective investment schemes that pool money together from many investors and are managed by professional Fund Managers, who invest the pooled funds in a portfolio of securities to achieve objectives of the trust. Following the release of Unit Trust Fund Managers’ results for H1'2019, we examine the performance of Unit Trust Funds, as they are among the most popular investment options in the Kenyan market. Further, we narrow down to analyze the performance of Money Market Funds, a product under Unit Trust Funds, currently the most popular in terms of Assets Under Management, with 85.2% of the UTF market. In our previous focus on Unit Trust Funds, we looked at the FY’2018 Performance by Unit Trust Fund Managers. In this week’s focus, we continue our analysis on the H1’2019 performance by Unit Trust Fund Managers, and we shall analyze the following:
- Performance of the Unit Trust Funds Industry,
- Performance of Money Market Funds, and,
- Conclusion
Section I: Performance of the Unit Trust Funds Industry
As defined above, Unit Trust Funds are essentially investment schemes that pool money from investors, which are managed by a professional Fund Manager who invests the pooled funds in a portfolio of securities to achieve objectives of the trust. The funds in the unit trust earn returns in the form of dividends, interest income and/or capital gains depending on the asset class the funds are invested in. The main types of Unit Trust Funds include;
- Money Market Fund – This fund mainly invests in short-term debt securities with high credit quality such as bank deposits, treasury bills, and commercial paper. An example is the Cytonn Money Market Fund (CMMF);
- Equity Fund – This fund aims to offer superior returns over the medium to longer-term by maximizing capital gains and dividend income through investing in listed equity securities;
- Fixed Income Fund – This fund invests in interest-bearing securities, which include treasury bills, treasury bonds, preference shares, corporate bonds, loan stock, approved securities, notes and liquid assets consistent with the portfolio’s investment objective; and;
- Balanced Fund – This fund invests in a diversified spread of equities and fixed income securities with the objective to offer investors a reasonable level of current income and long-term capital growth.
In line with Capital Market Regulations (2002) Part IV (32), Unit Trust Funds Managers released their H1’2019 results, which showed that the overall Assets Under Management (AUM) of the industry grew at an annualized rate of 17.3% to Kshs 66.3 bn in H1’2019, from Kshs 61.0 bn as at FY’2018. In the last two-years, Assets Under Management of the Unit Trust Funds have grown at a CAGR of 6.1%. This growth can be largely attributable to:
- Affordability to Retail Investors: Unit Trust Funds are accessible to retail investors, with several Collective Investment Schemes’ (CIS) initial investment contributions and additional investments being affordable; majority of unit trusts requiring an initial investment ranging between Kshs 1,000.0 - Kshs 10,000.0, and additional monthly investments ranging between Kshs 1,000.0 and Kshs 5,000.0,
- Diversification: Unit Trust Funds are also advantageous in terms of diversification as investors can access a wider range of instruments, than if they invested on their own, and,
- Liquidity: Compared to other investment options such as equities, unit trusts are liquid, as it is easy to sell and buy units without depending on supply and demand at the time of investment or exit.
According to the Capital Markets Authority, there are 25 approved collective investment schemes made up of 88 funds in Kenya as of Q2’2019. The table below outlines the performance of Fund Managers of Unit Trust Funds in terms of Assets Under Management:
|
No. |
Fund Managers |
FY'2018 AUM (Kshs Mns) |
H1'2019 AUM (Kshs Mns) |
AUM H1'2019 Annualized Growth |
|
1 |
CIC Asset Management |
20,270.8 |
24,048.1 |
37.3% |
|
2 |
British American Asset Managers |
8,841.6 |
8,857.1 |
0.4% |
|
3 |
ICEA Lion |
6,951.9 |
7,566.7 |
17.7% |
|
4 |
Old Mutual |
6,578.8 |
6,403.3 |
(5.3%) |
|
5 |
Commercial Bank of Africa |
5,189.7 |
6,328.2 |
43.9% |
|
6 |
African Alliance Kenya |
2,160.2 |
2,237.3 |
7.1% |
|
7 |
Stanlib Kenya |
2,141.0 |
1,983.3 |
(14.7%) |
|
8 |
Sanlam Investments |
1,751.0 |
1,673.6 |
(8.8%) |
|
9 |
Madison Asset Managers |
1,225.4 |
1,463.0 |
38.8% |
|
10 |
Dry Associates |
1,014.5 |
1,452.8 |
86.4% |
|
11 |
Zimele Asset Managers |
874.6 |
1,009.7 |
30.9% |
|
12 |
Nabo Capital (Centum) |
880.8 |
927.1 |
10.5% |
|
13 |
Amana Capital |
787.0 |
642.1 |
(36.8%) |
|
14 |
Equity Investment Bank |
690.7 |
512.7 |
(51.5%) |
|
15 |
Genghis Capital |
468.5 |
472.0 |
1.5% |
|
16 |
Cytonn Asset Managers |
62.8 |
302.6 |
764.2% |
|
17 |
Apollo Asset Managers |
276.0 |
283.9 |
5.7% |
|
18 |
Alpha Africa Asset Managers |
0.0 |
154.3 |
- |
|
19 |
Co-op Trust Investment Services Limited |
0.0 |
12.3 |
- |
|
|
Total |
61,038.8 |
66,330.1 |
|
From the above table, we note the following observations:
- Market Share: CIC Asset Managers remains the largest overall Unit Trust Fund Manager with an AUM of Kshs 24.0 bn in H1’2019, from an AUM of Kshs 20.3 bn as at FY’2018, occupying a market share of 36.3%.
- Growth: In terms of growth, however, Cytonn Asset Managers recorded the strongest annualized growth of 764.2%.
Among unit trust products, Money Market Funds continue to be the most popular product in terms of market share, with 85.2% of the market as shown in the table below;
(all values in Kshs Mns unless stated otherwise)
|
Assets Under Management by Type of Collective Investment Scheme |
|||||
|
No. |
Product |
FY'2018 AUM |
H1'2019 AUM |
FY'2018 Market Share |
H1'2019 Market Share |
|
1 |
Money Market Funds |
50,642.3 |
56,521.5 |
83.0% |
85.2% |
|
2 |
Equity Fund |
4,624.4 |
4,523.0 |
7.6% |
6.8% |
|
3 |
Balanced Fund |
1,771.6 |
2,003.7 |
2.9% |
3.0% |
|
4 |
Others |
4,000.4 |
3,281.9 |
6.6% |
4.9% |
|
Total |
61,038.8 |
66,330.1 |
100.0% |
100.0% |
|
During the period under review, Equity Funds recorded a decline in Asset Under Management, and thus market share, on account of poor performance in the equities markets and high stock volatility in 2018. With the stock market as measured by the index NASI declining by 18.0% in 2018, a number of local individual and institutional investors would have experienced losses on their portfolios, which may not go well with their risk appetites and would likely have led to the decline in Equity Funds AUM in H1’2019 as investors pulled funds out. While Equity Funds have the potential to outperform stock market indices and deliver better yields than Money Market Funds over the medium to long-term, preservation of capital in Money Market Funds might be the main contributory factor for its popularity in Kenya. Balanced Funds, on the other hand, rank third in comparison to other products. Balanced Funds offer investors a reasonable level of current income and long-term capital growth, achieved by investing in a diversified spread of equities and fixed income securities. Having a medium risk profile, Balanced Funds carry a high potential for growth in the near future as they are suitable for pension schemes, treasury portfolios of institutional clients, co-operatives and high-net-worth individuals amongst others. The Other Funds include Income Funds, Growth Funds, Wealth Funds, Diversified Funds and Bond Funds.
Section II: Performance of Money Market Funds
Money Market Funds (MMFs) in the recent past have gained popularity in Kenya with growth rates outperforming that of bank deposits. This much faster growth of MMFs relative to bank deposits may be attributable to the removal of the deposit rate cap floor in August 2018 by the National Assembly that initially required banks to pay at least 70.0% of the Central Bank Rate (CBR) base rate on deposits. The removal of the savings rate control meant that banks were free to price the rate at which they would pay depositors for the use of their funds and thus, investors could no longer enjoy attractive returns from their deposits. With Money Market Funds, in contrast, investors are able to get attractive yields from their investments owing to MMFs having a diversified asset allocation and being actively managed to ensure asset classes with the highest returns are invested in. Under this type of fund, funds are invested in liquid interest-bearing securities that have a weighted average maturity of less than 12-months. These securities include bank deposits and other short-term money market instruments including short-dated treasury bills and commercial papers. The Fund is best suited for investors who require a low-risk investment that offers capital stability, liquidity and a high-income yield. The Fund is also a good safe haven for investors who wish to switch from a higher risk portfolio to a low risk, high-interest portfolio, especially during times of high stock market volatility.
Summarized performance of Money Market Funds in H1’2019;
- The Total Assets Under Management (“AUM”) held by Money Market Fund Managers grew at an annualized rate of 23.2% to Kshs 56.5 bn in H1’2019, from Kshs 50.6 bn recorded in FY’2018,
- CIC Asset Management remains the largest overall Money Market Fund Manager with a market share of 41.4% in H1’2019, up from 39.0% in FY’2018,
- Cytonn Money Market Fund recorded the strongest annualized growth in AUM of 764.2% to Kshs 302.6 mn as of H1’2019, from an AUM of Kshs 62.8 mn in FY’2018, and,
- During the period under review, Equity Investment Bank’s Money Market Fund recorded the highest decline of 51.0% (annualized) to Kshs 480.3 mn in H1’2019 from Kshs 644.5 mn in FY’2018.
- Top five Money Market Funds by Assets Under Management
The total AUM in Money Market Funds grew by an annualized rate of 23.2% to Kshs 56.5 bn in H1’2019, from Kshs 50.6 bn in FY’2018. The top five Money Market Funds control AUM of Kshs 46.7 bn, which translates to 82.6% of the total AUM in Money Market Funds. The table below shows the top five Money Market Funds as at H1’2019:
|
Top 5 Money Market Funds by Assets Under Management |
||||
|
No. |
Fund Managers |
FY'2018 Money Market Fund (Kshs Mns) |
H1'2019 Money Market Fund (Kshs Mns) |
2019 Market Share |
|
1 |
CIC Money Market Fund |
19,756.68 |
23,391.36 |
41.4% |
|
2 |
ICEA Lion Money Market Fund |
5,916.26 |
6,458.79 |
11.4% |
|
3 |
Britam Money Market Fund |
5,871.10 |
6,290.10 |
11.1% |
|
4 |
CBA Money Market Fund |
4,946.90 |
5,819.75 |
10.3% |
|
5 |
Old Mutual Money Market Fund |
4,877.60 |
4,734.62 |
8.4% |
|
|
Total |
41,368.53 |
46,694.62 |
82.6% |
- Top Five (5) Money Market Funds by Growth Rate
As at the end of H1’2019, the fastest growing money market fund, Cytonn Money Market Fund recorded an annualized growth rate of 764.2% to an AUM of Kshs 302.6 mn, from an AUM of Kshs 62.8 mn in FY’2018. The top five Money Market Funds in terms of growth rate recorded in H1’2019 are as below:
|
Top 5 Money Market Funds By Growth Rate |
||||
|
No. |
Fund Managers |
FY'2018 AUM (Kshs Mns) |
H1'2019 AUM (Kshs Mns) |
H1'2019 Annualized Growth Rate |
|
1 |
Cytonn Money Market Fund |
62.8 |
302.6 |
764.2% |
|
2 |
Dry Associates Money Market Fund |
894.3 |
1,318.3 |
94.8% |
|
3 |
GenCap Hela Imara Fund |
305.5 |
439.0 |
87.4% |
|
4 |
Nabo Money Market Fund |
237.7 |
296.1 |
49.2% |
|
5 |
Madison Money Market Fund |
1,205.0 |
1,439.8 |
39.0% |
- Top Five (5) Money Market Funds by Yield
During the period under review, the following Money Market Funds had the highest average effective annual yield declared, with the Cytonn Money Market Fund having the highest yield:
|
Top 5 Money Market Funds by Yield |
||
|
Rank |
Money Market Funds |
Effective Annual Rate |
|
1 |
Cytonn Money Market Fund |
10.9% |
|
2 |
Alphafrica Kaisha Money Market Fund |
10.9% |
|
3 |
Nabo Africa Money Market Fund |
10.2% |
|
4 |
Zimele Money Market Fund |
9.9% |
|
5 |
CIC Money Market Fund |
9.8% |
- Comparing Annualized Unit Trust Funds AUM Growth with Bank Deposits Growth
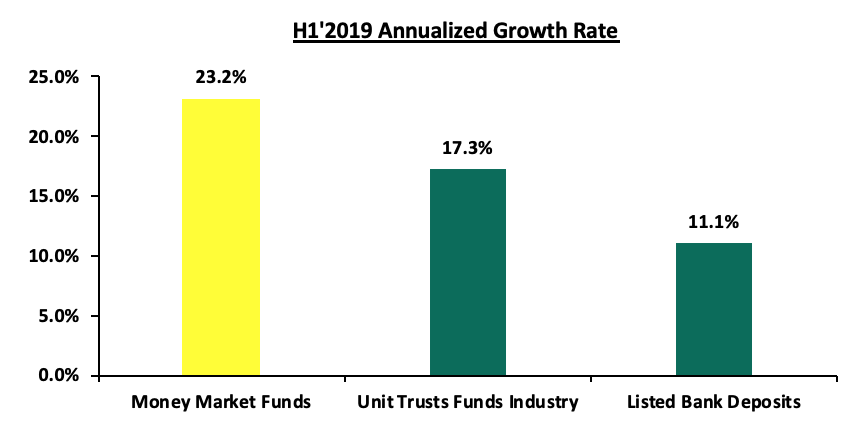
Unit Trust Funds assets recorded improved growth of 17.3% in H1’2019, compared to a growth of 4.0% in H1’2018, while the listed bank deposits grew by 11.1% in H1’2019 compared to a growth of 8.3% recorded in H1’2018. Money Market Funds recorded an impressive growth of 23.2% in H1’2019, compared to a growth of 3.8% in H1’2018. This could be attributable to Money Market Funds offering more attractive yields as compared to bank deposits, more so since the scrapping of the rate cap floor in August 2018.
The reason for the popularity of Money Market Funds in Kenya is attributable to affordable initial and additional investment requirements, high liquidity and daily compounding of interest. While initial deposit and additional investments may vary depending on the fund, Money Market Funds present a low risk, affordable and high-yielding investment opportunity for investors and guarantees capital preservation, a key feature of MMFs. In terms of liquidity, MMFs allow investors to access their funds within a maximum of 3-5 days, with the first transaction in a month being free of charge. Apart from the ease of investments, Money Market Funds provide individual investors with economies of scale through pooling their funds together and make investments that would otherwise be out of reach for individual investors. Thus, they benefit from the economies of scale created in the form of cost savings and attractive returns on investments.
Section III: Conclusion
In conclusion, as Money Market Funds continue to lead among unit trust products, there is need to leverage more on innovation and digitization in order to further propel the growth of MMFs in Kenya. Take for instance China’s first online money market fund known as Yu’eBao that has explosively grown into the world’s largest MMF with an AUM of USD 250.0 bn as at December 2018, despite being launched in 2013. Yu’eBao of Tianhong Asset Management was launched as a spare cash management platform, allowing users to transfer idle cash as low as USD 0.15 (Kshs 15.6) into the money market fund, with the use of the Alipay e-wallet. The use of technology as a distribution channel for mutual fund products opened up the fund manager to the retail segment, which is characterized by strong demand among retail clients for convenient and innovative products.
Disclaimer: The views expressed in this publication are those of the writers where particulars are not warranted. This publication, which is in compliance with Section 2 of the Capital Markets Authority Act Cap 485A, is meant for general information only and is not a warranty, representation, advice or solicitation of any nature. Readers are advised in all circumstances to seek the advice of a registered investment advisor.

- Talk to us
- Kenya
- P.O Box 20695 - 00200, Nairobi, Kenya
- Cell +254709101200
- Tel +254709101200
- WhatsApp +254741676635
- United States
- +254709101200
- DOWNLOAD OUR APP
-


- Kenya
- 8th Floor, Pinetree Plaza, Kaburu Drive, Ngong Road, Nairobi, Kenya
- USA
- Suite 1150, 1775 Eye Street NW, USA, Washington DC 20006, USA
- Investments
- High Yield
- Private Equity
- Real Estate
- Real Estate
- RiverRun Estates
- Cytonn Towers
- The Ridge
- Taraji Heights
- The Alma