Unit Trust Funds Performance, Q1'2021, & Cytonn Weekly #41/2021
By Research Team, Oct 17, 2021
Executive Summary
Fixed Income
During the week, T-bills remained undersubscribed, with the overall subscription rate coming in at 74.3%, an increase from 40.9% recorded the previous week. The 182-day paper recorded the highest subscription rate, receiving bids worth Kshs 9.0 bn against the offered Kshs 10.0 bn, translating to a subscription rate of 90.1%, a significant increase from 39.6% recorded the previous week. This is attributable to investors’ preference for the higher returns on a risk-adjusted basis offered by the paper. The subscription rate for the 91-day paper declined to 75.4%, from 85.6% recorded the previous week, while the subscription rate for the 364-day paper increased to 58.2%, from 24.4% recorded the previous week. The yields on the 91-day, 182-day and 364-day papers increased by 1.7 bps, 11.2 bps and 19.7 bps to 7.0%, 7.4%, and 8.2%, respectively. The government accepted Kshs 16.9 bn out of the 17.8 bn bids received, translating to an acceptance rate of 94.6%;
During the week, the Energy and Petroleum Regulatory Authority (EPRA) released their monthly statement on the Maximum Retail Petroleum Prices in Kenya effective 15th October 2021 to 14th November 2021 highlighting that the prices of Super Petrol, Diesel and Kerosene had decreased to Kshs 129.7, Kshs 110.6 and Kshs 103.5 respectively. Additionally, the Kenya National Bureau of Statistics released the Q1’2021 Balance of Payments Report highlighting that Kenya’s balance of payments deteriorated in Q1’2021, coming in at a deficit of Kshs 59.4 bn, from a deficit of Kshs 47.4 bn in Q1’2020. The deterioration was due to the 16.6% increase in the Current Account Balance to Kshs 142.0 bn, from Kshs 121.7 bn in Q1’2020 due to merchandised trade deficit and lower inflows from the services sector;
Equities
During the week, the equities market recorded mixed performance, with NASI and NSE 25 gaining by 1.7% and 0.8%, respectively, while NSE 20 declined by 1.1%, taking their YTD performance to gains of 17.6%, 5.2% and 13.4% for NASI, NSE 20 and NSE 25, respectively. The equities market performance was driven by gains recorded by large cap stocks such as Safaricom and NCBA which gained by 3.5% and 2.0%, respectively. The gains were however weighed down by losses recorded by banking stocks such as KCB, Diamond Trust Bank (DTB-K) and ABSA, which recorded losses of 2.2%, 1.7% and 1.0%, respectively. The Central Bank of Kenya (CBK) recently released the Commercial Banks’ Credit Survey Report for the quarter ended June 2021, highlighting that Profit before Tax (PBT) for the banking sector significantly increased by 133.3% y/y to Kshs 50.5 bn in Q2’2021, from Kshs 21.7 bn in Q2’2020, attributable to a reduction in loan loss provisioning due to an improved business environment and economic recovery;
Real Estate
During the week, Jameson Valley Holdings and Actis Limited, private equity firms, announced a Kshs 1.0 bn joint venture bid to buy three hotels, namely; Nairobi’s Fairview Hotel and Town Lodge Hotel both located along Bishop Road Upperhill, and, City Lodge Hotel located in Two Rivers, Runda. In the infrastructure sector, the National Treasury announced that the government of Kenya will borrow Kshs 2.0 bn from an undisclosed financier to facilitate the dualling of the Eastern By-Pass which stretches from Mombasa Road to the Thika Superhighway. For statutory reviews, the government of Kenya announced plans to review property rates after every five years as contained in the proposed National Rating Bill 2021, to ensure the government does not lose out on the current capital appreciation of public land;
Focus of the Week
Following the release of the Capital Markets Authority (CMA) Quarterly Statistical Bulletin – Q2’2021, we examine the performance of Unit Trust Funds, as the total Assets Under Management (AUM) of Unit Trust Funds have been steadily increasing. During the period of review, Unit Trusts’ Assets Under Management grew by 6.1% to Kshs 111.1 bn, from Kshs 104.7 bn as at FY’2020. Additionally, as at the end of Q1’2021, there were 25 approved collective investment schemes;
Investment Updates:
- Weekly Rates:
-
- Cytonn Money Market Fund closed the week at a yield of 10.52%. To invest, just dial *809#;
- Cytonn High Yield Fund closed the week at a yield of 14.03% p.a. To invest, email us at sales@cytonn.com and to withdraw the interest you just dial *809#;
- We continue to offer Wealth Management Training Monday through Saturday, from 9:00 am to 11:00 am, through our Cytonn Foundation. The training aims to grow financial literacy among the general public. To register for any of our Wealth Management Trainings, click here;
- If interested in our Private Wealth Management Training for your employees or investment group, please get in touch with us through wmt@cytonn.com;
- The court ordered the placement of the CHYS and CPN into administration to allow for proper reorganization of the two funds that have been facing some liquidity challenges. For more information, click here;
- As of 1st of September 2021, Cytonn CHYS and CPN Investors have converted Kshs 2.5 billion of their investment funds from the two illiquid funds into real estate, translating to a 20.0% resolution of the debt owed by the two funds. For more information, please see the Cytonn CHYS and CPN Conversion 2.5 bn Real Estate article;
- Any CHYS and CPN investors still looking to convert are welcome to consider one of the five projects currently available for conversion, click here for the latest conversion term sheet;
- Cytonn Insurance Agency acts as an intermediary for those looking to secure their assets and loved ones’ future through insurance namely; Motor, Medical, Life, Property, WIBA, Credit and Fire and Burglary insurance covers. For assistance, get in touch with us through insuranceagency@cytonn.com;
- Cytonnaire Savings and Credit Co-operative Society Limited (SACCO) provides a savings and investments avenue to help you in your financial planning journey. To enjoy competitive investment returns, kindly get in touch with us through clientservices@cytonn.com;
Real Estate Updates:
- For an exclusive tour of Cytonn’s real estate developments, visit: Sharp Investor's Tour, and for more information, email us at sales@cytonn.com;
- Phase 3 of The Alma is now ready for occupation. To rent please email properties@cytonn.com;
- We have 8 investment-ready projects, offering attractive development and buyer targeted returns; See further details here: Summary of Investment-ready Projects;
- For recent news about the group, see our news section here;
Hospitality Updates:
- We currently have promotions for Staycations. Visit cysuites.com/offers for details or email us at sales@cysuites.com;
- Share a meal with a friend during the Sunday Brunch at The Hive Restaurant at Cysuites Hotel and Apartment. Every Sunday from 11.00 AM to 4.00 PM at a price of Kshs 2,500 for Adults and Kshs 1,500 for children under 12 years;
Money Markets, T-Bills Primary Auction:
During the week, T-bills remained undersubscribed, with the overall subscription rate coming in at 74.3%, an increase from 40.9% recorded the previous week. The 182-day paper recorded the highest subscription rate, receiving bids worth Kshs 9.0 bn against the offered Kshs 10.0 bn, translating to a subscription rate of 90.1%, a significant increase from 39.6% recorded the previous week. This is attributable to investors’ preference for the higher returns on a risk-adjusted basis offered by the paper. The subscription rate for the 91-day paper decreased to 75.4%, from 85.6% recorded the previous week, while the subscription rate for the 364-day paper increased to 58.2%, from 24.4% recorded the previous week. The yields on the 91-day, 182-day and 364-day papers increased by 1.7 bps, 11.2 bps and 19.7 bps to 7.0%, 7.4%, and 8.2%, respectively. The government continued to reject expensive bids, accepting Kshs 16.9 bn out of the 17.8 bn bids received, translating to an acceptance rate of 94.6%.
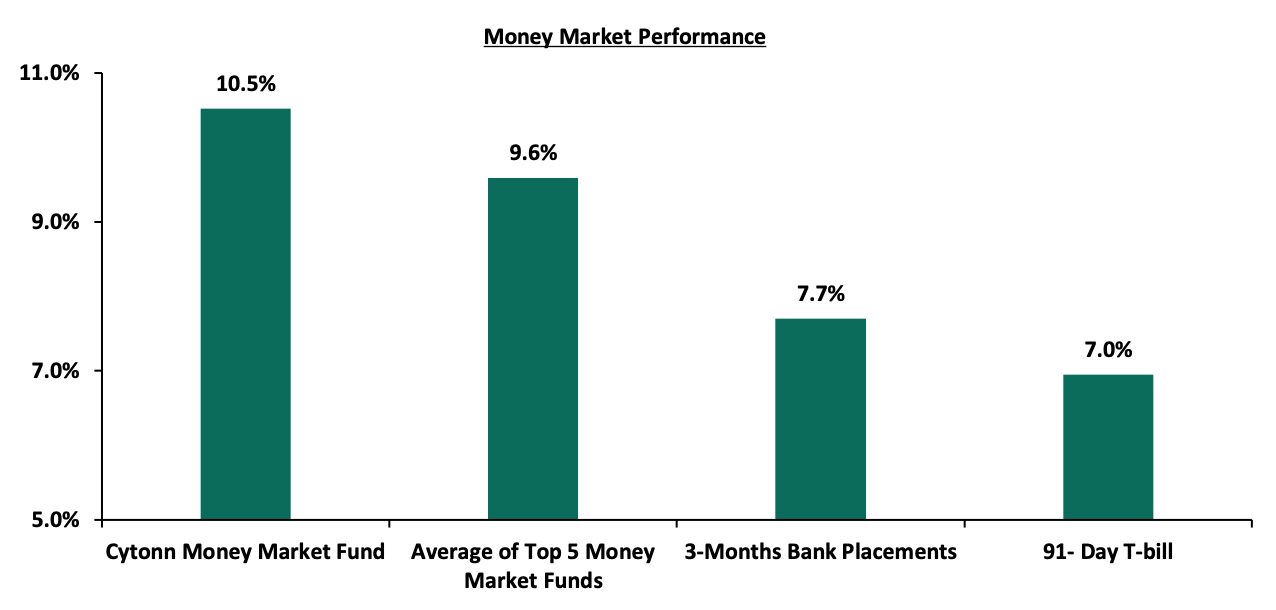
In the money markets, 3-month bank placements ended the week at 7.7% (based on what we have been offered by various banks), while the yield on the 91-day T-bill increased by 1.7 bps to 7.0%. The average yield of the Top 5 Money Market Funds declined by 0.1% points to 9.6%, from 9.7%, recorded the previous week. The yield on the Cytonn Money Market Fund marginally declined by 0.1% points to 10.5%, from 10.6% recorded the previous week.
The table below shows the Money Market Fund Yields for Kenyan Fund Managers as published on 15th October:
|
Money Market Fund Yield for Fund Managers as published on 15th October 2021 |
|||
|
Rank |
Fund Manager |
Daily Yield |
Effective Annual Rate |
|
1 |
Cytonn Money Market Fund |
10.00% |
10.52% |
|
2 |
Zimele Money Market Fund |
9.56% |
9.91% |
|
3 |
Sanlam Money Market Fund |
8.86% |
9.27% |
|
4 |
Nabo Africa Money Market Fund |
8.83% |
9.23% |
|
5 |
CIC Money Market Fund |
8.71% |
9.02% |
|
6 |
Madison Money Market Fund |
8.62% |
9.00% |
|
7 |
Apollo Money Market Fund |
9.10% |
8.95% |
|
8 |
Dry Associates Money Market Fund |
8.33% |
8.65% |
|
9 |
Co-op Money Market Fund |
8.30% |
8.65% |
|
10 |
GenCapHela Imara Money Market Fund |
8.19% |
8.53% |
|
11 |
British-American Money Market Fund |
8.16% |
8.47% |
|
12 |
ICEA Lion Money Market Fund |
8.01% |
8.34% |
|
13 |
NCBA Money Market Fund |
8.02% |
8.33% |
|
14 |
Orient Kasha Money Market Fund |
7.84% |
8.16% |
|
15 |
Old Mutual Money Market Fund |
7.02% |
7.25% |
|
16 |
AA Kenya Shillings Fund |
6.51% |
6.71% |
Source: Business Daily
Liquidity:
During the week, liquidity in the money market eased, with the average interbank rate declining to 4.9% from 6.3% recorded the previous week, attributable to government payments coupled with Term Auction Deposits (TADs) maturities of Kshs 28.2 bn which offset tax remittances and settlement of government securities. Additionally, there was a 13.1% increase in the average volumes traded in the interbank market to Kshs 12.4 bn, from Kshs 11.0 bn recorded the previous week.
Kenya Eurobonds:
During the week, the yields on Eurobonds recorded mixed performance, with the yields on the 10-year bond issued in 2014 and the 10-year bond issued in 2018 increasing by 0.1% points to 3.5% and 5.8% from 3.4% and 5.7% recorded the previous week, respectively, while the 30-year bond issued in 2018 increased by 0.2% points to 8.0%, from 7.8% recorded the previous week. The 7-year bond issued in 2019, 12-year bond issued in 2019 and the 12-year bond issued in 2021 remained unchanged at 5.4%, 6.8% and 6.7%, respectively. Below is a summary of the performance:
|
Kenya Eurobond Performance |
||||||
|
|
2014 |
2018 |
2019 |
2021 |
||
|
Date |
10-year issue |
10-year issue |
30-year issue |
7-year issue |
12-year issue |
12-year issue |
|
31-Dec-20 |
3.9% |
5.2% |
7.0% |
4.9% |
5.9% |
- |
|
30-Sep-21 |
3.2% |
5.4% |
7.5% |
5.0% |
6.5% |
6.5% |
|
8-Oct-21 |
3.4% |
5.7% |
7.8% |
5.4% |
6.8% |
6.7% |
|
11-Oct-21 |
3.5% |
5.8% |
7.9% |
5.4% |
6.8% |
6.7% |
|
12-Oct-21 |
3.6% |
5.8% |
7.9% |
5.5% |
6.9% |
6.7% |
|
13-Oct-21 |
3.6% |
5.8% |
8.0% |
5.5% |
6.9% |
6.8% |
|
14-Oct-21 |
3.5% |
5.8% |
8.0% |
5.4% |
6.8% |
6.7% |
|
Weekly Change |
0.1% |
0.1% |
0.2% |
0.0% |
0.0% |
0.0% |
|
MTD Change |
0.3% |
0.4% |
0.4% |
0.4% |
0.3% |
0.2% |
|
YTD Change |
(0.4%) |
0.6% |
0.9% |
0.6% |
0.9% |
- |
Kenya Shilling:
During the week, the Kenyan shilling depreciated marginally by 0.2% against the US dollar to close the week at Kshs 110.9, from Kshs 110.7 recorded the previous week, mainly attributable to increased dollar demand from the energy sector importers. On a YTD basis, the shilling has depreciated by 1.6% against the dollar, in comparison to the 7.7% depreciation recorded in 2020. We expect the shilling to remain under pressure for the remainder of 2021 as a result of:
- Rising uncertainties in the global market due to the Coronavirus pandemic, which has seen investors continue to prefer holding their investments in dollars and other hard currencies and commodities,
- Increased demand from merchandise traders as they beef up their hard currency positions in anticipation for more trading partners reopening their economies globally, and,
- Rising global crude oil prices on the back of supply constraints at a time when demand is picking up with the easing of COVID-19 restrictions and as economies reopen.
The shilling is however expected to be supported by:
- The Forex reserves, currently at USD 9.3 bn (equivalent to 5.7-months of import cover), which is above the statutory requirement of maintaining at least 4.0-months of import cover, and the EAC region’s convergence criteria of 4.5-months of import cover. In addition, the reserves were boosted by the USD 1.0 bn proceeds from the Eurobond issued in July 2021 coupled with the USD 407.0 mn IMF disbursement and the USD 130.0 mn World Bank loan financing received in June, 2021, and,
- Improving diaspora remittances evidenced by a 14.2% y/y increase to USD 312.9 mn in August 2021, from USD 274.1 mn recorded over the same period in 2020, which has continued to cushion the shilling against further depreciation.
Weekly Highlight:
- Fuel Prices
During the week, the Energy and Petroleum Regulatory Authority (EPRA) released their monthly statement on the Maximum Retail Petroleum Prices effective 15th October 2021 to 14th November 2021. Below are the key take-outs from the statement:
- Super Petrol prices decreased by 3.7% to Kshs 129.7 per litre, from Kshs 134.7 per litre, while diesel prices decreased by 4.3% to Kshs 110.6 per litre, from Kshs 115.6 per litre. Kerosene prices also declined by 6.6% to Kshs 103.5 per litre, from Kshs 110.8 per litre, and,
- The changes in fuel prices is attributable to the reinstatement of fuel subsidies of Kshs 6.9 on Super Petrol, Kshs 6.1 on Diesel and Kshs 4.6 on Kerosene, and the decrease in the average landed cost for Kerosene by 4.1%, to USD 477.8 per cubic meter in September 2021, from Kshs 498.2 in August 2021.
However the gains were muted due to the increase in the Free on Board (FOB) price of Murban crude oil in September 2021 by 1.6% to USD 73.5 per barrel, from USD 72.34 per barrel in August 2021 and the 0.7% depreciation of the shilling against the dollar to close at Kshs 110.2 in September 2021, from Kshs 109.5 in August 2021.
Global fuel prices have increased by 7.1% in the first two weeks of September 2021, and by 62.9% to USD 81.8 on a YTD basis, from USD 50.2 at the end of 2020. The rise in global prices is attributable to the rise in demand for oil in tandem with the reopening of global economies.
Going forward, we expect the upward pressure on the inflation basket to be eased given the decline in fuel prices within this cycle. The reinstatement of the subsidy is attributable to the Government’s bid to lower the cost of fuel and transport which has had a significant weighting in the country’s inflation. The Treasury is expected to use Kshs 18.1 bn which had initially been diverted to support the Standard Gauge Railway (SGR) operations to reinstate the fuel subsidy that had been removed in September this year. In the past, the subsidy policy had been very effective in lowering fuel inflation as prices remained relatively unchanged for five months from April to August this year despite the global fuel prices fluctuations. Following the reinstatement of the subsidy, we expect the treasury to seek an additional Kshs 37.6 mn to meet the budget deficit as a result of reduction of fuel and cooking gas levies and taxes.
- Kenya Q1’2021 Balance of Payments
The Kenya National Bureau of Statistics released the Q1’2021 Balance of Payments report highlighting that Kenya’s balance of payments deteriorated in Q1’2021, coming in at a deficit of Kshs 59.4 bn from a deficit of Kshs 47.4 bn in Q1’2020. The decline was mainly attributable to a 47.1% increase in the Financial Account Deficit to a surplus of Kshs 73.6 bn, from a surplus of Kshs 50.1 bn in Q1’2021, coupled with 16.6% expansion of Current Account Balance to Kshs 142.0 bn, from Kshs 121.7 bn in Q1’2020. The table below shows the breakdown of the various balance of payments components, comparing Q1’2021 and Q1’2020:
|
Q1’2021 Balance of Payments |
|||
|
Item |
Q1’2020 |
Q1’2021 |
% Change |
|
Current Account Balance |
(121.7) |
(142.0) |
(16.6%) |
|
Capital Account Balance |
2.5 |
8.0 |
222.3% |
|
Financial Account Balance |
50.1 |
73.6 |
47.1% |
|
Net Errors and Omissions |
21.8 |
1.0 |
(95.5%) |
|
Balance of Payments |
(47.4) |
(59.4) |
(25.3%) |
All values in Kshs bns
Key take-outs from the table include;
- The current account deficit (value of goods and services imported exceeds the value of those exported) expanded by 16.6% to Kshs 142.0 bn, from Kshs 121.7 bn in Q1’2020, mainly attributable to widening of the Merchandise Trade Deficit by 26.9% to Kshs 287.3 bn from Kshs 226.4 bn recorded in Q1’2020,
- The financial account deficit (a situation where domestic buyers are purchasing more foreign assets than foreign buyers are purchasing of domestic assets) increased by 47.1% to a surplus of Kshs 73.6 bn, from a surplus of Kshs 50.1 bn in Q1’2021, while the stock of gross official reserves declined by 6.2% to stand at Kshs 847.8 bn, from 903.8 bn in Q1’2020, and,
- Consequently, the Balance of Payments (BoP) position deteriorated to a deficit of Kshs 59.4 bn from a deficit of Kshs 47.4 bn in Q1’2020, mainly due to the 47.1% decrease in the financial account deficit, coupled with 16.6% expansion of current account balance to Kshs 142.0 bn, from Kshs 121.7 bn in Q1’2020.
During the period of review, the Kenya shilling remained under pressure, deteriorating by 4.6% y/y to close the quarter at Kshs 109.5 from Kshs 104.7 at the end of Q1’2020. The forex reserves held by the Central Bank of Kenya declined in the same period to close the quarter at USD 7.3 bn, from USD 8.0 bn recorded at the end of Q1’2020. We expect relative stability in the business environment in the coming quarter given the easing of the lockdown measures by Kenya’s trading partners, COVID-19 vaccine rollout, and continued support from the tea, coffee and horticulture exports due to the normalized demand in Kenya’s export markets as well as earnings from the tourism sector. However, risks remain firmly on the downside given the recent increase in fuel prices that has led to increase in fuel importation cost, supply shortages and logistical bottlenecks, and worse, emergence of new COVID-19 variants which could lead to further restriction measures. For a more in-depth analysis, see our Q1’2021 BOP Note.
Rates in the fixed income market have remained relatively stable due to the tightened but sufficient levels of liquidity in the money markets. The government is 45.8% ahead of its prorated borrowing target of Kshs 202.6 bn having borrowed Kshs 295.4 bn of the Kshs 658.5 bn borrowing target for the FY’2021/2022. We expect a gradual economic recovery going into FY’2021/2022 as evidenced by KRAs collection of Kshs 476.6 bn in revenues during the first quarter of the current fiscal year, which is equivalent to 103.2% of the prorated revenue collection target. However, despite the projected high budget deficit of 7.5% and the lower credit rating from S&P Global to 'B' from 'B+', we believe that the monetary support from the IMF and World Bank will mean that the interest rate environment may stabilize since the government will not be desperate for cash.
Markets Performance
During the week, the equities market recorded mixed performance, with NASI and NSE 25 gaining by 1.7% and 0.8%, respectively, while NSE 20 declined by 1.1%, taking their YTD performance to gains of 17.6%, 5.2% and 13.4% for NASI, NSE 20 and NSE 25, respectively. The equities market performance was driven by gains recorded by large cap stocks such as Safaricom and NCBA which gained by 3.5% and 2.0%, respectively. The gains were however weighed down by losses recorded by banking stocks such as KCB, Diamond Trust Bank (DTB-K) and ABSA which recorded losses of 2.2%, 1.7% and 1.0%, respectively.
During the week, equities turnover declined by 27.4% to USD 18.9 mn, from USD 26.0 mn recorded the previous week, taking the YTD turnover to USD 973.6 mn. Foreign investors remained net sellers, with a net selling position of USD 0.8 mn, from a net selling position of USD 7.2 mn recorded the previous week, taking the YTD net selling position to USD 26.7 mn.
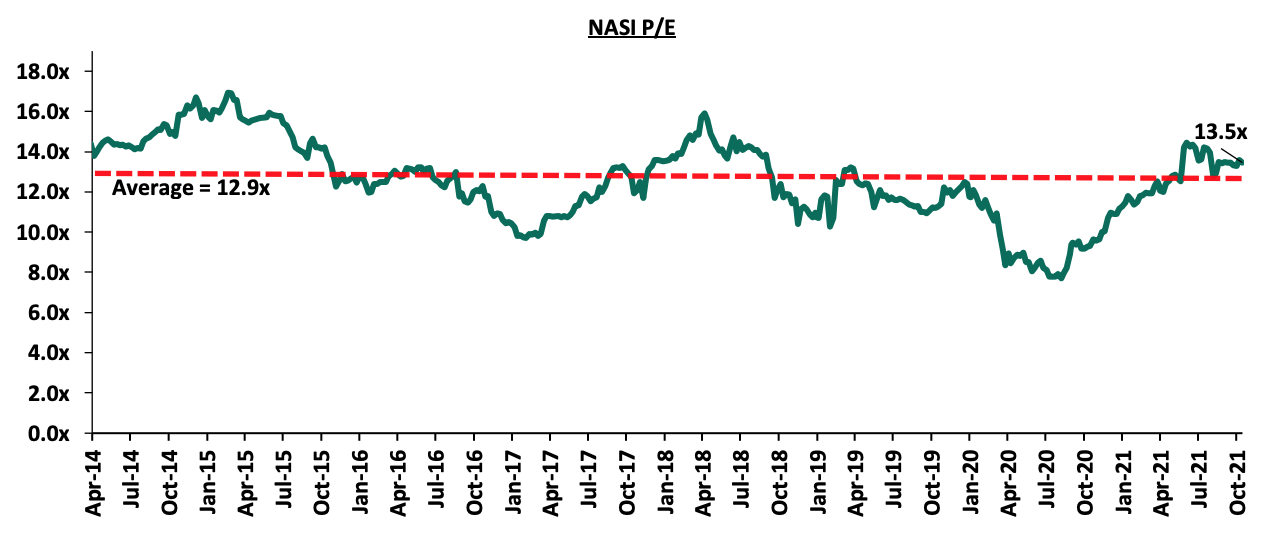
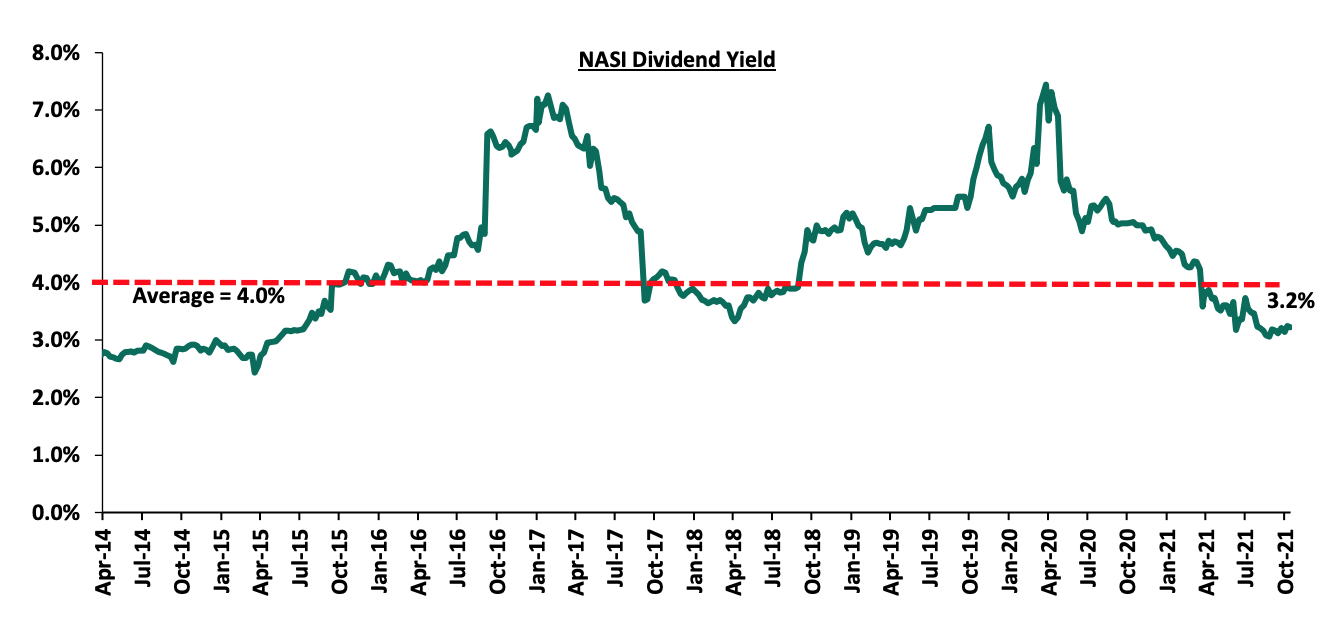
The market is currently trading at a price to earnings ratio (P/E) of 13.5x, 4.6% above the historical average of 12.9x, and a dividend yield of 3.2%, 0.8% points below the historical average of 4.0%. Key to note, NASI’s PEG ratio currently stands at 1.5x, an indication that the market is trading at a premium to its future earnings growth. Basically, a PEG ratio greater than 1.0x indicates the market may be overvalued while a PEG ratio less than 1.0x indicates that the market is undervalued. Excluding Safaricom, which is currently 62.7% of the market, the market is trading at a P/E ratio of 11.3x and a PEG ratio of 1.3x. The current P/E valuation of 13.5x is 75.7% above the most recent trough valuation of 7.7x experienced in the first week of August 2020. The charts below indicate the historical P/E and dividend yields of the market.
Weekly highlight
- Sanlam Kenya Credit Ratings
During the week, Fitch Ratings, a global credit rating agency, assigned Sanlam Life Insurance Limited (Sanlam Life), an insurance provider in Kenya, an Insurer Financial Strength (IFS) rating and Issuer Default Rating (IDR) of `B+’ and its holding company, Sanlam Kenya Plc, a Long-term Issuer Default Rating (IDR) of `B’ with both Rating outlooks being stable. The Insurer financial strength rating on the Fitch Ratings scale ranges from a low of B to a high of AAA. According to Fitch Ratings, the main drivers of Sanlam Kenya’s rating were;
- The company’s moderate business profile, attributable to favorable diversification across both life and non-life products which accounted for 59.0% and 41.0% as at end 2020,
- Supportive capitalization, and,
- Strategic importance of Sanlam Kenya to the parent company, Sanlam Group.
The ratings were also supported by Sanlam Kenya’s underlying financial performance, but the performance has been negatively affected in recent years by foreign exchange and investment losses. Sanlam Kenya reported a net loss of Kshs 117.0 mn at the end of 2020, driven by Kshs 214.0 mn of foreign exchange losses on its USD denominated borrowings. In H1’2021, Sanlam Kenya reported a Kshs 298.1 mn loss attributable to one-off forex losses incurred in restructuring USD 27.0 mn loans into a Kshs 3.0 bn loan with a local banking institution. The recent restructuring of Sanlam Kenya’s borrowings to local currency to reduce the foreign exchange loss risk and is set to positively impact its future ratings. The positives were however offset by;
The ratings were also supported by Sanlam Kenya’s underlying financial performance, but the performance has been negatively affected in recent years by foreign exchange and investment losses. Sanlam Kenya reported a net loss of Kshs 117.0 mn at the end of 2020, driven by Kshs 214.0 mn of foreign exchange losses on its USD denominated borrowings. In H1’2021, Sanlam Kenya reported a Kshs 298.1 mn loss attributable to one-off forex losses incurred in restructuring USD 27.0 mn loans into a Kshs 3.0 bn loan with a local banking institution. The recent restructuring of Sanlam Kenya’s borrowings to local currency to reduce the foreign exchange loss risk and is set to positively impact its future ratings. The positives were however offset by;
- The group’s high investment risk due to a significantly high exposure of Sanlam Kenya’s assets to Kenya’s sovereign risk, with sovereign investments-to-shareholders' equity ratio of 1,064.0% at end-2020. However, it is key to note that to date, Kenya is yet to default on its domestic or foreign sovereign securities, and,
- A high financial leverage ratio of 69.0% as at end of H1’2021. The high financial leverage points to most of Sanlam Kenya’s assets being financed by debt, hence lowering its credit outlook. However, Sanlam Kenya’s debt is guaranteed by the parent, Sanlam group, which has a National Long-Term Rating of ‘AA+’ with a stable outlook.
Fitch ratings also noted that Sanlam Kenya’s future ratings are mainly pegged on the deterioration or improvement in Sanlam Kenya’s business volumes and an increase or decrease of Sanlam Kenya’s investment risk in sovereign investments. In our view, the IFS and IDR Fitch Ratings and stable outlook are expected to boost confidence on Sanlam Kenya’s operations and increase investor confidence as it seeks to strengthen its market position in the insurance sector. Sanlam Kenya is one of the top five insurers in Kenya with a life-insurance market share of 6.0% and a non-life market share of 3.0% as at 2020. We expect Sanlam Kenya to input strategies to lighten investments in sovereign securities and look to other markets as has been the trend in the Kenyan insurance sector which has seen aggressive investment income diversification with insurers looking to mitigate underwriting losses brought about by increased claims and loss ratios.
- Credit Survey Report June 2021
The Central Bank of Kenya (CBK), recently released the Commercial Banks’ Credit Survey Report for the quarter ended June 2021. The quarterly Credit Officer Survey is undertaken by the CBK to identify the potential drivers of credit risk in the banking sector. For the quarter ended 30th June 2021, 38 operating commercial banks and 1 mortgage finance company participated in the Commercial Banks Credit Officer Survey. The report highlights that Profit before Tax (PBT) for the banking sector significantly increased by 133.3% y/y to Kshs 50.5 bn in Q2’2021, from Kshs 21.7 bn in Q2’2020, attributable to a reduction in loan loss provisioning as the economy recovered and business environment improved. On a q/q basis, Profit before Tax increased by 10.1% to Kshs 50.5 bn to June 2021 from Kshs 45.9 bn in March 2021. Other key take-outs from the report include:
- The banking sector’s loan book recorded a 6.9% y/y growth, with gross loans increasing to Kshs 3.1 tn in June 2021, from Kshs 2.9 tn in June 2020. On a q/q basis, the loan book increased by 2.3% from Kshs 3.0 tn in March 2021,
- The aggregate balance sheet recorded a 9.1% increase y/y to Kshs 5.7 tn in Q2’2021, from Kshs 5.2 tn in Q2’2020. The expansion in the balance sheet is attributable to an 8.9% growth in deposits to Kshs 4.2 tn in Q2’2021, from Kshs 3.9 tn in Q2’2020, coupled with a 6.9% increase in gross loans to Kshs 3.1 tn in Q1’2021, from Kshs 2.9 tn in Q1’2020. Quarterly, the balance sheet grew by 2.7% to Kshs 5.7 tn in June 2021, from Kshs 5.5 tn in March 2021,
- Asset quality in the banking sector deteriorated, with the Gross NPL ratio increasing to 14.0% in Q2’2021, from 13.1% in Q2’2020. Quarterly, however, asset quality improved to 14.0% in June 2021, from 14.6% in March 2021. Some the key sectors driving the y/y asset quality deterioration include Personal and Household, Real Estate, Tourism, and Trade,
- The capital adequacy remained favorable with the ratio increasing to 18.9% in June 2021, from 18.5% recorded in June 2020 and 18.8% in March 2021. During the quarter, the sector’s total capital increased by 2.1% while the total risk weighted assets recorded a 1.6% increase, bringing the capital adequacy ratio to 18.9%, 4.4% points above the minimum statutory limit of 14.5%,
- IFRS 9 implementation had an adverse effect on the banking sector’s capital adequacy as a result of increased provisioning due to the challenging business environment. Commercial banks have had to provide provisions for both incurred and expected credit losses, and,
- Average liquidity in the banking sector increased to 56.8% in June 2021, from 52.8% in June 2020 and 56.3% in March 2021. This was 36.8% points above the minimum statutory ratio of 20.0%.
Due to an improved business environment following the gradual reopening of the economy and increased vaccination rollout, credit risk is expected to decline, evidenced by the commercial banks’ reduced loan loss provisioning, as highlighted in our H1’2021 Banking report. The Kenyan Banking sector has showcased robust recovery efforts which have been boosted by an expansion in the loan book and diversification of income which has grown the banks’ bottom lines. The strong performance evidenced by the increased profits in the quarter are expected to continue but may face risks such as increased cybersecurity threats emanating from the major shift to digital banking. This adds to the possibility of credit risk elevation due to discovery of new strains leading to reduced economic activity in addition to heightened political activities in the run up to next year’s general elections.
Universe of coverage
|
Company |
Price as at 08/10/2021 |
Price as at 15/10/2021 |
w/w change |
YTD Change |
Year Open 2021 |
Target Price* |
Dividend Yield |
Upside/ Downside** |
P/TBv Multiple |
Recommendation |
|
I&M Group*** |
21.8 |
21.5 |
(1.4%) |
(52.1%) |
44.9 |
32.0 |
10.5% |
59.3% |
0.6x |
Buy |
|
ABSA Bank*** |
10.3 |
10.2 |
(1.0%) |
6.6% |
9.5 |
13.8 |
0.0% |
36.0% |
1.1x |
Buy |
|
Kenya Reinsurance |
2.5 |
2.5 |
(1.6%) |
6.5% |
2.3 |
3.1 |
8.1% |
34.1% |
0.3x |
Buy |
|
NCBA*** |
25.3 |
25.8 |
2.0% |
(3.2%) |
26.6 |
31.0 |
5.8% |
26.2% |
0.6x |
Buy |
|
KCB Group*** |
46.1 |
45.1 |
(2.2%) |
17.4% |
38.4 |
53.4 |
2.2% |
20.6% |
1.0x |
Buy |
|
Standard Chartered*** |
129.3 |
128.3 |
(0.8%) |
(11.2%) |
144.5 |
145.4 |
8.2% |
21.6% |
1.0x |
Buy |
|
Equity Group*** |
49.4 |
49.5 |
0.3% |
36.6% |
36.3 |
57.5 |
0.0% |
16.2% |
1.3x |
Accumulate |
|
Co-op Bank*** |
13.2 |
13.0 |
(1.1%) |
3.6% |
12.6 |
14.1 |
7.7% |
16.2% |
0.9x |
Accumulate |
|
Stanbic Holdings |
86.3 |
86.0 |
(0.3%) |
1.2% |
85.0 |
96.6 |
2.0% |
14.3% |
0.8x |
Accumulate |
|
Diamond Trust Bank*** |
60.5 |
59.5 |
(1.7%) |
(22.5%) |
76.8 |
67.3 |
0.0% |
13.1% |
0.3x |
Accumulate |
|
Liberty Holdings |
7.8 |
7.8 |
(0.3%) |
1.0% |
7.7 |
8.4 |
0.0% |
8.0% |
0.6x |
Hold |
|
Sanlam |
11.9 |
12.0 |
0.4% |
(8.1%) |
13.0 |
12.4 |
0.0% |
3.8% |
1.1x |
Lighten |
|
Jubilee Holdings |
350.0 |
348.5 |
(0.4%) |
26.4% |
275.8 |
330.9 |
2.6% |
(2.5%) |
0.7x |
Sell |
|
Britam |
8.1 |
7.6 |
(5.4%) |
9.1% |
7.0 |
6.7 |
0.0% |
(12.3%) |
1.4x |
Sell |
|
HF Group |
3.7 |
3.7 |
0.5% |
18.2% |
3.1 |
3.1 |
0.0% |
(16.4%) |
0.2x |
Sell |
|
CIC Group |
2.8 |
2.7 |
(4.3%) |
27.5% |
2.1 |
1.8 |
0.0% |
(33.1%) |
0.9x |
Sell |
|
Target Price as per Cytonn Analyst estimates **Upside/ (Downside) is adjusted for Dividend Yield ***For Disclosure, these are stocks in which Cytonn and/or its affiliates are invested in Key to note, I&M Holdings YTD share price change is mainly attributable to the counter trading ex-bonus issue |
||||||||||
We are “Neutral” on the Equities markets in the short term. With the market currently trading at a premium to its future growth (PEG Ratio at 1.5x), we believe that investors should reposition towards companies with a strong earnings growth and are trading at discounts to their intrinsic value. Additionally, we expect the recent discovery of new strains of COVID-19 coupled with the introduction of strict lockdown measures in major economies to continue dampening the economic outlook.
- Hospitality Sector
During the week, Jameson Valley Holdings and Actis Limited, private equity firms, announced a Kshs 1.0 bn joint venture bid to buy three hotels, namely; Nairobi’s Fairview Hotel and Town Lodge Hotel both located along Bishop Road Upperhill, and, City Lodge Hotel located in Two Rivers, Runda. The three hotels owned by South Africa’s City Lodge Hotel Group were put up for sale in July 2021, and this deal is expected to be achieved through Ukarimu Real Estate Funds by means of a Special Purpose Vehicle (SPV) listed in Mauritius as Msafiri Limited. The hotels have a combined 382 rooms with City Lodge, Fairview and Town Lodge having 171,127 and 84 rooms, respectively. The City Lodge Group also plans to sell its Tanzanian City Lodge Hotel in Dar-es-Salaam, marking the exit of the Group portfolio in East African market after seven years of operation, citing; i) huge losses to the tune of Kshs 2.0 bn as at the end of 2020, ii) low occupancy and booking levels below expectations attributable to Covid-19 regulations with average market occupancies for serviced apartments declining by 31.3% points to 48.0% in 2020 from the 79.4% in 2019. City Lodge Group average occupancies for the year 2021 came in at 19.0% compared to 38.0% in 2020 and 55.0% in 2019 with the Two Rivers City Lodge Hotel occupancy estimated at 7%-10% in the same period, iii) the need to reduce debt levels in the Group, and, iv) necessity to boost liquidity in the remaining profitable hotels in South Africa, Botswana, Namibia and Mozambique.
The hospitality sector was one of the worst hit sectors by the pandemic attributable to international travel bans, travel advisories, lockdowns and social distancing measures meant to curb the spread of Covid-19 pandemic. This led to the decline in hotel bookings and occupancies and the closure of many hospitality-affiliated businesses while most looked to exit their investments amidst the tough operational environment. This is evidenced by our Nairobi Metropolitan Area Serviced Apartments Report 2020 where average market occupancies for serviced apartments declined by 31.3% points to 48.0% in 2020 from the 79.4% in 2019.
The table below shows the comparative analysis of NMA Serviced Apartments 2019/2020;
|
Comparative Analysis-2019/2020 Market Performance |
||||||||||
|
Node |
Occupancy 2019 |
Occupancy 2020 |
Occupancy rates ∆ |
Monthly Charge per SQM (Kshs) 2019 |
Monthly Charge per SQM (Kshs) 2020 |
Change in Monthly Charge Per SQM (Kshs) |
% Change of Monthly Charges |
Rental Yield 2019 |
Rental Yield 2020 |
% Change in Rental Yield |
|
Westlands & Parklands |
80.8% |
49.4% |
(31.4%) |
3884 |
3578 |
(306) |
(8.6%) |
10.8% |
6.1% |
(4.7%) |
|
Kilimani |
80.0% |
48.4% |
(31.6%) |
3353 |
2783 |
(570) |
(20.5%) |
9.5% |
4.8% |
(4.7%) |
|
Limuru Road |
88.2% |
51.4% |
(36.8%) |
3430 |
2839 |
(591) |
(20.8%) |
9.4% |
4.5% |
(4.8%) |
|
Kileleshwa & Lavington |
82.4% |
48.1% |
(34.3%) |
2845 |
2553 |
(292) |
(11.4%) |
8.2% |
4.3% |
(3.9%) |
|
UpperHill |
67.8% |
48.9% |
(18.9%) |
2577 |
2121 |
(456) |
(21.5%) |
6.0% |
3.6% |
(2.4%) |
|
Nairobi CBD |
72.0% |
42.1% |
(29.9%) |
2230 |
2122 |
(108) |
(5.1%) |
5.1% |
2.9% |
(2.2%) |
|
Thika Road |
84.4% |
48.1% |
(36.3%) |
1321 |
1138 |
(183) |
(16.1%) |
4.0% |
2.0% |
(2.0%) |
|
Average |
79.4% |
48.0% |
(31.3%) |
2806 |
2448 |
(358) |
(14.9%) |
7.6% |
4.0% |
(3.6%) |
Source: Cytonn Research 2020
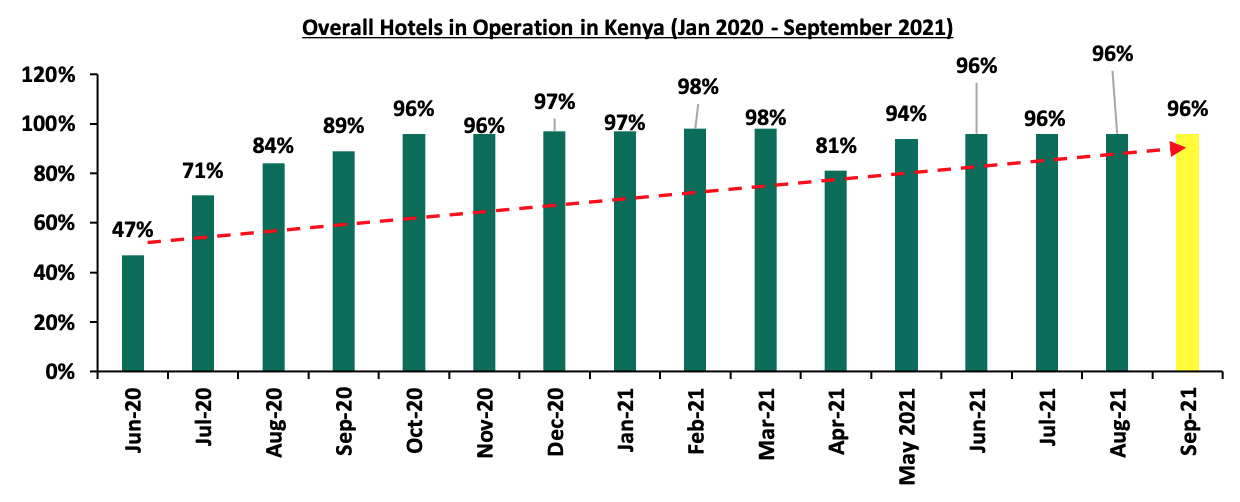
Despite this, the sector performance has been improving with the lift of most Covid-19 bans and restrictions, and the gradual return to normalcy as vaccination picks pace. The number of operating hotels have improved over the last few months coming in at 96.0%, in September 2021 from 81.0% in April 2021. The graph below shows the overall percentage of the number of operating hotels in Kenya June 2020 – September 2021;
Source: Central Bank of Kenya
We expect the hospitality sector to continue on an upward trajectory in terms of overall hotels in operations, hotel bookings, and hotel occupancy following the ambitious international marketing, the return of flights and the mass vaccination currently underway in the country.
- Infrastructure
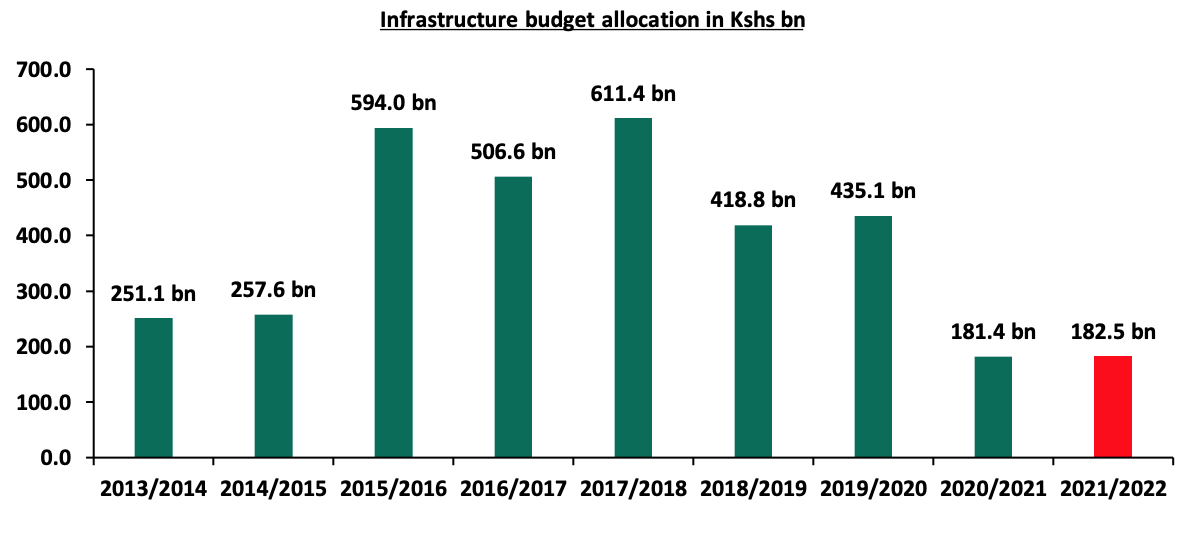
During the week, the National Treasury announced that the government of Kenya will borrow Kshs 2.0 bn from an undisclosed financier to facilitate the dualling of the Eastern By-Pass which stretches from Mombasa Road to the Thika Superhighway. The road aims at reducing traffic congestion in the Nairobi’s Central Business District (CBD) by allowing motorists, especially those from the Jomo Kenyatta International Airport (JKIA), to use alternative routes through City Cabanas, Pipeline and Njiru areas to get to their destinations without transiting through the city. Additionally, the government borrowed Kshs 6.4 bn from Korean Export and Import Bank to finance the Bus Rapid Transit (BRT) project. The Korean loan is set to be serviced for a period of 40 years up to 2061 at an interest rate of 0.1% p.a and a service charge of 0.1% p.a on undisbursed loan amounts. There are plans to launch six BRT corridors in the Nairobi Metropolitan Area (NMA) by 2022 with the major ones located along the busy Thika and Mombasa Roads holding up to 950 high capacity buses with an aim to reduce travel time and cost by 70.0%. This is in line with the improving infrastructure agenda to; i) reduce traffic congestion in the Nairobi’s CBD to save on time and costs, ii) open up areas for investments, iii) enhance accessibility and efficiency in movements for economic growth, and, iv) make Kenya an East Africa’s investment hub through provision, maintenance and management of road infrastructure in support of Vision 2030 aspirations in order to provide safe, efficient, accessible, and, sustainable transportation services.
The loans therefore come as a way to partly service the FY’2021/22 infrastructure budget at Kshs 182.5 bn a 0.6% increase from the Kshs 181.4 bn allocated in FY’2020/21. Other major infrastructure projects listed in the current budget include the construction of the next phase of the Standard Gauge Railway (SGR) from Nairobi- Naivasha at Kshs 7.2 bn, the Nairobi Express Way at Kshs 63.8 bn and Lamu Port-South Sudan, Ethiopia Transport (LAPSSET) Corridor at Kshs 7.5 bn.
The graph below shows the budget allocation to the infrastructure sector over the last nine financial years;
Source: National Treasury
We expect the infrastructure sector to continue recording increased activities attributable to the government’s continued aggressiveness to ensure that all projects in the pipeline are completed through partnerships to fund the developmental fiscal deficits.
- Statutory Reviews
During the week, the government of Kenya announced plans to review property rates after every five years as contained in the proposed National Rating Bill, 2021, to ensure the government does not lose out on the current capital appreciations of public land. The state seeks to have counties review their valuation rolls every five years with an allowable extension of up to 2 years, with the valuation being done under the current market prices. This follows the surging prices especially in the urban areas which deny counties revenues as they continue to use outdated laws and ratings as per the Rating Act of 1963 whose rates do not match the appreciations in the current market. In the proposed legislation, land valuers will be required to prepare a draft valuation roll listing all properties within the county and their details including; i) map area and description, ii) the name and address of the rateable owner, iii) use of the property, iv) assessment of improvement rate, and, v) nature of subdivision. This will include all public land except land used exclusively for public purposes, and those rateable property leased for foreign embassies and missions. Supplementary valuation rolls can also be prepared within the tenor to capture omissions from the main roll, any new rateable property, subdivisions and consolidations and rate amendments. The bill also seeks to setup a National Rating Tribunal to hear and determine matters relating to land valuations in the counties. The final valuation report is expected to include the valuation methodology, date of valuation, signature of the valuer and any other relevant information before adoption by the county governments.
The government continues to foster progressive legislations to align with the current market requirements in order to boost revenues in land transactions. We therefore expect an increase in revenues in the counties which will fund the County Development Agendas alongside the equitable share.
The real estate sector is expected to record improving performance from the recovery of the hospitality sector, the government’s commitment to see pipeline projects to completion and the progressive regulations to increase the county revenue base to fund development.
Unit Trust Funds (UTFs) are collective investment schemes that pool funds from different investors and are managed by professional fund managers. The fund managers invest the pooled funds in a portfolio of securities with the aim of generating returns to meet the specific objectives of the fund. Following the release of the Capital Markets Authority (CMA) Quarterly Statistical Bulletin – Q2’2021, we analyze the performance of Unit Trust Funds, as the total Assets Under Management (AUM) have been steadily increasing and they are among the most popular investment options in the Kenyan market. We will further analyze the performance of Money Market Funds, a product under Unit Trust Funds. In our previous focus on Unit Trust Funds, we looked at the FY’2020 Performance by Unit Trust Fund Managers. In this topical, we focus on the Q1’2021 performance of Unit Trust Funds where we shall analyze the following:
- Performance of the Unit Trust Funds Industry,
- Performance of Money Market Funds,
- Comparing Unit Trust Funds AUM Growth with other Markets, and,
- Conclusion
Section I: Performance of the Unit Trust Funds Industry
Unit Trust Funds are investment schemes that pool funds from investors and are managed by professional Fund Managers. The fund manager invests the pooled funds with the aim of generating returns in line with the specific objectives of the fund. The Unit Trust Funds earn returns in the form of dividends, interest income, rent and/or capital gains depending on the underlying security. The main types of Unit Trust Funds include:
- Money Market Funds – These are funds that invests in fixed income securities such as fixed deposits, treasury bills and bonds, commercial papers, etc. They are very liquid, have stable returns, and, they are suitable for risk averse investors,
- Equity Funds – These are funds which largely invest in listed securities and seek to offer superior returns over the medium to long-term by maximizing capital gains and dividend income. The funds invest in various sectors to reduce concentration of risk and maintain some portion of the fund’s cash in liquid fixed income investments to maintain liquidity and pay investors if need be without losing value,
- Balanced Funds – These are funds whose investments are diversified across the Equities and the Fixed Income market. The Balanced Fund offers investors long-term growth as well as reasonable levels of stability of income,
- Fixed Income Funds – These are funds which invest in interest-bearing securities, which include treasury bills, treasury bonds, preference shares, corporate bonds, loan stock, approved securities, notes and liquid assets consistent with the portfolio’s investment objective, and,
- Sector Specific Funds – These are funds that invest primarily in a particular sector or industry. The funds provide a greater measure of diversification within a given sector than may be otherwise possible for the other funds. They are specifically approved by the capital Markets Authority as they are not invested as per the set rules and regulations.
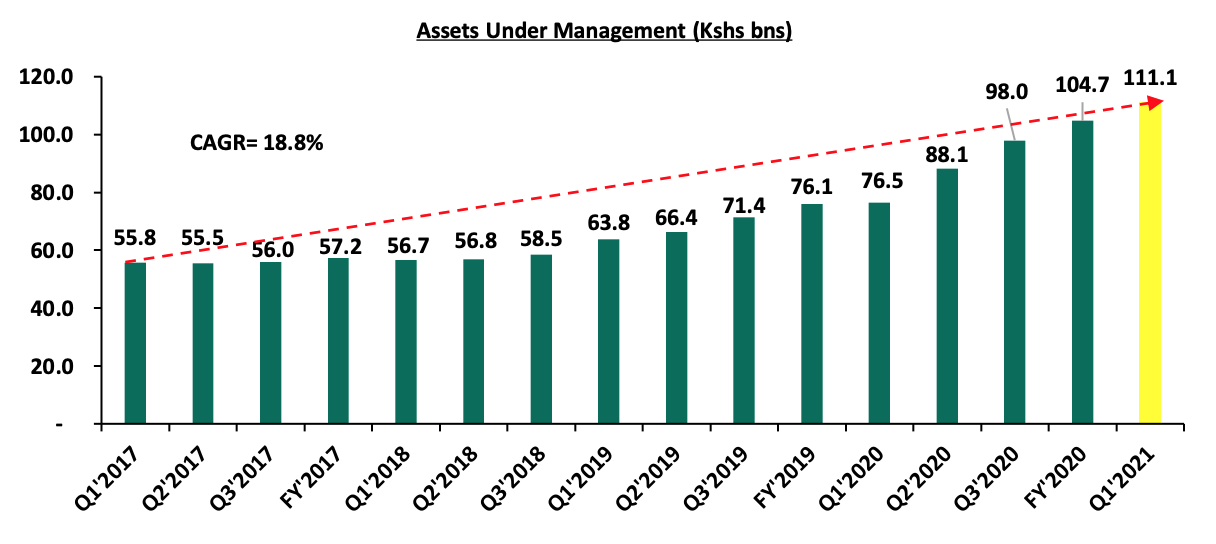
As per the Capital Markets Authority (CMA) Quarterly Statistical Bulletin – Q2’2021, the industry’s overall Assets Under Management (AUM) grew by 6.1% to Kshs 111.1 bn as at the end of Q1’2021, from Kshs 104.7 bn as at the end of FY’2020. Assets Under Management of the Unit Trust Funds have grown at a 4-year CAGR of 18.8% to Kshs 111.1 bn in Q1’2021, from Kshs 55.8 bn recorded in Q1’2017.
This growth can be largely attributable to:
- Low Investments minimums: Unit Trust Funds have become relatively affordable to retail investors, with a majority of the Collective Investment Schemes’ (CIS) in the market requiring an initial investment ranging between Kshs 100.0 - Kshs 10,000.0,
- Increased Investor Knowledge: There has been a drive towards investor education which has meant that more people are aware and have a deeper understanding of the investment subject. As a result, their confidence has been boosted and more of them are investing,
- Diversified product offering: Unit Trust Funds are also advantageous in terms of offering investors the opportunity of diversifying their portfolios by providing them with access to a wider range of investment securities through pooling of funds, which would have not been accessible if they invested on their own,
- Efficiency and ease of access to cash/High Liquidity: Funds invested in UTFs are invested as portfolios with different assets and the fund managers always maintain a cash buffer, they are relatively liquid and investors can get their cash on demand. Unit trusts are highly liquid, as it is easy to sell and buy units without depending on demand and supply at the time of investment or exit, and,
- Adoption of Fintech: Digitization and automation within the industry has enhanced liquidity, enabling investors to receive their funds within 3 to 5 working days if they are withdrawing to their bank accounts, and immediate access to funds when withdrawing via M-PESA. According to the Central Bank of Kenya, more and more individuals are transacting through mobile money services as evidenced by the increase in the total number of registered mobile money accounts to 68.1 mn in August 2021 from 66.6 mn recorded in January 2021. Fintech has increased the efficiency of processing both payments and investments for fund managers.
According to the Capital Markets Authority, as at the end of Q1’2021, there were 25 approved Collective Investment Schemes in Kenya. Out of the 25, however, only 19 were active while 6 were inactive. During the period under review, total Assets Under Management grew by 6.1% to Kshs 111.1 bn in Q1’2021, from Kshs 104.7 bn as at the end of FY’2020. The table below outlines the performance of the Fund Managers:
|
|
Assets Under Management (AUM) for the Approved and Active Collective Investment Schemes |
|||||
|
No. |
Fund Managers |
FY'2020 AUM (Kshs mns) |
FY'2020 Market Share |
Q1'2021 AUM (Kshs mns) |
Q1'2021 Market Share |
AUM Growth FY'2020 – Q1'2021 |
|
1 |
CIC Asset Managers |
42,988.1 |
41.1% |
44,761.7 |
40.3% |
4.1% |
|
2 |
Britam |
12,304.8 |
11.8% |
14,150.3 |
12.7% |
15.0% |
|
3 |
NCBA Unit Trust Scheme |
12,543.2 |
12.0% |
13,609.4 |
12.3% |
8.5% |
|
4 |
ICEA Lion |
11,521.0 |
11.0% |
11,843.3 |
10.7% |
2.8% |
|
5 |
Sanlam Investments |
6,279.8 |
6.0% |
6,758.7 |
6.1% |
7.6% |
|
6 |
Old Mutual |
6,131.3 |
5.9% |
6,168.5 |
5.6% |
0.6% |
|
7 |
Dry Associates |
2,360.9 |
2.3% |
2,581.9 |
2.3% |
9.4% |
|
8 |
Madison Asset Managers |
1,928.6 |
1.8% |
1,896.8 |
1.7% |
(1.7%) |
|
9 |
African Alliance Kenya |
1,813.3 |
1.7% |
1,827.7 |
1.7% |
0.8% |
|
10 |
Nabo Capital (Centum) |
1,654.8 |
1.6% |
1,778.7 |
1.6% |
7.5% |
|
11 |
Zimele Asset Managers |
1,420.4 |
1.4% |
1,454.5 |
1.3% |
2.4% |
|
12 |
Co-op Trust Investment Services Limited |
1,007.1 |
1.0% |
1,371.9 |
1.2% |
36.2% |
|
13 |
Cytonn Asset Managers |
819.5 |
0.8% |
960.2 |
0.9% |
17.2% |
|
14 |
Apollo Asset Managers |
587.3 |
0.6% |
685.8 |
0.6% |
16.8% |
|
15 |
Genghis Capital |
700.0 |
0.7% |
645.5 |
0.6% |
(7.8%) |
|
16 |
Equity Investment Bank |
310.8 |
0.3% |
297.9 |
0.3% |
(4.1%) |
|
17 |
Alphafrica Asset Managers |
208.1 |
0.2% |
216.4 |
0.2% |
4.0% |
|
18 |
Amana Capital |
135.4 |
0.1% |
75.6 |
0.1% |
(44.2%) |
|
19 |
Wanafunzi Investments |
0.5 |
0.0% |
0.6 |
0.0% |
0.0% |
|
20 |
Metropolitan Cannon Asset Managers |
- |
- |
- |
- |
- |
|
21 |
FCB Capital Limited |
- |
- |
- |
- |
- |
|
22 |
Fusion Investment Management Ltd |
- |
- |
- |
- |
- |
|
23 |
Standard Chartered Investment Services |
- |
- |
- |
- |
- |
|
24 |
Natbank Trustee & Investment Services |
- |
- |
- |
- |
- |
|
25 |
ABSA Asset Management Ltd |
- |
- |
- |
- |
- |
|
|
Total |
104,714.9 |
100.0% |
111,085.3 |
100.0% |
6.1% |
Source: Capital Markets Authority: Quarterly Statistical Bulletin, Q2’2021
Key to note from the above table:
- Assets Under Management: CIC Asset Managers remained the largest overall Unit Trust Fund Manager with an AUM of Kshs 44.8 bn in Q1’2021, from an AUM of Kshs 43.0 bn as at FY’2020, translating to a 4.1% AUM growth,
- Market Share: CIC Asset Managers remained the largest overall Unit Trust with a market share of 40.3%, a decline from 41.1% in FY’2020. Key to note, Britam recorded the highest increase in its market share with the market share increasing to 12.7%, from 11.8% in FY’2020, and,
- Growth: In terms of AUM growth, Co-op Trust Investment Services Limited recorded the strongest growth of 36.2%, with its AUM increasing to Kshs 1.4 bn, from Kshs 1.0 bn in FY’2020. Cytonn Asset Managers recorded a growth of 17.2%, with its AUM increasing to Kshs 960.2 mn, from Kshs 819.5 mn in FY’2020. Amana Capital recorded the largest decline, with its AUM declining by 44.2% to Kshs 75.6 mn in Q1’2021, from Kshs 135.4 mn in FY’2020.
Metropolitan Cannon Asset Managers, FCB Capital Limited, Fusion Investment Management Ltd, Standard Investment Trust, NatBank Trustee & Investment Services, and ABSA Asset Management Ltd remained inactive as at the end of Q1’2021.
Section II: Performance of Money Market Funds
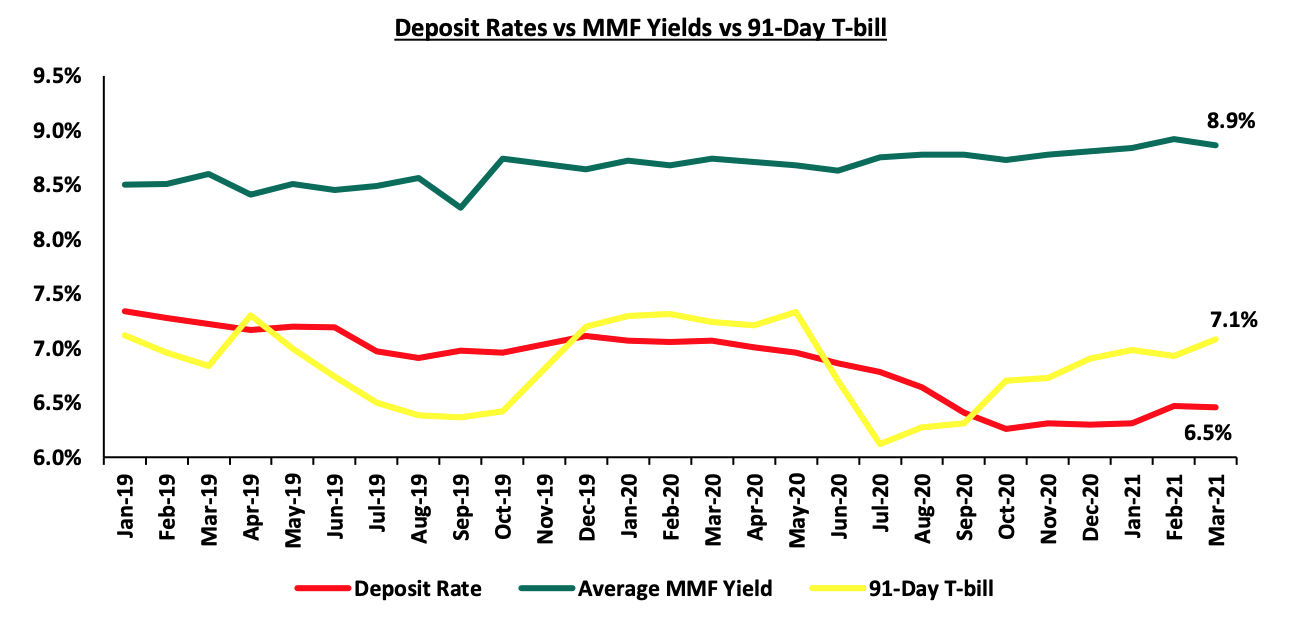
Money Market Funds (MMFs) in the recent past have gained popularity in Kenya, with one of the main reasons being the higher returns money market funds offer compared to the returns on bank deposits and treasury bills. According to the Central Bank of Kenya data, the average deposit rate during the year declined to 6.4% in Q1’2021, from an average of 6.7% recorded as at the end of FY’2020. The average deposit rate and average 91-Day T-bill rate still remained lower than the average MMF yields of 8.9%.
As per regulations, funds in MMFs should be invested in liquid interest-bearing securities. These securities include bank deposits, securities listed on NSE, and securities issued by the Government of Kenya. The fund is best suited for investors who require a low-risk investment that offers capital stability, liquidity, and require a high-income yield. The fund is also a good safe haven for investors who wish to switch from a higher risk portfolio to a low risk portfolio, especially in times of uncertainty.
Top Five Money Market Funds by Yields
During the period under review, the following Money Market Funds had the highest average effective annual yield declared, with the Cytonn Money Market Fund having the highest effective annual yield at 10.7% against the industrial average of 8.9%.
|
Top 5 Money Market Fund Yield in Q1'2021 |
||
|
Rank |
Money Market Fund |
Effective Annual Rate (Average Q1'2021) |
|
1 |
Cytonn Money Market Fund |
10.71% |
|
2 |
Zimele Money Market Fund |
9.85% |
|
3 |
Alphafrica Kaisha Money Market Fund |
9.85% |
|
4 |
Nabo Africa Money Market Fund |
9.80% |
|
5 |
CIC Money Market Fund |
9.66% |
|
|
Industrial Average |
8.87% |
Section III: Comparing Unit Trust Funds AUM Growth with other Markets
Unit Trust Funds assets recorded a q/q growth of 6.1% in Q1’2021, while the listed bank deposits recorded a weighted growth of 21.8% over the same period. For both the Unit Trust Funds and bank deposits, this was higher than the values recorded as at Q1’2020 of 0.5% and 14.3%, respectively. The chart below highlights the Unit Trust Funds AUM growth vs bank deposits growth in Q1’2021;
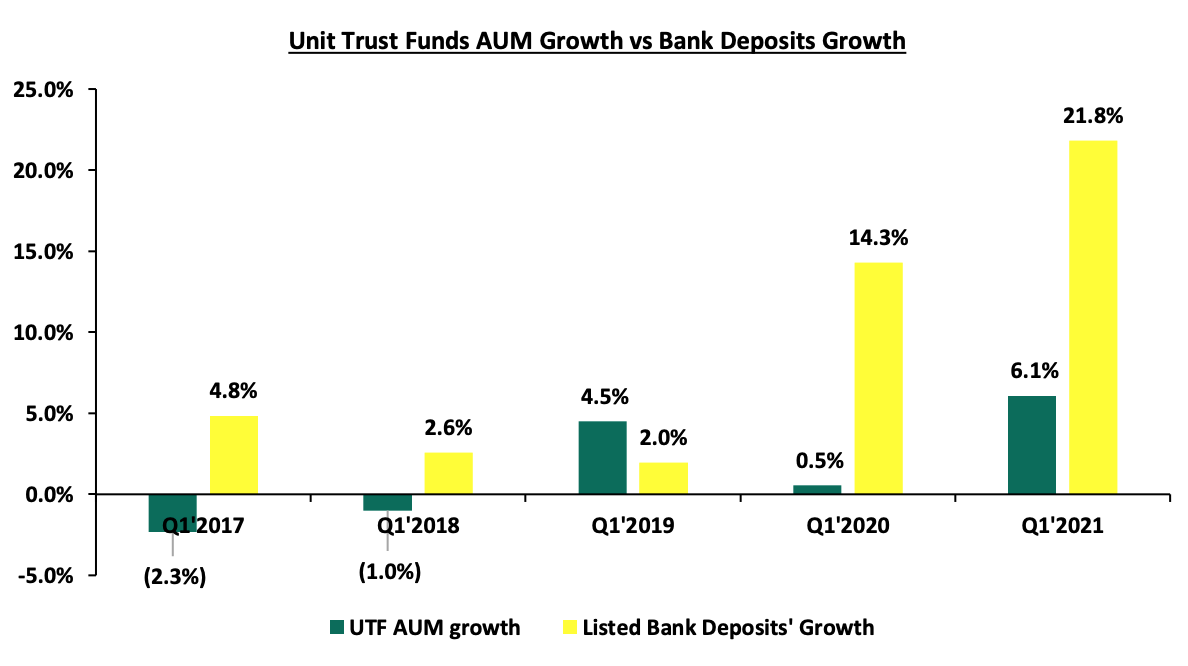
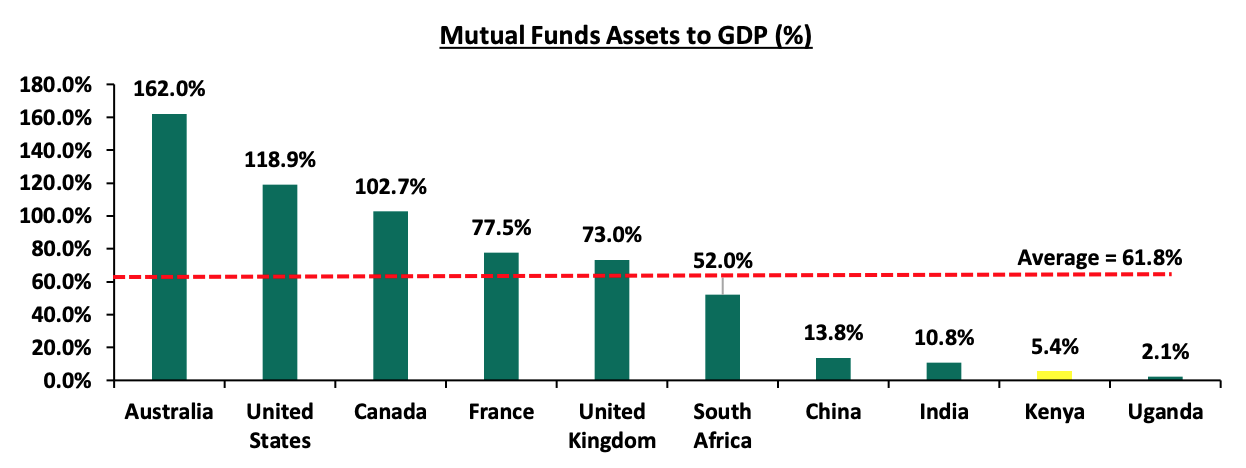
Unit Trust Funds’ growth of 6.1% was outpaced by the listed banking sector’s deposit growth of 21.8% in Q1’2021. We note that Q1’2021’s performance was better than the 0.5% growth seen in Q1’2020, an indication of the improving investor confidence in our capital markets. However, the faster growth of bank deposits highlights that the potential of our capital markets remains constrained. According to World Bank data, in well-functioning economies, businesses rely on bank funding for a mere 40.0%, with the larger percentage of 60.0% coming from the Capital markets. Closer home, CMA notes that in 2020, businesses in Kenya relied on banks for 95.0% of their funding while less than 5.0% came from the capital markets. Additionally, our Mutual Funds/UTFs to GDP ratio at 5.4% is still very low compared to global average of 61.8%, indicating that we still have room to improve and enhance our capital markets. The table below shows some countries’ mutual funds as a percentage of GDP:
Source: World Bank Data
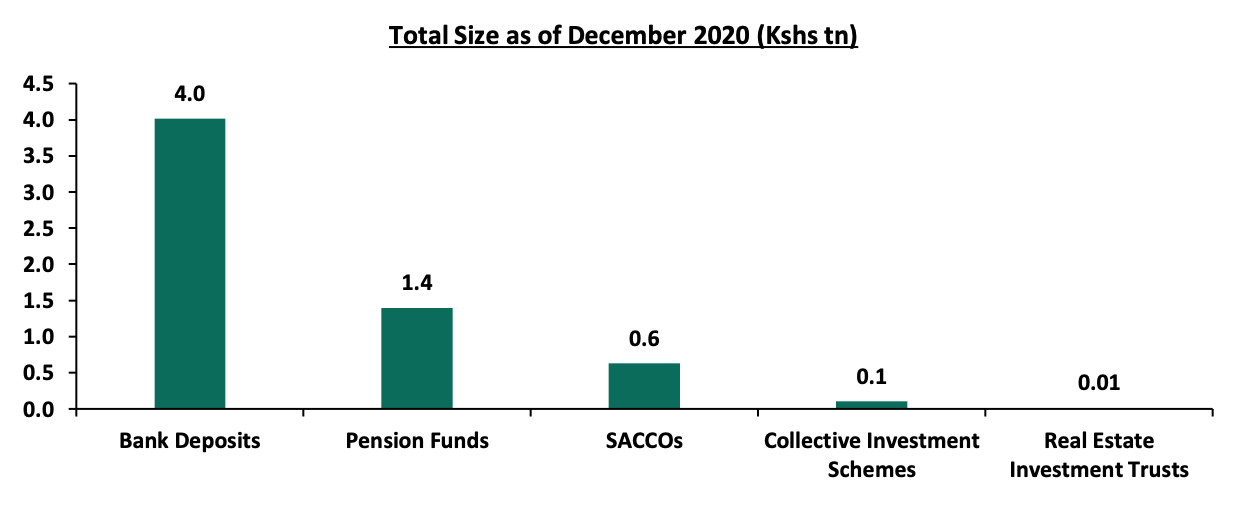
Over the past 4 years, the UTFs AUM has grown at a CAGR of 18.8% to Kshs 111.1 bn in Q1’2021, from Kshs 55.8 bn recorded in Q1’2017. However, even at Kshs 111.1 bn, the industry is dwarfed by asset gatherers such as bank deposits at Kshs 4.0 tn and the pension industry at Kshs 1.4 tn as of the end of 2020. Below is a graph showing the sizes of different saving channels and capital market products in Kenya as at December 2020:
In order to improve our Capital Markets and stimulate its growth, we recommend the following actions:
- Allow for sector funds: The current capital markets regulations require that funds must diversify. Consequently, one has to seek special dispensation in the form of sector funds such as a financial services fund, a technology fund or a real estate UTF fund. Regulations allowing unit holders to invest in sector funds would expand the scope of unit holders interested in investing,
- Reduce the minimum investments to reasonable amounts: Currently, the minimum investment for sector specific funds is Kshs 1.0 mn, while that for Development REITS is currently at Kshs 5.0 mn. The high minimum initial and top up investments amounts are unreasonably high given that the national median income for employed individuals is estimated at around Kshs 50,000, it therefore locks out a lot of potential investors. Additionally, these high amounts discriminate against most retail investors giving them fewer investment choices,
- Eliminate conflicts of interest in the governance of capital markets: The capital markets regulations should enable a governance structure that is more responsive to market participants and market growth,
- Create increased competition in the market by encouraging different players to set up shop and offer different services such as the opening up of Trustees to non-financial institutions: Competition in capital markets will not only push Unit Trust Fund managers to provide higher returns for investors but will also eliminate conflicts of interest in markets and enhance the provision of innovative products and services, and,
- Improve fund transparency to provide investors with more information: Each Unit Trust Fund should be required to publish their portfolio holdings on a quarterly basis and make the information available to the public so as to enhance transparency for investors. Providing investors with more information will help both investors and prospects make better informed decisions and subsequently improve investor confidence.
During Q3’2021, we saw the Capital Markets Authority (CMA) publish two draft regulations; the Capital Markets (Collective Investment Schemes) Regulations 2021 and the Capital Markets (Collective Investment Schemes) (Alternative Investment Funds) Regulations 2021. The proposed regulations seek to update the current Collective Investment Scheme Regulations given the change in market dynamics since the last published Regulations in 2001, as well as address emerging issues. The move by CMA to review the current regulations is welcomed as it seems intended to improve the Capital Markets in Kenya by providing more versatile regulations and provide for existence of regulated funds that invest in alternative asset classes. However, it’s our view that proceeding with the regulations as proposed would not be ideal for the market. In our Draft CMA Investments Regulations topical, we analyzed these regulations and thereafter gave our recommendations on the areas of improvement.
Section IV: Conclusion
There is a need to leverage more on innovation and digitization in order to ensure continued growth of the capital markets and further propel the growth of UTFs in Kenya. The use of technology as a distribution channel for mutual fund products has potential to open up the capital markets to the retail segment, which is characterized by strong demand among retail clients for convenient and innovative products. Regulators should also strive to promote and facilitate growth of UTFs as this will enhance the growth of capital markets and consequently encourage entry of new players into the market. For instance, Yu’eBao, formerly the world’s largest Money Market Fund, rapidly grew since it leveraged on technology and made itself readily available to retail clients. However, it saw some regulatory intervention from Chinese authorities to reduce its size citing the fund’s dominance and liquidity risks. This led to the fund’s AUM declining by 18.6% to USD 148.4 bn as at March 2021, from USD 182.4 bn in December 2020.
Cytonn Asset Managers, which largely leverages on technology such as USSD and digital platforms, experienced a growth of 17.2% to Kshs 960.2 mn in Q1’2021, from Kshs 819.5 mn in FY’2020. The advent of digitization and automation within the industry has also enhanced liquidity. Cytonn Money Market Fund clients can issue withdrawal instructions and have funds remitted to their bank accounts within 2–4 working days while funds withdrawn through the USSD or digital platforms are remitted to their M-Pesa and Bank accounts within 5 minutes and 2 working days respectively. The Cytonn Money Market Fund is accessible through dialing *809#. As highlighted in our topical Potential Effects of COVID-19 on Money Market Funds, we believe that amidst the Coronavirus pandemic, returns for Money Market Funds will remain stable with a bias to a slight increase upwards should rates on government securities increase. They will also remain the most liquid of all mutual funds providing a short-term parking bay that earns higher income yields compared to deposits and savings accounts. UTFs provide a more convenient platform in terms of accessibility and liquidity with the additional benefit of higher returns for investors.
Disclaimer: The views expressed in this publication are those of the writers where particulars are not warranted. This publication, which is in compliance with Section 2 of the Capital Markets Authority Act Cap 485A, is meant for general information only and is not a warranty, representation, advice or solicitation of any nature. Readers are advised in all circumstances to seek the advice of a registered investment advisor.

- Talk to us
- Kenya
- P.O Box 20695 - 00200, Nairobi, Kenya
- Cell +254709101200
- Tel +254709101200
- WhatsApp +254741676635
- United States
- +254709101200
- DOWNLOAD OUR APP
-


- Kenya
- 8th Floor, Pinetree Plaza, Kaburu Drive, Ngong Road, Nairobi, Kenya
- USA
- Suite 1150, 1775 Eye Street NW, USA, Washington DC 20006, USA
- Investments
- High Yield
- Private Equity
- Real Estate
- Real Estate
- RiverRun Estates
- Cytonn Towers
- The Ridge
- Taraji Heights
- The Alma