Unit Trust Funds Performance, Q3'2021, & Cytonn Weekly #04/2022
By Research Team, Jan 30, 2022
Executive Summary
Fixed Income
During the week, T-bills remained oversubscribed, albeit lower than the previous week, with the overall subscription rate coming in at 107.9%, from 119.5% recorded the previous week. The 364-day paper recorded the highest subscription rate, receiving bids worth Kshs 19.1 bn against the offered Kshs 10.0 bn, translating to a subscription rate of 190.5%, an increase from the 144.3%, recorded the previous week. The increase in subscription rate is attributable to investors’ preference for the longer-dated paper which offers higher yields of 9.5% compared to the 7.3% and 8.1% yields offered by the 91-day and 182-day papers, respectively. The subscription rate for the 91-day and 182-day papers, on the other hand, declined to 37.7% and 53.4%, from 48.1% and 123.1%, respectively, recorded the previous week, partly attributable to the tightened liquidity in the money market. The yields on the government papers were on an upward trajectory, with the yields on the 91-day, 182-day and 364-day papers increasing by 1.2 bps, 4.3 bps and 3.4 bps to 7.3%, 8.1% and 9.5%, respectively. For the month of February, the government is seeking to raise Kshs 75.0 bn to fund infrastructure projects by issuing a new infrastructure bond, IFB1/2022/19, with a tenor of 19 years whose period of sale runs from 31st January 2022 to 15th February 2022.
During the week, the Monetary Policy Committee (MPC) met to review the outcome of its previous policy decisions and recent economic developments, and to decide on the direction of the Central Bank Rate (CBR). Notably, the MPC retained the CBR at 7.00%, in line with our expectations, for the twelfth consecutive time. We are projecting the y/y inflation rate for January 2022 to fall within the range of 5.6% - 6.0%, from 5.7% recorded in December 2021, mainly driven by the stabilization of fuel prices locally which is a major contributor to the headline inflation;
Equities
During the week, the equities market was on a downward trajectory, with NASI, NSE 20 and NSE 25 declining by 2.2%, 0.9% and 1.5%, respectively, taking their YTD performance to losses of 3.6%, 2.0% and 3.1% for NASI, NSE 20 and NSE 25, respectively. The equities market performance was driven by losses recorded by large cap stocks such as Safaricom, Bamburi, Equity Group and NCBA Group of 3.3%, 3.0%, 2.4%, and 1.6%, respectively. The losses were however mitigated by gains recorded by stocks such as EABL which gained by 1.3%.
The Central Bank of Kenya (CBK) recently released the Quarterly Economic Review for the period ending 30th September 2021, highlighting that the banking sector’s total assets increased by 10.6% to Kshs 5.8 tn, from Kshs 5.3 tn in September 2020. The sector’s Profit before Tax (PBT) increased by 68.2% to Kshs 49.1 bn, from Kshs 29.2 bn recorded in September 2020;
Real Estate
The Kenya National Bureau of Statistics (KNBS) released the Leading Economic Indicators November 2021, highlighting that the overall international arrivals through Jomo Kenyatta International Airport (JKIA) and Moi International Airport (MIA) increased by 5.1% to 76,706 in November 2021, from 72,809 realized in October 2021. The Central Bank of Kenya (CBK) released the Q3'2021 Quarterly Economic Review, highlighting that the gross loans advanced to the Real Estate sector came in at Kshs 463.0 bn in Q3’2021, representing a 3.2% increase from the Kshs 448.0 bn advanced in H1’2021. In the residential sector, Kenya Mortgage Refinance Company (KMRC), a treasury backed lender, announced that it had made an additional drawdown worth Kshs 2.8 bn on a national treasury loan facility for onward lending to Primary Mortgage Lenders. For the infrastructure sector, the National Government announced that it had begun the documentation process for the dualling of the 40 Km Mtwapa-Kilifi Road. For the listed Real Estate, the Fahari I-REIT closed the week trading at Kshs 6.5 per share an increase of 5.2%, from Kshs 6.2 recorded the previous week;
Focus of the Week
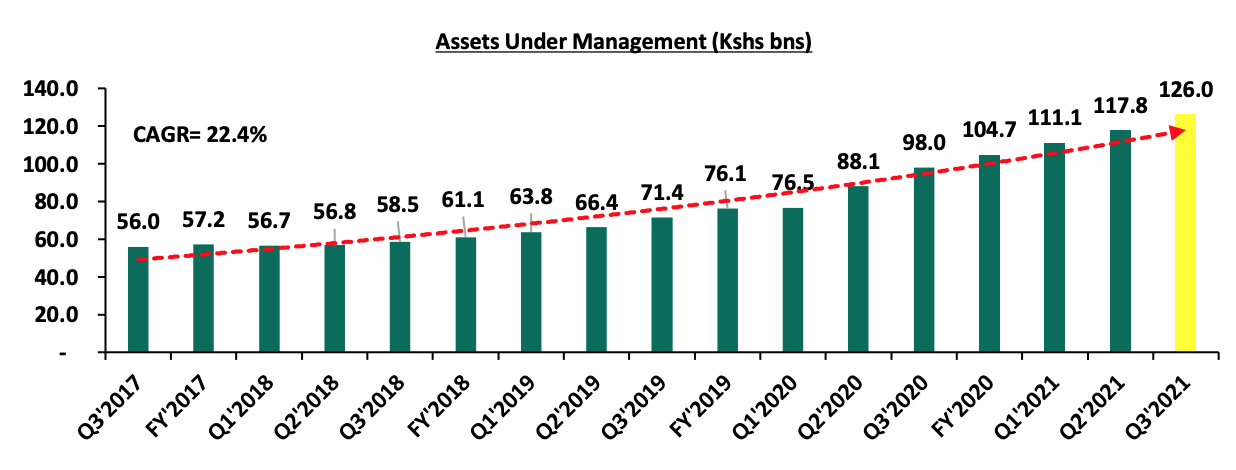
Following the release of the Capital Markets Authority (CMA) Quarterly Statistical Bulletin – Q4’2021 we examine the performance of Unit Trust Funds. During the quarter under review, Unit Trusts’ Assets under Management grew by 7.0% to Kshs 126.0 bn as at the end of Q3’2021, from Kshs 117.8 bn recorded in Q2’2021. Additionally, as at the end of Q3’2021, there were 27 approved Collective Investment Schemes;
Investment Updates:
- Weekly Rates:
- Cytonn Money Market Fund closed the week at a yield of 10.45%. To invest, just dial *809#;
- Cytonn High Yield Fund closed the week at a yield of 14.04% p.a. To invest, email us at sales@cytonn.com and to withdraw the interest you just dial *809#;
- Kevin Karobia, Assistant Alternative Investments Analyst, was on Metropol TV to talk about Kenya’s Banking Sector Profitability, with a focus on the pre-pandemic performance and the Q3’2021 performance. Watch Kevin here;
- We continue to offer Wealth Management Training every Wednesday and every third Saturday of the month, from 9:00 am to 11:00 am, through our Cytonn Foundation. The training aims to grow financial literacy among the general public. To register for any of our Wealth Management Trainings, click here;
- If interested in our Private Wealth Management Training for your employees or investment group, please get in touch with us through wmt@cytonn.com;
- Any CHYS and CPN investors still looking to convert are welcome to consider one of the five projects currently available for conversion, click here for the latest conversion term sheet;
- Cytonn Insurance Agency acts as an intermediary for those looking to secure their assets and loved ones’ future through insurance namely; Motor, Medical, Life, Property, WIBA, Credit and Fire and Burglary insurance covers. For assistance, get in touch with us through insuranceagency@cytonn.com;
- Cytonnaire Savings and Credit Co-operative Society Limited (SACCO) provides a savings and investments avenue to help you in your financial planning journey. To enjoy competitive investment returns, kindly get in touch with us through clientservices@cytonn.com;
Real Estate Updates:
- For an exclusive tour of Cytonn’s real estate developments, visit: Sharp Investor's Tour, and for more information, email us at sales@cytonn.com;
- Phase 3 of The Alma is now ready for occupation. To rent please email properties@cytonn.com;
- We have 8 investment-ready projects, offering attractive development and buyer targeted returns; See further details here: Summary of Investment-ready Projects;
- For recent news about the group, see our news section here;
Hospitality Updates:
- We currently have promotions for Staycations. Visit cysuites.com/offers for details or email us at sales@cysuites.com;
Other Updates:
- Our CEO, Edwin H. Dande, was on Mwango Capital Twitter Spaces discussing the History, Business Model and Future of Cytonn. Listen to him here;
Money Markets, T-Bills Primary Auction:
During the week, T-bills remained oversubscribed, albeit lower than the previous week, with the overall subscription rate coming in at 107.9%, from 119.5% recorded the previous week. The 364-day paper recorded the highest subscription rate, receiving bids worth Kshs 19.1 bn against the offered Kshs 10.0 bn, translating to a subscription rate of 190.5%, an increase from the 144.3%, recorded the previous week. The increase in subscription rate is attributable to investors’ preference for the longer-dated paper which offers higher yields of 9.5% compared to the 7.3% and 8.1% yields offered by the 91-day and 182-day papers, respectively. The subscription rate for the 91-day and 182-day papers declined to 37.7% and 53.4%, from 48.1% and 123.1%, respectively, recorded the previous week, partly attributable to tightened liquidity in the money market. The yields on the government papers were on an upward trajectory, with the yields on the 91-day, 182-day and 364-day papers increasing by 1.2 bps, 4.3 bps and 3.4 bps to 7.3%, 8.1% and 9.5%, respectively. The government continued to reject expensive bids, accepting bids worth Kshs 24.5 bn out of the Kshs 25.9 bn worth of bids received, translating to an acceptance rate of 94.5%.
For the month of February, the government is seeking to raise Kshs 75.0 bn to fund infrastructure projects by issuing a new infrastructure bond, IFB1/2022/19, with a tenor of 19 years, whose period of sale runs from 31st January 2022 to 15th February 2022. Key to note, the bond’s coupon rate will be market determined. Given the ample liquidity in the market evidenced by January’s average interbank rate declining to 4.5%, from 5.1% recorded in December, as well as the attractive tax-free nature of the infrastructure bond, we anticipate an oversubscription and a higher acceptance rate. Our recommended bidding range for the bond is: 12.4%-12.5% within which bonds of a similar tenor are trading.
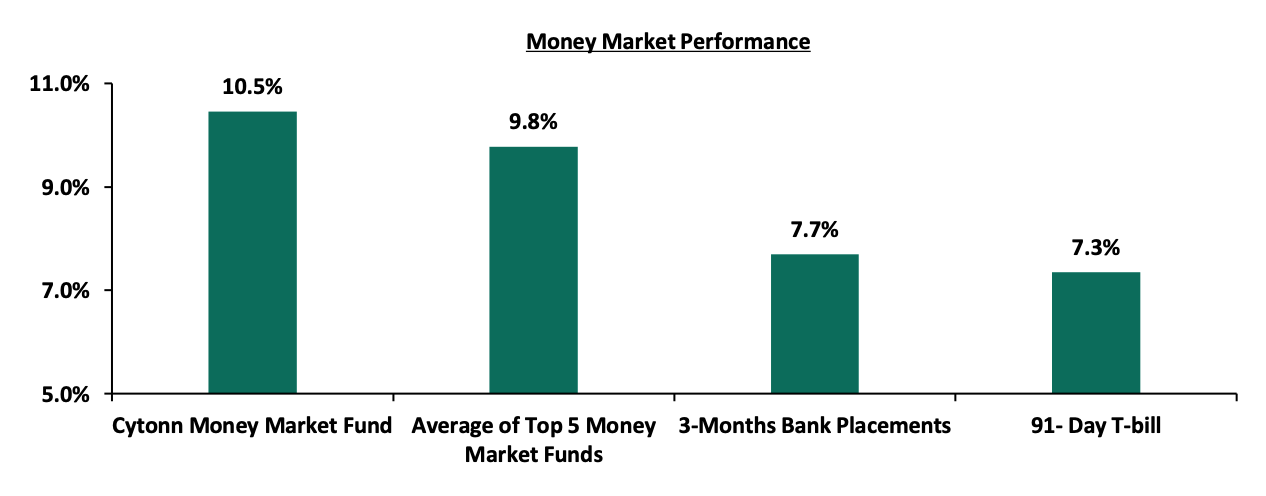
In the money markets, 3-month bank placements ended the week at 7.7% (based on what we have been offered by various banks), while the yield on the 91-day T-bill increased by 1.2 bps to 7.3%. The average yield of the Top 5 Money Market Funds and the yield of the Cytonn Money Market Fund remained relatively unchanged at 9.8% and 10.5%, respectively, as was recorded the previous week.
The table below shows the Money Market Fund Yields for Kenyan Fund Managers as published on 28th January 2022:
|
|
Money Market Fund Yield for Fund Managers as published on 28th January 2022 |
|
|
Rank |
Fund Manager |
Effective Annual Rate |
|
1 |
Cytonn Money Market Fund |
10.5% |
|
2 |
Zimele Money Market Fund |
9.9% |
|
3 |
Nabo Africa Money Market Fund |
9.7% |
|
4 |
Sanlam Money Market Fund |
9.5% |
|
5 |
CIC Money Market Fund |
9.3% |
|
6 |
Madison Money Market Fund |
9.1% |
|
7 |
Apollo Money Market Fund |
9.0% |
|
8 |
GenCapHela Imara Money Market Fund |
8.9% |
|
9 |
Dry Associates Money Market Fund |
8.7% |
|
10 |
Orient Kasha Money Market Fund |
8.7% |
|
11 |
British-American Money Market Fund |
8.5% |
|
12 |
Co-op Money Market Fund |
8.5% |
|
13 |
NCBA Money Market Fund |
8.4% |
|
14 |
ICEA Lion Money Market Fund |
8.3% |
|
15 |
AA Kenya Shillings Fund |
7.6% |
|
16 |
Old Mutual Money Market Fund |
7.3% |
Source: Business Daily
Liquidity:
During the week, liquidity in the money markets tightened, with the average interbank rate increasing to 4.73%, from 4.68% recorded the previous week, partly attributable to tax remittances which offset government payments. The average interbank volumes traded declined by 42.4% to Kshs 10.8 bn, from Kshs 18.8 bn recorded the previous week.
Kenya Eurobonds:
During the week, the yields on Eurobonds recorded mixed performance, with yields on the 10-year bond issued in 2014, 30-year bonds issued in 2018 and the 12-year bond issued in 2021 all remaining unchanged at 4.4%, 8.7% and 7.1%, respectively. Yields on the 10-year bond issued in 2018 increased by 0.2% points to 6.6%, from 6.4%, while yields on the 7-year and 12-year bonds issued in 2019 both increased by 0.1% points to 6.3% and 7.3%, from 6.2% and 7.2%, respectively, recorded the previous week. Below is a summary of the performance:
|
Kenya Eurobond Performance |
||||||
|
|
2014 |
2018 |
2019 |
2021 |
||
|
Date |
10-year issue |
10-year issue |
30-year issue |
7-year issue |
12-year issue |
12-year issue |
|
3-Jan-22 |
4.4% |
5.7% |
8.1% |
5.6% |
6.7% |
6.6% |
|
21-Jan-22 |
4.4% |
6.4% |
8.7% |
6.2% |
7.2% |
7.1% |
|
24-Jan-22 |
4.4% |
6.5% |
8.7% |
6.3% |
7.3% |
7.2% |
|
25-Jan-22 |
4.5% |
6.6% |
8.7% |
6.4% |
7.4% |
7.2% |
|
26-Jan-22 |
4.4% |
6.6% |
8.8% |
6.4% |
7.4% |
7.2% |
|
27-Jan-22 |
4.4% |
6.6% |
8.7% |
6.3% |
7.3% |
7.1% |
|
Weekly Change |
0.0% |
0.2% |
0.0% |
0.1% |
0.1% |
0.0% |
|
MTD Change |
0.0% |
0.9% |
0.6% |
0.7% |
0.6% |
0.5% |
|
YTD Change |
0.0% |
0.9% |
0.6% |
0.7% |
0.6% |
0.5% |
Source: Central Bank of Kenya
Kenya Shilling:
During the week, the Kenyan shilling depreciated marginally by 0.1% against the US dollar to close the week at Kshs 113.6, from Kshs 113.5 recorded the previous week, partly attributable to increased dollar demand from the oil and energy sectors. Key to note, this is the lowest the Kenyan shilling has ever depreciated against the dollar. On a YTD basis, the shilling has depreciated by 0.4% against the dollar, in comparison to the 3.6% depreciation recorded in 2021. We expect the shilling to remain under pressure in 2022 as a result of:
- Increased demand from merchandise traders as they beef up their hard currency positions in anticipation for more trading partners reopening their economies globally,
- Ever present current account deficit due to an imbalance between imports and exports with Kenya’s current account deficit estimated to come in at 5.4% of GDP in 2021, having expanded by 27.4% in Q3’2021 to Kshs 184.6 bn, from Kshs 145.0 bn recorded in Q3’2020. This was attributed to a robust increase in merchandise imports by 39.6% to Kshs 321.8 bn in Q3’2021, from Kshs 230.5 bn in Q3’2020,
- The aggressively growing government debt, with Kenya’s public debt having increased at a 10-year CAGR of 17.7% to Kshs 7.8 tn in July 2021, from Kshs 1.5 tn in July 2011 thus putting pressure on forex reserves to repay some of the public debt, and,
- Rising global crude oil prices on the back of supply constraints at a time when demand is picking up with the easing of COVID-19 restrictions and as economies reopen. Key to note, risks abound this global recovery following the emergence of the new COVID-19 variants. We are of the view that should the variants continue to spread; most nations will respond swiftly by adopting stringent containment measures to curb transmissions.
The shilling is however expected to be supported by:
- High Forex reserves, currently at USD 8.3 bn (equivalent to 5.1-months of import cover), which is above the statutory requirement of maintaining at least 4.0-months of import cover, and the EAC region’s convergence criteria of 4.5-months of import cover. In addition, the reserves were boosted by the USD 1.0 bn proceeds from the Eurobond issued in July 2021 coupled with the USD 972.6 mn IMF disbursement and the USD 130.0 mn World Bank loan financing received in June 2021, and,
- Improving diaspora remittances evidenced by a 17.0% y/y increase to USD 350.6 mn in December 2021, from USD 299.6 mn recorded over the same period in 2020, which has continued to cushion the shilling against further depreciation.
Weekly Highlight:
- January MPC Meeting
The Monetary Policy Committee (MPC) met on Wednesday, 26th January 2022 to review the outcome of its previous policy decisions and recent economic developments, and to decide on the direction of the Central Bank Rate (CBR). The MPC retained the CBR at 7.00%, in line with our expectations, for the twelfth consecutive time. Below are some of the key highlights from the meeting:
- Inflation remains well anchored and within the Government’s target range of 2.5%-7.5%. The overall inflation declined to 5.7% in December 2021, from 5.8% in November 2021, mainly attributable to improved rainfall that led to increased supply of fast-growing food crops hence a decline in the prices,
- Private sector credit growth has been recovering, having grown by 8.6% in December 2021 as compared to 7.8% in October 2021. The key sectors that have experienced increased lending include consumer durables at 15.0%, transport and communications at 14.3% and manufacturing at 13.1%,
- The recently released GDP data pointed to a strong economic rebound in Q3’2021 with real GDP growing by 9.9%, compared to a 2.1% contraction in Q3’2020. The economic growth reflects the recovery in economic activities following the easing of COVID-19 restrictions and improving global demand,
- The current account deficit to GDP is estimated at 5.4% in 2021, a 0.6% points increase from 4.8% recorded in 2020. Exports of goods remained strong, growing by 11.1% in 2021 compared a 3.2% in 2020. Receipts from exports of horticulture and manufactured goods increased by 18.9% and 33.4%, respectively, in 2021 compared to 2020. However, receipts from tea exports declined by 2.7%, partly attributable to the impact of accelerated purchases in 2020, and,
- The Economic Stimulus Programme and Economic Recovery Strategy implemented by the Government to shield the economy from adverse effects of COVID-19 are expected to continue boosting domestic demand. The MPC also noted that the rebound in revenue performance reflects strong economic recovery and improvement of the business environment.
The MPC concluded that the current accommodative monetary policy stance remains appropriate and therefore decided to retain the Central Bank Rate (CBR) at 7.00%. The Committee will meet again in March 2022, but remains ready to re-convene earlier if necessary.
- Diaspora Remittances Survey December 2021
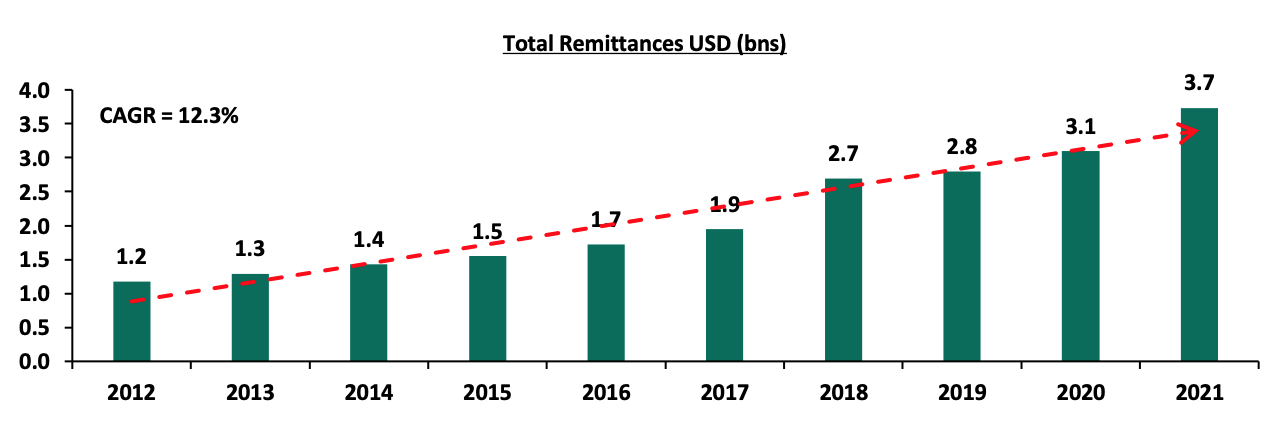
The Central bank of Kenya released the Diaspora Remittances Survey Report highlighting that diaspora remittances remained resilient during the COVID-19 pandemic, with the annual remittances coming in at Kshs 3.1 bn in 2020, compared to Kshs 2.8 bn in 2019. 2021 recorded recovery with remittances increasing by 19.4% to Kshs 3.7 bn from Kshs 3.1 bn recorded in 2020 owing to the reopening of economies and ease of COVID-19 restrictions. Further, the largest sectoral contributor to diaspora remittances include health and social work activities coming in at 12.0%, finance and insurance at 10.0% while education, information and technology both contributed 8.0% to the remittances. Notably, more than half of the remittances were allocated into Real Estate Investments, mortgage payments and purchase of food and household goods.
Key to note, the growth of diaspora remittances is weighed down by high cost of remitting, hidden charges and fees, unfavorable exchange rates applied by service providers leading to high conversion costs and limits on the amounts that can be remitted through mobile money operators. Despite the resilience witnessed during the pandemic, diaspora remittances were negatively affected in 2020 due to disruptions caused by COVID-19 that saw most people lose their jobs as business closed resulting to a decline in sources of income. The graph below shows the total diaspora remittances over the past 10 years:
Going forward, we anticipate stable growth in diaspora remittances on the back of continued economic recovery as more economies in America and the Euro-zone reopen, given that they continue to be the largest sources of diaspora remittances to Kenya, accounting for 79.9% of total remittances in December 2021. Consequently, the stable growth is expected to cushion the shilling against further depreciation given the emergence of new COVID-19 variants and the rising global fuel prices. However, the emergence of new COVID-19 variants such as Omicron pose a risk on diaspora remittance if countries implement strict measures such travel restrictions to mitigate the spread.
- January Inflation projections
We are projecting the y/y inflation rate for January 2022 to fall within the range of 5.6% - 6.0%. The key drivers include:
- Fuel prices for the period 15th January 2022 to 14th February 2022 remained unchanged at Kshs 129.7 per litre for Super Petrol, Kshs 110.6 per litre for Diesel and Kshs 103.5 per litre for Kerosene. With fuel being a major contributor to Kenya's headline inflation, maintaining constant fuel prices is expected to have a muted impact on the inflation basket,
- Food prices have remained relatively stable during the month attributable to improvement in agricultural output due to the ongoing rains in some parts of the country, and,
- The foreign exchange fluctuation tariff for electricity usage remained relatively unchanged at Kshs 73.1 cents per Kilowatt hour (KWh) in December, from Kshs 73.0 cents per Kilowatt hour (KWh) in November 2021. However, the fuel cost charge on electricity bills increased by 10.0% to Kshs 4.6 per Kilowatt hour (KWh) in December, from Kshs 4.2 per Kilowatt hour (KWh) in November. Notably, in January 2022, cost of power declined by 15.0% representing the first part of a 30.0% reduction to power cost promised by the government to take effect by the end of March 2022.
Going forward, we expect the inflation rate to remain within the government’s set range of 2.5% - 7.5%. However, concerns remain high on the widening trade deficit as global fuel prices continue to rise due to supply bottlenecks.
Rates in the fixed income market have remained relatively stable due to the high liquidity in the money market. The government is 8.5% ahead of its prorated borrowing target of Kshs 392.6 bn having borrowed Kshs 426.1 bn of the Kshs 658.5 bn borrowing target for the FY’2021/2022. We expect a gradual economic recovery as evidenced by the revenue collections of Kshs 926.3 bn in revenues during the first six months of the current fiscal year, which is equivalent to 104.3% of the prorated revenue collection target. However, despite the projected high budget deficit of 11.4% and the lower credit rating from S&P Global to 'B' from 'B+', we believe that the support from the IMF and World Bank will mean that the interest rate environment will remain stable since the government is not desperate for cash.
Markets Performance
During the week, the equities market was on a downward trajectory, with NASI, NSE 20 and NSE 25 declining by 2.2%, 0.9% and 1.5%, respectively, taking their YTD performance to losses of 3.6%, 2.0% and 3.1% for NASI, NSE 20 and NSE 25, respectively. The equities market performance was driven by losses recorded by large cap stocks such as Safaricom, Bamburi, Equity Group and NCBA Group of 3.3%, 3.0%, 2.4%, and 1.6%, respectively. The losses were however mitigated by gains recorded by stocks such as EABL, which gained by 1.3%.
During the week, equities turnover increased by 69.0% to USD 23.1 mn, from USD 13.7 mn recorded the previous week, taking the YTD turnover to USD 67.6 mn. Foreign investors remained net sellers, with a net selling position of USD 1.3 mn, from a net selling position of USD 3.6 mn recorded the previous week, taking the YTD net selling position to USD 5.4 mn.
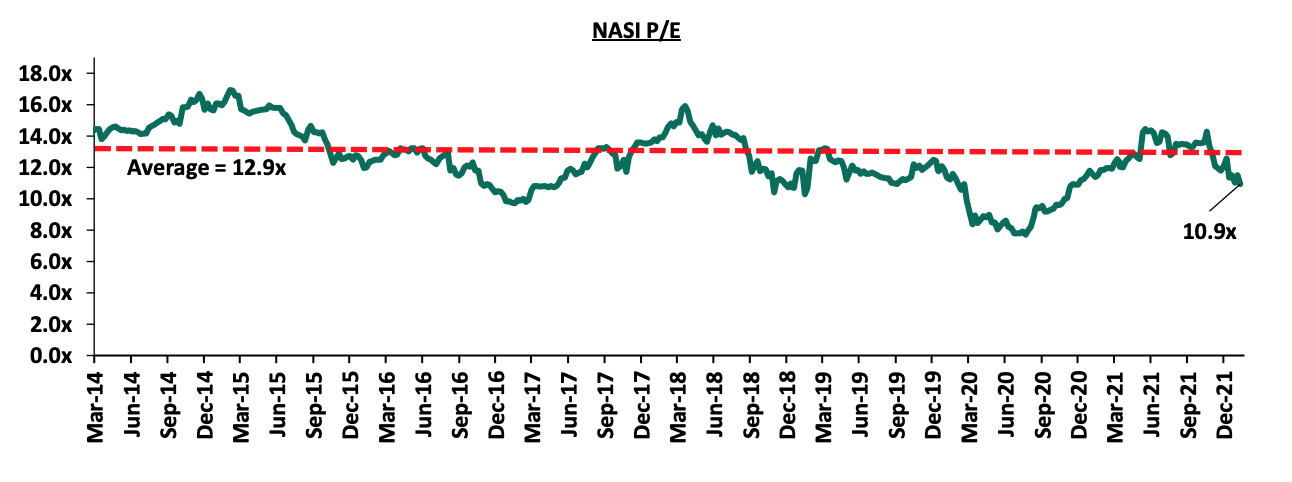
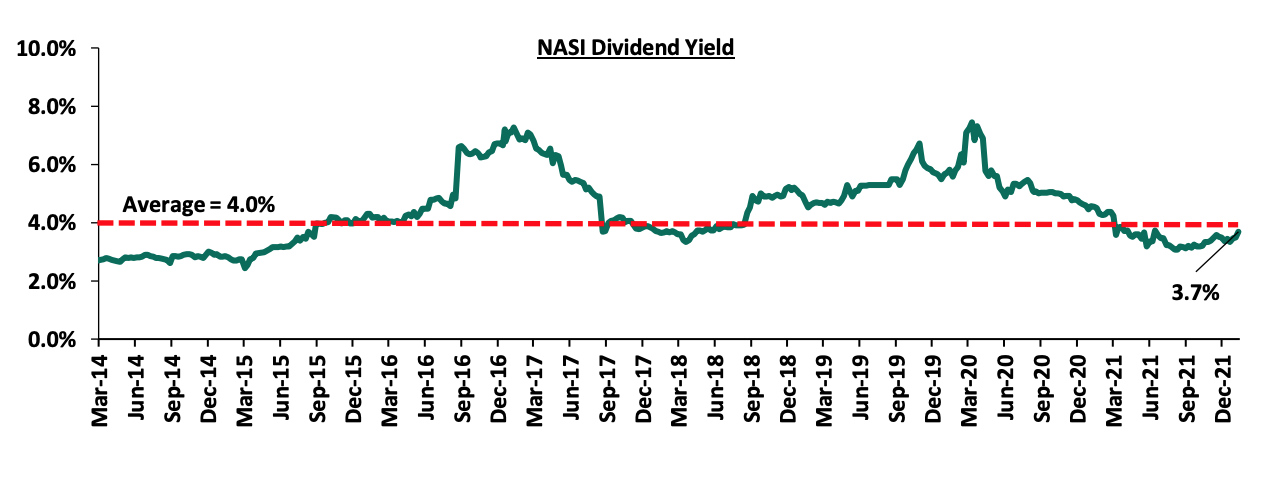
The market is currently trading at a price to earnings ratio (P/E) of 10.9x, 15.4% below the historical average of 12.9x, and a dividend yield of 3.7%, 0.3% points below the historical average of 4.0%. Key to note, NASI’s PEG ratio currently stands at 1.4x, an indication that the market is trading at a premium to its future earnings growth. Basically, a PEG ratio greater than 1.0x indicates the market may be overvalued while a PEG ratio less than 1.0x indicates that the market is undervalued. The current P/E valuation of 10.9x is 41.9% above the most recent trough valuation of 7.7x experienced in the first week of August 2020. The charts below indicate the historical P/E and dividend yields of the market.
Weekly highlight:
- Q3’2021 Quarterly Economic Review
The Central Bank of Kenya (CBK) recently released the Quarterly Economic Review for the period ending 30th September 2021, highlighting that the banking sector remained stable and resilient during the period. According to the report, the sector’s total assets increased by 2.4% to Kshs 5.8 tn in September 2021, from Kshs 5.7 tn in June 2021. The increase was mainly attributable to a 2.7% increase in loans and advances during the quarter. On a yearly basis, total assets increased by 10.6% to Kshs 5.8 tn, from Kshs 5.3 tn in September 2020. Notably, loans and advances accounted for 54.8% of total assets in Q3’2021, which was a 0.1% point increase from 54.7% of total assets in Q2’2021 and a 1.1% points decrease from 55.9% of the total assets in Q3’2020.
Other key take-outs from the report include:
- The banking sector recorded a 2.9% decrease in Profit before Tax (PBT) to Kshs 49.1 bn in Q3’2021, from Kshs 50.5 bn in Q2’2021, with the decline in profitability mainly attributable to the faster 4.7% increase in expenses to Kshs 109.2 bn, from Kshs 104.3 bn in Q3’2021, compared to the 2.2% increase in income to Kshs 157.9 bn, from Kshs 154.5 bn in Q3’2021. On a yearly basis, PBT increased by 68.2%, to Kshs 49.1 bn, from Kshs 29.2 bn recorded in Q3’2020,
- The sector’s Return on Assets (ROA) declined marginally by 0.1% points to 2.6% in Q3’2021, from 2.7% recorded in Q2’2021, and increased by 0.8% points from the 1.8% recorded in Q3’2020. Additionally, Return on Equity (ROE) also declined, recording a 0.7% points decrease to 22.0% in September 2021, from 22.7% in June 2021. However, on a y/y basis, the sector’s Return On Equity increased by 6.9% points from the 15.1% recorded in September 2020,
- Lending increased by 2.7% to Kshs 3.2 tn in Q3’2021, from Kshs 3.1 tn in Q2’2021, attributable to an increase in loans and advances to Financial Services, Real Estate, Manufacturing, and, Personal and Household sectors, which increased by 23.7%, 3.3%, 3.0%, and, 1.1%, respectively. On a yearly basis, lending was up by 8.5% to Kshs 3.2 tn, from Kshs 2.9 tn in Q3’2020,
- Deposits recorded a 2.3% increase to Kshs 4.3 tn in September 2021, from Kshs 4.2 tn in June 2021, attributable to a 2.3% increase in local currency deposits to Kshs 3.3 tn in September 2021, from Kshs 3.2 tn in June 2021. Compared to last year, deposits increased by 11.3% to Kshs 4.3 tn in Q3’2021, from Kshs 3.9 tn in Q3’2020. Key to note, customer deposits remain the main source of funding for banks, accounting for 74.6% of the banking sector’s total liabilities and shareholders’ funds as at Q3’2021. This was a 0.2% points decline from the 74.8% recorded in Q2’2021 but 0.5% higher than the 74.1% recorded in Q3’2020,
- Credit risk remained relatively high in the sector, despite the gross Non-Performing Loans (NPLs) ratio reducing to 13.6% in Q3’2021, from 14.0% in Q2’2021. The Energy sector registered the highest increase in NPLs by 5.9% in Q3’2021 as a result of delayed payments on performed contracts. Year on year, the NPL ratio remained unchanged at 13.6%,
- The sector’s NPL coverage ratio increased to 53.5% in Q3’2021, from 53.0% in Q2’2021, an indication that the banks continued to maintain high provisioning levels given the tough economic conditions. The NPL coverage as of Q3’2020 stood at 46.0%,
- The banking sector remained adequately capitalized, with the aggregate Core Capital to Total Risk-Weighted Assets ratio declining slightly by 0.2% points to 16.3% in Q3’2021, from 16.5% recorded in Q2’2021, but remained unchanged from 16.3% recorded in Q3’2020. The Core Capital to Total Risk-Weighted Assets ratio was 5.8% points above the CBK’s minimum statutory ratio of 10.5%. On the other hand, Total Capital to Total Risk-Weighted Assets ratio, decreased slightly by 0.1% points to 18.8% in Q3’2021, from 18.9% in Q2’2021, and was up 0.6% points from 18.2% recorded in Q3’2020. The Q3’2021 Total Capital to Total Risk-Weighted Assets ratio was 4.3% points above the CBK’s minimum statutory ratio of 14.5%, and,
- The sector remained liquid during the period under review, despite the liquidity ratio declining marginally to 56.7% in Q3’2021, from 56.8% in Q2’2021. The liquidity ratio however increased from 53.1% recorded in Q3’2020. The sector’s liquidity ratio of 56.7% was 36.7% points above the minimum statutory level of 20.0%. The decline in the banking sector’s liquidity is attributable to a 2.5% increase in total short term liabilities, which outpaced the 2.3% increase in total liquid assets during the quarter.
The improving asset quality in the banking sector is an indication that the business environment is indeed improving following the easing of COVID-related restrictions; a factor which will boost the banking sector’s continued recovery and growth in 2022. We however note that the uncertainty surrounding the upcoming general elections may weigh down lending to the private sector during the year due to the perceived higher credit risk. The banking sector sustained healthy profitability levels as the sector continued on its path to recovery in 2021, with the exception of a 2.9% reduction in profitability Q3’2021 which was partly as a result of increased interest expenses during the quarter on mobilized deposits. Overall, we expect the banking sector to remain resilient boosted by the CBK’s efforts to improve their liquidity positions by maintaining the Cash Reserve Ratio at 4.25%, proactive monitoring of the loan book by commercial banks and improved capital adequacy across the sector.
Universe of coverage:
|
Company |
Price as at 21/01/2022 |
Price as at 28/01/2022 |
w/w change |
YTD Change |
Year Open 2022 |
Target Price* |
Dividend Yield |
Upside/ Downside** |
P/TBv Multiple |
Recommendation |
|
Kenya Reinsurance |
2.2 |
2.2 |
(0.4%) |
(3.1%) |
2.3 |
3.3 |
9.0% |
58.4% |
0.2x |
Buy |
|
I&M Group*** |
21.3 |
21.0 |
(1.4%) |
(1.9%) |
21.4 |
24.4 |
10.7% |
26.8% |
0.6x |
Buy |
|
Jubilee Holdings |
309.8 |
302.3 |
(2.4%) |
(4.6%) |
316.8 |
371.5 |
3.0% |
25.9% |
0.6x |
Buy |
|
Sanlam |
10.6 |
9.7 |
(8.1%) |
(16.0%) |
45.6 |
12.1 |
0.0% |
24.8% |
1.0x |
Buy |
|
Britam |
7.3 |
7.0 |
(3.8%) |
(7.1%) |
11.6 |
8.3 |
0.0% |
18.8% |
1.2x |
Accumulate |
|
KCB Group*** |
44.9 |
44.8 |
(0.2%) |
(1.6%) |
130.0 |
51.4 |
2.2% |
16.9% |
0.9x |
Accumulate |
|
Equity Group*** |
51.5 |
50.3 |
(2.4%) |
(4.7%) |
52.8 |
56.6 |
0.0% |
12.7% |
1.3x |
Accumulate |
|
Standard Chartered*** |
130.8 |
131.8 |
0.8% |
1.3% |
87.0 |
137.7 |
8.0% |
12.5% |
1.0x |
Accumulate |
|
Liberty Holdings |
7.0 |
7.0 |
0.3% |
(0.8%) |
7.6 |
7.8 |
0.0% |
11.1% |
0.5x |
Accumulate |
|
NCBA*** |
25.8 |
25.4 |
(1.6%) |
(0.2%) |
7.1 |
26.4 |
5.9% |
9.8% |
0.6x |
Hold |
|
Co-op Bank*** |
13.0 |
13.0 |
(0.4%) |
(0.4%) |
13.0 |
13.1 |
7.7% |
8.6% |
1.0x |
Hold |
|
Stanbic Holdings |
87.3 |
92.0 |
5.4% |
5.7% |
25.5 |
94.7 |
4.1% |
7.1% |
0.8x |
Hold |
|
Diamond Trust Bank*** |
58.0 |
58.5 |
0.9% |
(1.7%) |
59.5 |
61.8 |
0.0% |
5.6% |
0.3x |
Hold |
|
ABSA Bank*** |
11.8 |
11.8 |
(0.4%) |
0.0% |
11.8 |
11.9 |
0.0% |
1.3% |
1.2x |
Lighten |
|
CIC Group |
2.2 |
2.2 |
2.3% |
3.2% |
2.2 |
2.0 |
0.0% |
(8.7%) |
0.8x |
Sell |
|
HF Group |
3.5 |
3.6 |
2.3% |
(5.8%) |
3.8 |
3.0 |
0.0% |
(17.5%) |
0.2x |
Sell |
|
*Target Price as per Cytonn Analyst estimates **Upside/ (Downside) is adjusted for Dividend Yield ***For Disclosure, these are stocks in which Cytonn and/or its affiliates are invested in |
||||||||||
We are “Neutral” on the Equities markets in the short term. With the market currently trading at a premium to its future growth (PEG Ratio at 1.4x), we believe that investors should reposition towards value stocks with strong earnings growth and that are trading at discounts to their intrinsic value. We expect the discovery of new COVID-19 variants, the upcoming Kenyan general elections and the slow vaccine rollout to continue weighing down the economic outlook. On the upside, we believe that the relaxation of lockdown measures in the country will lead to improved investor sentiments in the economy.
- Industry Reports
The Kenya National Bureau of Statistics (KNBS) released the Leading Economic Indicators November 2021, a report that provides the performance of major economic indicators such as international arrivals, cement consumption among others. The key highlights related to the Real Estate sector includes;
- Overall international arrivals through Jomo Kenyatta International Airport (JKIA) and Moi International Airport (MIA) increased by 5.1% to 76,706 in November 2021, from 72,809 realized in October 2021. On a YoY basis, this was a 59.3% increase from the 31,211 visitors recorded in November 2020. The improvement in performance was mainly attributed to i) the relaxation of travel advisories from countries such as the UK, who have since removed Kenya from the Red-List to the Green list, ii) mass COVID-19 vaccinations which has boosted travel confidence into the country, iii) positive accolades with Nairobi being announced as Africa’s leading business travel destination, and, iv) aggressive local and international marketing of Kenya’s hospitality industry. The graph below shows the number of international arrivals in Kenya between January 2021 and November 2021:
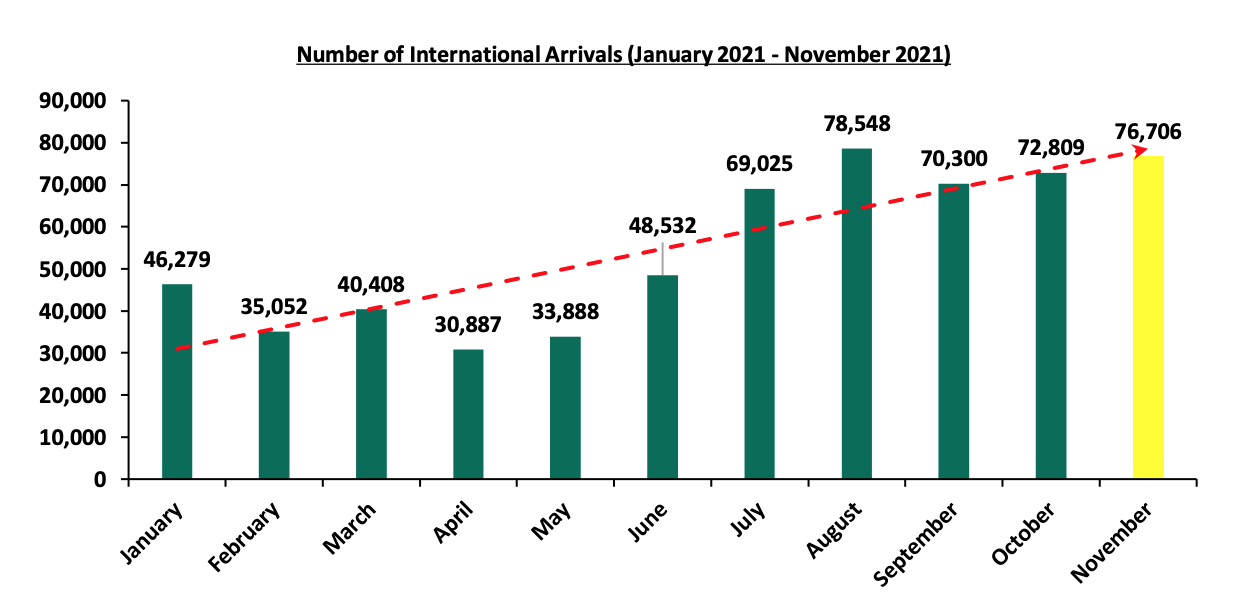
Source: Kenya National Bureau of Statistics (KNBS)
- Cement consumption increased by 4.0% to 7.5 mn metric tonnes between January and October 2021, from 7.2 mn metric tonnes realized in 2020. This was attributed to increased construction activities especially from affordable housing projects and the infrastructure sector. Some of the key ongoing projects includes i) the Nairobi expressway project which is expected to be completed in March 2022, ii) Western Bypass, iii) Pangani Affordable Housing project, and iv) Athi River Waterfront affordable housing Project, among many others. The graph below shows the volumes of cement consumption in Nairobi between 2016 and October 2021:
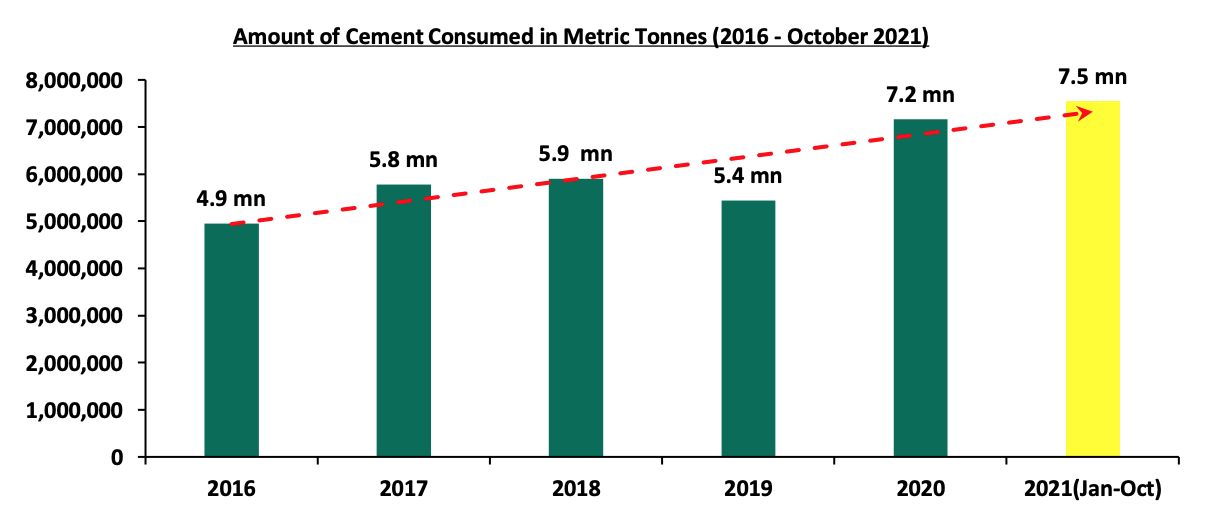
Source: Kenya National Bureau of Statistics (KNBS)
Additionally, the Central Bank of Kenya (CBK) released the Q3’2021 Quarterly Economic Review, highlighting that;
- The gross loans advanced to the Real Estate sector increased by 3.2% to Kshs 463.0 bn in Q3’2021, from Kshs 448.0 bn in H1’2021. On a YoY basis, this was an increase of 6.5% from the Kshs 433.0 bn realized in Q3’2020. Additionally, gross loans advanced to the Tourism sector also increased to Kshs 106.0 bn in Q3’2021, from Kshs 105.0 bn in H1’2021,
- Gross loans advanced to the Building and Construction sector slightly declined by 1.6% to Kshs 123.0 bn in Q3’2021, from Kshs 125.0 bn in H1’2021. This was mainly attributed to minimal construction activities in select Real Estate sectors such as the Commercial Office and Retail sectors that are oversupplied, hence developers withholding construction plans awaiting absorption of existing spaces, and,
- The Gross Non Performing Loans in the Real Estate sector increased by 1.4% to Kshs 69.2 bn in Q3’2021, from Kshs 68.2 bn recorded in H1’2021. On a YoY basis, the performance represented a 16.6% increase from Kshs 57.7 bn realized in Q3’2020, attributed to increased Real Estate loan default rates.
The graph below shows the number of Real Estate non-performing loans compared to the total Real Estate loan book from 2016-Q3’2021;
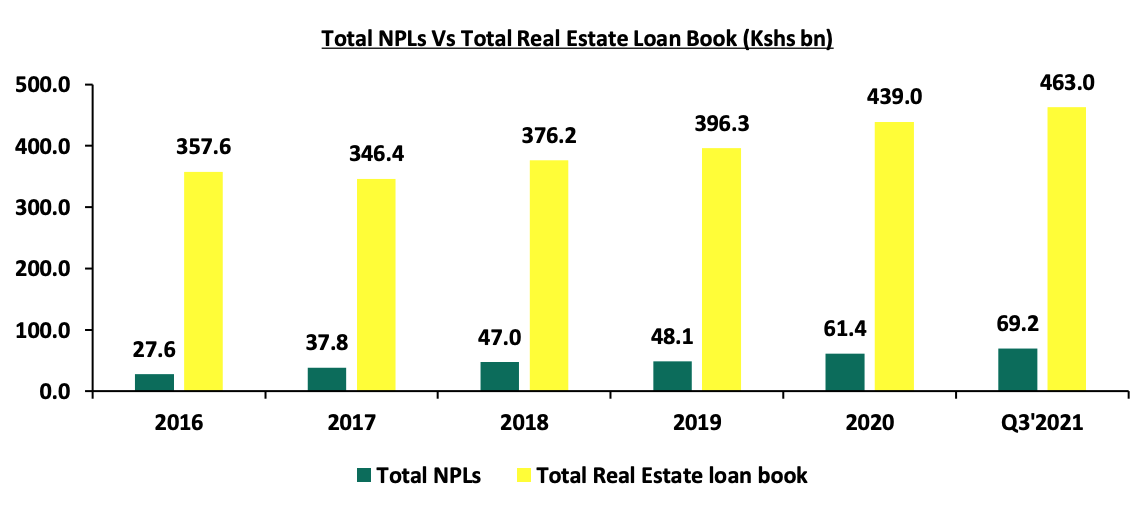
Source: Central Bank of Kenya
We expect the Real Estate sector’s performance to be driven by expected increase in visitor arrivals into the country hence boosting the performance of hospitality sector coupled with the increased road and railway construction activities thereby opening up various areas for investments. Despite this, we expect lending to the Real Estate sector to continue being muted in the medium term, given the high NPLs, which have been growing at a 5-yearCAGR of 26.5% to Kshs 69.2 bn in Q3’2021, from Kshs 21.4 bn in Q3’2016.
- Residential Sector
- Kenya Mortgage Refinance Company (KMRC), additional drawdown of Kshs 2.8 bn
During the week, the Kenya Mortgage Refinance Company (KMRC), a treasury backed lender, announced that it had made an additional drawdown worth Kshs 2.8 bn on a national treasury loan facility, for onward lending to Primary Mortgage Lender (PMLs) such as Banks and SACCO’s. The firm has been having a credit line of about Kshs 37.3 bn since 2020, with the World Bank extending approximately Kshs 25.0 bn to KMRC in the form of a concessional loan through the National Treasury, an injection of Kshs 10.0 bn from the African Development Bank (AfDB), and, Kshs 2.3 bn in equity capital. KMRC is seeking to make funds available to Primary Mortgage Lenders (PMLs) at interest rates of 5.0% for onward lending to potential home buyers at single digit rates.
Given the KMRC average loan limit of Kshs 3.5 mn for areas in and out of the Nairobi Metropolitan Area, we expect that the fund will service approximately 800 mortgages which is still low given the current housing deficit of 2.0 mn units, which has been growing at an annual rate of 200,000 units according to The Centre for Affordable Housing Africa. Despite this, we expect that the initiative by KMRC to make funds available to home buyers to boost the home ownership rates in Kenya which has remained low at 21.3% in urban areas as at 2020, compared to other African countries such as Ghana with a 47.2% urban home ownership rate in the same period according to the Center for Affordable Housing Finance. The low home ownership rate is attributed to;
- High property prices,
- Lack of Real Estate finance to fund large scale developments due to an under developed and non-supportive capital markets,
- The increasing number of Non-Performing Loans (NPLS) in the Real Estate sector, which realized a 1.4% increase to Kshs 69.2 bn in Q3’2021, from Kshs 68.2 bn recorded in H1’2021 according to the Central Bank of Kenya, leading to tighter underwriting standards,
- Lack of credit information about the self-employed citizens leading to their exclusions,
- The tough economic times reducing savings and disposable income, and,
- High initial deposits required to access mortgages.
The graph below shows the home ownership percentages of different countries compared to Kenya;
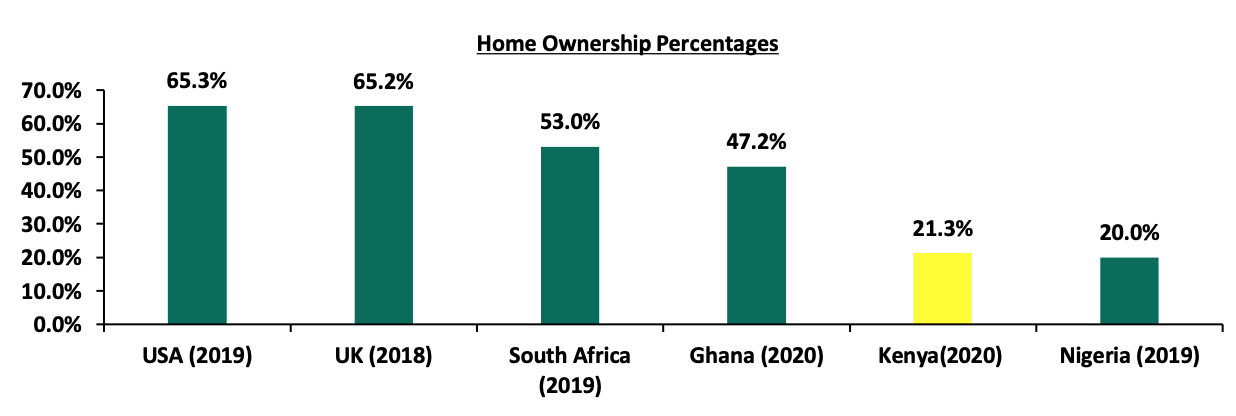
Source: Centre for Affordable Housing Africa, Federal Reserve Bank
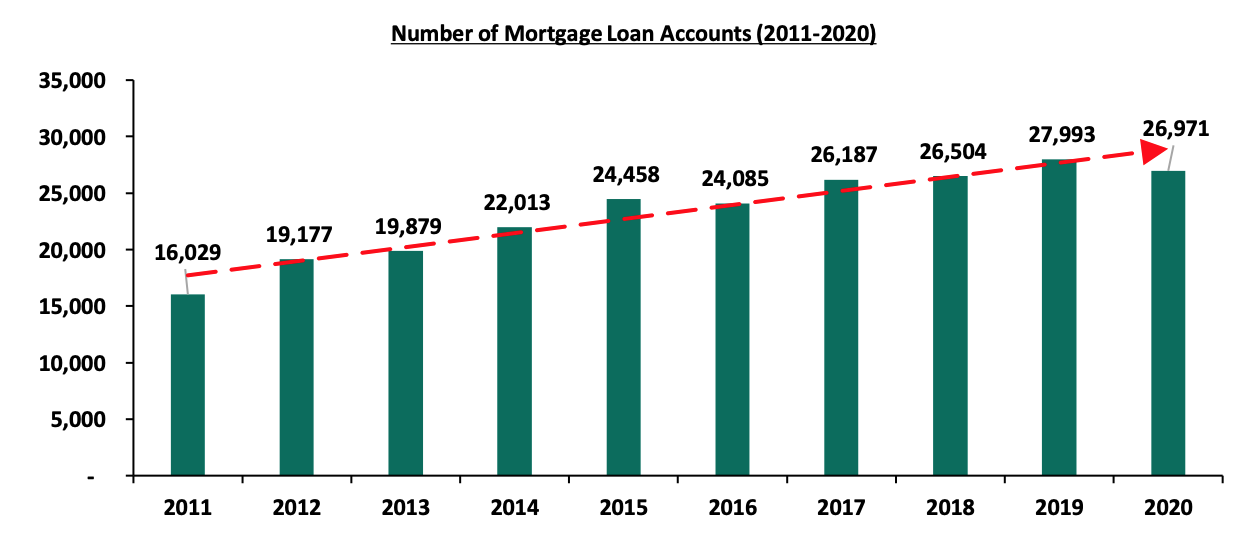
This funding is expected to increase the number of mortgage accounts in Kenya, which recorded a 3.7% decline to 26,971 in December 2020, from 27,993 in December 2019 according to the Central Bank of Kenya- Bank Supervision Annual Report 2020.
The graph below shows the number of mortgage loan accounts in Kenya over the last 10 years;
Source: Central Bank of Kenya (CBK)
With an average mortgage loan of Kshs 8.6 mn according to the Central Bank of Kenya- Bank Supervision Annual Report 2020, a lending rate of 12.2% as of October 2020 according to the CBK, and a maximum tenure of 20 years, one is required to make monthly payments of approximately Kshs 87,400 per month. This is unaffordable assuming a gross salary of Kshs 50,000 or below per month according to the Kenya National Bureau of Statistics which is the median household income in Kenya for the employed population. Given the above, the Kenya mortgage to GDP ratio has continued to lag behind at 2.2% as of 2020, compared to countries such as Namibia and South Africa at 18.9% and 16.2%, respectively as shown in the graph below;
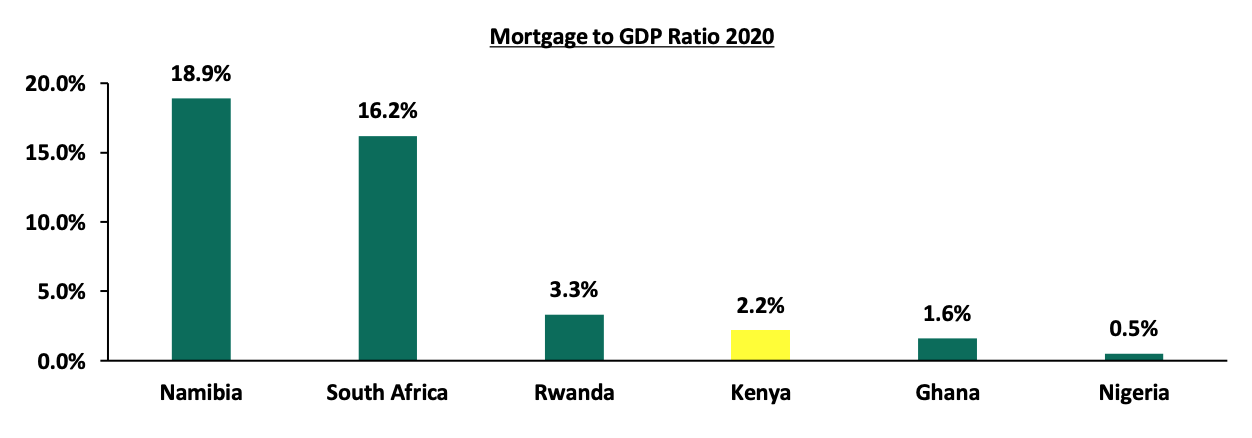
Source: Centre for Affordable Housing Africa
Since inception, KMRC has continued to maintain a good performance track record through: i) boosting liquidity to Primary Mortgage Lenders through its debut lending of Kshs 2.8 bn in FY’2020/21 and Kshs 7.0 bn budgeted in FY’2021/22, ii) increasing mortgage uptake in the country by so far refinancing 1,427 mortgages as at 2020 with others under review currently, iii) encouraging mortgage market competition for the benefit of borrowers through low rate lending, and, iv) increasing capital for refinancing with total Kshs 40.0 bn under management by the firm as at June 2021.
In our view, the efforts by KMRC to avail mortgages to clients at favourable rates is expected to improve mortgage uptake in Kenya thereby driving the home ownership rates. However, there is lack of clarity on the funding model of the company in order to maintain their lending rate of 5.0% given that even the government itself accesses 20-year Treasury bonds at an interest rate of 13.8%.
- Likoni Housing Project
During the week, the Country Government of Mombasa announced plans to construct 3,200 housing units in Likoni. This is after 348 residents of Likoni Flats Estate agreed to move out of their dilapidated houses which were constructed in 1973 to allow for the construction of new units. The planned development will see the government provide land and Gold Line Rinco, a private developer provide capital worth Kshs 8.0 bn. Upon completion, part of the units will be given to the County Government of Mombasa while the rest will be sold by the financer (The prices and unit typologies are not yet disclosed).
The move by the Mombasa County Government comes at a time when PPPS have proven to be a strategic way of delivering projects. Some of the benefits of Public-Private Partnerships include: i) access to finance for projects, ii) ability to share project risks between the government and the private sectors, iii) access to private sector efficiencies such as new and improved technologies and skilled labour by the government, iv) enhancing ease of doing business, and, v) the delivery of large scale projects in a cost effective way that would otherwise cause constrains to tax payers if they are implemented by the government. Some key public-private partnership projects include; i) River Estate in Ngara by National Government and Edderman Property Limited, ii) Nairobi Expressway by National Government and China Roads and Bridges Corporation, and iii) Pangani Housing Project by National Government and Tecnofin Kenya Limited.
Despite the benefits of PPPs, these strategies have fallen short of achieving their developmental targets due to i) inadequate planning for PPP projects, ii) insufficient regulatory framework to handle complex PPP transactions, iii) irregularities in the procurement processes, iv) differing goals between the private entities and the government since the government’s main interest is to protect the interests of its citizens while the private sectors interest is to capitalize on returns, v) bureaucracy and lengthy approval processes, and, vi) high transaction costs involved in execution of projects.
However, with the new Public-Private Partnership Law, that was signed in November 2021, we expect PPPs in Kenya to perform better as the law seeks to streamline project processes with clear delivery timelines, expand procurement options, and, creating robust processes for privately initiated investment proposals. We expect this to promote more public-private partnership through boosting investor confidence in the projects.
We expect the residential sector to record improvements supported by efforts by KMRC to offer affordable mortgages to a diverse number of clients at bespoke terms, and, the initiation of public-private partnerships supporting the sector.
- Infrastructure
During the week, the national government announced that it has begun the documentation processes for dualling of the 40 Km Mtwapa-Kilifi Road. This will be part of the 460 Km Malindi-Tanga-Bagamoyo East African corridor development project, a transnational highway between Kenya and Tanzania. The project is estimated to cost Kshs 41.7 bn with the main source of funds coming from the African Development Bank (AfDB) which approved a Kshs 38.4 mn financing package for the project in 2020, with European Union contributing a grant of Kshs 3.3 bn. Upon completion, the project is expected to:
- Create demand for hospitality facilities (hotel and accommodation) at the boarder entry points to cater for travelers who might need Motels and other accommodation facilities along the way,
- Promote property values in areas along the roads such as Mtwapa, and, Kilifi attributed to increased demand and ease of accessibility, and,
- Support inter-country trade between Kenya and Tanzania through promoting ease of transport
The government continues to launch various infrastructural projects throughout the years with a focus of making Kenya a regional Hub for East Africa. Some of the key ongoing projects in Kenya include the Nairobi Express way and the Western bypass. These projects have been supported by the increased budget allocation to the infrastructure sector, alongside other strategies by the government to fund infrastructural projects such as i) issuing infrastructure bonds, and, ii) Project partnership strategies such as joint ventures and public-private partnerships.
In the FY’2021/22, the infrastructure sector received a total of Kshs 182.5 bn budget allocation, 0.6% increase from the Kshs 181.4 bn allocation in FY’2020/21. We expect an increase in the budget allocation for the infrastructure sector to Kshs 211.4 bn in FY’2022/23, 15.8% higher than the Kshs 182.5 bn allocation in FY’ 2021/22 according to the 2022 Draft Budget Policy Statement. The graph below shows the infrastructure budget allocation over the years alongside the proposed budget allocation for the FY’2022/23;
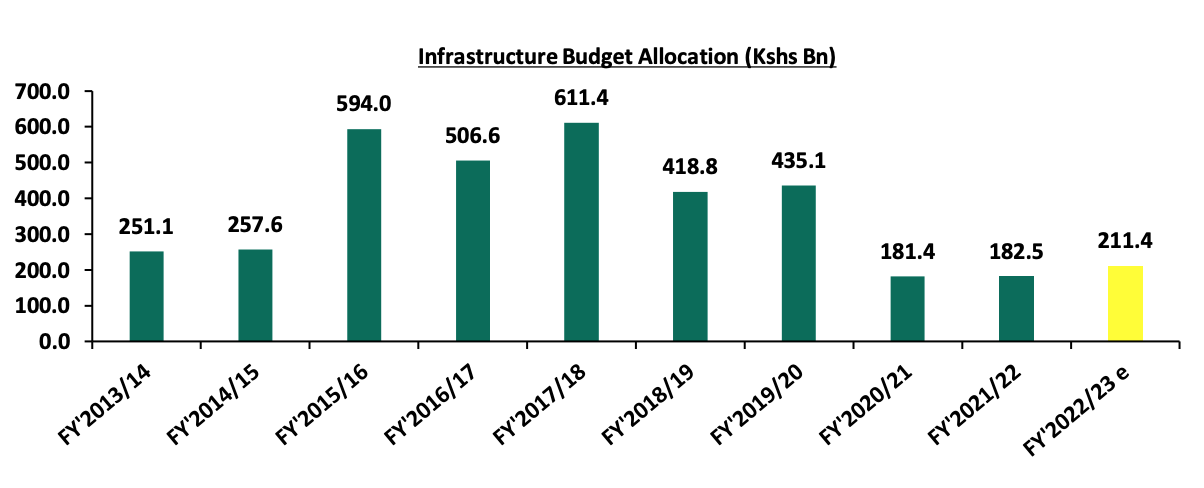
Source: National Treasury
We expect the government to continue launching, executing and completing more infrastructural projects in 2022. The completions during the year will be driven by the need to fast track the accomplishment of key projects before the next regime takes over leadership.
- Listed Real Estate
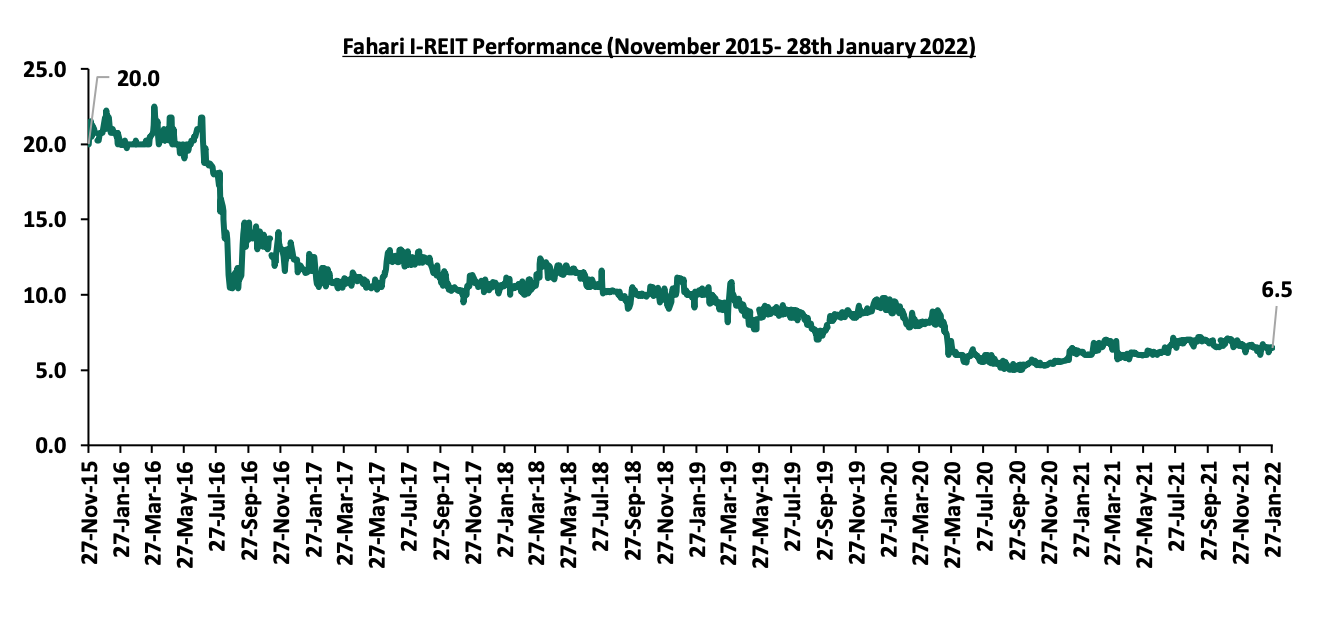
During the week, Fahari I-REIT closed the week trading at Kshs 6.5 per share an increase of 5.2% from Kshs 6.2 recorded the previous week. On a YTD basis, the share price recorded an increase of 1.3% from Kshs 6.4 recorded at the beginning of the year. However, on an inception to Date (ITD) basis, the share price declined by 67.5% from the listing price of Kshs 20.0 per share. The performance of the REITS market in Kenya continues to be subdued by factors such as inadequate investor knowledge on the instrument, lengthy approval process, high minimum capital requirements for a trustee at Kshs 100.0 mn and, high minimum investments amount.
The graph below shows the performance of the Fahari I-REIT from 27th November 2015-28th January 2022;
We expect the Real Estate sector in 2022 to record more activities supported by the overall increase in the number of tourism arrivals, public-private partnerships supporting the residential sector, the move by KMRC to provide affordable mortgages to individuals, and continued launching of infrastructural projects in Kenya. On the other hand, the performance of the Real Estate sector continues to be impended by financial constraints and low investor appetite for the Real Estate Investments Trusts.
Unit Trust Funds (UTFs) are Collective Investment Schemes that pool funds from different investors and are managed by professional fund managers. The fund managers invest the pooled funds in a portfolio of securities with the aim of generating returns to meet the specific objectives of the fund. Following the release of the Capital Markets Authority (CMA) Quarterly Statistical Bulletin – Q4’2021, we analyze the performance of Unit Trust Funds, as the total Assets Under Management (AUM) have been steadily increasing and they are among the most popular investment options in the Kenyan market. We will further analyze the performance of Money Market Funds, a product under Unit Trust Funds. In our previous focus on Unit Trust Funds, we looked at the Q2'2021 Unit Trust Funds Performance by Fund Managers. In this topical, we focus on the Q3’2021 performance of Unit Trust Funds where we shall analyze the following:
- Performance of the Unit Trust Funds Industry,
- Performance of Money Market Funds,
- Comparing Unit Trust Funds AUM Growth with other Markets, and,
- Recommendations
Section I: Performance of the Unit Trust Funds Industry
Unit Trust Funds are investment schemes that pool funds from investors and are managed by professional Fund Managers. The fund manager invests the pooled funds with the aim of generating returns in line with the specific objectives of the fund. The Unit Trust Funds earn returns in the form of dividends, interest income, rent and/or capital gains depending on the underlying security. The main types of Unit Trust Funds include:
- Money Market Funds – These are funds that invests in fixed income securities such as fixed deposits, treasury bills and bonds, commercial papers, etc. They are very liquid, have stable returns, and, they are suitable for risk averse investors,
- Equity Funds – These are funds which largely invest in listed securities and seek to offer superior returns over the medium to long-term by maximizing capital gains and dividend income. The funds invest in various sectors to reduce concentration risk and maintain some portion of the fund’s cash in liquid fixed income investments to maintain liquidity and pay investors if need be without losing value,
- Balanced Funds – These are funds whose investments are diversified across the Equities and the Fixed Income market. The Balanced Fund offers investors long-term growth as well as reasonable levels of stability of income,
- Fixed Income Funds – These are funds which invest in interest-bearing securities, which include treasury bills, treasury bonds, preference shares, corporate bonds, loan stock, approved securities, notes and liquid assets consistent with the portfolio’s investment objective, and,
- Sector Specific Funds – These are funds that invest primarily in a particular sector or industry. The funds provide a greater measure of diversification within a given sector than may be otherwise possible for the other funds. They are specifically approved by the capital Markets Authority as they are not invested as per the set rules and regulations.
As per the Capital Markets Authority (CMA) Quarterly Statistical Bulletin – Q4’2021, the industry’s overall Assets under Management (AUM) grew by 7.0% to Kshs 126.0 bn during the third quarter, from Kshs 117.8 bn as at the end of Q2’2021. Assets under Management of the Unit Trust Funds have grown at a 4-year CAGR of 22.4% to Kshs 126.0 bn in Q3’2021, from Kshs 56.0 bn recorded in Q3’2017.
Source: Capital Markets Authority Quarterly Statistical bulletins
This growth can be largely attributable to:
- Low Investments minimums for plain vanilla funds: Majority of the Unit Trust Funds Collective Investment Schemes’ (CIS) in the market require a relatively low initial investment ranging between Kshs 100.0 - Kshs 10,000.0. This has in turn made them attractive to retail and individual investors, boosting their growth,
- Increased Investor Knowledge: There has been a drive towards investor education on the various products offered by trust funds which has meant that more people are aware and have a deeper understanding of the investment subject. As a result, their confidence has been boosted resulting to increased uptake,
- Diversified product offering: Unit Trust Funds are also advantageous in terms of providing investors with access to a wider range of investment securities through pooling of funds. This allows investors the opportunity of diversifying their portfolios which would have not been accessible if they invested on their own,
- Efficiency and ease of access to cash/High Liquidity: Funds invested in UTFs are invested as portfolios with different assets and the fund managers always maintain a cash buffer. Unit trusts are highly liquid, as it is easy to sell and buy units without depending on demand and supply at the time of investment or exit, and,
- Adoption of Fintech: Digitization and automation within the industry has enhanced liquidity, enabling investors to receive their funds within 3 to 5 working days if they are withdrawing to their bank accounts, and immediate access to funds when withdrawing via M-PESA. According to the Central Bank of Kenya, more and more individuals are transacting through mobile money services as evidenced by the increase in the total number of registered mobile money accounts to 67.2 mn in September 2021, from 66.6 mn recorded in January 2021. Fintech has increased the efficiency of processing both payments and investments for fund managers and made Collective Investment Schemes more accessible to retail investors.
According to the Capital Markets Authority, as at the end of Q3’2021, there were 27 approved Collective Investment Schemes in Kenya. Out of the 27 however, only 19 were active while 8 were inactive. During the period under review, total Assets under Management grew by 7.0% to Kshs 126.0 bn in Q3’2021, from Kshs 117.8 bn as at the end of Q2’2021. The table below outlines the performance of the Collective Investment Schemes:
|
|
Assets Under Management (AUM) for the Approved Collective Investment Schemes |
|||||
|
No. |
Collective Investment Schemes |
Q2’2021 AUM (Kshs mns) |
Q2’2021 Market Share |
Q3’2021 AUM (Kshs mns) |
Q3’2021 Market Share |
AUM Growth Q2'2021-Q3'2021 |
|
1 |
CIC Unit Trust Scheme |
47,292.8 |
40.2% |
52,191.2 |
41.4% |
10.4% |
|
2 |
NCBA Unit Trust Scheme |
14,814.0 |
12.6% |
16,608.3 |
13.2% |
12.1% |
|
3 |
Britam Unit Trust Scheme |
14,429.4 |
12.3% |
14,281.2 |
11.3% |
(1.0%) |
|
4 |
ICEA Lion Unit Trust Scheme |
12,553.8 |
10.7% |
12,741.0 |
10.1% |
1.5% |
|
5 |
Sanlam Unit Trust Scheme |
7,631.1 |
6.5% |
8,116.9 |
6.4% |
6.4% |
|
6 |
Old Mutual Unit Trust Scheme |
6,292.0 |
5.3% |
6,522.6 |
5.2% |
3.7% |
|
7 |
Dry Associates Unit Trust Scheme |
2,678.6 |
2.3% |
2,811.5 |
2.2% |
5.0% |
|
8 |
Nabo Africa Funds |
2,446.1 |
2.1% |
2,378.7 |
1.9% |
(2.8%) |
|
9 |
Madison Asset Unit Trust Fund |
1,972.1 |
1.7% |
2,187.3 |
1.7% |
10.9% |
|
10 |
Co-op Unit Trust Scheme |
1,500.9 |
1.3% |
2,186.5 |
1.7% |
45.7% |
|
11 |
African Alliance Kenya Unit Trust Scheme |
1,850.3 |
1.6% |
1,892.7 |
1.5% |
2.3% |
|
12 |
Zimele Unit Trust Scheme |
1,663.3 |
1.4% |
1,663.3 |
1.3% |
0.0% |
|
13 |
Apollo Unit Trust Scheme |
634.8 |
0.5% |
695.3 |
0.6% |
9.5% |
|
14 |
Cytonn Unit Trust Scheme |
772.0 |
0.7% |
672.0 |
0.5% |
(13.0%) |
|
15 |
Genghis Unit Trust Fund |
683.8 |
0.6% |
561.6 |
0.5% |
(17.9%) |
|
16 |
Equity Investment Bank |
289.4 |
0.2% |
277.6 |
0.2% |
(4.1%) |
|
17 |
Alpha Africa Umbrella Fund |
222.0 |
0.2% |
222.0 |
0.2% |
0.0% |
|
18 |
Amana Unit Trust Fund |
45.1 |
0.0% |
37.4 |
0.0% |
(17.0%) |
|
19 |
Wanafunzi Investment Unit Trust Fund |
0.6 |
0.0% |
0.6 |
0.0% |
0.0% |
|
20 |
First Ethical Opportunities Fund |
- |
- |
- |
- |
- |
|
21 |
Genghis Specialised Fund |
- |
- |
- |
- |
- |
|
22 |
Absa Unit Trust Fund |
- |
- |
- |
- |
- |
|
23 |
Standard Investment Trust Fund |
- |
- |
- |
- |
- |
|
24 |
Diaspora Unit Trust Scheme |
- |
- |
- |
- |
- |
|
25 |
Dyer and Blair Unit Trust Scheme |
- |
- |
- |
- |
- |
|
26 |
Jaza Unit Trust Fund |
- |
- |
- |
- |
- |
|
27 |
Masaru Unit Trust Fund |
- |
- |
- |
- |
- |
|
|
Total |
117,771.8 |
100.0% |
126,047.7 |
100.0% |
7.0% |
Source: Capital Markets Authority: Quarterly Statistical Bulletin, Q4’2021
Key to note from the above table:
- Assets Under Management: CIC Unit Trust Scheme remained the largest overall Unit Trust Fund with an AUM of Kshs 52.2 bn in Q3’2021, from an AUM of Kshs 47.3 bn in Q2’2021, translating to a 10.4% AUM growth,
- Market Share: CIC Unit Trust Scheme remained the largest overall Unit Trust with a market share of 41.4%, an increase of 1.2% points from 40.2% in Q2’2021. Key to note, the 1.2% points increase in market share was the highest recorded in Q3’3021,
- Growth: In terms of AUM growth, Co-op Unit Trust Scheme recorded the strongest growth of 45.7%, with its AUM increasing to Kshs 2.2 bn, from Kshs 1.5 bn in Q2’2021 while Genghis Unit Trust Fund recorded the largest decline, with its AUM declining by 17.9% to Kshs 561.6 mn in Q3’2021, from Kshs 683.8 mn in Q2’2021.
- First Ethical Opportunities Fund, Diaspora Unit Trust Scheme, Genghis Specialised Fund, Standard Investment Trust Fund, Dyer and Blair Unit Trust Scheme, Absa Unit Trust Fund, Jaza Unit Trust Fund and Masaru Unit Trust Fund remained inactive as at the end of Q3’2021.
Section II: Performance of Money Market Funds
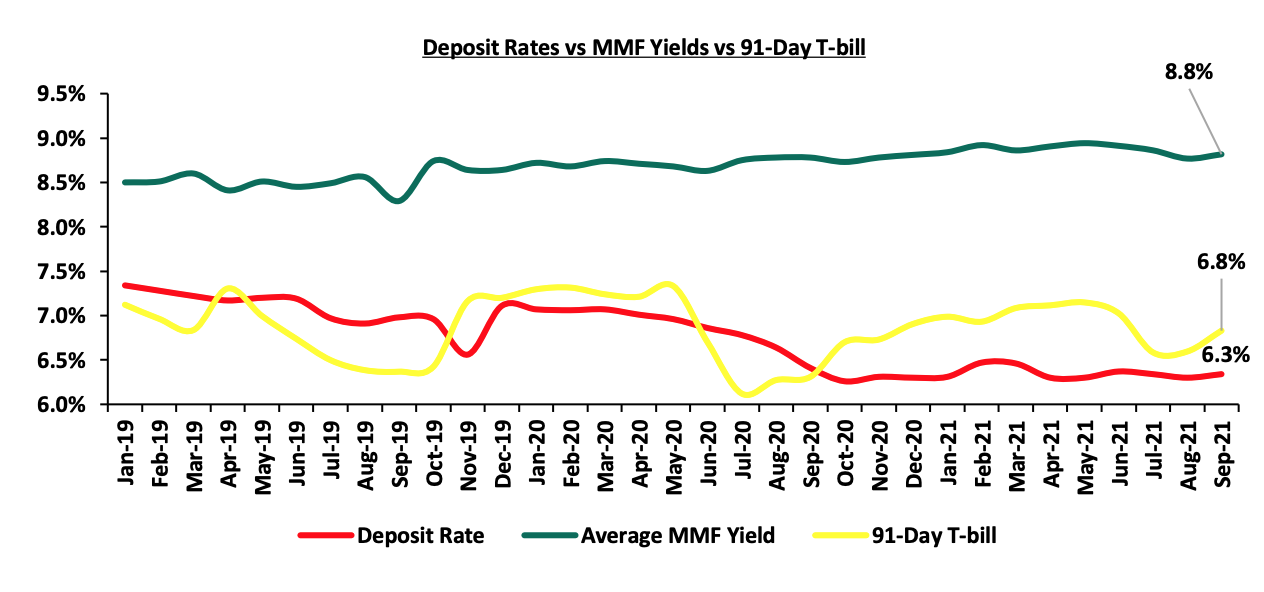
Money Market Funds (MMFs) in the recent past have gained popularity in Kenya driven by the higher returns money market funds offer compared to the returns on bank deposits and treasury bills. According to the Central Bank of Kenya data, the average deposit rate remained unchanged at 6.3% in Q3’2021, as was recorded in Q2’2021. During the period under review, the 91-Day T-bill and the average deposit rate continued to offer lower yields at 6.3% and 6.7%, respectively, compared to the average MMF yields of 8.8%.
Source: Central Bank of Kenya, Cytonn Research
As per the regulations, funds in MMFs should be invested in liquid interest-bearing securities. These securities include bank deposits, securities listed on the Nairobi Securities Exchange (NSE) and securities issued by the Government of Kenya. The fund is best suited for investors who require a low-risk investment that offers capital stability, liquidity, and require a high-income yield. The fund is also a good safe haven for investors who wish to switch from a higher risk portfolio to a low risk portfolio, especially in times of uncertainty.
Top Five Money Market Funds by Yields
During the period under review, the following Money Market Funds had the highest average effective annual yield declared, with the Cytonn Money Market Fund having the highest effective annual yield at 10.6% against the industry average of 8.8%.
|
Top 5 Money Market Fund Yield in Q3'2021 |
||
|
Rank |
Money Market Fund |
Effective Annual Rate (Average Q3'2021) |
|
1 |
Cytonn Money Market Fund |
10.6% |
|
2 |
Nabo Africa Money Market Fund |
10.0% |
|
3 |
Zimele Money Market Fund |
9.9% |
|
4 |
Madison Money Market Fund |
9.3% |
|
5 |
CIC Money Market Fund |
9.3% |
|
|
Industry average |
8.8% |
Source: Cytonn Research
Section III: Comparing Unit Trust Funds AUM Growth with other Markets
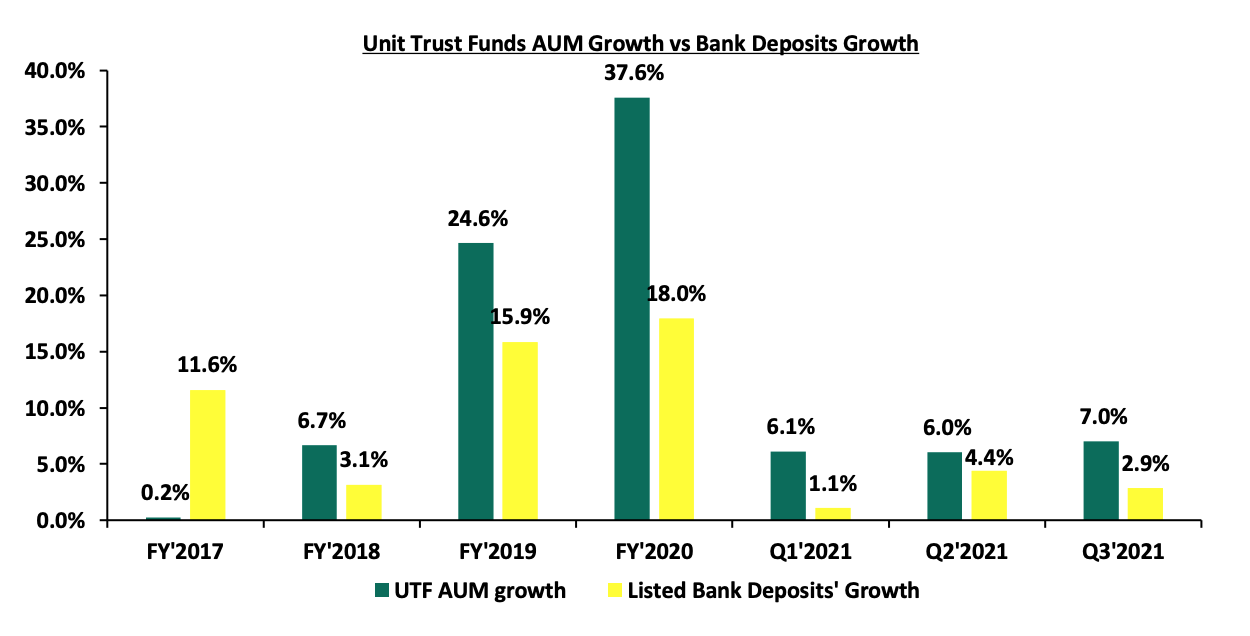
Unit Trust Funds assets recorded a q/q growth of 7.0% in Q3’2021, while the listed bank deposits recorded a growth of 2.9% over the same period. For the Unit Trust Funds, this was higher than the values recorded in Q2’2021 of 6.0%, while for bank deposits, it was a decline from 4.4% recorded in Q2’2021. The chart below highlights the Unit Trust Funds AUM growth vs bank deposits growth in Q3’2021;
Source: Cytonn Research
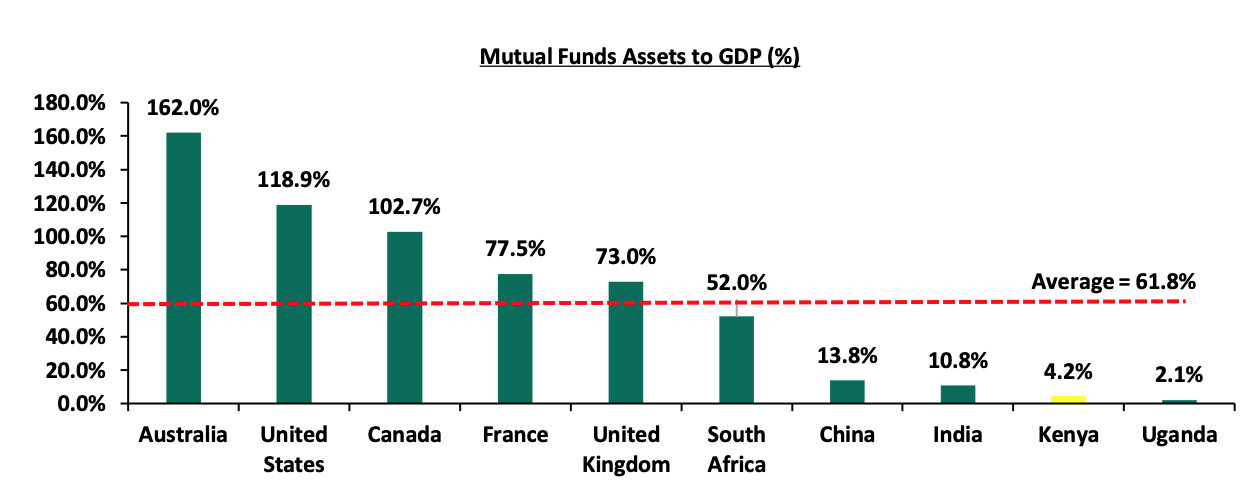
UTF’s q/q growth at 7.0% outpaced the listed banks deposits growth of 2.9%, and has historically been higher since FY’2018, an indication of relative growth in our capital markets. However our capital markets remain constrained and according to World Bank data, in well-functioning economies, businesses rely on bank funding for a mere 40.0%, with the larger percentage of 60.0% coming from the Capital markets. Closer home, CMA notes that in 2020, businesses in Kenya relied on banks for 95.0% of their funding while less than 5.0% came from the capital markets. Notably, our Mutual Funds/UTFs to GDP ratio at 4.2% is still very low compared to global average of 61.8%, indicating that we still have room to improve and enhance our capital markets. The table below shows some countries’ mutual funds as a percentage of GDP:
Source: World Bank Data
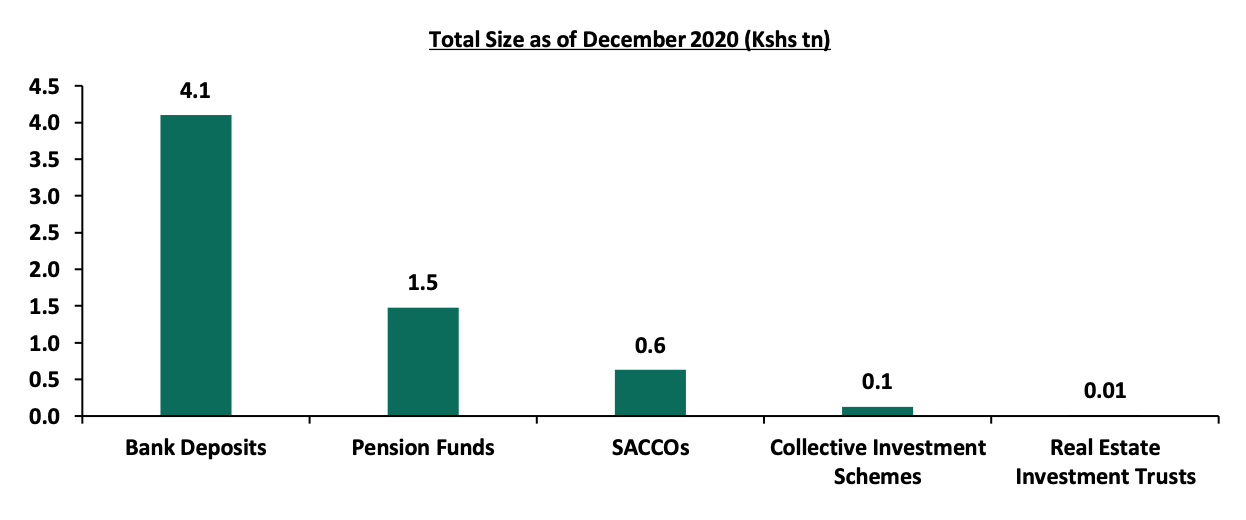
Over the past 4 years, the UTFs AUM has grown at a CAGR of 22.4% to Kshs 126.0 bn in Q3’2021, from Kshs 56.0 bn recorded in Q3’2017. However, even at Kshs 126.0 bn, the industry is dwarfed by asset gatherers such as bank deposits at Kshs 4.1 tn and the pension industry at Kshs 1.5 tn as of the end of 2020. Below is a graph showing the sizes of different saving channels and capital market products in Kenya as at December 2020:
Source: Online research
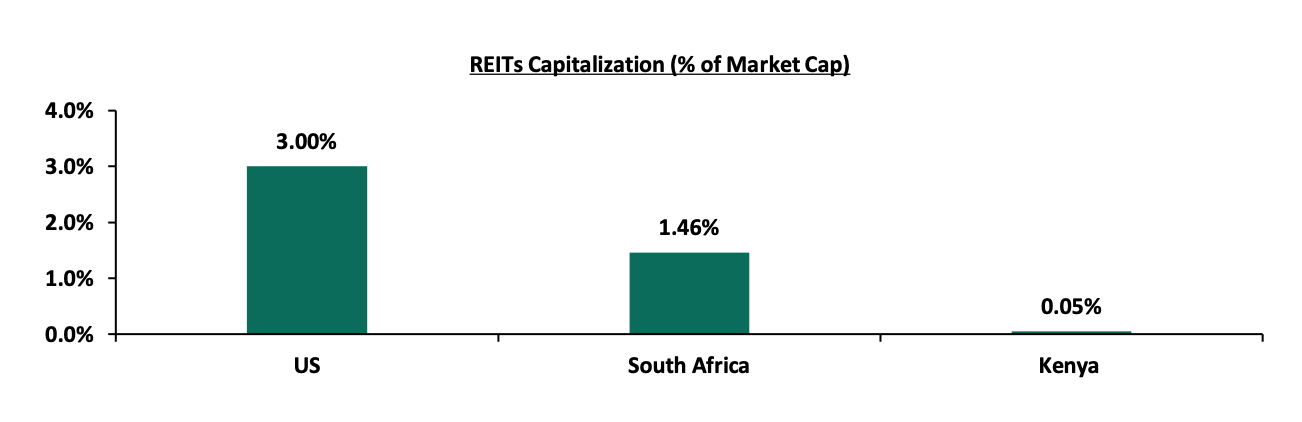
On a REITs to Market Cap Ratio, Kenya also still has a lot of room for improvement. The listed REITs capitalization as a percentage of total market cap in Kenya stands at a paltry 0.05%, as compared to 3.00% in the US and 1.46% in South Africa, as at 27th January 2022. Below is a graph showing comparison of Kenya’s REITs to Market Cap Ratio to that of United States (US) and South Africa:
Source: Online research, Nairobi Securities Exchange (NSE)
Section IV: Recommendations
In order to improve our Capital Markets and stimulate its growth, we recommend the following actions:
- Reduce the minimum investments to reasonable amounts: Currently, the minimum investment for sector specific funds is Kshs 1.0 mn, while that for Development REITS is currently at Kshs 5.0 mn. The high minimum initial and top up investments amounts are unreasonably high. According to the Kenya National Bureau of Statistics, 74.4% of all employees in the formal sector earn a median gross income of Kshs 50,000 or below per month. It therefore locks out a lot of potential investors. Additionally, these high amounts discriminate against most retail investors, giving them fewer investment choices. This is the key reason why the listed REITS to Market cap ratio for Kenya remains at 0.05% compared to South Africa at 1.5% and US at 3.0%,
- Allow for sector funds: Under the current capital markets regulations, UTFs are required to diversify. Consequently, one has to seek special dispensation in the form of sector funds such as a financial services fund, a technology fund or a Real Estate UTF fund. Regulations allowing unit holders to invest in sector funds would go a long way in expanding the scope of unit holders interested in investing,
- Eliminate conflicts of interest in the governance of capital markets: The capital markets regulations should foster a governance structure that is more responsive to both market participants and market growth. Specifically, restricting Trustees of Unit Trust Schemes to Banks only limits choices, especially given that banking markets and capital markets are in competition,
- Provide Support to Fund Managers: We are of the opinion that the regulator, CMA, needs to integrate market stabilization tools as part of the regulations/Act that will help Fund Managers meet fund obligations especially during times of distress such as mass withdrawals. We do commend and appreciate the regulator on its role on protecting investor interests. However, since Fund Managers also play a key role in the capital markets, the regulator should also be able to protect the brand image of various fund managers in the industry. This can be achieved by working together with industry players to resolve matters rather than alienating and publicly ostracizing industry players facing challenges as this may not particularly be in investors’ interest,
- Create increased competition in the market by encouraging different players to set up shop and offer different services such as the opening up of Trustees to non-financial institutions: Increased competition in capital markets will not only push Unit Trust Fund managers to provide higher returns for investors but will also eliminate conflicts of interest in markets and enhance the provision of innovative products and services, and,
- Improve fund transparency to provide investors with more information: Each Unit Trust Fund should be required to publish their portfolio holdings on a quarterly basis and make the information available to the public so as to enhance transparency for investors. Enhanced accountability by providing investors with more information will help both investors and prospects make better informed decisions and subsequently improve investor confidence.
In August 2021, we saw the Capital Markets Authority (CMA) publish two draft regulations; the Capital Markets (Collective Investment Schemes) Regulations 2021 and the Capital Markets (Collective Investment Schemes) (Alternative Investment Funds) Regulations 2021. The proposed regulations seek to update the current Collective Investment Scheme Regulations given the change in market dynamics since the last published Regulations in 2001, as well as address emerging issues. The move by CMA to review the current regulations is welcomed as it seems intended to improve the Capital Markets in Kenya by providing more versatile regulations and provide for existence of regulated funds that invest in alternative asset classes. However, it’s our view that proceeding with the regulations as proposed would not be ideal for the market. In our Draft CMA Investments Regulations topical, we analyzed these regulations and thereafter gave our recommendations on the areas of improvement. We continue to monitor developments from the CMA with regard to the draft regulations.
Disclaimer: The views expressed in this publication are those of the writers where particulars are not warranted. This publication, which is in compliance with Section 2 of the Capital Markets Authority Act Cap 485A, is meant for general information only and is not a warranty, representation, advice or solicitation of any nature. Readers are advised in all circumstances to seek the advice of a registered investment advisor.

- Talk to us
- Kenya
- P.O Box 20695 - 00200, Nairobi, Kenya
- Cell +254709101200
- Tel +254709101200
- WhatsApp +254741676635
- United States
- +254709101200
- DOWNLOAD OUR APP
-


- Kenya
- 8th Floor, Pinetree Plaza, Kaburu Drive, Ngong Road, Nairobi, Kenya
- USA
- Suite 1150, 1775 Eye Street NW, USA, Washington DC 20006, USA
- Investments
- High Yield
- Private Equity
- Real Estate
- Real Estate
- RiverRun Estates
- Cytonn Towers
- The Ridge
- Taraji Heights
- The Alma