Unlocking Kenya’s Capital Markets, & Cytonn Weekly #19/2026
By Research Team, May 17, 2026
Executive Summary
Fixed Income
During the week, T-bills were oversubscribed for the second consecutive week, with the overall subscription rate coming in at 110.0%, lower than the subscription rate of 122.6%, recorded the previous week. Investors’ preference for the shorter 91-day paper persisted, with the paper receiving bids worth 7.3 bn against the offered Kshs 4.0 bn, translating to a subscription rate of 183.1%, lower than the subscription rate of 243.5%, recorded the previous week. The subscription rate for the 182-day paper decreased significantly to 78.5% from 145.2% recorded the previous week, while that of the 364-day paper increased significantly to 112.4% from 51.6% recorded the previous week. The government accepted a total of Kshs 26.38 bn worth of bids out of Kshs 26.41 bn bids received, translating to an acceptance rate of 99.9%. The yields on the government papers were on an upward trajectory, with the yields on the 91-day, 364-day and 182-day papers increasing by 12.8 bps, 4.9 bps and 0.2 bps to 8.3%, 8.6%, and 8.2%, respectively, from the 8.2%, 8.5% and 8.2% recorded the previous week;
In the primary bond market, the government re-opened two bonds FXD3/2019/015, and FXD1/2021/020 seeking to raise Kshs 50.0 bn for budgetary support. The bonds, FXD3/2019/015, and FXD1/2021/020, have fixed coupon rates of 12.3% and 13.4% respectively and tenors to maturity of 8.3 years, and 15.3 years respectively. The period of sale for the FXD3/2019/015 opened on Wednesday 13th May 2026 and will close on Wednesday 20th May 2026 while that of FXD1/2021/020 opens on Monday 18th May 2026 and will close on Wednesday 20th May 2026. Our bidding ranges for the FXD3/2019/015, and FXD1/2021/020 is 12.5% - 13.0% and 13.5% - 14.0% respectively;
The National Treasury gazetted the revenue and net expenditures for the tenth month of FY’2025/2026, ending 30th April 2026, highlighting that the total revenue collected as at the end of April 2026 amounted to Kshs 2,104.3 bn, equivalent to 75.6% of the revised estimates of Kshs 2,784.4 bn for FY’2025/2026 and is 90.7% of the prorated estimates of Kshs 2,320.3 bn. Below is a summary of the performance;
During the week, The Energy and Petroleum Regulatory Authority (EPRA) released their monthly statement on the maximum retail fuel prices in Kenya, effective from 15th May 2026 to 14th June 2026. Notably, the maximum allowed prices for Super Petrol, and Diesel increased by Kshs 16.7, and Kshs 46.3 per litre to Kshs 214.3, and Kshs 242.9 per litre from Kshs 197.6 and Kshs 196.6 per litre respectively in April 2026, marking the second increase in 2026. On the other hand, Kerosene remain unchanged at Kshs 152.8 per litre;
On 13th May 2026, the National Treasury presented its Budget Estimates for the next fiscal year, FY’2026/27. Notably, the budget estimates recorded a 1.5% increase to Kshs 4.8 tn from the previous estimates of Kshs 4.7 tn in the Budget Policy Statement for FY’2026/27 and a 3.2% increase from the Kshs 4.6 tn in FY’2025/26 as per the Supplementary Budget ;
The Cabinet Secretary for the National Treasury and Economic Planning presented the Finance Bill 2026 to the National Assembly for approval;
Equities
During the week, the equities market was on a downward trajectory, with NASI, NSE 25, NSE 20, and NSE 10 declining by 1.9%, 0.3%, 0.2% and 0.1% respectively, taking the YTD performance to gains of 12.2%, 11.0%, 9.7% and 8.6% for NSE 20, NSE 25, NASI and NSE 10 respectively. The week-on-week equities market performance was mainly driven by losses recorded by large cap stocks such as BAT, Safaricom and EABL of 9.8%, 6.7% and 0.8% respectively. However, the performance was supported by gains recorded by large cap stocks such as Co-operative, Standard Chartered and ABSA of 10.5%, 2.9% and 2.3% respectively;
During the week, the banking sector index increased by 2.1% to 236.9 from 232.0 recorded the previous week. This is attributable to gains recorded by large cap stocks such as Co-operative, Standard Chartered and Absa of 10.5%, 2.9% and 2.3% respectively;
During the week, Co-operative Bank Kenya released its Q1’2026 financial results, Profit After Tax (PAT) increased by 21.3% to Kshs 8.4 bn, from Kshs 6.9 bn in Q1’2025, mainly driven by 13.6% increase in total operating income to Kshs 24.1 bn, from Kshs 21.2 bn in Q1’2025, the performance was however weighed down by an 8.4% increase in operating expenses to Kshs 12.7 bn, from Kshs 11.7 bn in Q1’2025. The increase in Operating expenses was largely driven by the 11.3% increase in staff costs to Kshs 5.5 bn, from Kshs 4.9 bn in Q1’2025;
During the week, DTB-K Bank released its Q1’2026 financial results, Profit After Tax (PAT) increased by 7.7% to Kshs 3.5 bn, from Kshs 3.2 bn in Q1’2025, mainly driven by 21.2% increase in total operating income to Kshs 12.9 bn, from Kshs 10.7 bn in Q1’2025, however it was weighed down by the 22.9% increase in operating expenses to Kshs 8.1 bn, from Kshs 6.6 bn in Q1’2025. The increase in Operating expenses was largely driven by the to 151.8% increase in loan loss provisions to Kshs 2.2 bn, from Kshs 0.9 bn in Q1’2025;
Real Estate
: During the week, Kenya Mortgage Refinance Company Plc successfully concluded the second tranche of its Kshs 10.5 bn Medium Term Note Programme, with a tenor to maturity of 8 years and a weighted average life of 5.1 years. The bond was oversubscribed, with an overall subscription rate coming in at 312.8% receiving bids worth Kshs 9.4 bn. The note was offered at par at an issue price of 100.0%, carries a fixed coupon rate of 12.2% per annum payable semi-annually. The settlement date is 21st May 2026 and the MTN will be listed on NSE on 25th May 2026. The strong response reflects robust investor confidence in KMRC’s credit profile and its role in sustainably promoting home ownership in Kenya;
During the week, Apartment prices in Eastlands and Nairobi’s satellite towns recorded a decline over the past three years, reflecting a widening imbalance between supply and demand as buyer preferences gradually shift. According to the Kenya National Bureau of Statistics, average apartment prices in the lower income segment fell to Kshs 8.5 mn from Kshs 9.0 mn in 2022. In contrast, standalone houses targeting the same income bracket recorded a 23 percent price increase over the period, indicating a clear shift in demand toward more spacious housing units;
During the week, the Government of Kenya announced the expansion of Jomo Kenyatta International Airport through the National Infrastructure Fund. The government confirmed that Kshs 38.7 bn from the Kenya Pipeline Company stake sale will be directed toward the project, forming part of a broader plan to mobilize funding for the estimated Kshs 193.7 bn airport upgrades. The fund is also expected to grow its seed capital base to Kshs 387.4 bn following proceeds from the Kenya Pipeline IPO and partial divestiture of Safaricom Plc, with the state contributing 20.0% of total project costs;
During the week, Two Rivers Land Company SEZ Two Rivers Land Company launched the TRIFIC Green USD Income REIT, marking a notable development in Kenya’s capital markets through the introduction of a USD denominated, environmentally focused income REIT backed by institutional grade commercial real estate within the Two Rivers International Finance and Innovation Centre ecosystem;
On the Unquoted Securities Platform Acorn D-REIT and I-REIT traded at Kshs 29.6 and Kshs 23.8 per unit, respectively, as per the last updated data on 8th May 2026. The performance represented a 48.0% and 18.8% gain for the D-REIT and I-REIT, respectively, from the Kshs 20.0 inception price. The volumes traded for the D-REIT and I-REIT came in at 13.5 mn and 43.3 mn shares, respectively. Additionally, ILAM Fahari I-REIT traded at Kshs 13.8 per share as of 8th May 2026, representing a 31.0% loss from the Kshs 20.0 inception price;
Stablecoins: During the week, Circle Internet Group, the issuer of USDC released its Q1’2026 financial results which highlighted a 28.0% YoY increase in USDC circulation to USD 77.0 bn from the USD 55.4 bn recorded in Q1’2025. USDC on-chain transaction volume also increased by 263.0% to USD 21.5 tn from the USD 35.0 bn recorded in Q1 2026;
During the week, the U.S. Senate Banking Committee released the full text of the Digital Markets Clarity Act. The bill was tabled for debate in the senate on 14th May 2026 with the key highlight of the bill being the prohibition of yield and interest payments for holding stablecoins;
Mastercard and Yellow Card announced a partnership to advance stablecoin-based payment innovation across Eastern Europe, the Middle East, and Africa (EEMEA), targeting use cases such as cross-border remittances, B2B payments, treasury operations, and digital value transfers;
Stablecoins
During the week, Circle Internet Group, the issuer of USDC released its Q1’2026 financial results which highlighted a 28.0% YoY increase in USDC circulation to USD 77.0 bn from the USD 55.4 bn recorded in Q1’2025. USDC on-chain transaction volume also increased by 263.0% to USD 21.5 tn from the USD 35.0 bn recorded in Q1 2026;
During the week, the U.S. Senate Banking Committee released the full text of the Digital Markets Clarity Act. The bill was tabled for debate in the senate on 14th May 2026 with the key highlight of the bill being the prohibition of yield and interest payments for holding stablecoins;
Mastercard and Yellow Card announced a partnership to advance stablecoin-based payment innovation across Eastern Europe, the Middle East, and Africa (EEMEA), targeting use cases such as cross-border remittances, B2B payments, treasury operations, and digital value transfers;
Focus of the Week
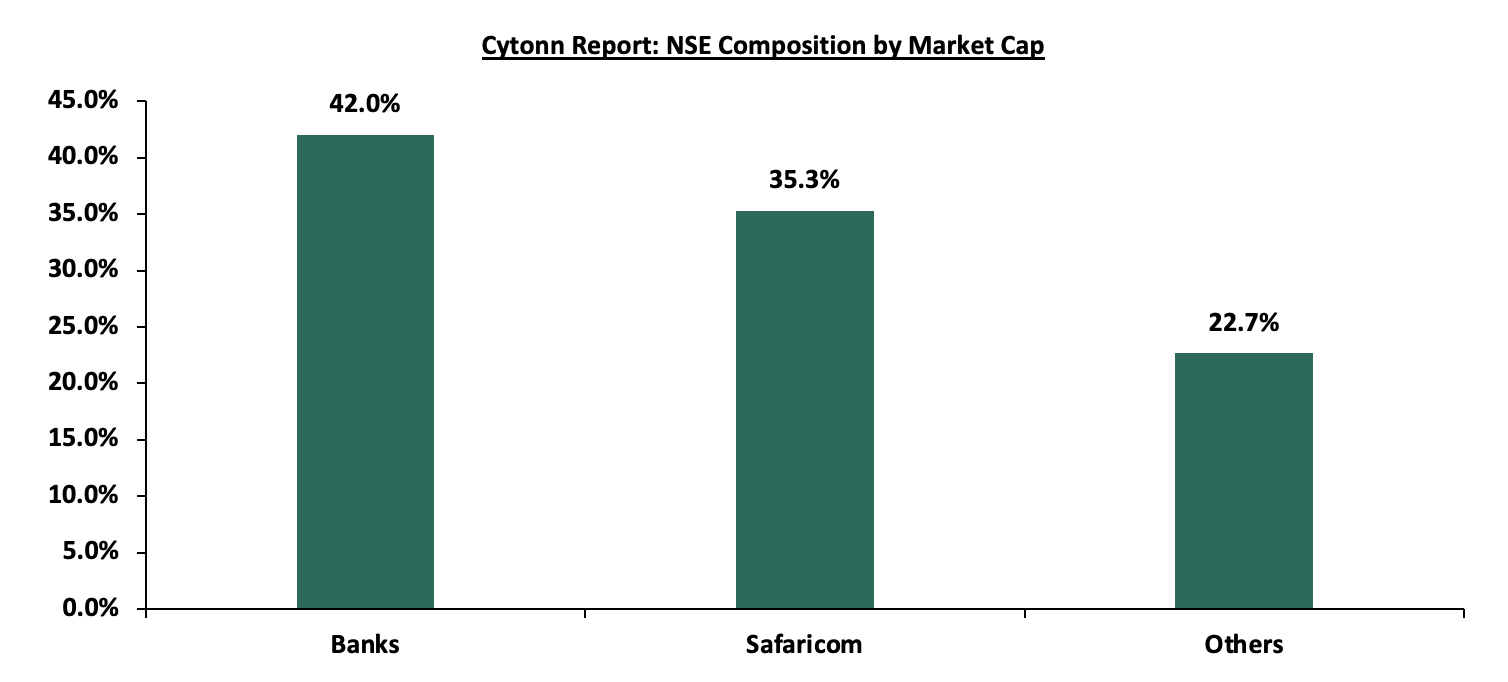
Given the significant role that the capital markets play, we shall then focus on Unlocking Kenya’s Capital Markets as an advancement to our previous report. The most recent Nairobi Securities Exchange (NSE) Initial Public Offer (IPO) was in January 2026, when the Kenya Pipeline Company issued an IPO managing to raise Kshs 112.4 bn against the target of Kshs 106.3 bn, 105.7% success rate. This marked the end of an 11-year IPO drought at the bourse. Currently, the bourse has 69 listed securities with a total market capitalization of Kshs 3.4 tn as at 15th May 2026. The bourse continues to be Safaricom-dominated, with Safaricom’s market capitalization of Kshs 1.2 tn equivalent to 35.3% of the entire market capitalization;
Investment Updates:
- Weekly Rates: Cytonn Money Market Fund closed the week at a yield of 12.1% p.a. To invest, dial *809# or download the Cytonn App from Google Play store here or from the Appstore here;
- We continue to offer Wealth Management Training every Tuesday, from 7:00 pm to 8:00 pm. The training aims to grow financial literacy among the general public. To register for any of our Wealth Management Trainings, click here;
- If interested in our Private Wealth Management Training for your employees or investment group, please get in touch with us through wmt@cytonn.com;
- Cytonn Asset Managers Limited (CAML) continues to offer pension products to meet the needs of both individual clients who want to save for their retirement during their working years and Institutional clients that want to contribute on behalf of their employees to help them build their retirement pot. For more about our pension schemes, kindly get in touch with us through pensions@cytonn.com;
Hospitality Updates:
- We currently have promotions for Staycations. Visit cysuites.com/offers for details or email us at sales@cysuites.com;
Money Markets, T-Bills Primary Auction:
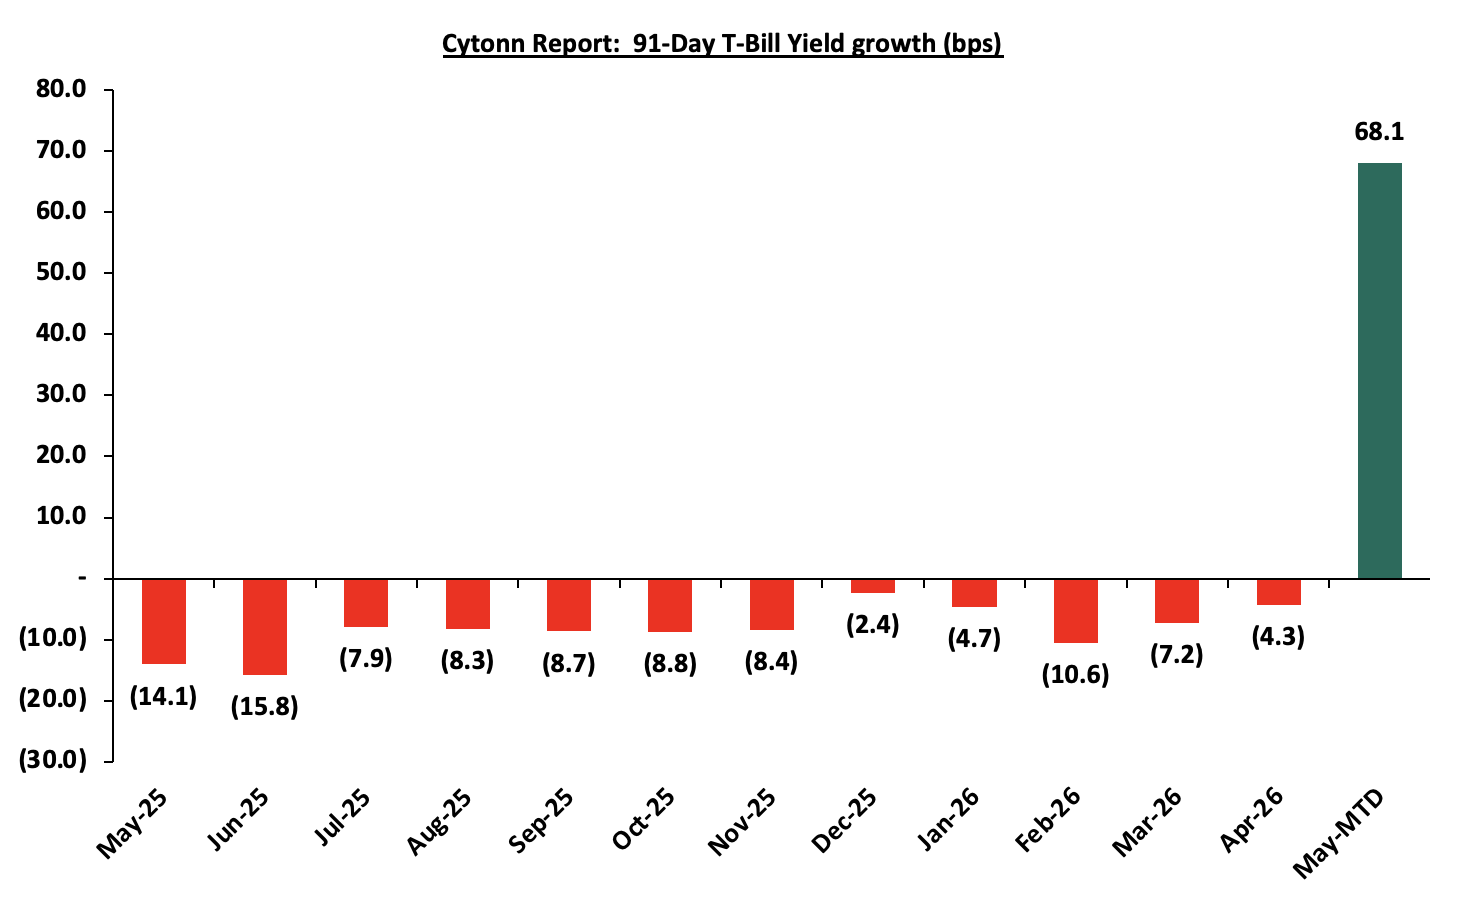
This week, T-bills were oversubscribed for the second consecutive week, with the overall subscription rate coming in at 110.0%, lower than the subscription rate of 122.6%, recorded the previous week. Investors’ preference for the shorter 91-day paper persisted, with the paper receiving bids worth 7.3 bn against the offered Kshs 4.0 bn, translating to a subscription rate of 183.1%, lower than the subscription rate of 243.5%, recorded the previous week. The subscription rate for the 182-day paper decreased significantly to 78.5% from 145.2% recorded the previous week, while that of the 364-day paper increased significantly to 112.4% from 51.6% recorded the previous week. The government accepted a total of Kshs 26.38 bn worth of bids out of Kshs 26.41 bn bids received, translating to an acceptance rate of 99.9%. The yields on the government papers were on an upward trajectory, with the yields on the 91-day, 364-day and 182-day papers increasing by 12.8 bps, 4.9 bps and 0.2 bps to 8.3%, 8.6% and 8.2%, respectively, from the 8.2%, 8.5% and 8.2% recorded the previous week. The chart below shows the yield growth rate for the 91-day paper from May 2025 to date:
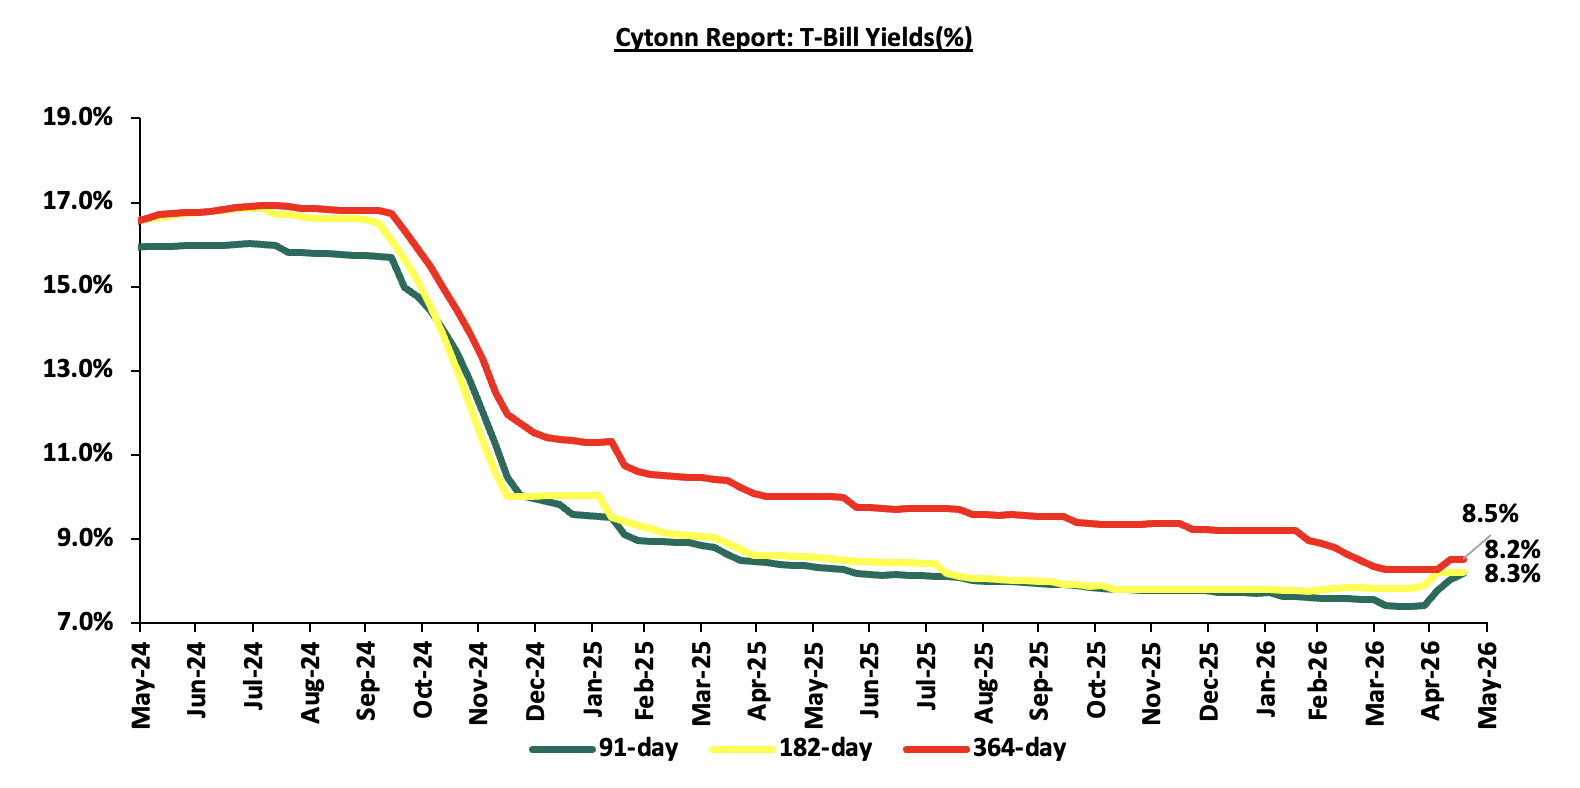
The chart below shows the performance of the 91-day, 182-day and 364-day papers from May 2024 to May 2026:
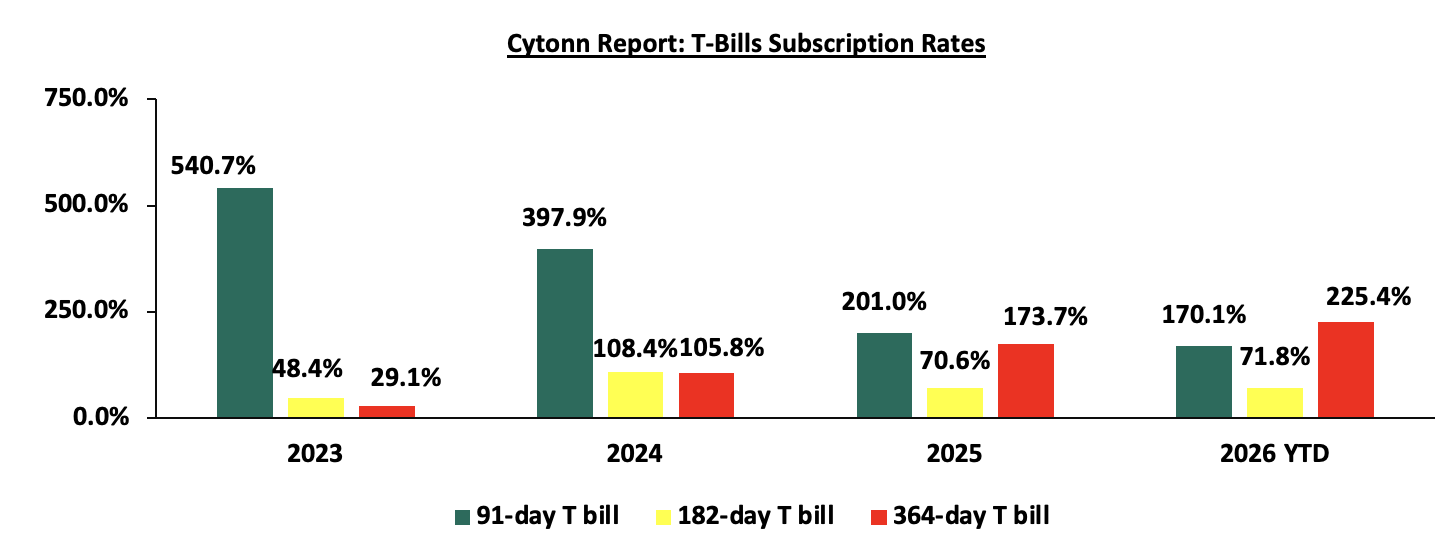
The chart below compares the overall average T-bill subscription rates obtained in 2023, 2024, 2025 and 2026 Year-to-date (YTD):
In the primary bond market, the government re-opened two bonds FXD3/2019/015, and FXD1/2021/020 seeking to raise Kshs 50.0 bn for budgetary support. The bonds, FXD3/2019/015, and FXD1/2021/020, have fixed coupon rates of 12.3% and 13.4% respectively and tenors to maturity of 8.3 years, and 15.3 years rs respectively. The period of sale for the FXD3/2019/015opened on Wednesday 13th May 2026 and will close on Wednesday 20th May 2026 while that of FXD1/2021/020 opens on Monday 18th May 2026 and will close on Wednesday 20th May 2026. Our bidding ranges for the FXD3/2019/015, and FXD1/2021/020 is 12.5%-13.0% and 13.5%-14.0% respectively.
Money Market Performance:
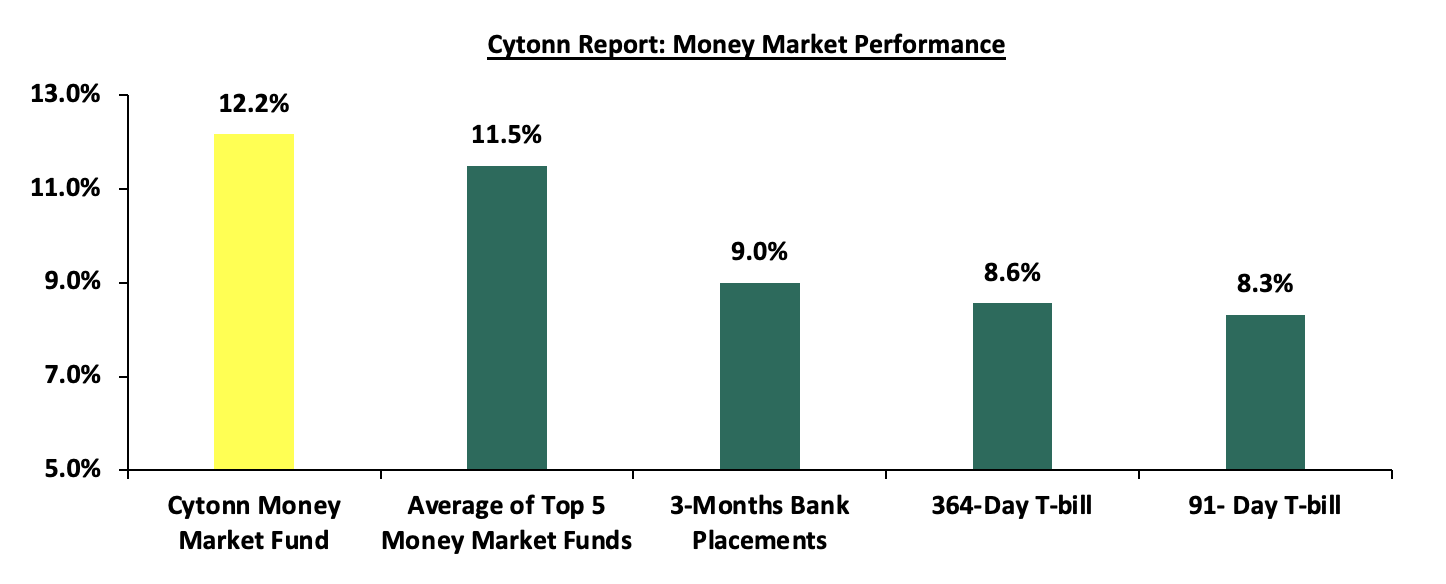
In the money markets, 3-month bank placements ended the week at 9.0% (based on rates offered by various banks. The yields on the government papers were on an upward trajectory with the yields on the 91-day paper and 364-day paper increasing by 12.8 bps and 4.9 bps to 8.3% and 8.6% from the 8.2% and 8.5% recorded the previous week respectively. The yield on the Cytonn Money Market Fund increased marginally by 4.0 bps to 12.2% from the 12.1% recorded the previous week, while the average yields on the Top 5 Money Market Funds decreased by 12.4 bps to 11.5% from 11.6% recorded the previous week.
The table below shows the Money Market Fund Yields for Kenyan Fund Managers as published on 15th May 2026:
|
Money Market Fund Yield for Fund Managers as published on 15th May 2026 |
||
|
Rank |
Fund Manager |
Effective Annual Rate |
|
1 |
Cytonn Money Market Fund ( Dial *809# or download Cytonn App) |
12.2% |
|
2 |
Nabo Africa Money Market Fund |
12.0% |
|
3 |
Etica Money Market Fund |
11.7% |
|
4 |
Arvocap Money Market Fund |
11.0% |
|
5 |
Lofty-Corban Money Market Fund |
10.7% |
|
6 |
Enwealth Money Market Fund |
10.6% |
|
7 |
Jubilee Money Market Fund |
10.5% |
|
8 |
Ndovu Money Market Fund |
10.5% |
|
9 |
Kuza Money Market fund |
10.4% |
|
10 |
Orient Kasha Money Market Fund |
10.3% |
|
11 |
Faulu Money Market Fund |
10.2% |
|
12 |
Madison Money Market Fund |
10.2% |
|
13 |
Old Mutual Money Market Fund |
10.1% |
|
14 |
Gulfcap Money Market Fund |
10.1% |
|
15 |
British-American Money Market Fund |
10.0% |
|
16 |
GenAfrica Money Market Fund |
9.9% |
|
17 |
Mali Money Market Fund |
9.7% |
|
18 |
Dry Associates Money Market Fund |
9.3% |
|
20 |
SanlamAllianz Money Market Fund |
9.3% |
|
21 |
Apollo Money Market Fund |
9.2% |
|
22 |
KCB Money Market Fund |
9.1% |
|
23 |
Genghis Money Market Fund |
8.8% |
|
24 |
CIC Money Market Fund |
8.4% |
|
25 |
CPF Money Market Fund |
8.3% |
|
26 |
Co-op Money Market Fund |
8.2% |
|
27 |
ICEA Lion Money Market Fund |
8.1% |
|
28 |
Absa Shilling Money Market Fund |
7.3% |
|
29 |
Mayfair Money Market Fund |
7.0% |
|
30 |
AA Kenya Shillings Fund |
6.3% |
|
31 |
Ziidi Money Market Fund |
6.0% |
|
32 |
Stanbic Money Market Fund |
5.3% |
|
33 |
Nabo Africa Money Market Fund |
4.4% |
Source: Business Daily
Liquidity:
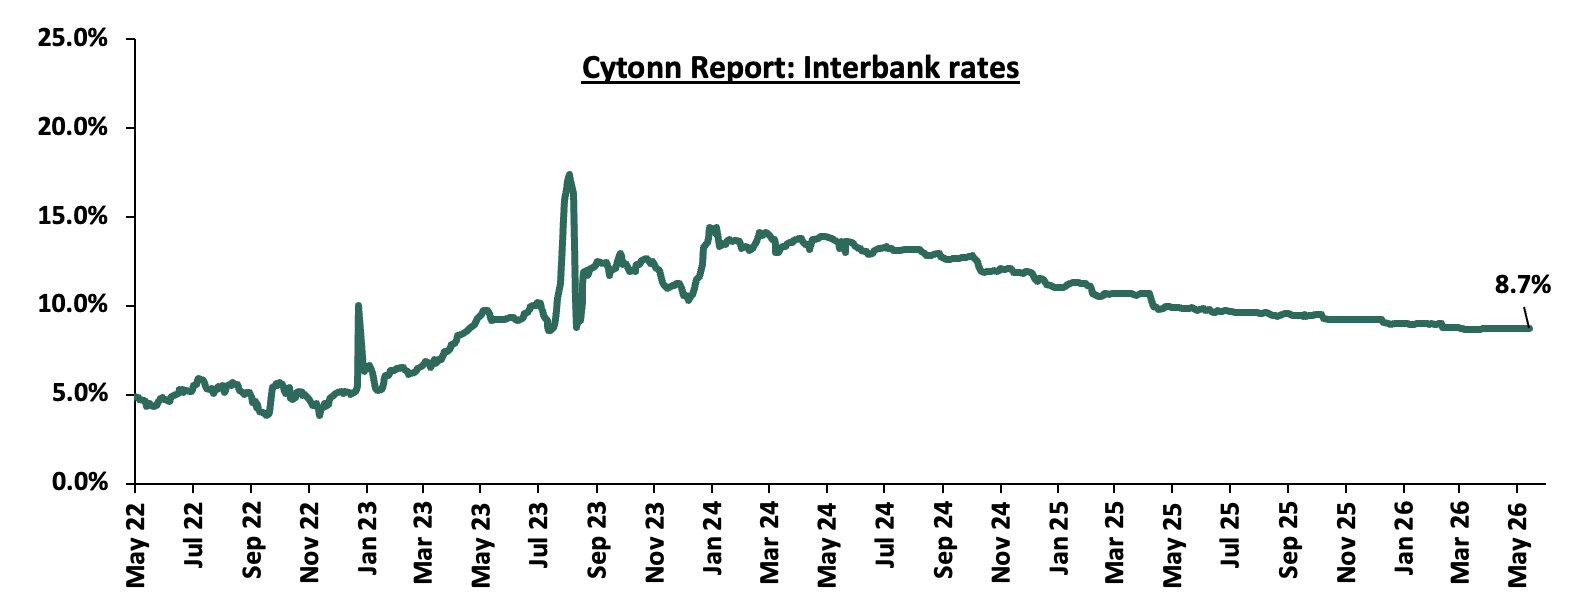
During the week, liquidity in the money markets eased with the average interbank rate decreasing by 0.3 bps to remain relatively unchanged at 8.8% recorded last week, partly attributable to government payments that offset tax remittances. The average interbank volumes traded increased by 5.9% to Kshs 10.7 bn from Kshs 10.1 bn recorded the previous week. The chart below shows the interbank rates in the market over the years:
Kenya Eurobonds:
During the week, the yields on the Eurobonds showed mixed performance with the yield on the 30-year Eurobond issued in 2018, increasing the most by 10.0 bps to 9.0% from 8.9% recorded the previous week. While the yield on the 7-year Eurobond issued in 2024 decreasing by 1.0 bps to remain relatively unchanged at 7.5% recorded the previous week. The table below shows the summary performance of the Kenyan Eurobonds as of 14th May 2026;
|
Cytonn Report: Kenya Eurobonds Performance |
||||||
|
|
2018 |
2019 |
2021 |
2024 |
||
|
Tenor |
10-year issue |
30-year issue |
12-year issue |
13-year issue |
7-year issue |
|
|
Amount Issued (USD) |
1.0 bn |
1.0 bn |
1.0 bn |
1.5 bn |
1.5 bn |
|
|
Years to Maturity |
2.5 |
22.5 |
8.8 |
5.5 |
10.5 |
|
|
Yields at Issue |
7.3% |
8.3% |
6.2% |
10.4% |
9.9% |
|
|
02-Jan-26 |
6.1% |
8.8% |
7.2% |
7.8% |
7.1% |
|
|
30-Apr-26 |
7.5% |
9.4% |
8.5% |
8.9% |
8.2% |
|
|
07-May-26 |
7.2% |
8.9% |
7.9% |
8.3% |
7.5% |
|
|
08-May-26 |
7.2% |
9.0% |
7.9% |
8.3% |
7.6% |
|
|
11-May-26 |
7.0% |
8.9% |
7.8% |
8.1% |
7.3% |
|
|
12-May-26 |
7.3% |
9.0% |
7.9% |
8.4% |
7.6% |
|
|
13-May-26 |
7.1% |
9.0% |
7.9% |
8.3% |
7.6% |
|
|
14-May-26 |
7.2% |
9.0% |
7.9% |
8.3% |
7.5% |
|
|
Weekly Change |
0.0% |
0.1% |
0.1% |
0.1% |
(0.0%) |
|
|
MTD Change |
(0.3%) |
(0.3%) |
(0.6%) |
(0.5%) |
(0.7%) |
|
|
YTD Change |
1.2% |
0.2% |
0.8% |
0.5% |
0.4% |
|
Source: Central Bank of Kenya (CBK) and National Treasury
Kenya Shilling:
During the week, the Kenya Shilling depreciated against the US Dollar by 10.8 bps to Kshs 129.3 from Kshs 129.1 recorded the previous week. On a year-to-date basis, the shilling has depreciated by 21.7 bps against the dollar, as compared to the 22.9 bps appreciation recorded in 2025.
We expect the shilling to be supported by:
- Diaspora remittances standing at a cumulative USD 5,053.5 mn in the twelve months to April 2026, 1.1% higher than the USD 4,997.2 mn recorded over the same period in 2025. These have continued to cushion the shilling against further depreciation. In the April 2026 diaspora remittances figures, North America remained the largest source of remittances to Kenya accounting for 52.2% in the period, and,
- Tourism inflows, which strengthened significantly. Tourism receipts reached Kshs 560.0 bn in 2025, up from Kshs 452.2 bn in 2024, representing a 23.9% increase, supported by improved international arrivals through the country’s major airports, and,
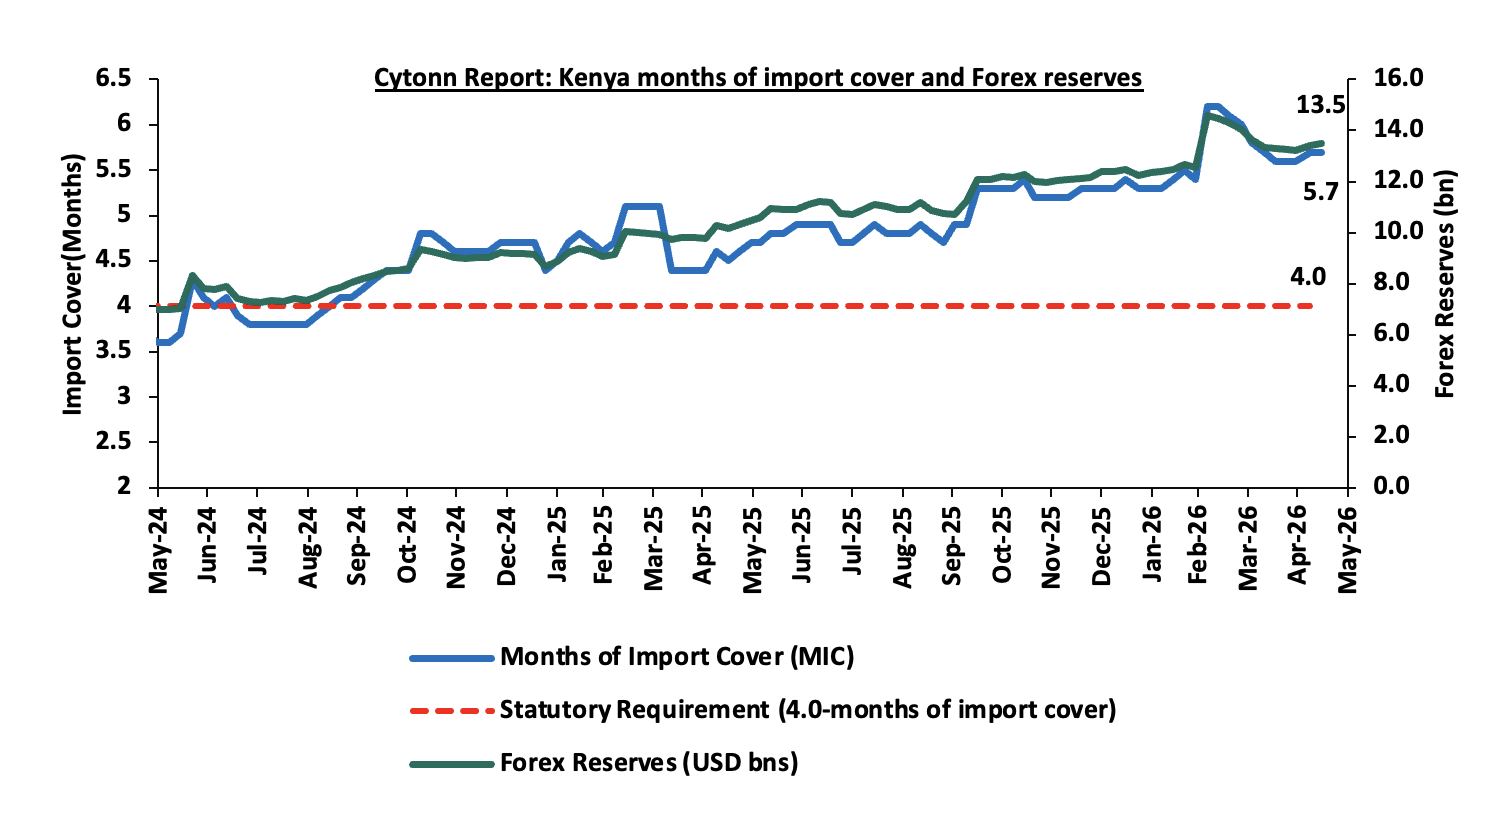
- Improved forex reserves currently at USD 13.5 bn (equivalent to 5.7-months of import cover), which is above the statutory requirement of maintaining at least 4.0-months of import cover and above the EAC region’s convergence criteria of 4.5-months of import cover.
The shilling is however expected to remain under pressure in 2026 as a result of:
- An ever-present current account deficit which came at 2.4% of GDP in the twelve months to February 2026, and,
- The need for government debt servicing, continues to put pressure on forex reserves given that 52.0% of Kenya’s external debt is US Dollar-denominated as of September 2025.
- Rising geopolitical tensions in the Middle East, which could exert pressure on the shilling through higher global oil prices and increased uncertainty in international markets. Given that Kenya is a net importer of petroleum products, any sustained increase in oil prices would widen the import bill, increase demand for US Dollars, and consequently put depreciation pressure on the shilling.
Kenya’s forex reserves increased by 0.7% during the week to USD 13.5 bn from USD 13.4 bn recorded the previous week, equivalent to 5.7 months of import cover, and above the statutory requirement of maintaining at least 4.0-months of import cover.
The chart below summarizes the evolution of Kenya's months of import cover over the years:
Weekly Highlights
- Exchequer Highlight April 2026
The National Treasury gazetted the revenue and net expenditures for the tenth month of FY’2025/2026, ending 30th April 2026, highlighting that the total revenue collected as at the end of April 2026 amounted to Kshs 2,104.3 bn, equivalent to 75.6% of the revised estimates of Kshs 2,784.4 bn for FY’2025/2026 and is 90.7% of the prorated estimates of Kshs 2,320.3 bn. Below is a summary of the performance:
|
FY'2025/2026 Budget Outturn - As at 30th April 2026 |
||||||
|
Amounts in Kshs billions unless stated otherwise |
||||||
|
Item |
12-months Original Estimates |
Revised Estimates |
Actual Receipts/Release |
Percentage Achieved |
Prorated |
% achieved of the Prorated |
|
Opening Balance |
6.4 |
|||||
|
Tax Revenue |
2,627.1 |
2,600.8 |
1,967.7 |
75.7% |
2,167.3 |
90.8% |
|
Non-Tax Revenue |
127.6 |
183.6 |
130.3 |
70.9% |
153.0 |
85.1% |
|
Total Revenue |
2,754.7 |
2,784.4 |
2,104.3 |
75.6% |
2,320.3 |
90.7% |
|
External Loans & Grants |
569.8 |
824.9 |
559.1 |
67.8% |
687.4 |
81.3% |
|
Domestic Borrowings |
1,098.3 |
1,539.1 |
1,047.2 |
68.0% |
1,282.6 |
81.6% |
|
Other Domestic Financing |
10.8 |
10.8 |
8.5 |
78.9% |
9.0 |
94.7% |
|
Total Financing |
1,678.9 |
2,374.8 |
1,614.8 |
68.0% |
1,979.0 |
81.6% |
|
Recurrent Exchequer issues |
1,470.4 |
1,676.6 |
1,343.2 |
80.1% |
1,397.1 |
96.1% |
|
CFS Exchequer Issues |
2,141.0 |
2,584.6 |
1,671.4 |
64.7% |
2,153.8 |
77.6% |
|
Development Expenditure & Net Lending |
407.1 |
483.0 |
318.7 |
66.0% |
402.5 |
79.2% |
|
County Governments + Contingencies |
415.0 |
415.0 |
309.2 |
74.5% |
345.8 |
89.4% |
|
Total Expenditure |
4,433.6 |
5,159.2 |
3,642.5 |
82.2% |
4,299.3 |
84.7% |
|
Fiscal Deficit excluding Grants |
1,678.9 |
2,374.8 |
1,538.2 |
64.8% |
1,979.0 |
77.7% |
|
Total Borrowing |
1,668.1 |
2,364.0 |
1,606.3 |
67.9% |
1,970.0 |
81.5% |
The key take-outs from the release include;
- Total revenue collected as at the end of April 2026 amounted to Kshs 2,104.3 bn, equivalent to 75.6% of the revised estimates of Kshs 2,784.4 bn for FY’2025/2026 and is 90.7% of the prorated estimates of Kshs 2,320.3 bn. Cumulatively, tax revenues amounted to Kshs 1,967.7 bn, equivalent to 75.7% of the revised estimates of Kshs 2,600.8 bn and 90.8% of the prorated estimates of Kshs 2,167.3 bn,
- Total financing amounted to Kshs 1,614.8 bn, equivalent to 68.0% of the revised estimates of Kshs 2,374.8 bn and is equivalent to 81.6% of the prorated estimates of Kshs 1,979.0 bn. Additionally, domestic borrowing amounted to Kshs 1,047.2 bn, equivalent to 68.0% of the revised estimates of Kshs 1,539.1 bn and is 81.6% of the prorated estimates of Kshs 1,282.6 bn.
- The total expenditure amounted to Kshs 3,642.5 bn, equivalent to 82.2% of the revised estimates of Kshs 5,159.2 bn, and is 84.7% of the prorated target expenditure estimates of Kshs 4,299.3 bn. Additionally, the net disbursements to recurrent expenditures came in at Kshs 1,343.2 bn, equivalent to 80.1% of the revised estimates of Kshs 1,676.6 and are equivalent to 96.1% of the prorated estimates of Kshs 1,397.1 bn,
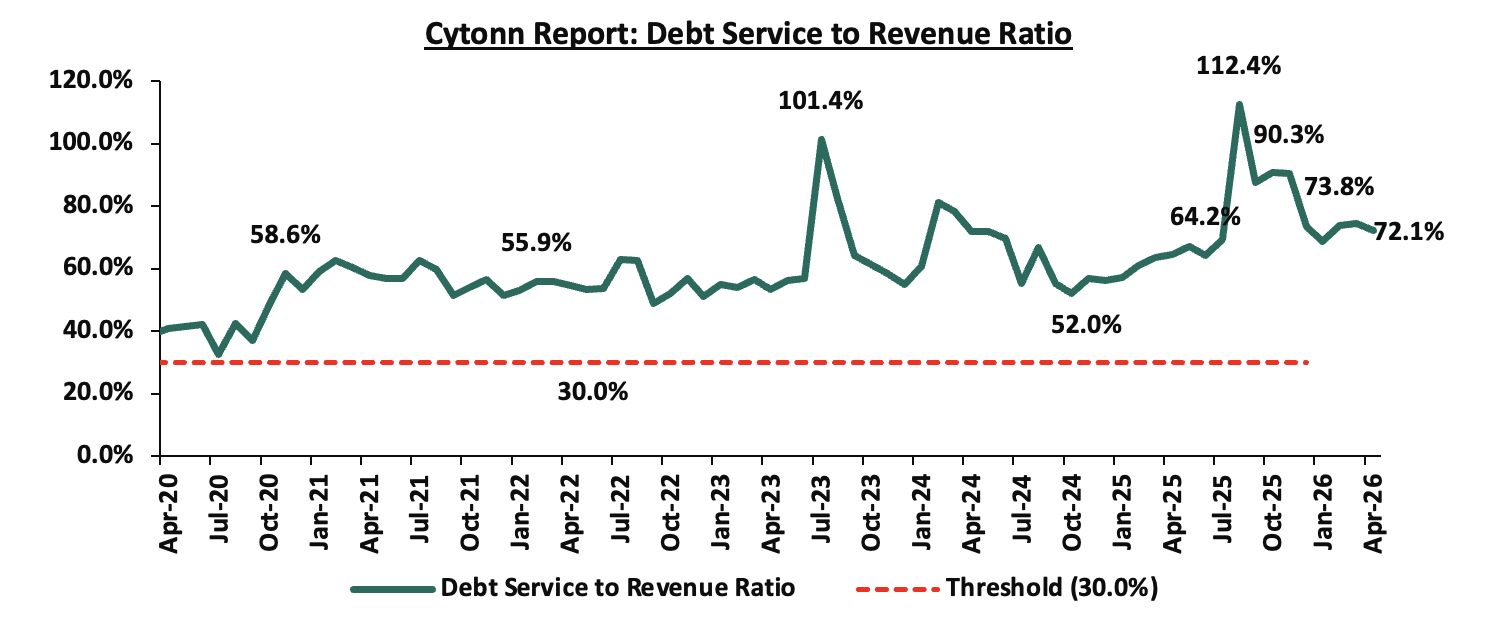
- Consolidated Fund Services (CFS) Exchequer issues came in at Kshs 1,671.4 bn, equivalent to 64.7% of the revised estimates of Kshs 2,584.6 bn, and are 77.6% of the prorated amount of Kshs 2,153.8 bn. The cumulative public debt servicing cost amounted to Kshs 1,517.4 bn which is 64.7% of the revised estimates of Kshs 2,344.6 bn and is 77.7% of the prorated estimates of Kshs 1,953.8 bn. Additionally, the Kshs 1,517.4 bn debt servicing cost is equivalent to 72.1% of the actual cumulative revenues collected as at the end of April 2026. The chart below shows the debt servicing cost to revenue ratio over the period;
- Total borrowings as at the end of March 2026 amounted to Kshs 1,606.3 bn, equivalent to 67.9% of the revised estimates of Kshs 2,364.0 bn for FY’2025/2026 and are 81.5% of the prorated estimates of Kshs 1,970.0 bn. The cumulative domestic borrowing of Kshs 1,539.1 bn comprises of Net Domestic Borrowing Kshs 994.8 bn and Internal Debt Redemptions (Rollovers) Kshs 544.3 bn.
The government underachieved its prorated revenue targets for the tenth month of the FY’2025/2026, achieving 90.7% of the prorated revenue targets in April 2026, higher than 87.8% achieved in March 2026. This was driven by shortfall in tax revenues and non-tax revenues, which stood at 90.8% and 85.1% of prorated levels respectively, with collections amounting to Kshs 1,967.7 bn in tax revenue and Kshs 130.3 bn in non-tax revenue. External loans and grants were behind target at 81.3%, reducing reliance on domestic borrowing, which came in at 81.6% of the prorated target of Kshs 1,282.6 bn. The business environment, however, showed signs of deterioration, with the Purchasing Managers’ Index (PMI) standing at 49.4 in April 2026 from 47.7 in March 2026, remaining below the 50.0 neutral mark and signaling a contraction of business activity. Expenditure absorption stood at 84.7% of prorated levels, with development spending still lagging at 79.2%, reflecting slow implementation of capital projects. Future revenue performance will depend on how quickly private sector activity strengthens, supported by a stable Shilling, easing credit conditions following the decision to maintain the Central Bank Rate at 8.75% in April 2026, and continued efforts to broaden the tax base, curb evasion, and stimulate economic growth. However, the outlook remains vulnerable to external shocks, particularly the ongoing Iran-Israel conflict, which has heightened global oil price volatility and supply chain disruptions, posing upside risks to inflation and production costs, and potentially constraining private sector expansion and revenue mobilization.
- Fuel Prices effective 15th May – 14th June 2026
During the week, The Energy and Petroleum Regulatory Authority (EPRA) released their monthly statement on the maximum retail fuel prices in Kenya, effective from 15th May 2026 to 14th June 2026. Notably, the maximum allowed prices for Super Petrol, and Diesel increased by Kshs 16.7, and Kshs 46.3 per litre to Kshs 214.3, and Kshs 242.9 per litre from Kshs 197.6 and Kshs 196.6 per litre respectively in April 2026, marking the second increase in 2026. On the other hand, Kerosene remain unchanged at Kshs 152.8 per litre.
Other key take-outs from the performance include,
- The average landing cost per cubic metre of Diesel, Super Petrol, and Kerosene increased by 20.3%, 10.0% and 1.6% to USD 1,292.0, USD 906.2 and USD 1,332.7 in April 2026 from USD 1,073.8, USD 823.3 and USD 1,311.9 recorded in March 2026.
- The Kenyan Shilling appreciated against the US Dollar by 38.4 bps to Kshs 129.6 in April from 130.1 recorded in March 2026
- The Authority calculated the prices based on 8% Value Added Tax (VAT) on petroleum products, aimed at cushioning consumers from the sharp increase in global oil prices.
- The government reduced the level of price stabilization on Kerosene, and Diesel by Kshs 91.3 and Kshs 14.5 per litre respectively.
We note that while fuel prices have seen a sharp upward adjustment in the May 2026 cycle, the government’s continued intervention through the price stabilization mechanism, with the government planning to utilize approximately Kshs 5.0 bn of the Petroleum Development Levy (PDL) Fund to stabilize the prices and a stable Kenyan Shilling have prevented even steeper increases. Without these efforts, the record surges in landing costs for Kerosene, Diesel and Super Petrol, would have dealt a far more severe blow to the economy.
Going forward, the outlook for fuel prices remains cautious. While the government's stabilization framework provides a cushion, persistent geopolitical tensions in the Middle East suggest that global oil prices may remain volatile. Given Diesel’s role as a key input in production and transportation, the recent prices increase is expected to exert cost-push pressures across sectors, particularly in manufacturing, agriculture, and logistics, triggering a sharp rise in transportation costs and fueling broader inflationary pressures as these added expenses are passed down to the final consumer. However, provided the exchange rate remains firm and the Petroleum Development Levy remains active, we anticipate that inflationary pressures will be managed, keeping the overall rate broadly within the Central Bank of Kenya’s preferred target range of 2.5% - 7.5% in the medium term.
- FY'2026/2027 Budget Estimates
On 13th May 2026, the National Treasury presented its Budget Estimates for the next fiscal year, FY’2026/27. Notably, the budget estimates recorded a 1.5% increase to Kshs 4.8 tn from the previous estimates of Kshs 4.7 tn in the Budget Policy Statement for FY’2026/27 and a 3.2% increase from the Kshs 4.6 tn in FY’2025/26 as per the Supplementary Budget I. Additionally, total revenue is set to increase by 2.7% to Kshs 3.6 tn in FY’2026/27 from Kshs 3.4 tn in FY’2025/26 as per the Supplementary Budget I. Below is a summary of the major changes as per the FY’2026/27 budget estimates from the expected FY’2026/2027 budget performance:
|
Cytonn Report: Comparison of 2025/26 and 2026/27 Fiscal Year Budgets as per the FY’2026/27 Budget Estimates |
|||||
|
|
FY'2025/2026 Revised Estimates (a) |
FY'2026/2027 BPS (b) |
FY'2026/2027 Budget Estimates (c) |
% change |
|
|
2025/26 to 2026/27 (a/b) |
2025/26 to 2026/27 (b/c) |
||||
|
Total revenue |
3,399.1 |
3,534.2 |
3,629.7 |
6.8% |
2.7% |
|
External grants |
39.9 |
54.4 |
43.6 |
9.3% |
(19.9%) |
|
Total revenue & external grants |
3,439.0 |
3,588.6 |
3,673.3 |
6.8% |
2.4% |
|
Recurrent expenditure |
3,393.2 |
3,464.6 |
3,538.7 |
4.3% |
2.1% |
|
Development expenditure & Net Lending |
758.4 |
753.4 |
749 |
(1.2%) |
(0.6%) |
|
County governments + contingencies |
486.8 |
497.5 |
497.5 |
2.2% |
0.0% |
|
Total expenditure |
4,638.4 |
4,715.5 |
4,785.2 |
3.2% |
1.5% |
|
Fiscal deficit excluding grants |
1,199.4 |
1,126.9 |
1,111.9 |
(7.3%) |
(1.3%) |
|
Deficit as % of GDP |
6.43% |
5.30% |
5.34% |
(17.0%) |
0.8% |
|
Net foreign borrowing |
225.8 |
225.5 |
116.2 |
(48.5%) |
(48.5%) |
|
Net domestic borrowing |
973.6 |
901.4 |
995.7 |
2.3% |
10.5% |
|
Total borrowing |
1,199.4 |
1,126.9 |
1,111.9 |
(7.3%) |
(1.3%) |
|
GDP Estimate |
18,642.5 |
20,947.4 |
20,816.8 |
11.7% |
(0.6%) |
Some of the key take-outs include;
- The FY’2026/27 budget estimates point to a 3.2% increase of the budget, to Kshs 4.8 tn from Kshs 4.6 tn in the FY’2025/26 Supplementary Budget I,
- Recurrent expenditure is set to increase by 2.1% to Kshs 3.53 tn, from Kshs 3.46 tn as per the Budget Policy Statement and a 4.3% increase from Kshs 3.4 tn as per the Supplementary Budget I FY’2025/26, while development expenditure and net lending is projected to decrease by 0.6% and 1.2% to Kshs 749.0 bn from Kshs 753.4 bn and Kshs 758.4 bn as per the FY’2026/27 Budget Policy Statement and the Supplementary Budget I FY’2025/26 respectively,
- The budget deficit is projected to decline by 7.3% to Kshs 1.1 tn representing 5.3% of GDP from the projected Kshs 1.2 bn which is 6.4% of GDP in the FY’2025/26 Supplementary Budget I,
- Total revenue and grants are projected to increase by 6.8% to Kshs 3.7 tn, from Kshs 3.4 tn in the FY’2025/26 Supplementary Budget I, supported by measures already in place to boost revenue performance.
- Total borrowing is expected to decline by 7.3% to Kshs 1.1 tn from Kshs 1.2 tn as per the FY’2025/26 Supplementary Budget I, in a bid to reduce Kenya's public debt burden, and,
- Debt financing of the 2026/27 budget is estimated to consist of 89.5% domestic debt and 10.5% foreign debt, from 81.2% domestic and 18.8% foreign as per the FY’2025/26 Supplementary Budget I.
For more detailed analysis, please see our FY’2026/27 Budget Estimates Note
- The Finance Bill 2026
On 30th April 2026, the Cabinet Secretary for the National Treasury and Economic Planning presented the Finance Bill 2026 to the National Assembly for approval. Key proposed amendments under the Bill include:
Under the Income Tax Act, the Bill proposes to:
- Introduce a tax amnesty on penalties and interest for tax liabilities relating to periods up to 31st December 2025, provided the principal tax is paid by 31st December 2026. This is expected to encourage settlement of outstanding tax obligations, improve voluntary compliance, and enhance revenue collection without increasing tax rates.
- Introduce withholding tax on interchange fees and merchant service fees arising from card payment transactions. This effectively brings Visa, Mastercard, and other card-processing related payments into the withholding tax framework, broadening the tax base within the financial services ecosystem.
- Increase the Monthly Residential Rental Income Tax rate to 10.0% from 7.5%, increasing the government’s revenue collection from landlords while potentially exerting upward pressure on rental prices, particularly within the lower-middle income housing segment.
- Introduce a 10.0% tax on rental income earned by non-resident persons from property situated in Kenya, expanding the tax base to include non-resident property owners earning Kenyan-source rental income.
Under the Excise Duty Act, the Bill proposes to:
- Introduce a 25.0% excise duty on smartphones, mobile phones, telephone sets, and other communication devices upon activation on a local mobile network. This proposal is expected to increase the cost of imported mobile devices, particularly affecting consumers purchasing imported or second-hand phones, while also expanding government revenue collection from the rapidly growing telecommunications and electronics market.
- Introduce a detailed definition of “amount deposited” for purposes of betting and gambling excise duty to include money, cash equivalents, tokens, credits, and similar instruments used in gambling transactions. This broadens the excise duty base by capturing alternative forms of value used in betting and gaming platforms, reducing loopholes within digital gambling ecosystems.
- Introduce definitions for “virtual asset” and “virtual asset service provider” by linking them to the Virtual Asset Service Providers Act, 2025. This aligns the Excise Duty Act with the emerging digital asset regulatory framework and strengthens the government’s ability to tax virtual asset-related transactions.
Under the Value Added Tax (VAT) Act, the Bill proposes to:
- Exempt goods and services used in public-private partnership infrastructure projects from VAT subject to approval by the Cabinet Secretary, lowering project costs and potentially encouraging private sector participation in infrastructure development.
- Introduce VAT on selected digital and platform-based financial services, broadening taxation within the digital economy and increasing the tax burden on fintech and platform-based financial service providers.
- Grant VAT relief on selected renewable energy and electric mobility products including electric buses and bicycles, supporting the government’s transition toward green mobility and clean energy adoption.
Under the Tax Procedures Act, the Bill proposes to:
- Reduce the income tax return filing period from six months to four months after the end of the accounting period, accelerating compliance timelines and enhancing the Kenya Revenue Authority’s ability to reconcile taxes earlier. This may however increase compliance pressure for businesses with complex reporting structures.
- Require nil returns to be filed within one month after the end of the year of income, tightening compliance obligations even for inactive taxpayers and enhancing taxpayer monitoring.
For more detailed analysis, please see our Cytonn Note on the Finance Bill 2026
Rates in the Fixed Income market have been on a downward trend due to high liquidity in the money market which allowed the government to front load most of its borrowing. The government is 18.2% ahead of its prorated net domestic borrowing target of Kshs 880.6 bn, having a net borrowing position of Kshs 1040.5 bn (inclusive of T-bills). However, we expect a stabilization of the yield curve in the short and medium term, with the government looking to increase its external borrowing to maintain the fiscal surplus, hence alleviating pressure in the domestic market. As such, we expect the yield curve to stabilize in the short to medium-term and hence investors are expected to shift towards the long-term papers to lock in the high returns
Market Performance:
During the week, the equities market was on a downward trajectory, with NASI, NSE 25, NSE 20, and NSE 10 declining by 1.9%, 0.3%, 0.2% and 0.1% respectively, taking the YTD performance to gains of 12.2%, 11.0%, 9.7% and 8.6% for NSE 20, NSE 25, NASI and NSE 10 respectively. The week-on-week equities market performance was mainly driven by loses recorded by large cap stocks such as BAT, Safaricom and EABL of 9.8%, 6.7% and 0.8% respectively. However, the performance was supported by gains recorded by large cap stocks such as Co-operative, Standard Chartered and ABSA of 10.5%, 2.9% and 2.3% respectively.
During the week, the banking sector index increased by 2.1% to 236.9 from 232.0 recorded the previous week. This is attributable to gains recorded by large cap stocks such as Co-operative, Standard Chartered and Absa of 10.5%, 2.9% and 2.3% respectively;
During the week, equities turnover decreased by 29.8% to USD 23.7 mn from USD 33.8 mn recorded the previous week, taking the YTD total turnover to USD 615.4 mn. Foreign investors remained net sellers for the fourth consecutive week with a net selling position of USD 2.8 mn, from a net selling position of USD 5.8 mn recorded the previous week, taking the YTD foreign net selling position to USD 91.9 mn, compared to a net selling position of USD 92.9 mn recorded in 2025.
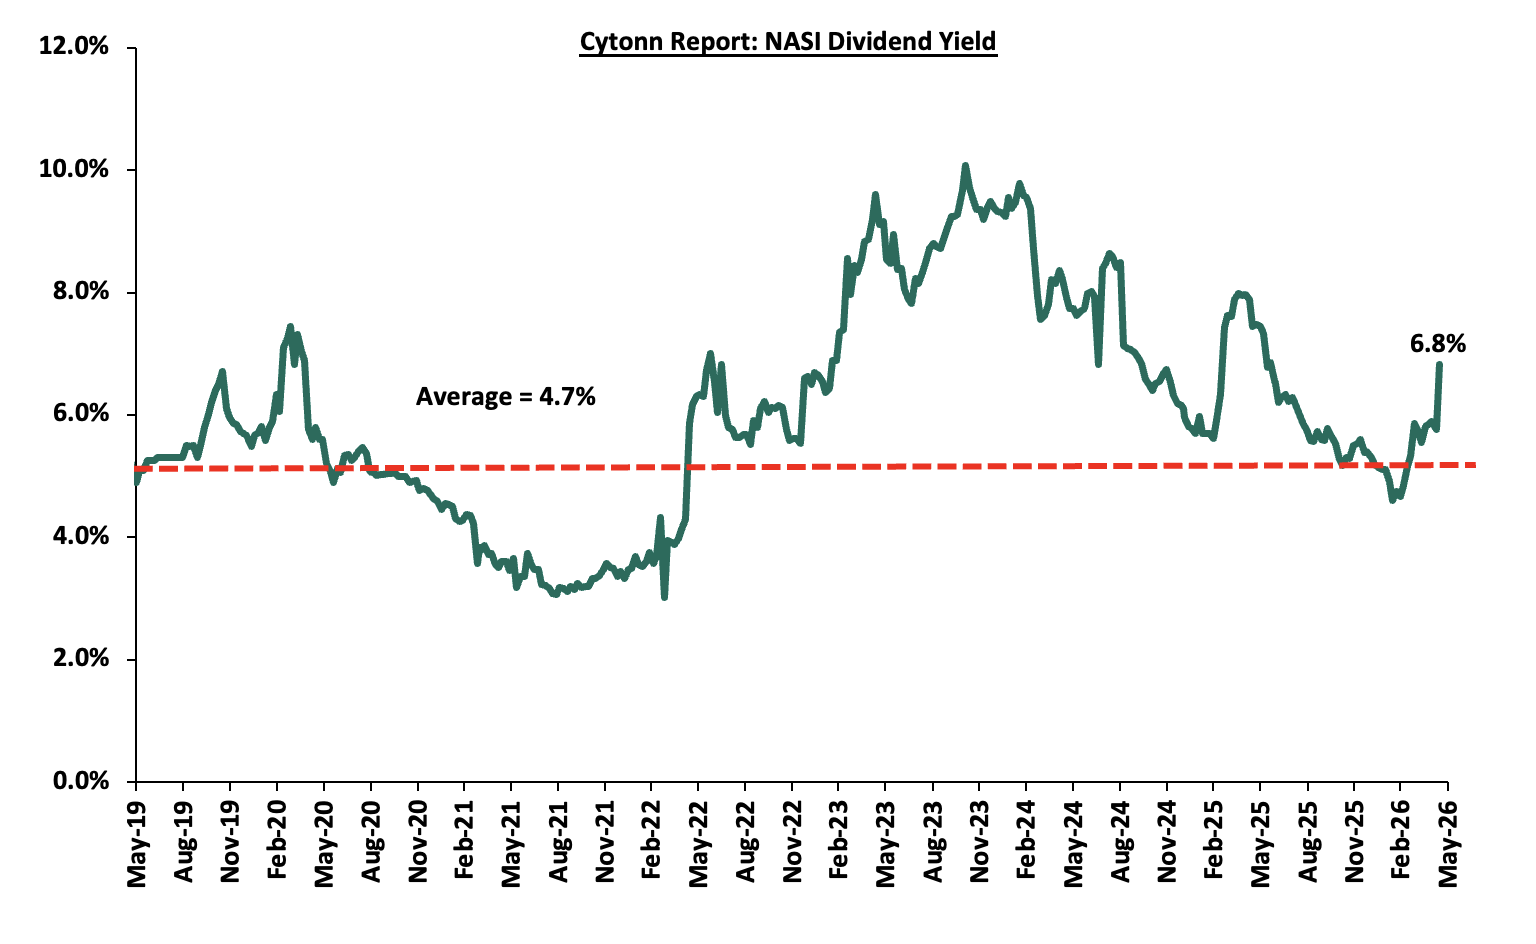
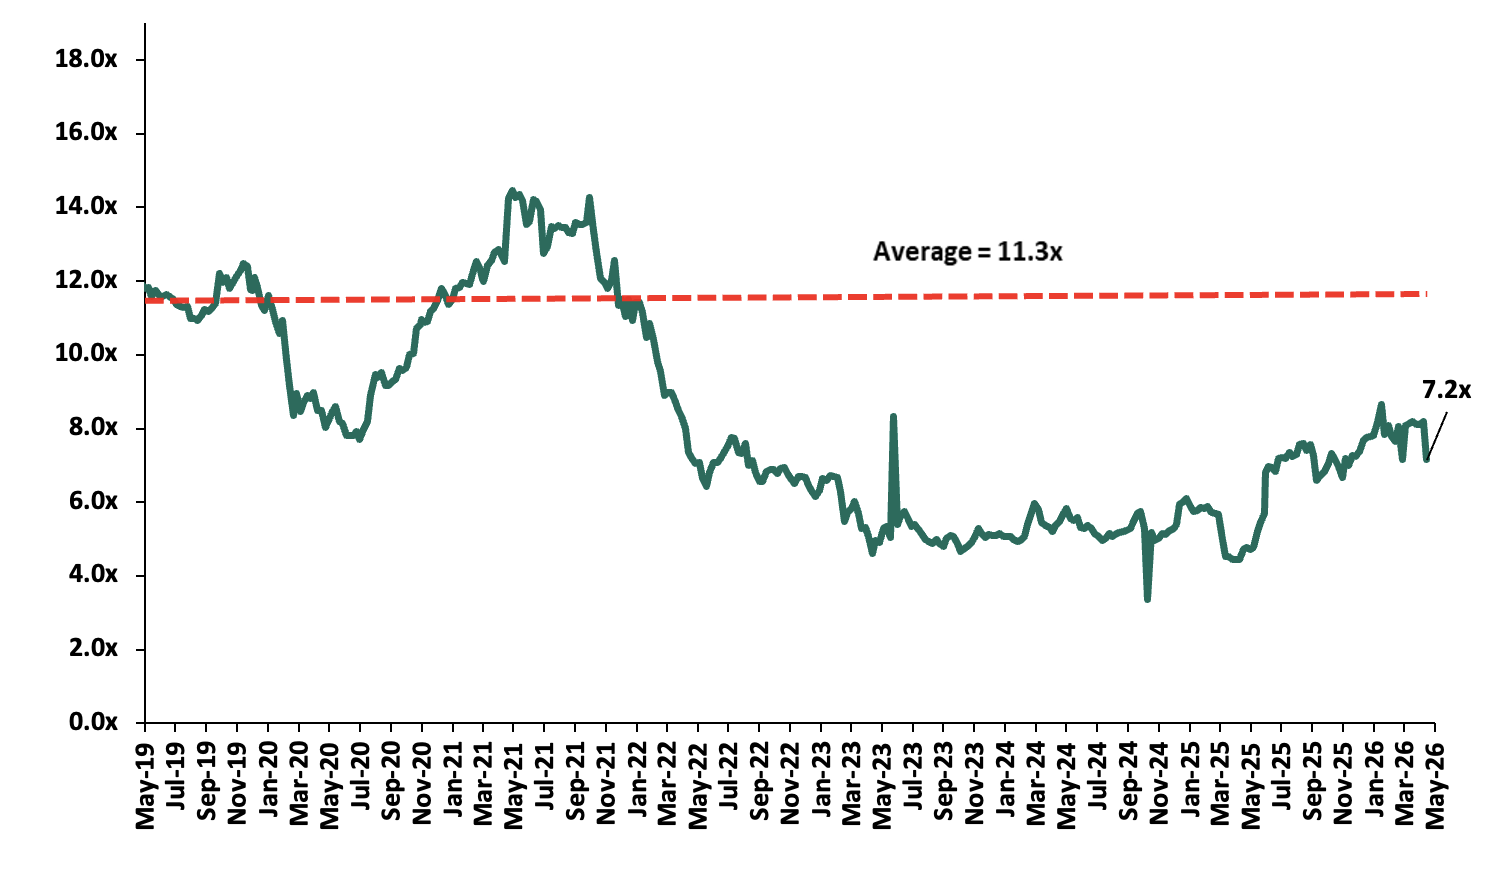
The market is currently trading at a price to earnings ratio (P/E) of 7.2x, 36.5% below the historical average of 11.3x, and a dividend yield of 6.8%, 2.1% points above the historical average of 4.7%. Key to note, NASI’s PEG ratio currently stands at 0.9x, an indication that the market is undervalued relative to its future growth. A PEG ratio greater than 1.0x indicates the market may be overvalued while a PEG ratio less than 1.0x indicates that the market is undervalued.
The charts below indicate the historical P/E and dividend yields of the market;
Universe of Coverage:
|
Cytonn Report: Equities Universe of Coverage |
|||||||||||
|
Company |
Price as at 08/05/2026 |
Price as at 15/05/2026 |
w/w change |
m/m change |
YTD Change |
Year Open 2026 |
Target Price* |
Dividend Yield |
Upside/ Downside** |
P/TBv Multiple |
Recommendation |
|
CIC Group |
4.3 |
4.2 |
(2.5%) |
(0.9%) |
(7.0%) |
4.5 |
5.5 |
3.1% |
33.4% |
1.1x |
Buy |
|
KCB Group |
66.8 |
66.8 |
0.0% |
(0.4%) |
1.5% |
65.8 |
81.1 |
10.5% |
32.0% |
0.7x |
Buy |
|
NCBA |
88.3 |
88.5 |
0.3% |
(0.6%) |
4.1% |
85.0 |
103.3 |
8.0% |
24.7% |
1.2x |
Buy |
|
Equity Group |
74.8 |
75.0 |
0.3% |
2.0% |
11.9% |
67.0 |
87.8 |
7.7% |
24.7% |
1.0x |
Buy |
|
Diamond Trust Bank |
149.0 |
149.3 |
0.2% |
1.2% |
30.1% |
114.8 |
175.1 |
6.0% |
23.3% |
0.4x |
Buy |
|
Co-op Bank |
29.4 |
32.5 |
10.5% |
3.8% |
36.0% |
23.9 |
37.2 |
7.7% |
22.1% |
1.2x |
Buy |
|
I&M Group |
50.0 |
49.7 |
(0.5%) |
0.4% |
16.1% |
42.8 |
56.7 |
7.5% |
21.5% |
0.8x |
Buy |
|
ABSA Bank |
28.1 |
28.8 |
2.3% |
(5.7%) |
15.7% |
24.9 |
31.7 |
7.1% |
17.5% |
1.6x |
Accumulate |
|
Jubilee Holdings |
385.8 |
369.8 |
(4.1%) |
(2.8%) |
14.7% |
322.5 |
407.5 |
4.1% |
14.3% |
0.5x |
Accumulate |
|
Standard Chartered Bank |
334.8 |
344.5 |
2.9% |
(1.9%) |
14.9% |
299.8 |
346.8 |
9.0% |
9.7% |
2.1x |
Hold |
|
Britam |
12.3 |
12.5 |
2.0% |
1.6% |
38.0% |
9.1 |
13.5 |
0.0% |
8.0% |
0.9x |
Hold |
|
Stanbic Holdings |
290.0 |
294.5 |
1.6% |
3.0% |
48.9% |
197.8 |
273.5 |
7.6% |
8.6% |
1.7x |
Hold |
|
*Target Price as per Cytonn Analyst estimates **Upside/ (Downside) is adjusted for Dividend Yield ***Dividend Yield is calculated using FY’2025 Dividends |
|||||||||||
Weekly Highlights
- Earnings Releases
- Co-operative Group Q1’2026 Performance
During the week, Co-operative Group released their Q1’2026 financial results. Below is a summary of Co-operative Group’s Q1’2026 performance:
|
Balance Sheet Items |
Q1'2025 |
Q1'2026 |
y/y change |
|
Government Securities |
242.1 |
272.9 |
12.7% |
|
Net Loans and Advances |
384.5 |
436.8 |
13.6% |
|
Total Assets |
774.1 |
884.6 |
14.3% |
|
Customer Deposits |
525.2 |
612.2 |
16.6% |
|
Deposits per branch |
2.5 |
2.8 |
11.3% |
|
Total Liabilities |
618.4 |
710.5 |
14.9% |
|
Shareholders’ Funds |
155.9 |
173.8 |
11.5% |
|
Balance Sheet Ratios |
Q1'2025 |
Q1'2026 |
y/y change |
|
Loan to Deposit Ratio |
73.2% |
71.3% |
(1.9%) |
|
Government Securities to Deposits Ratio |
46.1% |
44.6% |
(1.5%) |
|
Return on average equity |
18.2% |
18.9% |
0.7% |
|
Return on average assets |
3.5% |
3.8% |
0.3% |
|
Income Statement |
Q1'2025 |
Q1'2026 |
y/y change |
|
Net Interest Income |
14.2 |
16.0 |
12.2% |
|
Non-Interest Income |
6.9 |
8.1 |
16.3% |
|
Total Operating income |
21.2 |
24.1 |
13.6% |
|
Loan Loss provision |
(2.1) |
(2.1) |
(1.5%) |
|
Total Operating expenses |
(11.7) |
(12.7) |
8.4% |
|
Profit before tax |
9.6 |
11.4 |
18.1% |
|
Profit after tax |
6.9 |
8.4 |
21.3% |
|
Core EPS |
1.2 |
1.4 |
21.3% |
|
Income Statement Ratios |
Q1'2025 |
Q1'2026 |
Y/Y Change |
|
Yield from interest-earning assets |
13.7% |
13.0% |
(0.8%) |
|
Cost of funding |
6.1% |
4.7% |
(1.4%) |
|
Net Interest Spread |
7.6% |
8.3% |
0.7% |
|
Net Interest Income as % of operating income |
67.2% |
66.4% |
(0.8%) |
|
Non-Funded Income as a % of operating income |
32.8% |
33.6% |
0.8% |
|
Cost to Income |
55.5% |
53.0% |
(2.5%) |
|
CIR without provisions |
45.5% |
44.3% |
(1.2%) |
|
Cost to Assets |
1.2% |
1.2% |
(0.0%) |
|
Net Interest Margin |
8.3% |
8.9% |
0.6% |
|
Capital Adequacy Ratios |
Q1'2025 |
Q1'2026 |
% points change |
|
Core Capital/Total deposit Liabilities |
23.7% |
22.8% |
(0.9%) |
|
Minimum Statutory ratio |
8.0% |
8.0% |
|
|
Excess |
15.7% |
14.8% |
(0.9%) |
|
Core Capital/Total Risk Weighted Assets |
19.8% |
21.1% |
1.3% |
|
Minimum Statutory ratio |
10.5% |
10.5% |
|
|
Excess |
9.3% |
10.6% |
1.3% |
|
Total Capital/Total Risk Weighted Assets |
22.8% |
23.2% |
0.4% |
|
Minimum Statutory ratio |
14.5% |
14.5% |
|
|
Excess |
8.3% |
8.7% |
0.4% |
|
Liquidity Ratio |
61.3% |
63.4% |
2.1% |
|
Minimum Statutory ratio |
20.0% |
20.0% |
|
|
Excess |
41.3% |
40.0% |
(1.3%) |
Key Take-Outs:
- Increased earnings - Core earnings per share grew by 21.3% to Kshs 1.4, from Kshs 1.2 in Q1’2025, driven by the 13.6% increase in total operating income to Kshs 24.1 bn, from Kshs 21.2 bn in Q1’2025. However, the performance was weighed down by an 8.4% increase in total operating expenses to Kshs 12.7 bn from Kshs 11.7 bn in Q1’ 2025,
- Improved asset quality – The bank’s Asset Quality improved slightly, with Gross NPL ratio decreasing by 2.4% to 14.7% in Q1’2026, from 17.1% in Q1’2025, attributable to a 3.6% decrease in Gross non-performing loans to Kshs 71.4 bn, from Kshs 74.1 bn in Q1’2025, relative to the 12.3% increase in gross loans to Kshs 485.1 bn, from Kshs 432.1 bn recorded in Q1’2025,
- Expanded Balanced sheet - The balance sheet recorded an expansion as total assets increased by 14.3% to Kshs 884.6 bn, from Kshs 774.1 bn in Q1’2025, mainly driven by a 13.6% increase in net loans and advances to Kshs 436.8 bn from Kshs 384.5 bn and 12.7% increase in governments securities to Kshs 272.9 bn from Kshs 242.1 bn in Q1’2025.
For a more detailed analysis, please see our Co-operative Group Q1’2026 Earnings Note
- DTB-K Bank Q1’2026 Performance
During the week, DTB-K Bank released their Q1’2026 financial results. Below is a summary of DTB-K Bank’s Q1’2026 performance:
|
Balance Sheet Items |
Q1'2025 |
Q1'2026 |
y/y change |
|
Government Securities |
136.9 |
159.8 |
16.7% |
|
Net Loans and Advances |
284.3 |
323.6 |
13.8% |
|
Total Assets |
595.1 |
660.9 |
11.1% |
|
Customer Deposits |
463.6 |
511.9 |
10.4% |
|
Deposits/ Branch |
2.9 |
3.3 |
11.1% |
|
Total Liabilities |
497.4 |
543.2 |
9.2% |
|
Shareholders’ Funds |
86.9 |
105.6 |
21.5% |
|
Balance Sheet Ratios |
Q1'2025 |
Q1'2026 |
% Points change |
|
Loan to Deposit Ratio |
61.3% |
63.2% |
1.9% |
|
Government Securities to Deposit ratio |
29.5% |
31.2% |
1.7% |
|
Return on average equity |
11.5% |
11.4% |
(0.1%) |
|
Return on average assets |
1.6% |
1.7% |
0.2% |
|
Income Statement |
Q1'2025 |
Q1'2026 |
y/y change |
|
Net Interest Income |
7.7 |
10.0 |
30.9% |
|
Net non-Interest Income |
3.0 |
2.9 |
(3.2%) |
|
Total Operating income |
10.7 |
12.9 |
21.2% |
|
Loan Loss provision |
0.9 |
2.2 |
151.8% |
|
Other Operating expenses |
3.0 |
3.0 |
0.9% |
|
Total Operating expenses |
6.6 |
8.1 |
22.9% |
|
Profit before tax |
4.1 |
4.8 |
18.6% |
|
Profit after tax |
3.2 |
3.5 |
7.7% |
|
Core EPS |
11.5 |
12.4 |
7.7% |
|
Income Statement Ratios |
Q1'2025 |
Q1'2026 |
% points change |
|
Yield from interest-earning assets |
11.9% |
11.7% |
(0.2%) |
|
Cost of funding |
6.5% |
5.0% |
(1.5%) |
|
Net Interest Spread |
5.4% |
6.7% |
1.3% |
|
Net Interest Income as % of operating income |
71.7% |
77.4% |
5.7% |
|
Non-Funded Income as a % of operating income |
28.3% |
22.6% |
(5.7%) |
|
Cost to Income Ratio (CIR) |
62.0% |
62.8% |
0.9% |
|
CIR without provisions |
53.7% |
45.6% |
(8.1%) |
|
Cost to Assets |
5.1% |
5.5% |
0.4% |
|
Net Interest Margin |
5.8% |
16.7% |
10.9% |
|
Capital Adequacy Ratios |
Q1'2025 |
Q1'2026 |
% Points Change |
|
Core Capital/Total Liabilities |
16.6% |
16.7% |
0.1% |
|
Minimum Statutory ratio |
8.0% |
8.0% |
|
|
Excess |
8.6% |
8.7% |
0.1% |
|
Core Capital/Total Risk Weighted Assets |
15.4% |
15.3% |
(0.1%) |
|
Minimum Statutory ratio |
10.5% |
10.5% |
|
|
Excess |
4.9% |
4.8% |
(0.1%) |
|
Total Capital/Total Risk Weighted Assets |
17.0% |
16.6% |
(0.4%) |
|
Minimum Statutory ratio |
14.5% |
14.5% |
|
|
Excess |
2.5% |
2.1% |
(0.4%) |
|
Liquidity Ratio |
54.6% |
55.9% |
1.3% |
|
Minimum Statutory ratio |
20.0% |
20.0% |
|
|
Excess |
34.6% |
35.9% |
1.3% |
Key Take-Outs:
- Increased earnings - Core earnings per share (EPS) increased by 7.7% to Kshs 12.4 in Q1’2026 from Kshs 11.5 in Q1’2025, driven by the 21.2% growth in total operating income to Kshs 12.9 bn from Kshs 10.7 bn in Q1’2025, but was however weighed down by the 22.9% increase in total operating expenses to Kshs 8.1 bn from Kshs 6.6 bn.
- Improved asset quality – The bank’s asset quality improved, with the gross NPL ratio declining by 1.5% points to 11.8% in Q1’2026 from 13.2% in Q1’2025, as gross loans increased by 15.5% to Kshs 346.5 bn in Q1’2026 from Kshs 300.1 bn in Q1’2025, outpacing the 2.8% increase in gross non-performing loans to Kshs 40.8 bn in Q1’2026 from Kshs 39.7 bn in Q1’2025.
- Expanded Balanced sheet - The balance sheet recorded an expansion, with total assets increasing by 11.1% to Kshs 660.9 bn in Q1’2026 from Kshs 595.1 bn in Q1’2025, driven by a 13.8% increase in net loans and advances to Kshs 323.6 bn in Q1’2026 from Kshs 284.3 bn in Q1’2025, coupled with a 16.7% growth in government securities holdings to Kshs 159.8 bn in Q1’2026 from Kshs 136.9 bn in Q1’2025.
- Increased lending- Customer net loans and advances increased by 10.4% to Kshs 511.9 bn in Q1’2026 from Kshs 463.6 bn in Q1’2025, reflecting the bank’s continued appetite to expand customer lending.
For a more detailed analysis, please see our DTB-K Bank Q1’2026 Earnings Note
Asset Quality:
The table below shows the asset quality of listed banks that have released their Q1’2026 results using several metrics:
|
Cytonn Report: Listed Banks Asset Quality in Q1’2026 |
||||||
|
Bank |
Q1'2026 NPL Ratio* |
Q1'2025 NPL Ratio** |
% point change in NPL Ratio |
Q1'2026 NPL Coverage* |
Q1'2025 NPL Coverage** |
% point change in NPL Coverage |
|
Co-operative Bank |
14.7% |
17.1% |
(2.4%) |
67.7% |
64.2% |
3.5% |
|
Diamond Trust Bank |
11.8% |
13.2% |
(1.5%) |
56.1% |
39.9% |
16.2% |
|
Stanbic Holdings |
8.4% |
8.7% |
(0.4%) |
85.4% |
80.8% |
4.6% |
|
Q1’2026 Mkt Weighted Average* |
12.2% |
14.0% |
(1.7%) |
72.2% |
66.3% |
5.9% |
|
Q1’2025 Mkt Weighted Average** |
14.0% |
13.5% |
0.5% |
66.3% |
62.7% |
3.6% |
|
*Market cap weighted as at 15/05/2026 |
||||||
|
**Market cap weighted as at 13/06/2025 |
||||||
Key take-outs from the table include;
- Asset quality for the listed banks that have released results improved during Q1’2026, with market-weighted average NPL ratio decreasing by 1.7% points to 12.2% from 14.0% in Q1’2026 largely due to Co-operative Bank numbers, and,
- Market-weighted average NPL Coverage for the three listed banks increased by 5.9% points to 72.2% in Q1’2026 from 66.3% recorded in Q1’2025. The increase was attributable to Diamond Trust Bank NPL coverage ratio increasing by 16.2% points to 56.1% from 39.9% in Q1’2025.
Summary Performance
The table below shows the performance of listed banks that have released their Q1’2026 results using several metrics:
|
Cytonn Report: Listed Banks Performance in Q1’2026 |
||||||||||||||
|
Bank |
Core EPS Growth |
Interest Income Growth |
Interest Expense Growth |
Net Interest Income Growth |
Net Interest Margin |
Non-Funded Income Growth |
NFI to Total Operating Income |
Growth in Total Fees & Commissions |
Deposit Growth |
Growth in Government Securities |
Loan to Deposit Ratio |
Loan Growth |
Return on Average Equity |
|
|
Co-operative Bank |
21.3% |
4.8% |
(8.3%) |
12.2% |
8.9% |
16.3% |
33.6% |
14.4% |
16.6% |
12.7% |
71.3% |
13.6% |
18.9% |
|
|
Diamond Trust Bank |
7.7% |
10.3% |
(12.2%) |
30.9% |
7.0% |
(3.2%) |
22.6% |
2.1% |
10.4% |
16.7% |
63.2% |
13.8% |
11.4% |
|
|
Stanbic Group |
5.5% |
4.7% |
(6.4%) |
11.7% |
5.7% |
(13.7%) |
23.9% |
4.0% |
21.7% |
73.5% |
62.8% |
5.8% |
19.6% |
|
|
Q1'2026 Mkt Weighted Average* |
14.4% |
5.5% |
(8.2%) |
14.3% |
7.6% |
3.9% |
29.0% |
9.4% |
17.6% |
33.5% |
67.5% |
11.0% |
18.3% |
|
|
Q1'2025 Mkt Weighted Average* |
(0.7%) |
(1.4%) |
(14.4%) |
7.9% |
8.0% |
(11.2%) |
33.6% |
0.9% |
0.6% |
30.2% |
66.5% |
(2.3%) |
21.7% |
|
|
*Market cap weighted as at 15/05/2026 |
||||||||||||||
|
**Market cap weighted as at 13/06/2025 |
||||||||||||||
Key take-outs from the table include:
- The listed banks that have released their Q1’2026 results recorded a 14.4% growth in core Earnings per Share (EPS) in Q1’2026, compared to the weighted average decline of 0.7% in Q1’2025, an indication of improved performance attributable to the Co-operative Bank numbers.
- Interest income recorded a weighted average increase of 5.5% in Q1’2026, compared to 1.4% decrease in Q1’2025. However, interest expenses recorded a market-weighted average decline of 8.2% in Q1’2026 compared to the weighted average decline of 14.4% in Q1’2025.
- The Banks’ net interest income recorded a weighted average growth of 14.3% in Q1’2026, an increase from the 7.9% recorded over a similar period in 2025, while the non-funded income grew by 3.9% in Q1’2026 compared to the 11.2% decline recorded in Q1’ 2025, and,
- The Banks recorded a weighted average deposit growth of 17.6%, compared to the increase in market-weighted average deposit of 0.6% in Q1’2025.
We maintain a “cautiously optimistic” short-term outlook supported primarily earnings-led attractive valuations, lower yields on short-term government papers and expected global and local economic recovery, and, “neutral” in the long term as persistent foreign investor outflows continue to constrain market liquidity and limit broad-based market re-rating. With the market currently trading at a discount to its future growth (PEG Ratio at 0.9x), where performance will be driven by company-specific fundamentals rather than general market direction, we believe that investors should reposition towards value stocks exhibiting strong earnings growth, attractive dividend yields, solid balance sheets, sustainable competitive advantages and trading at compelling discounts to their intrinsic value. While foreign investor sell-offs are expected to continue exerting pressure in the near term, we believe this will create selective entry opportunities for long-term investors.
- Residential Sector
- KMRC sustainability bond result
During the week, The Board of Directors of the Kenya Mortgage Refinance Company Plc successfully concluded the second tranche of its Kshs 10.5 bn Medium Term Note (MTN) Programme, with tenors to maturity of 8 years and a weighted average life of 5.1 years. The bond was oversubscribed, with an overall subscription rate coming in at 312.8% receiving bids worth Kshs 9.4 bn. The note was offered at par at an issue price of 100.0% and carries a fixed coupon rate of 12.2% per annum payable semi-annually. The settlement date is 21st May 2026 and the MTN will be listed on NSE on 25th May 2026. The strong response reflects robust investor confidence in KMRC’s credit profile and its role in sustainably promoting home ownership in Kenya.
KMRC plans to deploy proceeds from its sustainability security to expand its lending capacity, with funds fully allocated to refinancing eligible green and social home loans under its March 2026 Sustainable Finance Framework. The proceeds are also expected to support growth in its loan book, which to Kshs 19.6 bn in 2025 from Kshs 11.9 bn in 2024, alongside other concessional funding sources. The issuance comes after KMRC previously delayed a capital markets return in 2024 due to a high interest rate environment that would have increased funding costs and constrained its affordable housing mandate.
The bond is expected to support the Real Estate sector by increasing funding for affordable, green, and social housing developments. KMRC plans to channel the funds into refinancing eligible housing loans, which may help developers and mortgage lenders access longer-term financing. The move also comes at a time when high borrowing costs had slowed activity in 2024 and threatened affordable housing delivery.
- Decline in apartment prices In Eastlands and Nairobi satellite towns
During the week, apartment prices in Eastlands and Nairobi’s satellite towns recorded a decline over the past three years, reflecting a widening imbalance between supply and demand as buyer preferences gradually shift. According to the Kenya National Bureau of Statistics, average apartment prices in the lower income segment fell to Kshs 8.5 mn from Kshs 9.0 mn in 2022. In contrast, standalone houses targeting the same income bracket recorded a 23% price increase over the period, indicating a clear shift in demand toward more spacious housing units.
The divergence in performance highlights a structural change in Nairobi’s residential property market, particularly in Eastlands and satellite locations where apartment supply has continued to expand. KNBS notes that unlike the steadily rising house price index, apartments have experienced sustained downward pressure, largely driven by oversupply and evolving lifestyle preferences. This has led to softer pricing power for developers focused on multi-unit housing, even as demand for standalone units strengthens.
Going forward, apartment prices are expected to remain under pressure in the near term as affordability constraints and cautious credit conditions continue to shape buyer behavior. However, a potential easing in interest rates, combined with gradual income recovery and a slowdown in new apartment completions, could support price stabilization over the medium term. Demand is likely to remain skewed toward standalone houses unless apartments adjust through improved pricing flexibility and stronger alignment with end user needs.
- Infrastructure Sector
- Kenya to spend Kshs 38.7 bn from state asset sale on JKIA expansion
During the week the Government of Kenya announced the expansion of Jomo Kenyatta International Airport (JKIA) through the National Infrastructure Fund. The government confirmed that Kshs 38.7 bn from the Kenya Pipeline Company (KPC) stake sale will be directed toward the project, forming part of a broader plan to mobilize funding for the estimated Kshs 193.7 bn airport upgrades. The fund is also expected to grow its seed capital base to Kshs 387.4 bn following proceeds from the Kenya Pipeline IPO and partial divestiture of Safaricom Plc, with the state contributing 20.0% of total project costs.
The funding strategy includes a mix of privatization proceeds, securitized revenue streams, and potential long-term borrowing backed by the passenger service levy, which is charged at USD 50.0 for international tickets and Kshs 600.0 for domestic travel. The levy is expected to contribute Kshs 18.5 bn toward supporting a bond structure for the airport expansion. The government has already enacted the National Infrastructure Fund framework, which ring fences privatization proceeds for infrastructure development, and has earmarked upgrades including terminal expansion, runway enhancement, and digital modernization of passenger processing systems. Earlier plans involving a concession with India’s Adani Group were cancelled, leading to renewed engagement with multilateral lenders such as the African Development Bank and other development finance institutions.
Going forward, the JKIA expansion is expected to proceed under a blended financing model combining public capital, securitized revenues, and private or development finance participation. Execution will likely focus on phased upgrades to minimize operational disruption while improving capacity, efficiency, and passenger experience at the airport. However, successful delivery will depend on timely mobilization of funding, effective project structuring, and sustained investor confidence in Kenya’s infrastructure pipeline.
Real Estate Investments Trusts
- TRIFIC Green USD I-REIT
During the week, Two Rivers Land Company SEZ Two Rivers Land Company launched the TRIFIC Green USD Income REIT, marking a notable development in Kenya’s capital markets through the introduction of a USD denominated, environmentally focused income REIT backed by institutional grade commercial real estate within the Two Rivers International Finance and Innovation Centre ecosystem. The REIT is being offered at a par value of USD 1 per unit, with 29,832,000 units available under the unrestricted offer and a minimum subscription of USD 1,000. The offer opened on 13 May 2026 and is set to close on 12th June 2026, with listing on the Nairobi Securities Exchange Nairobi Securities Exchange expected on 23rd June 2026. The offer targets a net USD dividend yield of 8.0%.
The structure, managed by Nabo Capital, allows both institutional and retail investors to access USD denominated real estate exposure, offering potential income, diversification benefits, and a hedge against local currency volatility and inflation pressures. Positioned within a Special Economic Zone framework, the REIT benefits from fiscal incentives aimed at enhancing Nairobi’s appeal as a regional hub for international business services and innovation. The North Tower, which is part of the underlying asset base, currently records occupancy of 92% driven by multinational service exporting tenants, supporting stable rental cash flows and reducing leasing risk.
Going forward, the REIT is expected to benefit from strong demand for USD income assets amid ongoing currency and inflation concerns, while its high occupancy levels provide near term visibility on distributions. Investor appetite will likely be supported by its defensive income profile and exposure to premium commercial office space within a SEZ backed ecosystem. However, sustained performance will depend on maintaining occupancy levels, tenant quality, and continued interest from both local and offshore investors in Kenya’s real estate backed capital market instruments.
- REITs Weekly Performance
On the Unquoted Securities Platform Acorn D-REIT and I-REIT traded at Kshs 29.6 and Kshs 23.8 per unit, respectively, as per the last updated data on 8th May 2026. The performance represented a 48.0% and 18.8% gain for the D-REIT and I-REIT, respectively, from the Kshs 20.0 inception price. The volumes traded for the D-REIT and I-REIT came in at 13.5 mn and 43.3 mn shares, respectively. Additionally, ILAM Fahari I-REIT traded at Kshs 13.8 per share as of 8th May 2026, representing a 31.0% loss from the Kshs 20.0 inception price. The volume traded to date came in at 1.2 mn shares for the I-REIT, REITs offer various benefits, such as tax exemptions, diversified portfolios, and stable long-term profits. However, the ongoing decline in the performance of Kenyan REITs and the restructuring of their business portfolios are hindering significant previous investments. Additional general challenges include:
- Insufficient understanding of the investment instrument among investors leading to a slower uptake of REIT products,
- Lengthy approval processes for REIT creation,
- High minimum capital requirements of Kshs 100.0 mn for REIT trustees compared to Kshs 10.0 mn for pension funds Trustees, essentially limiting the licensed REIT Trustee to banks only
- The rigidity of choice between either a D-REIT or and I-REIT forces managers to form two REITs, rather than having one Hybrid REIT that can allocate between development and income earning properties
- Limiting the type of legal entity that can form a REIT to only a trust company, as opposed to allowing other entities such as partnerships, and companies,
- We need to give time before REITS are required to list – they would be allowed to stay private for a few years before the requirement to list given that not all companies maybe comfortable with listing on day one, and,
- Minimum subscription amounts or offer parcels set at Kshs 0.1 mn for D-REITs and Kshs 5.0 mn for restricted I-REITs. The significant capital requirements still make REITs relatively inaccessible to smaller retail investors compared to other investment vehicles like unit trusts or government bonds, all of which continue to limit the performance of Kenyan REITs.
We expect the performance of Kenya’s Real Estate sector to remain resilient, supported by several factors: i) KMRC sustainability bond issue signaling increased liquidity particularly for sustainable housing projects ii) The expansion of the JKIA which will improve infrastructure and connectivity iii) The TRIFIC Green USD I-REIT which is expected to benefit from strong demand for USD income assets. However, challenges such as the decline in apartment prices in Eastlands and Nairobi’s satellite towns over the past three years and the weak investor appetite in listed REITs like ILAM Fahari I-REIT and high capital requirements will continue to constrain the sector’s optimal performance.
- Circle Internet Group Q1 2026 financial results:
During the week, Circle Internet Group, the issuer of USDC released its Q1 2026 financial results which highlighted a 28.0% YoY increase in USDC circulation to USD 77.0 bn from the USD 55.4 bn recorded in Q1 2025. USDC on-chain transaction volume also increased by 263.0% to USD 21,500 bn from the USD 5,923.0 bn recorded in Q1 2025.
|
Cytonn Report: Circle Q1’2026 Key Metrics |
|||
|
|
Q1’2025 |
Q1’2026 |
Change |
|
USDC in circulation |
59.7 |
77.0 |
29.0% |
|
USDC onchain transaction volume |
5,923.0 |
21,500.0 |
263.0% |
|
Total Revenue and Reserve Income |
578.6 |
694.1 |
20.0% |
|
Reserve return rate |
4.2% |
3.5% |
(66.0 bps) |
|
USDC minted |
52.9 |
73.0 |
38.0% |
|
USDC redeemed |
37.3 |
72.0 |
93.0% |
|
Stablecoin Market Share |
27.4% |
28.0% |
62.0 bps |
Source: Circle Internet Group Financial statements
Reserve assets return rate declined by 66.0 bps to 3.5% from the 4.2% recorded in Q1 2025. Circle’s stablecoin market share increased by 62.0 bps to 28.0% from the 27.4% recorded at the end of Q1 2025.Reserve Income grew by 17.0% to USD 652.5 mn from the USD 557.9 mn recorded in Q1 2026 mainly attributable to 39.0% increase in average USDC circulation which was however weighed down by the 66.0 bps decline in reserve assets return rate.
- The U.S. Senate Banking Committee released the full text of the Digital Markets Clarity Act.
The U.S. Senate Banking Committee released the full text of the Digital Markets Clarity Act. The bill was tabled for debate in the senate on 14th May 2026. Below are the key highlights of the bill;
- It introduces stablecoin restrictions on interest-like rewards, prohibiting yield payments that resemble bank deposit interest, while still allowing limited transaction-based incentives.
- The bill clarifies that tokenized securities remain under existing SEC jurisdiction, ensuring they are regulated like traditional securities.
- The legislation expands consumer protection rules, including stricter disclosure requirements and compliance standards for crypto platforms
- It includes provisions for studies and frameworks on DeFi risks, cybersecurity, and financial stability, signalling a forward-looking regulatory approach.
Overall, the Clarity Act marks a significant step toward establishing a structured and enforceable regulatory framework for the U.S. digital asset market. By clearly defining asset classifications, strengthening Anti-Money-Laundering (AML) and consumer protection requirements, and bringing crypto platforms closer to traditional financial oversight standards, the bill seeks to reduce regulatory uncertainty that has long constrained institutional participation. At the same time, provisions restricting yield-like incentives on stablecoins highlight a clear intent to preserve the boundary between payment instruments and bank-like deposit products. If enacted in its current form, the legislation is likely to accelerate institutional adoption while also reshaping business models across the stablecoin and broader crypto ecosystem.
- Mastercard and Yellow Card announced a partnership to advance stablecoin-based payment innovation across Eastern Europe, the Middle East, and Africa
Mastercard and Yellow Card announced a partnership to advance stablecoin-based payment innovation across Eastern Europe, the Middle East, and Africa (EEMEA), targeting use cases such as cross-border remittances, B2B payments, treasury operations, and digital value transfers. Under the collaboration, Yellow Card will provide its regulated stablecoin infrastructure and regional distribution network across African markets, while Mastercard will leverage its global payments infrastructure, compliance systems, and identity tools to enable secure and interoperable transactions. Initial focus markets include Ghana, Kenya, Nigeria, South Africa, and the United Arab Emirates.
In the Kenyan context, this partnership is likely to be a meaningful catalyst for mainstream stablecoin adoption, particularly by embedding digital dollar rails into existing regulated payment infrastructure. By combining Mastercard’s global network with Yellow Card’s local licensed stablecoin capabilities, the collaboration reduces one of the key barriers in Kenya’s market, trusted on- and off-ramps between fiat (Kshs) and stablecoins. This is expected to accelerate use cases such as lower-cost remittances, faster cross-border trade settlements, and improved liquidity management for SMEs and corporates operating in USD-linked transactions.
The most recent Nairobi Securities Exchange (NSE) Initial Public Offer (IPO) was in January 2026, when the Kenya Pipeline Company issued an IPO managing to raise Kshs 112.4 bn against the target of Kshs 106.3 bn, 105.7% success rate. This marked the end of an 11-year IPO drought at the bourse, with the previous IPO having been in 2015 when Stanlib Investments launched the first Real Estate Investment Trust (Fahari I-REIT) at the NSE. The issue raised Kshs 3.6 bn against a target of Kshs 12.5 bn, translating to a 28.8% subscription success rate. Currently, the bourse has 69 listed securities with a total market capitalization of Kshs 3.4 tn as at 15th May 2026. The bourse continues to be Safaricom-dominated, with Safaricom’s market capitalization of Kshs 1.2 tn equivalent to 35.3% of the entire market capitalization. Additionally, Safaricom (35.3%) and Banks (42.0%) make up 77.3% of the total bourse, leaving all other local sectors to share the remaining 22.7%, as of 15th May 2025. The Capital Markets Authority (CMA) raised concerns that Kenya has been unable to achieve its projected listings targets as articulated in its Capital Markets Master Plan released in 2016 which envisioned at least four listings on the NSE every year; by its own masterplan CMA is now behind by 28 listings. To cure for this, the President in September 2022 set a target of 10 listings in one year, however this has not been achieved as of 2026. The chart below highlights the composition of stocks at the Nairobi Securities Exchange;
Source: Cytonn Research, NSE
Given that a few large cap stocks, namely Safaricom PLC, Equity Group Holdings, KCB Group Ltd and EABL hold almost 55.5% of the total market capitalization, the market remains volatile, which presents a risk of a market collapse due to concentration risk.
It is important to note that capital markets development is crucial for the growth of the Kenyan economy for several reasons; Firstly, the capital markets increase the proportion of long-term savings (pensions, life covers, etc.) that is channeled to long-term investment. Capital markets enable the contractual savings industry (pension and provident funds, insurance companies, medical aid schemes, collective investment schemes, etc.) to mobilize long-term savings from small individual household and channel them into long-term investments. In this way, the capital markets enable corporations to raise funds to finance their investment in real assets. In addition, capital markets development increases the efficiency of capital allocation. Efficient capital allocation means that funds are allocated to the investment projects or firms that bring the most value to the economy; the marginal product of capital value is the highest.
Given the significant role that the capital markets play, we shall then focus on Unlocking Kenya’s Capital Markets as an advancement to our previous report. As such, we shall cover;
- Current State of the Nairobi Securities Exchange (NSE),
- Current State of other Components of the Kenya Capital Markets,
- Challenges facing Kenya’s Capital Markets, and,
- Recommendations and Conclusion.
Section I: Current state of the Nairobi Securities Exchange
A. The Structure of the Nairobi Securities Exchange
Based in Kenya, the Nairobi Securities Exchange is one of the leading securities exchanges in Africa. It was founded in 1954 in order to facilitate the trading of financial products through the provision of a trading platform for listed securities. The NSE was demutualized and listed in 2014 and it operates under the jurisdiction of the Capital Markets Authority (CMA) of Kenya and is charged with the responsibility of developing the securities market and regulating trading activities. In addition to developments covered in our previous report, below are the most recent ones:
- The Capital Markets Authority, On 23rd Juned 2025 announced the suspension in trading of Transcentury Plc and East African Cables Plc after the two companies were placed under receivership by Equity Bank over an unpaid debt of Kshs 4.7 bn
- NSE on 16th July 2025 announced the listing of Satrix MSCI World feeder ETF at a price of Kshs. 761 per unit. The Satrix MSCI World Equity Feeder ETF, listed on the Johannesburg Stock Exchange (JSE), is an index tracking fund registered as a Collective Investment Scheme. The mandate of the Satrix MSCI World Equity Feeder Portfolio ("Satrix MSCI World ETF") is to track, as closely as possible, the value of the MSCI World Index in ZAR.
- NSE on 24th July 2025 announced the listing of Shri Krishana by introduction. 50.5 million shares were offered at Kshs. 5.9 per share valuing the transaction at Kshs 298.0 mn
- Nairobi Securities Exchange (NSE) announced the introduction of single unit trading system effective 8th August 2025 which allowed the buying and selling of shares in single units. This milestone was part of NSE’s broader initiative to improve access to investment opportunities at the NSE. By enabling single-unit trading, the NSE provided greater flexibility for investors, reduced entry barriers, and encouraged wider participation, particularly from retail investors who have previously found it difficult to invest due to high minimum trade sizes.
- On October 1st 2025 NSE announced the launch of its Banking Sector Index, a market capitalization-weighted and float-adjusted benchmark designed to provide investors with a transparent and reliable measure of the performance of the banking sector.
- On 9th March 2026 the Kenya Pipeline Company (KPC) was officially listed on NSE through Initial Public Offer (IPO) after achieving a 105.7% oversubscription and raising approximately Kshs. 112.4 bn.
- We also expect the listing of 2nd Tranche of KMRC Medium Term Note and I&M Bank Medium Term Note if successfully subscribed.
Following the implementation of the Capital Markets (Public Offers, Listing and Disclosure) Regulations, 2023, the Nairobi Securities Exchange (NSE) officially restructured its market segmentation framework after receiving formal approval from the Capital Markets Authority (CMA).
The reclassification marked a significant regulatory milestone aimed at simplifying issuer obligations, enhancing investor clarity, and aligning the Exchange with international standards for capital markets structure. The table below show the reorganization under the new structure.
|
Old Structure |
New structure |
|
Main Investment Market Segment (MIMS) |
Retained and expanded to cover both equities and bonds |
|
Growth Enterprise Market Segment (GEMS) |
Merged into SME Market Segment |
|
Alternative Investment Market Segment (AIMS) |
Merged into SME Market Segment |
|
Fixed Income Securities Market Segment (FISMS) |
Integrated into either MIMS or SME FISMS based on issuer profile |
Source: Cytonn Research, NSE
The reclassified framework now comprises:
- Main Investment Market Segment (MIMS) – For established entities (both equity and fixed income)
- SME Market Segment – For small and medium-sized issuers, including equity and debt instruments
This restructuring is intended to:
- Streamline listing procedures by eliminating outdated or redundant market categories
- Improve issuer visibility through a simplified two-tier structure
- Enhance investor understanding of the risks and profiles associated with listed firms
- Encourage SME listings through a more inclusive and supportive regulatory framework
- Align Kenya’s capital markets with best practice standards, increasing regional and global competitiveness
The tables below show the market overview following the segment reclassification
Equities Market:
|
Segment |
Number of Issuers |
Notable Constituents |
|
MIMS |
57 |
Safaricom, Equity Group, EABL, KCB, BAT, Bamburi, EAPC |
|
SME |
9 |
Homeboyz Entertainment, Nairobi Business Ventures, Kurwitu Ventures |
Fixed Income Market:
|
Segment |
Number of Issuers |
Instruments |
|
MIMS (Bonds) |
4 |
Family Bank MTN, EABL MTN, KMRC MTN, Linzi 003 IABS |
|
SME FISMS |
1 |
Real People Kenya MTN |
*As of July 2025
B. Types and Requirements of Listings
Securities may be admitted to listing at the exchange through the following methods;
- Initial Public Offer (IPO): This is the most common type of listing. It involves a company issuing new shares while listing on the selected stock exchange that will result in a new set of shareholders from the public buying the shares at a specified share price, and hence the company raising capital from the exercise. Key notable examples include KPC IPO in 2026, NSE IPO in 2014 and the Safaricom IPO in 2008
- Listing by Introduction: This type of listing occurs when a company takes its existing shares and lists them on an exchange. Since only existing shares are listed by introduction, it follows that no new shares will be issued and no additional funds will be raised. This type of listing only provides the company with a regulated environment within which to operate and a platform to trade shares with public investors in the capital markets. The recent listing by introductions at the bourse was the listing of the Local Authority Pension Trust (LAPTRUST) Imara Income Real Estate Investment Trust (I-REIT) under the Restricted Sub-Segment in December 2022. LAPTRUST held 100.0% of the Imara I-REIT shares with no initial offer to the public,
- Cross Listing: This occurs when a company that is already listed on one stock exchange decides to list on another stock exchange other than its primary or original exchange. Cross-listing is advantageous in that it gives the listed company a larger scope of access to capital from different jurisdictions and different investors. No new shares are issued. Atlas managed the first cross-listing between the London Stock Exchange and the NSE raising Kshs 450.0 mn, by offering 10% of its 393.9 mn total issued shares for cross-listing on the NSE at a price per share of Kshs 11.5 with a minimum subscription of Kshs 1.0 mn per investor, and,
- Reverse Listing: This is a rare kind of listing strategy also referred to as back door listing where a company that is not listed on any exchange purchases a listed company and becomes automatically listed by virtue of this transaction. It is common when a company that wants to have access to the capital markets also wants to avoid the time and cost spent in a regular listing. The listing of I&M Bank for instance, was through the reverse acquisition of City Trust Limited (CTL) in 2013.
As above mentioned, the NSE is categorized into different market segments approved by CMA. The segments as stipulated have different eligibility, trading restrictions, and disclosure requirements, prescribed by CMA that companies planning to publicly offer shares through listing have to abide by. Below is a summary of those requirements:
|
Cytonn Report: Requirements for Public offering of shares and listing |
|||
|
Requirement |
Criteria for the Main Investment Market Segment (MIMS) |
Criteria for The Alternative Investment Market Segment (AIMS) |
Criteria for the Growth Enterprise Market Segment (GEMS) |
|
Incorporation status |
It should be a public company limited by shares and registered under the Companies Act |
||
|
Share Capital |
The issuer should have a minimum of Kshs 50.0 mn of authorized issued and fully paid up ordinary share capital |
The issuer should have a minimum of Kshs 20.0 mn of authorized issued and fully paid up ordinary share capital |
The issuer should have a minimum authorized and fully paid up ordinary share capital of Kshs 10.0 mn and must have not less than 100,000 shares in issue |
|
Net Assets |
Net assets immediately before the public offering or listing of shares should not be less than Kshs 100.0 mn. |
Net assets immediately before the public offering or listing of shares should not be less than Kshs 20.0 mn |
N/A |
|
Free Transferability of Shares |
Shares to be listed should be freely transferable and not subject to any restrictions on marketability or any pre-emptive rights |
||
|
Availability and Reliability of Financial records |
The issuer should have audited financial statements complying with IFRS for an accounting period ending on a date not more than 4-months prior to the proposed date of the offer or listing for issuers whose securities are not listed at the securities exchange, and 6-months for issuers whose securities are listed at the securities exchange. The Issuer must have prepared financial statements for the latest accounting period on a going concern basis and the audit report must not contain any emphasis of matter or qualification in this regard |
N/A |
|
|
Solvency and adequacy of working capital |
The issuer should not be insolvent and should have adequate working capital |
The issuer should not be insolvent and should have adequate Working capital. The Directors of the Issuer shall also give an opinion on the adequacy of working capital for at least 12 months immediately following the share offering, and the auditors of the issuer shall confirm in writing the adequacy of that capital. |
|
|
Share Ownership Structure |
Following the public share offering or immediately prior to listing in the case of an introduction at least 25.0% of the shares must be held by not less than 1,000 shareholders excluding employees of the issuer. In the case of a listing by introduction, the issuer shall ensure that the existing shareholders, associated persons or such other group of controlling shareholders who have influence over management shall give an undertaking not to sell their shareholding before the expiry of a period of 24 months following listing and such undertaking shall be disclosed in the Information Memorandum |
Following the public share offering or immediately prior to listing in the case of an introduction, at least 20.0% of the shares must be held by not less than 100 shareholders excluding employees of the issuer or family members of the controlling shareholders. No investor shall also hold more than 3.0% of the 20.0% shareholding. The issuer must ensure that the existing shareholders, associated persons or such other group of controlling shareholders who have influence over management shall give an undertaking to the Authority not to sell their shareholding before the expiry of a period of 24 months following listing and such undertaking shall be disclosed in the Information Memorandum. |
The Issuer must ensure at least 15.0% of the issued shares, (excluding those held by a controlling shareholder or people associated or acting in concert with him; or the Company's Senior Managers) are available for trade by the public. An issuer shall cease to be eligible for listing upon the expiry of 3 months of the listing date, if the securities available for trade by the public are held by less than 25 shareholders (excluding those held by a controlling shareholder or people associated or acting in concert with him, or the Company's Senior Managers) The issuer must ensure that the existing shareholders, associated persons or such other group of controlling shareholders, who have influence over management, shall give an undertaking in terms agreeable to the Authority, and the Securities Exchange restricting the sale of part or the whole of their shareholding before the expiry of a period of 24 months following listing. |
|
Track record, profitability and future prospects |
The issuer must have declared profits after tax attributable to shareholders in at least three of the last five completed accounting periods to the date of the offer |
The issuer must have been in existence in the same line of business for a minimum of two years one of which should reflect a profit with good growth Potential. |
N/A |
|
Dividend policy |
The issuer must have a clear future dividend policy. |
N/A |
|
Source: NSE
C. Reasons for the low number of listings
This year, Kenya completed the KPC IPO bringing an end to an 11 year drought since the last time it recorded an IPO was in 2015 when Stanlib investments issued an IPO of the first Real Estate Investment Trust (Fahari I-REIT) at the bourse, which raised Kshs 3.6 bn against the target of Kshs 12.5 bn. Key to note that even though the KPC IPO was finally oversubscribed, at the end of the initial offer date it was undersubscribed forcing extension of the offer. Some of the key issues we believe the Authority needs to undertake in order to attract more IPOs are as follows:
- Shallow market: The Nairobi Securities Market is regarded as a shallow market since it only offers few instruments and limited liquidity, leaving firms with minimal financing options. The strength of securities markets that make them crucial in the growth of an economy, is their capacity to mobilize long-term savings for financing long-term projects and encourage broader ownership of firms. The intermittent trading of only a few stocks held by a small number of investors makes the NSE less efficient. In comparison to other nations like South Africa, which has a total of 274 listed companies, NSE still lags behind having only 65 listed companies. Moreover, the market still lags behind in terms of liquidity due to overreliance on a few stocks thus discouraging listing as companies with the potential to list stay away out of fear of having failed IPOs,
- Rigid regulatory framework: The regulatory structure in Kenya’s capital market has been a key impediment to the penetration of capital market products as well as the introduction of new IPOs. The current regulations governing the capital markets securities, public offers, listing, and disclosure is the Capital Markets Regulations Act 2002 do not meet the needs of the ever-evolving market. However, the authority announced that is fast-tracking reforms to update the regulations and has issued the Draft Public Offers, Listing and Disclosures seeking to address emerging issues and market dynamics in order to provide a more enabling environment in the Kenya’s Capital Markets that will spur more listings in the Nairobi Securities Exchange. Moreover, costs associated with compliance with the regulatory and corporate governance framework requirements have been a barrier to potential companies going public. Additionally, most potential companies are reluctant to list since compliance with some of the regulations exposes the company to the public realm which they regard as a loss of competitive advantage,
- The rise of Private Equity firms providing easily accessible capital: Kenya’s private equity sector has been thriving, with raising capital through private equity companies on the upswing, making companies shy from listing due to the readily available capital. According to the 2025 African Private Capital Activity Report, total volumes of private capital deals in Africa in 2024 rose by 9.2% to 530 from 485 in 2024, demonstrating the resilience and growth of private equity in the continent at large. Private equity funding is more appealing than public floatation for many companies primarily because it allows companies to stay private as they continue to finance their businesses for expansion thus preserving the kind of decision-making power of its shareholders that is typically lost when businesses seek public listing,
- Perceived high cost of listing: Most small and medium-sized companies shy from listing shares due to the perceived high direct cost in particular the annual listing fees of 0.06% of the market capitalization subject to a minimum of Kshs 200,000.0 and a maximum of Kshs. 1,500,000.0. Additionally, due to a lack of awareness, the small and medium-sized enterprises which are dominant in the Kenyan economy, depend mainly on bank loans despite raising capital through the capital markets being cheaper. According to a study by the CMA, the percentage cost of floating securities in the capital markets is comparatively lower than bank lending rates. Moreover, IPO costs have ranged from 1.9% to 10.6% from 2012-2016, with the floatation of Eveready at 10.6% being the highest while Deacons in 2016 at 1.9% being the lowest, compared to bank lending rates averaging at 15.1% as of February 2025 according to CBK. Additionally, compared to bank loans, which are annual costs over the tenure of the relevant loans, the cost of floatation is a one-off cost,
- Size of companies: The Kenya economy is dominated by small and medium-sized companies, the perception that mature companies are the ones that are in good position to issue IPOs makes the small and medium-sized companies reluctant to list for fear of having unsuccessful IPOs. This is an indication that startup companies are not growing enough to the capacity that would make them attractive to investors during IPOs which is the main reason the informal sector still dominates the economy, and,
- Loss of control: Many companies particularly those that are family-owned or closely held are reluctant to list due to fear of dilution of ownership as well as losing their voting control. The companies typically rely on bank finance to raise additional capital when required. Additionally, most companies avoid going public due to constant pressure from public shareholders. Unlike the original owners, public shareholders usually take a short-term position and they are more concerned with seeing constant rises in the stock's price so they can sell their shares for a profit.
D. Performance of the Nairobi Securities Exchange
The Kenya's stock market experienced a notable turnaround in 2025, with the market witnessing a substantial gain of 49.3% in its all-share index (NASI) to 185.9 in December 2025 compared to the 124.6 recorded in December 2024. This gain was attributed to factors such as alleviated inflationary pressures with the average inflation for 2025 coming in 4.1%, 0.6% points lower than the 4.7% average in 2024, coupled with the 22.9 bps appreciation of the local currency which was slower compared to the 17.6% appreciation in 2024.
In 2026 YTD, NASI has gained by 9.8% to 205.6 from the 187.25 recorded on 2nd January 2026. This is attributable to gains recorded by large cap stocks such as Stanbic, Coop and DTB of 48.9%, 36.0% and 30.1%. Going forward, however, the escalation of conflict in the Middle East could introduce downside risks to the NSE outlook through higher global oil prices, renewed inflationary pressures and weaker foreign investor sentiment, potentially moderating the market’s bullish momentum
The chart below shows the performance trend of the Nairobi All Share Index over the last 5 years;
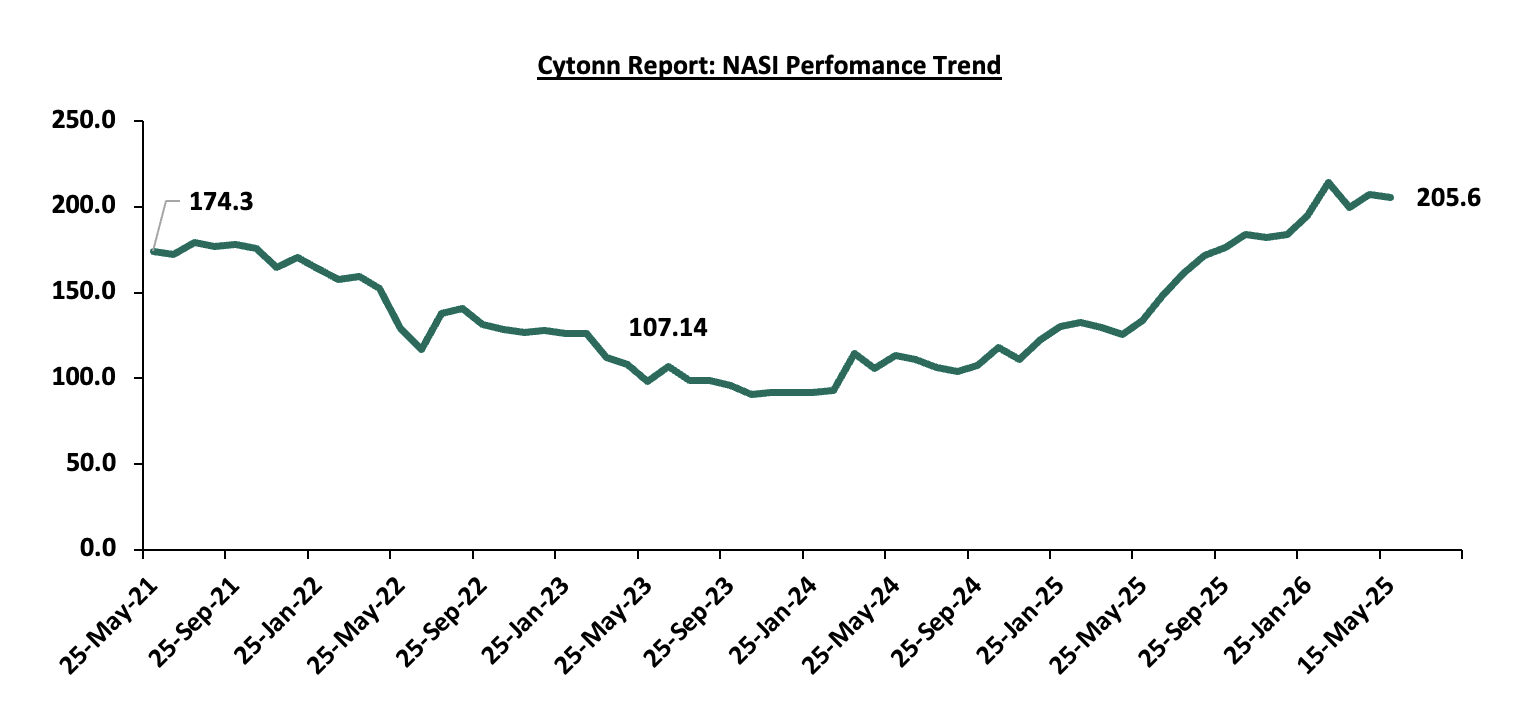
All these combined led to improved foreign inflows into Kenya’s domestic equities markets as investors were drawn by the improved investment opportunities. The improved macroeconomic outlook boosted investor confidence and positioned the market as an appealing frontier for capital allocation. Despite this, foreign investors remained net sellers for a fifth consecutive year with the net selling position however increasing significantly by 433.1% to USD 92.9 bn in 2025 from a net selling position of USD 17.4 bn recorded in 2024. This is because their investment decisions are influenced more by global capital allocation trends, liquidity considerations, and risk perception than by domestic improvements alone. Many international investors continue to favor higher-yielding or more liquid developed and emerging markets amid elevated U.S. interest rates, while Kenya’s frontier market status, relatively shallow market liquidity, and lingering concerns over public debt sustainability and fiscal pressures continue to weigh on sentiment. The chart below shows the net activity foreign positions over the last 5 years and 2026 YTD:
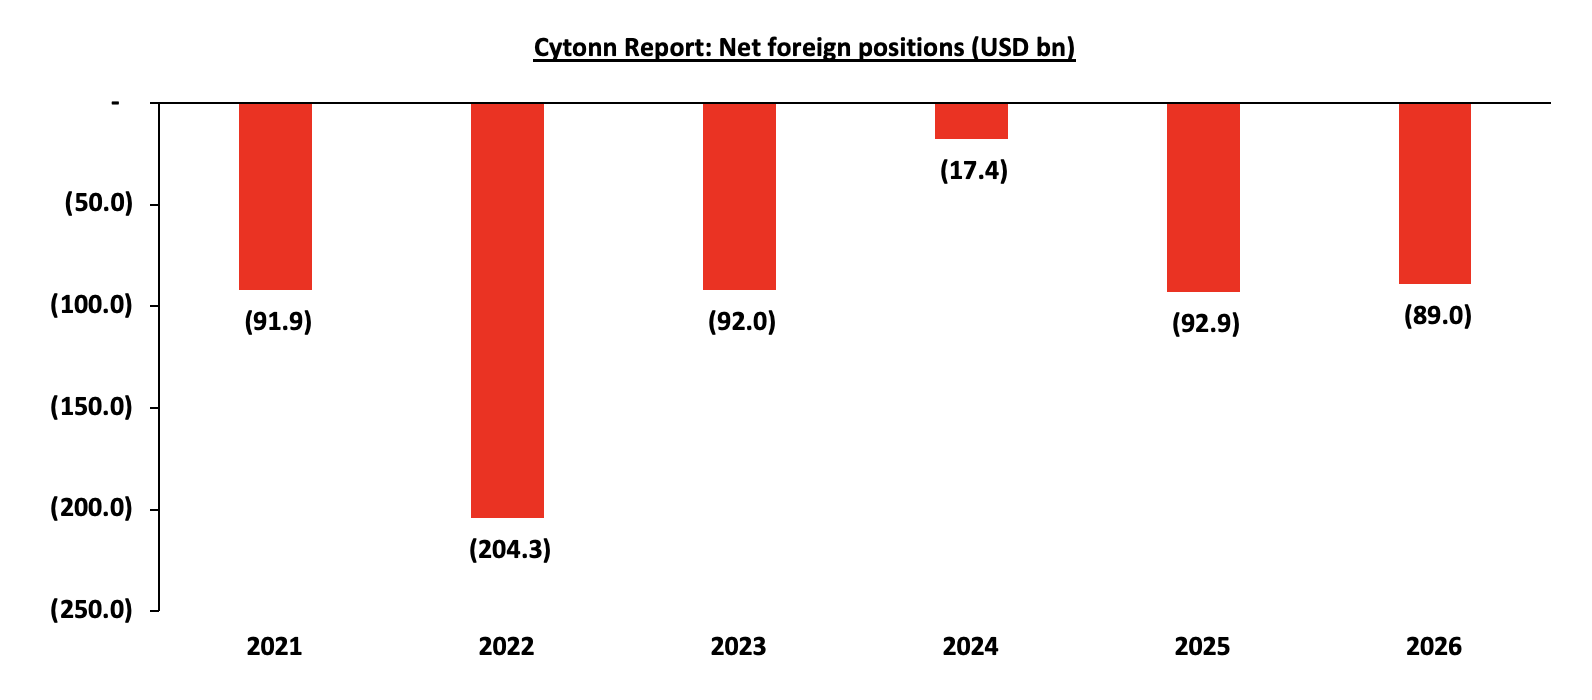
*2026 figure as of 14th May 2026
The performance of Kenya's stock market relies significantly on a select group of key players, notably Safaricom, the nation's leading telecommunications company. Safaricom, a magnet for foreign investors, constitutes a substantial 34.3% of the index as of 15th May 2025.
Section II: Current State of Other Components of Kenya’s Capital Markets
A. Real Estate Investment Trusts (REITS)
Real Estate Investment Trusts (REITs) serve as pooled investment vehicles enabling individuals to invest in real estate ventures by purchasing units within a trust. Kenya adopted REIT frameworks in 2013, following the footsteps of Ghana and Nigeria, which implemented similar structures earlier.
However, the Kenyan REIT market has struggled to gain momentum since its inception due to several challenges. These obstacles include stringent requirements for trustees, which demand significant capital of Kshs 100.0 mn, limiting participation primarily to banks. Additionally, the process for REIT approval is protracted, and the minimum investment threshold of Kshs 5.0 mn acts as a deterrent for potential investors. Furthermore, there is a lack of awareness and understanding among investors regarding this financial asset class. Consequently, Kenya's REIT market capitalization remains notably lower compared to its counterparts in other regions. The underdeveloped capital markets in Kenya has continually failed to provide alternative means of financing Real Estate developments. Due to this, most property developers rely on conventional sources of funding such as banks, compared to other developed countries. As a result, Kenya’s REIT Market Capitalization to GDP has remained significantly low at 0.2%, compared to other countries such as South Africa with 4.7%, as shown below;
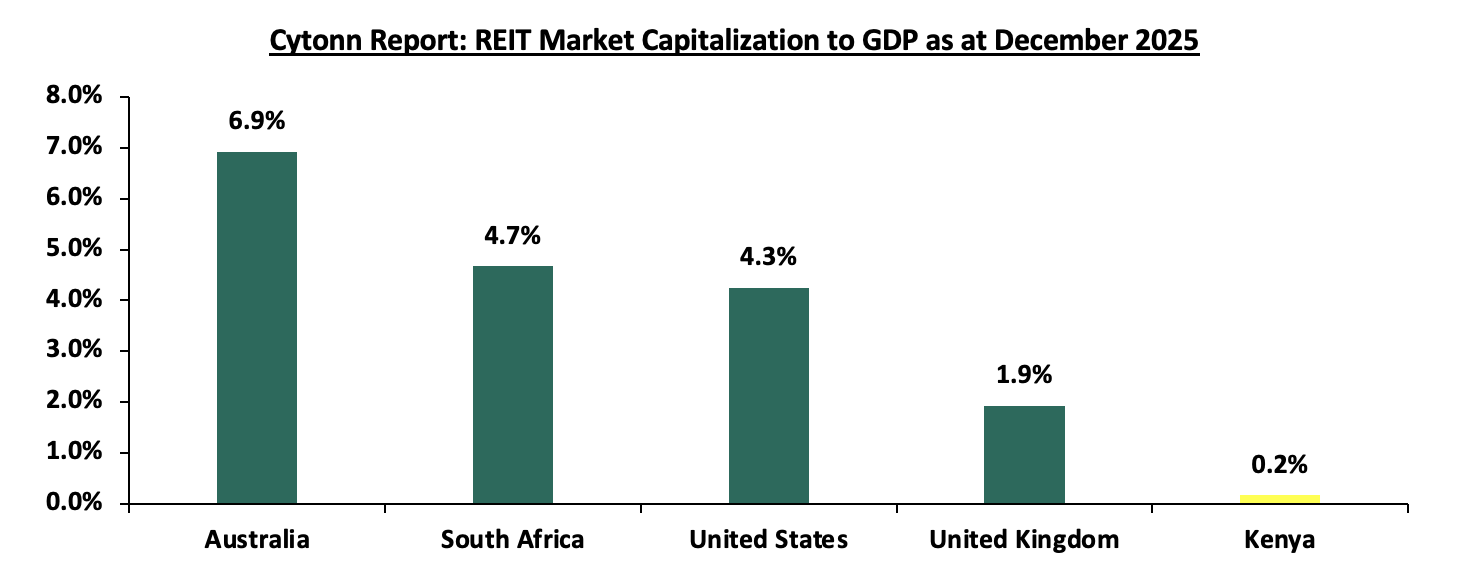
Source: European Public Real Estate Association (EPRA), World Bank, Cytonn Research
Most property developers in Kenya continue to rely on traditional funding sources, such as banks, unlike in more developed markets. Since the establishment of REIT regulations, four REITs have been approved in Kenya, all structured as closed-ended funds with a fixed number of shares. However, none of these REITs are actively trading on the Main Investment Market Segment of the Nairobi Securities Exchange (NSE). The ALP Industrial REIT was approved for listing on March 11th 2026 becoming East Africa’s first Industrial and logistics REIT. It joined the LAPTrust Imara I-REIT is the only listed REITs in the country, quoted on the restricted market sub-segment of the NSE's Main Investment Market. It is important to note that Imara did not raise funds upon listing. The ILAM Fahari I-REIT, Acorn I-REIT and D-REIT are not listed but trade on the Unquoted Securities Platform (USP), an over-the-counter market segment of the NSE. Two Rivers Land Company (SEZ) has also established the TRIFIC Green USD Income REIT (I-REIT) with a targeted dividend yield of 8.0% and expected to be listed on NSE on 23rd June 2026.
The table below outlines all REITs authorized by the Capital Markets Authority (CMA) in Kenya:
|
Cytonn Report: Authorized REITs in Kenya |
||||||
|
# |
Issuer |
Name |
Type of REIT |
Listing Date |
Market Segment |
Status |
|
1 |
ICEA Lion Asset Management (ILAM) |
Fahari |
I-REIT |
July 2024 |
Unquoted Securities Platform (USP) |
Trading |
|
2 |
Acorn Holdings Limited |
Acorn Student Accommodation (ASA) – Acorn ASA |
I-REIT |
February 2021 |
Unquoted Securities Platform (USP) |
Trading |
|
3 |
Acorn Holdings Limited |
Acorn Student Accommodation (ASA) – Acorn ASA |
D-REIT |
February 2021 |
Unquoted Securities Platform (USP) |
Trading |
|
4 |
Local Authorities Pension Trust (LAPTrust) |
Imara |
I-REIT |
March 2023 |
Restricted Market Sub-Segment of the Main Investment Market |
Restricted |
|
5 |
ALP Industrial REIT |
Africa Logistics Park |
I-REIT |
March 2026 |
Restricted Market Sub-Segment of the Main Investment Market |
Restricted |
Source: Nairobi Securities Exchange, CMA
B. Secondary Bond Market
Activity in Kenya's secondary bond market improved significantly in 2025 with secondary bond turnover increasing by 68.4% to Kshs 2,536.4 bn from Kshs 1,505.9 bn in 2024, attributable to increased investor appetite for fixed income securities driven by the high interest rates. So far in 2026 activity in Kenya’s secondary bond market has been on an upward trajectory recording a 48.2% growth in Q1’2026 to Kshs 989.5 bn, from Kshs 667.8 bn in Q1’2025. The growth in activity can be attributed to increased market liquidity, as investor lock in the attractive rates in anticipation of further rate cuts as the yield curve normalizes. The charts below show the secondary market bond turnover and the yields on Kenya’s 10-year Government bond;
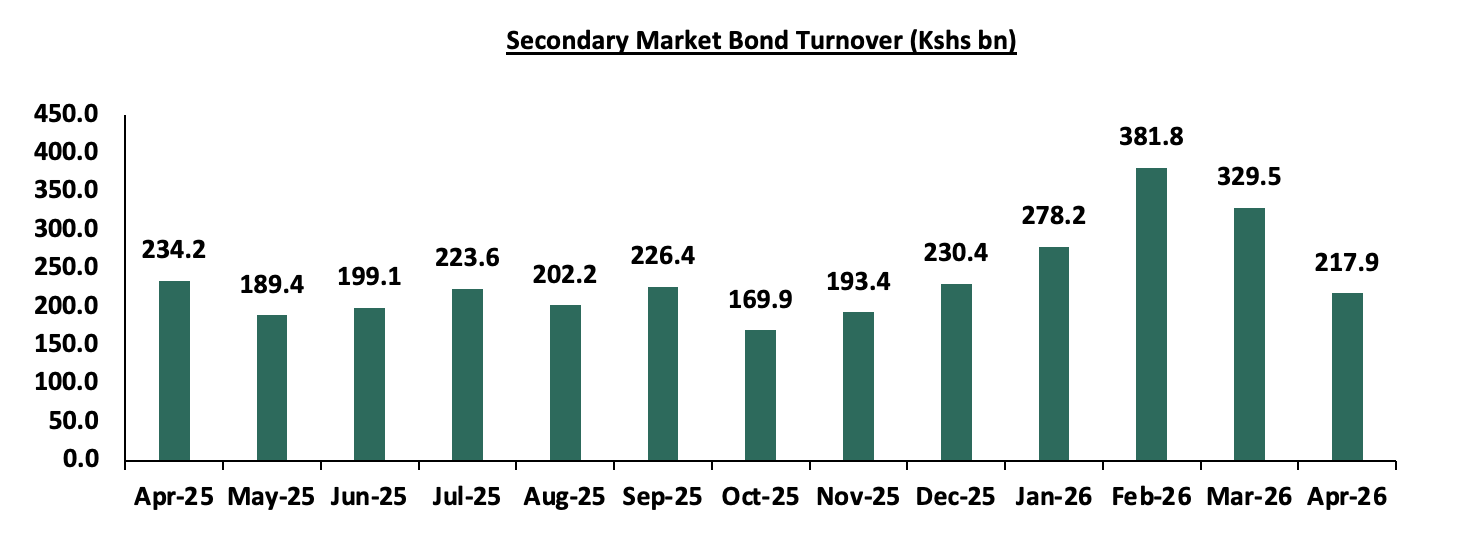
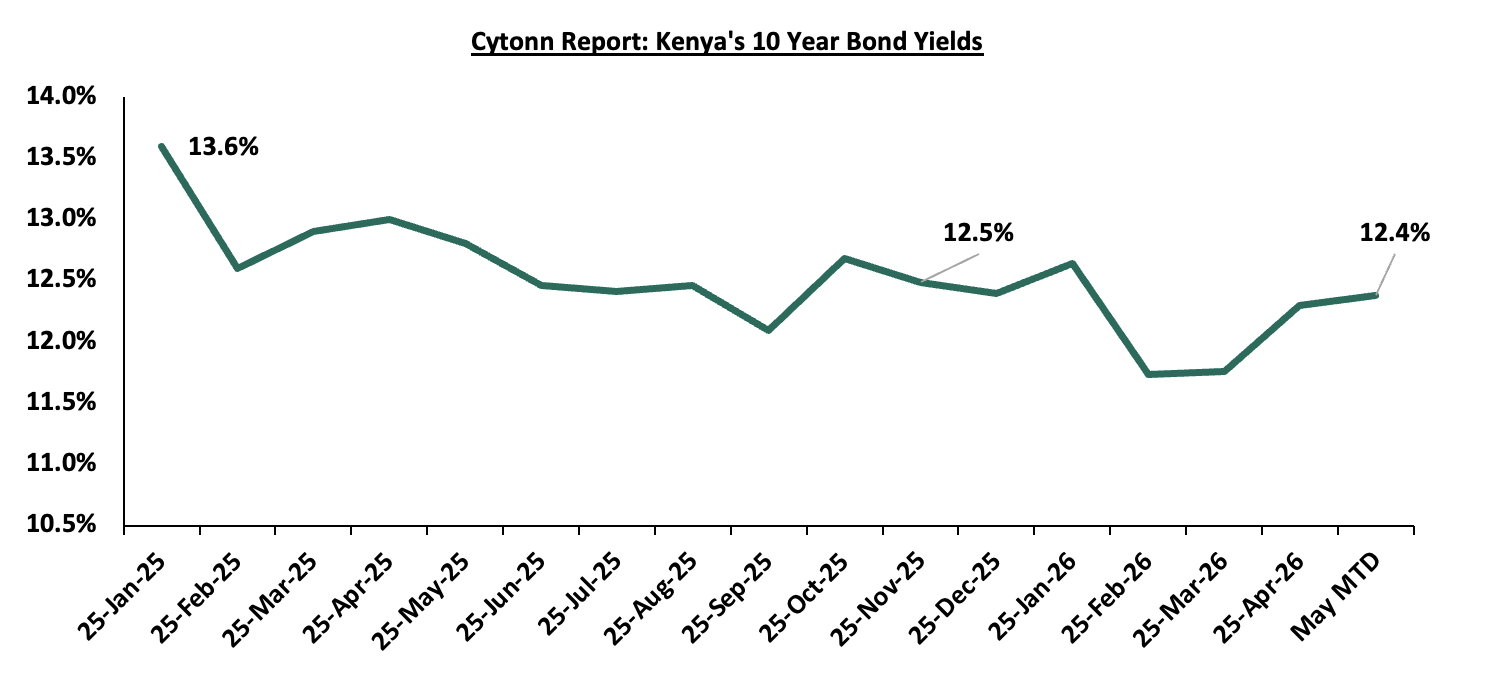
Source: NSE
This decline in yields reflects a significant shift in investor sentiment driven by successful debt management strategies through moves aimed at smoothing out the country's debt maturity profile and reduce refinancing risks. Additionally, the stronger Shilling, the stable inflation and improved foreign exchange reserves have collectively enhanced investor confidence, reducing the risk premium associated with Kenyan sovereign assets. Key to note is that currently there is renewed upward pressure on yields which might be caused by elevated government borrowing requirements alongside lingering inflation expectations caused by the increasing global fuel prices as a result of the Middle East war.
Section III: Challenges Facing Kenya’s Capital Markets
Despite the major advancements in the Kenya capital markets, Kenya still lags behind the capital markets of developed countries. This is evidenced by the low Kenya’s Mutual Funds/UTFs to GDP ratio that came in at 4.7% at the end of FY’2025, significantly lower compared to an average of 50.7% amongst select global markets an indication of a need to continue enhancing our capital markets. Additionally, Sub-Saharan African countries such as South Africa and Namibia have higher mutual funds to GDP ratios coming in at 61.5% and 43.1%, respectively as at end of 2020, compared to Kenya. The chart below shows select countries’ mutual funds as a percentage of GDP:
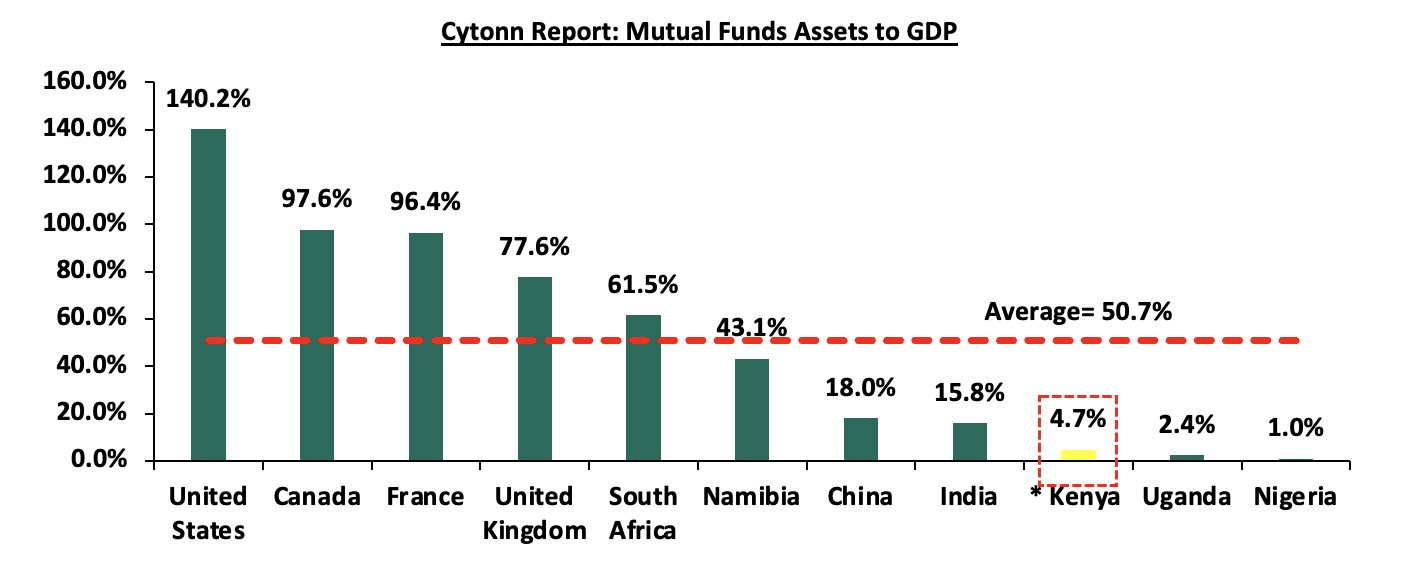
*Data as of December 2025
Source: World Bank Data
Some of the barriers that hinder the growth of the capital markets in Kenya include:
- Restrictive regulatory framework - The current regulatory framework governing capital market securities, public offers, listing, and disclosure is established by the Capital Markets Regulations Act of 2002. However, it fails to adequately cater to the evolving needs of the market. In response, the regulatory authority has announced plans to expedite reforms aimed at updating these regulations. A Draft Public Offers, Listing, and Disclosures was issued to address emerging issues and market dynamics, with the goal of creating a more conducive environment for Kenya's Capital Markets. The objective is to encourage more listings on the Nairobi Securities Exchange. Additionally, the costs associated with compliance to regulatory and corporate governance requirements have posed a significant barrier for potential companies considering going public. Moreover, many potential companies are hesitant to list due to concerns that compliance with certain regulations could expose them to public scrutiny, potentially undermining their competitive advantage,
- Unfavorable conditions for Private Offers - Unregulated markets operate under agreements between participating parties and thus lack oversight from a specific regulator. However, the offering process typically adheres to defined rules and guidelines. Regrettably, the expansion of unregulated products in Kenya's capital markets remains restricted due to the absence of regulatory backing. This situation has perpetuated the misconception that private offers pose safety risks, discouraging investor participation and constraining businesses from utilizing private offers to secure funds,
- Dependence on Banks for Funding over Capital Markets - In developed economies, the majority of businesses secure funding through capital markets, where capital market financing comprises 60.0%, while funding via banks stands at 40.0%. However, in Kenya, the situation is reversed, with capital markets contributing only 5.0%, while banks account for 95.0%. Beyond the statistical data, there is a perception that banks, rather than capital markets, dictate the economic agenda, leading to an imbalance in their respective roles in driving economic growth. Additionally, inadequate knowledge among some investors and general public has led to less participation in the capital market and overreliance on bank funding,
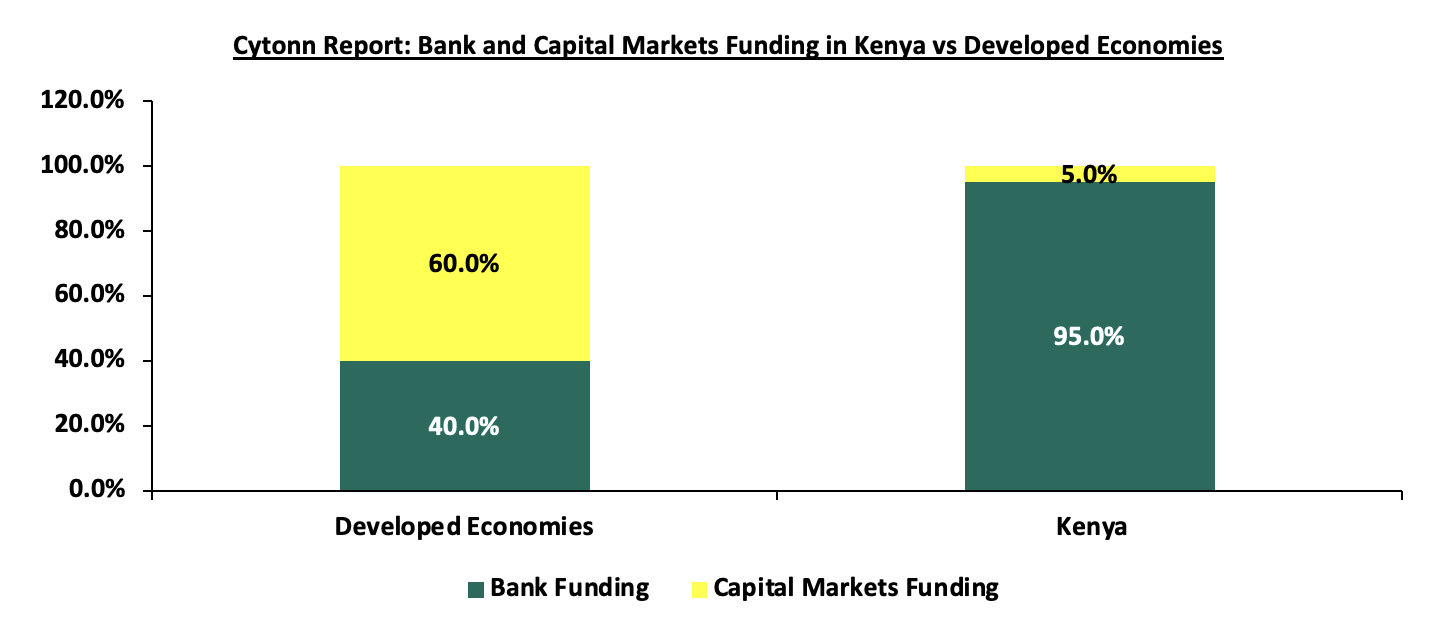
Source: World Bank
- Low Investor Participation - Despite efforts to promote investor education and awareness, there remains a significant portion of the population that is not engaged in the capital markets. Factors such as low financial literacy levels, cultural attitudes towards investment, and a preference for traditional savings methods contribute to this issue,
- Challenges in the approval process for issuers and market participants - The expenses and intricacies involved in obtaining approval for issuing securities on the Nairobi Securities Exchange (NSE) have deterred potential issuers from participating in the capital market. The lack of clear process of adherence to the approval framework, creates delays and affects growth of the market. This is evident from the fact that only 62 companies have been listed on the NSE since its official declaration, and,
- Previous corporate failures - Certain investors have experienced financial losses in the capital markets previously. This has resulted in a negative perception of the market for some, making it challenging for them to engage in new offerings should they arise.
Section IV: Recommendations and Conclusion
From the issues identified, we are of the view that the following should be done to facilitate growth in the number of new listings as well as development of Kenya’s Capital Markets:
- Remove Specific Obstacles to Capital Formation from Capital Markets: Under-developed capital markets make it harder to develop pools of capital focused on projects, particularly in the private markets, to complement efforts by the government. In Kenya, the main source of funding for real estate developers is banks which provide close to 99.0% of funding as compared to 40.0% in developed countries. This implies that capital markets contribute a mere 1.0% of real estate funding, compared to 60.0% in developed countries. To increase funding from capital markets, we will need to open our capital markets from the current restrictive rules and regulations, which serve to constrain capital markets development. Specifically, we need to;
- Enable Unit Trust funds to have as many bank custodians as necessary to serve their clients,
- Reduce the minimum investment required for development REITs from the current Kshs 5.0 mn, which is too high given the current median income of just Kshs 50,000 per month,
- Expand room for private offers to increase the diversity of funding available in the market,
- Allow for specialized collective investment schemes so that investors can invest in funds focused on housing, as current rules only allow up to 25.0% investment into one asset class, and,
- Reduce the capital requirements for a REIT Trustee from Kshs 100.0 mn, which has limited the REIT trustees to less than 4 players.
- Fast track Privatization of State-Owned Enterprises: In October 2023, the government published the privatization act of 2023 which sought to address the long processes of approval of State-Owned Entities (SOEs) for privatization and provide a new framework for the process. The act was declared unconstitutional by the high court last year a decision that was upheld by the court of appeal. The repeated legal setbacks highlight the need for a more robust and constitutionally sound approach to reforming the privatization process.
- Mode of appointment of the Chief Executive Officer of the Capital Markets Authority: The current CMA Act states that the CEO shall be appointed by the Minister and shall hold office on such terms and conditions of service as may be specified in the Act. Given the importance of the capital markets and its role in supporting the growth of the economy, the appointment should be done by the President with the approval of the Parliament, similar to how the Central Bank of Kenya (CBK)’s Governor is appointed. Additionally, the Parliamentary vetting process will promote transparency as the capital markets players, investors and Kenyans in general will be able to participate in the appointment,
- Promote investment in Small and Medium Sized companies with growth potential: Following the increasing number of Small and Medium Sized companies, financing them through the securities exchange is key to the growth of an economy. However, the challenge usually arises in onboarding investors who are willing to take the risk in these types of companies given some of them have low-profit history while others are less liquid. However, some of the ways that can be used to promote and expand small and medium-sized enterprises, include the introduction of tax incentives for investors willing to invest in small and medium-sized companies to facilitate financing and boost liquidity and growth,
- Investor compensation levy for CIS and REITs: Investor compensation levy for CIS and REITs: An Investor Protection Fund, in relation to a financial market, is a fund consisting of contributions made by the market participants or financial levies by the market’s regulators. Its main purpose is to ensure the protection of investors' investments against the loss sustained or adverse impact of the breach on the person or persons claiming compensation or restitution. The solution is to stimulate capital markets as a complementary alternative to banking markets, and hence the intended revision of the current CIS regulations has come at an opportune time,
- Market Transparency: The degree to which markets are transparent affects investors' decision making. Transparency of trading allows efficient price setting and thus increases confidence in the market. Therefore, it is key for the regulator to enforce measures that raise the level of transparency in the market in order to make it more attractive to investors. This will help to boost its liquidity and consequently attract potential companies who are reluctant to go public due to the inefficiency in the market,
- Create a Culture of Participation in the Stock Market: It is essential to disseminate knowledge of having a candid stock market through a listing of more companies in order to broaden the financial markets. This can be implemented by having a specific day in a calendar for financial education where the general public is educated on the importance of investment and financial culture,
- Improve Tax Incentives for New Listings: The authority needs to develop measures that are favourable to going public that will enable it to attract more companies and have a powerful and more developed securities market. In order to attract more listings, the authority needs to improve its tax treatments for dividends as well as capital gains,
- Train and offer Independent and free assessment to companies: In order to attract more listings, the authority needs to offer training on matters of financial transparency, sustainability, and corporate governance to potential companies as well as offer free assessment in order to help them position themselves for transitioning to the public markets, and,
- Simplify regulations and make it easier to access listing at the securities exchange market: The simplification of obtaining listing can encourage companies to go for listing at the stock market and take advantage of public finance in the market to gain size and boost growth than private financing through risk or venture capital. The general cost of listing should also be reduced in order to make it more favourable and appealing for IPOs.
We firmly believe that the implementation of these recommendations will not only address the current challenges hindering capital market growth but also pave the way for a more vibrant and resilient financial ecosystem. Additionally, they will help increase the market efficiency and consequently boost investors’ confidence. Having an active capital market is paramount for fostering economic growth, driving innovation, and enhancing financial stability. Vibrant Capital Markets are also key to attracting SMEs to the capital markets structure, given that they form the bulk of businesses in Kenya.
Disclaimer: The views expressed in this publication are those of the writers where particulars are not warranted. This publication is meant for general information only and is not a warranty, representation, advice or solicitation of any nature. Readers are advised in all circumstances to seek the advice of a registered investment advisor.

- Talk to us
- Kenya
- P.O Box 20695 - 00200, Nairobi, Kenya
- Cell +254709101200
- Tel +254709101200
- WhatsApp +254741676635
- United States
- +254709101200
- DOWNLOAD OUR APP
-


- Kenya
- 8th Floor, Pinetree Plaza, Kaburu Drive, Ngong Road, Nairobi, Kenya
- USA
- Suite 1150, 1775 Eye Street NW, USA, Washington DC 20006, USA
- Investments
- High Yield
- Private Equity
- Real Estate
- Real Estate
- RiverRun Estates
- Cytonn Towers
- The Ridge
- Taraji Heights
- The Alma