Unlocking Kenya’s Capital Markets, & Cytonn Weekly #17/2024
By Research Team, Apr 28, 2024
Executive Summary
Fixed Income
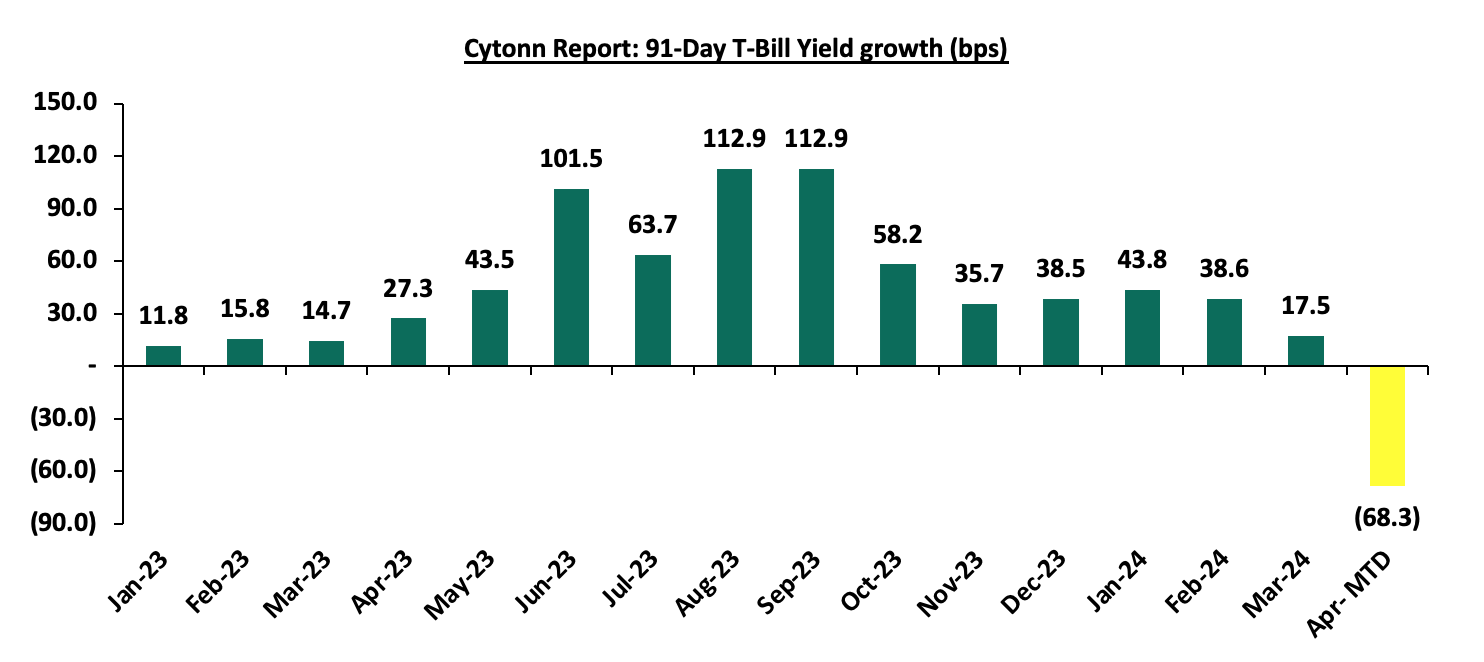
During the week, T-bills were undersubscribed for the first time in four weeks, with the overall undersubscription rate coming in at 98.2%, a reversal from the oversubscription rate of 108.7% recorded the previous week. Investors’ preference for the shorter 91-day paper persisted, with the paper receiving bids worth Kshs 6.0 bn against the offered Kshs 4.0 bn, translating to an oversubscription rate of 149.6%, slightly lower than the oversubscription rate of 150.1% recorded the previous week. The subscription rates for the 182-day paper and 364-day paper decreased to 69.3% and 106.4% respectively, from 78.1% and 122.7% respectively recorded the previous week. The government accepted a total of Kshs 23.3 bn worth of bids out of Kshs 23.6 bn of bids received, translating to an acceptance rate of 98.9%. The yields on the government papers recorded mixed performances, with the yield on the 91-day paper increasing marginally by 2.0 bps to 15.82% from the 15.80% recorded the previous week, while the yields on the 364-day and 182-day papers decreased marginally by 1.5 bps and 0.7 bps to 16.49% and 16.46% from 16.50% and 16.47% respectively recorded the previous week;
Additionally, in the primary bond market, the government is seeking to raise an additional Kshs 25.0 bn for budgetary support by re-opening the FXD1/2024/10 treasury bond with a tenor to maturity of 9.9 years and a fixed coupon rate of 16.0%. The bidding process opened on Thursday 25th April 2024 and will close on Thursday, 2nd May 2024. The bond's value date will be 6th May 2024, with a maturity date of 13th March 2034. In the secondary bond market, the FXD1/2024/10 is trading at 16.2%, and as such, we recommend a bidding range of 15.85%-16.25%, a drop from the 16.5% issued in March for the same bond;
We are projecting the y/y inflation rate for April 2024 to come in at the range of 5.4% - 5.7% mainly on the back of reduced fuel prices in April, the maintenance of the Central Bank Rate at 13.0% in the latest MPC meeting and reduced electricity prices;
Equities
During the week, the equities market recorded mixed performances, with NSE 10, NSE 25, and NASI gaining by 2.2%, 1.3%, and 0.9% respectively, while NSE 20 declined 0.1%, taking the YTD performance to gains of 23.5%, 19.7%, 17.0%, and 11.9% for NSE 10, NSE 25, NASI, and NSE 20 respectively. The equities market performance was driven by gains recorded by large-cap stocks such as KCB, ABSA Bank, and Stanbic Bank of 7.9%, 4.3%, and 4.2% respectively. The performance was, however, weighed down by losses recorded by large-cap stocks such as Standard Chartered Bank, NCBA, and BAT of 11.9%, 1.9%, and 0.7% respectively;
During the week, Sanlam Kenya Holdings released their FY’2023 results, recording a 52.6% increase in Loss After Tax to Kshs 0.13 bn, from Kshs 0.08 bn recorded in FY’2022. The performance was mainly driven by a significant 417.6% increase in Net Expense from reinsurance contracts held to Kshs 1.2 bn, from Kshs 0.2 bn in FY’2022, coupled with the 16.5% decline in insurance revenue to Kshs 6.9 bn from Kshs 8.3 bn in FY’2022;
Real Estate
During the week, President Ruto presided over the ground-breaking ceremony of the Naivasha Special Economic Zone (SEZ) Affordable Housing Project, which aims to construct 1000 housing units. The project is located on a 1000-acre piece of land in Mahiu, Nakuru County, along the Nairobi-Naivasha Standard Gauge Railway (SGR) line, with 30 acres set aside for the Affordable Housing Program (AHP);
In the retail sector, Naivas Supermarket, a local retail chain, opened its Naivas Lang’ata Medlink branch, situated along Lang’ata Road, thereby increasing its nationwide total to 104 outlets. This outlet is poised to benefit from heavy traffic along Lang’ata Road and the growing middle-class population in the area;
In the Unquoted Securities Platform, Acorn D-REIT and I-REIT traded at Kshs 24.4 and Kshs 21.7 per unit, respectively, as of 26th April 2024. The performance represented a 22.0% and 8.3% gain for the D-REIT and I-REIT, respectively, from the Kshs 20.0 inception price;
Focus of the Week
The Nairobi Securities Exchange (NSE) has experienced an extended drought in Initial Public Offers (IPOs), with the last recorded IPO occurring in 2015. Despite efforts to spur listings, including setting ambitious targets by the Capital Markets Authority (CMA) and the President, the market has fallen short. Currently, a few large cap stocks dominate the NSE, posing concentration risks and potential market volatility. However, the development of capital markets remains vital for Kenya's economic growth, as it channels long-term savings into investment and enhances capital allocation efficiency. In this study, we delve into the current state of the NSE, other components of Kenya's capital markets, the challenges they face, and provide recommendations for their enhancement;
Investment Updates:
- Weekly Rates:
- Cytonn Money Market Fund closed the week at a yield of 17.03% p.a. To invest, dial *809# or download the Cytonn App from Google Play store here or from the Appstore here;
- We continue to offer Wealth Management Training every Monday, from 10:00 am to 12:00 pm. The training aims to grow financial literacy among the general public. To register for any of our Wealth Management Trainings, click here;
- If interested in our Private Wealth Management Training for your employees or investment group, please get in touch with us through wmt@cytonn.com;
- Cytonn Insurance Agency acts as an intermediary for those looking to secure their assets and loved ones’ future through insurance namely; Motor, Medical, Life, Property, WIBA, Credit and Fire and Burglary insurance covers. For assistance, get in touch with us through insuranceagency@cytonn.com;
- Cytonn Asset Managers Limited (CAML) continues to offer pension products to meet the needs of both individual clients who want to save for their retirement during their working years and Institutional clients that want to contribute on behalf of their employees to help them build their retirement pot. To more about our pension schemes, kindly get in touch with us through pensions@cytonn.com;
Real Estate Updates:
- For more information on Cytonn’s real estate developments, email us at sales@cytonn.com;
- Phase 3 of The Alma is now ready for occupation and the show house is open daily. To join the waiting list to rent, please email properties@cytonn.com;
- For Third Party Real Estate Consultancy Services, email us at rdo@cytonn.com;
- For recent news about the group, see our news section here;
Hospitality Updates:
- We currently have promotions for Staycations. Visit cysuites.com/offers for details or email us at sales@cysuites.com;
Money Markets, T-Bills Primary Auction:
During the week, T-bills were undersubscribed for the first time in four weeks, with the overall undersubscription rate coming in at 98.2%, a reversal from the oversubscription rate of 108.7% recorded the previous week. Investors’ preference for the shorter 91-day paper persisted, with the paper receiving bids worth Kshs 6.0 bn against the offered Kshs 4.0 bn, translating to an oversubscription rate of 149.6%, slightly lower than the oversubscription rate of 150.1% recorded the previous week. The subscription rates for the 182-day paper and 364-day paper decreased to 69.3% and 106.4% respectively, from 78.1% and 122.7% respectively recorded the previous week. The government accepted a total of Kshs 23.3 bn worth of bids out of Kshs 23.6 bn of bids received, translating to an acceptance rate of 98.9%. The yields on the government papers recorded mixed performances, with the yield on the 91-day paper increasing marginally by 2.0 bps to 15.82% from the 15.80% recorded the previous week, while the yields on the 364-day and 182-day papers decreased marginally by 1.5 bps and 0.7 bps to 16.49% and 16.46% from 16.50% and 16.47% respectively recorded the previous week. The chart below shows the yield growth rate for the 91-day paper over the period:
The chart below compares the overall average T-bill subscription rates obtained in 2018, 2022, 2023, and 2024 Year-to-date (YTD):

Additionally, in the primary bond market, the government is seeking to raise an additional Kshs 25.0 bn for budgetary support by re-opening the FXD1/2024/10 treasury bond with a tenor to maturity of 9.9 years and a fixed coupon rate of 16.0%. The bidding process opened on Thursday 25th April 2024 and will close on Thursday, 2nd May 2024. The bond's value date will be 6th May 2024, with a maturity date of 13th March 2034. In the secondary bond market, the FXD1/2024/10 is trading at 16.2%, and as such, we recommend a bidding range of 15.85%-16.25%, a drop from the 16.5% issued in March for the same bond.
Money Market Performance:
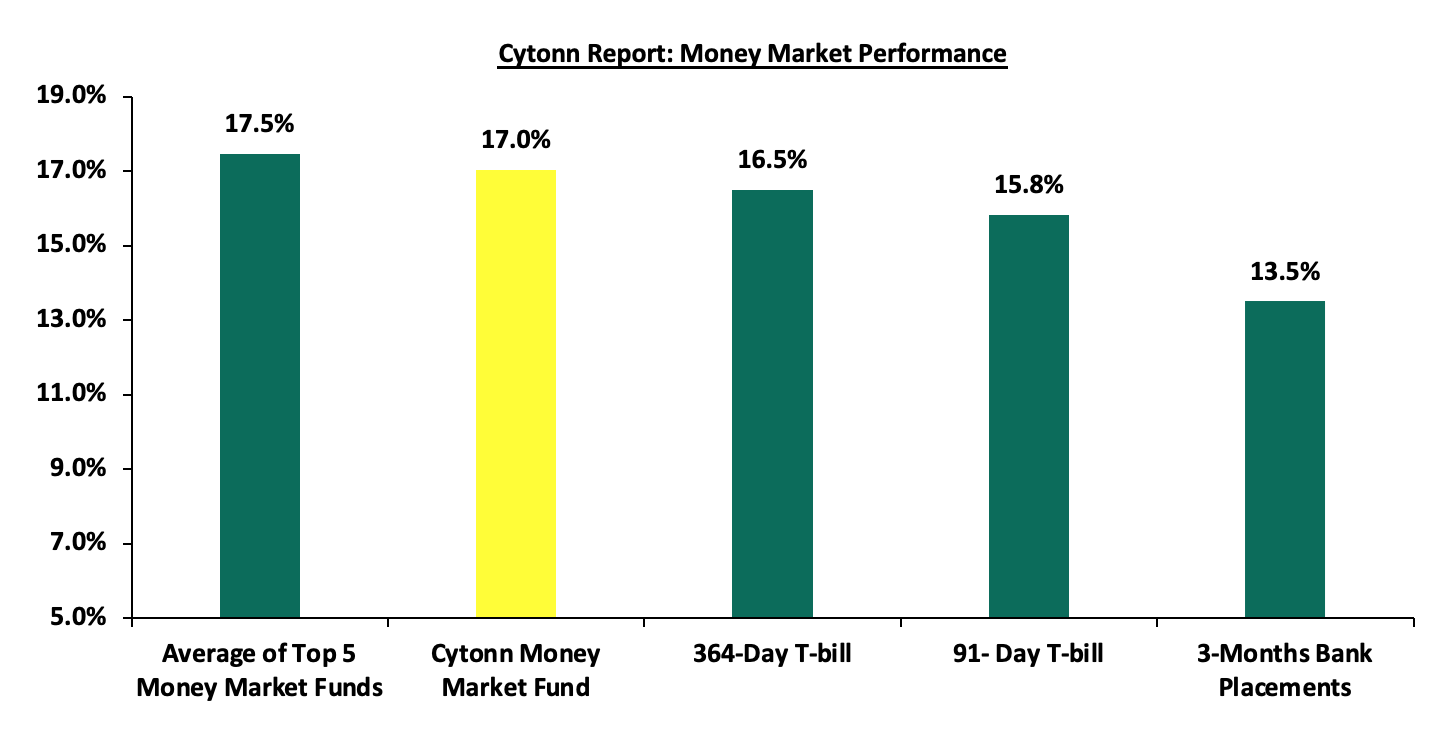
In the money markets, 3-month bank placements ended the week at 13.5% (based on what we have been offered by various banks), and the yields on the government papers recorded mixed performances, with the yield on the 91-day paper increasing marginally by 2.0 bps to remain relatively unchanged at 15.8% recorded the previous week, while the yields on the 364-day paper decreased marginally by 1.5 bps to remain relatively unchanged at 16.5% recorded the previous week. The yields of the Cytonn Money Market Fund decreased by 10.0 bps to 17.0% from the 17.1% recorded the previous week, while the average yields on the Top 5 Money Market Funds increased by 6.4 bps to 17.5% from the 17.4% recorded the previous week.
The table below shows the Money Market Fund Yields for Kenyan Fund Managers as published on 26th April 2024:
|
Cytonn Report: Money Market Fund Yield for Fund Managers as published on 26h April 2024 |
||
|
Rank |
Fund Manager |
Effective Annual Rate |
|
1 |
Lofty-Corban Money Market Fund |
18.3% |
|
2 |
Etica Money Market Fund |
18.1% |
|
3 |
Nabo Africa Money Market Fund |
17.1% |
|
4 |
Cytonn Money Market Fund (Dial *809# or download the Cytonn app) |
17.0% |
|
5 |
GenAfrica Money Market Fund |
16.8% |
|
6 |
Kuza Money Market fund |
16.4% |
|
7 |
Apollo Money Market Fund |
16.2% |
|
8 |
Enwealth Money Market Fund |
16.1% |
|
9 |
Madison Money Market Fund |
16.0% |
|
10 |
KCB Money Market Fund |
15.5% |
|
11 |
Absa Shilling Money Market Fund |
15.4% |
|
12 |
Co-op Money Market Fund |
15.3% |
|
13 |
Jubilee Money Market Fund |
15.3% |
|
14 |
Sanlam Money Market Fund |
15.2% |
|
15 |
GenCap Hela Imara Money Market Fund |
15.2% |
|
16 |
AA Kenya Shillings Fund |
15.1% |
|
17 |
Mali Money Market Fund |
15.1% |
|
18 |
Mayfair Money Market Fund |
14.9% |
|
19 |
Equity Money Market Fund |
14.4% |
|
20 |
Dry Associates Money Market Fund |
13.8% |
|
21 |
Old Mutual Money Market Fund |
13.6% |
|
22 |
Orient Kasha Money Market Fund |
13.3% |
|
23 |
CIC Money Market Fund |
13.2% |
|
24 |
ICEA Lion Money Market Fund |
12.4% |
|
25 |
British-American Money Market Fund |
9.9% |
Source: Business Daily
Liquidity:
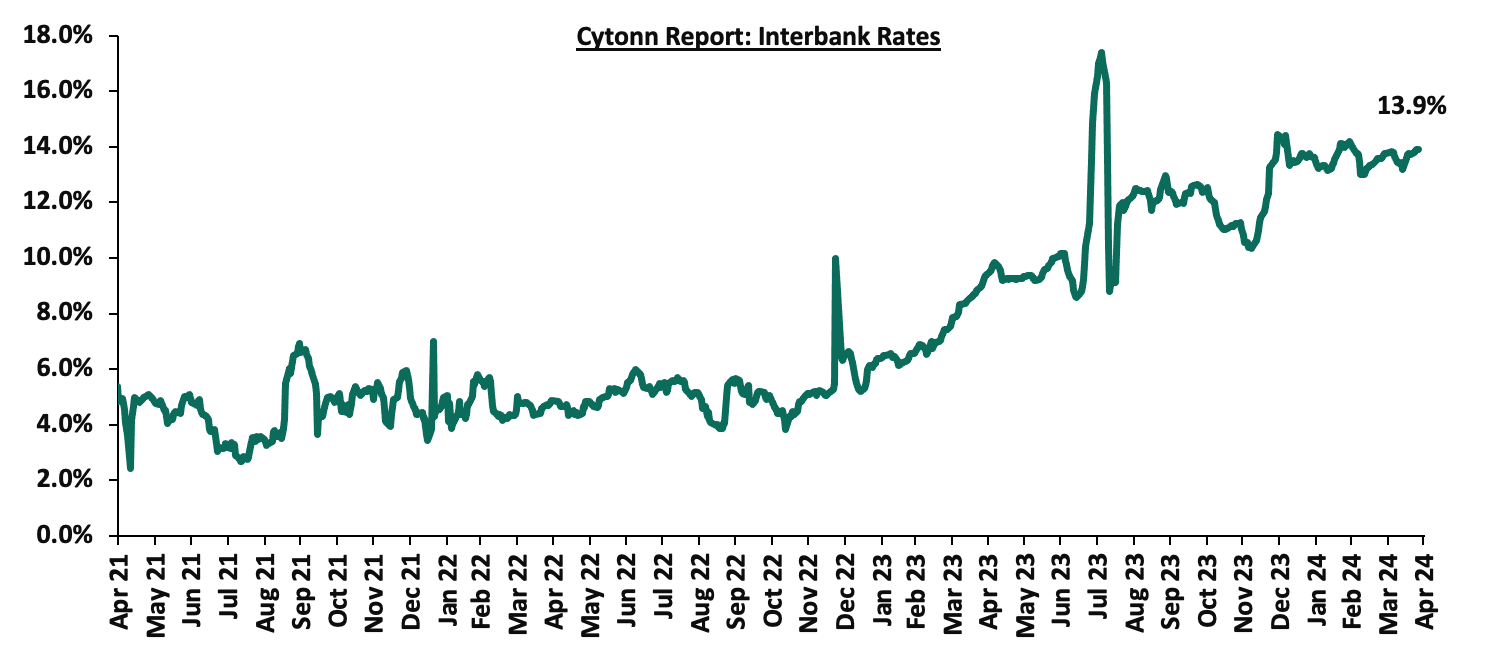
During the week, liquidity in the money markets tightened, with the average interbank rate increasing by 16.9 bps, to 13.9%, from 13.7% recorded the previous week, partly attributable to tax remittances that offset government payments. The average interbank volumes traded decreased by 1.8% to Kshs 20.8 bn from Kshs 21.1 bn recorded the previous week. The chart below shows the interbank rates in the market over the years:
Kenya Eurobonds:
During the week, the yields on Eurobonds were on an upward trajectory, with the yields on the 7-year Eurobond issued in 2024 increasing the most by 17.1 bps to 9.8% from 9.6% recorded the previous week. The table below shows the summary of the performance of the Kenyan Eurobonds as of 25th April 2024;
|
Cytonn Report: Kenya Eurobonds Performance |
||||||
|
|
2018 |
2019 |
2021 |
2024 |
||
|
Tenor |
10-year issue |
30-year issue |
7-year issue |
12-year issue |
13-year issue |
7-year issue |
|
Amount Issued (USD) |
1.0 bn |
1.0 bn |
0.9 bn |
1.2 bn |
1.0 bn |
1.5 bn |
|
Years to Maturity |
3.8 |
23.9 |
3.1 |
8.1 |
10.2 |
6.8 |
|
Yields at Issue |
7.3% |
8.3% |
7.0% |
7.9% |
6.2% |
10.4% |
|
01-Jan-24 |
9.8% |
10.2% |
10.1% |
9.9% |
9.5% |
|
|
01-Apr-24 |
8.7% |
9.8% |
8.4% |
9.3% |
9.3% |
9.2% |
|
18-Apr-24 |
9.0% |
10.1% |
9.0% |
9.7% |
9.7% |
9.6% |
|
19-Apr-24 |
8.9% |
10.0% |
8.9% |
9.6% |
9.7% |
9.6% |
|
22-Apr-24 |
8.9% |
9.9% |
8.8% |
9.5% |
9.6% |
9.5% |
|
23-Apr-24 |
8.8% |
9.9% |
8.7% |
9.5% |
9.5% |
9.4% |
|
24-Apr-24 |
9.0% |
10.0% |
8.9% |
9.6% |
9.7% |
9.6% |
|
25-Apr-24 |
9.1% |
10.1% |
9.1% |
9.8% |
9.9% |
9.8% |
|
Weekly Change |
0.1% |
0.0% |
0.2% |
0.1% |
0.2% |
0.2% |
|
MTD Change |
0.4% |
0.3% |
0.7% |
0.5% |
0.6% |
0.5% |
|
YTD Change |
(0.7%) |
(0.1%) |
(1.0%) |
(0.1%) |
0.4% |
9.8% |
Source: Central Bank of Kenya (CBK) and National Treasury
Kenya Shilling:
During the week, the Kenya Shilling depreciated against the US Dollar by 1.5% to close at Kshs 133.5, from Kshs 131.4 recorded the previous week. On a year-to-date basis, the shilling has appreciated by 15.0% against the dollar, in contrast to the 26.8% depreciation in 2023. We expect the shilling to remain under pressure in 2023 as a result of:
- An ever-present current account deficit which came at 3.5% of GDP in Q3’2023 from 6.4% recorded in a similar period in 2022,
- The need for government debt servicing, continues to put pressure on forex reserves given that 67.5% of Kenya’s external debt was US Dollar denominated as of September 2023, and,
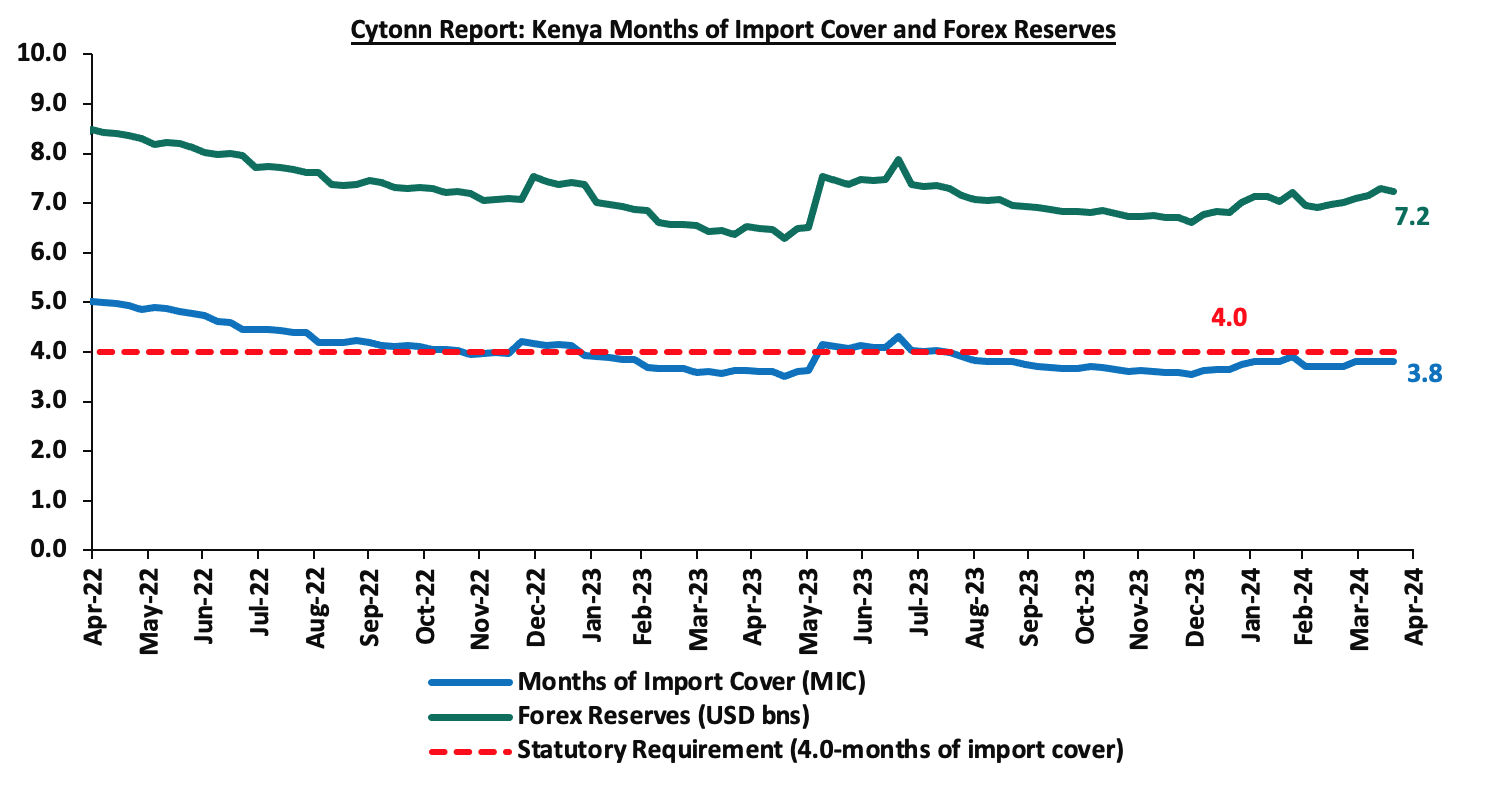
- Dwindling forex reserves, currently at USD 7.2 mn (equivalent to 3.8 months of import cover), which is below the statutory requirement of maintaining at least 4.0 months of import cover.
The shilling is however expected to be supported by:
- Diaspora remittances standing at a cumulative USD 4,380.5 mn in the 12 months to March 2024, 9.0% higher than the USD 4,019.6 mn recorded over the same period in 2023, which has continued to cushion the shilling against further depreciation. In the March 2024 diaspora remittances figures, North America remained the largest source of remittances to Kenya accounting for 56.2% in the period, and,
- The tourism inflow receipts which came in at USD 352.5 bn in 2023, a 31.5% increase from USD 268.1 bn inflow receipts recorded in 2022, and owing to tourist arrivals that improved by 27.6% to 182,000 in the 12 months to January 2024, from 151,000 recorded during a similar period in 2023.
Key to note, Kenya’s forex reserves increased marginally by 0.1% during the week to remain relatively unchanged at USD 7.2 bn recorded the previous week, equivalent to 3.8 months of import cover same as the previous week, and remained below the statutory requirement of maintaining at least 4.0-months of import cover. The chart below summarizes the evolution of Kenya's months of import cover over the years:
The chart below summarizes the evolution of Kenya's months of import cover over the years:
Weekly Highlights
- April 2024 Inflation Projection
We are projecting the y/y inflation rate for April 2024 to come in at the range of 5.4% - 5.7% mainly on the back of:
- Reduced Fuel Prices – The prices for Super Petrol, Diesel, and Kerosene decreased by Kshs 5.3, Kshs 10.0 and Kshs 18.7 respectively to retail at Kshs 193.8, Kshs 180.4, and Kshs 170.0 per litre, from Kshs 199.2, Kshs 190.4, and Kshs 188.7 per litre respectively according to the latest EPRA report, following the government's efforts to stabilize pump prices through the petroleum pump price stabilization mechanism which has so far expended Kshs 9.9 bn in the FY’2023/24 to cushion the increases applied to the petroleum pump prices. This decline in fuel prices is likely to contribute to the easing of inflationary pressures as it provides a stabilizing effect on consumer purchasing power as well as business operational costs since fuel is a major input cost for businesses,
- The maintenance of the Central Bank Rate (CBR) at 13.0% – Earlier this year, the monetary policy committee noted that there was a need to tighten the monetary policy following the sustained depreciation of the Kenyan shilling as well as the heightened inflationary pressures which came in at 6.9% in the month of January, 0.3% points increase from the 6.6% in December and remaining within the upper bound of the inflation target range of 2.5% to 7.5%. In line with this, the committee increased the CBR by 50.0 bps to 13.0% from 12.5% in February. Additionally, on 3rd April 2024, the monetary policy committee decided to maintain the CBR at 13.0% to give the new rate time to take further effect in the economy, with inflation easing to 5.7% in March,
- Reduction in electricity prices – In April, EPRA announced a Kshs 3.3 decrease per unit in electricity consumer prices on the back of a reduction in the cost of fuel as a result of the strengthening of the Shilling against the dollar, with the Fuel Energy Cost decreasing to Kshs 3.3 from Kshs 4.6 and the foreign exchange rate fluctuation decreasing to Kshs 2.0 in April from Kshs 3.7 per unit in March. With electricity being one of the major inputs of inflation, this decline is expected to reduce production costs for businesses as well as reduce electricity costs for households thus easing inflation,
- Strengthening of the Kenya Shilling against the US Dollar – The Kenya Shilling has gained against the dollar recording a 15.0% year-to-date gain to Kshs 133.5 as of 26th April 2024 from the Kshs 157.0 recorded at the beginning of the year. This can be attributed to the recent buyback of the USD 2.0 bn Eurobond, alleviating the debt risk on the country, the inflows from foreign loans and the infrastructure bond, which increased dollar supply in the economy coupled with the monetary policy committee’s decision to maintain the CBR at 13.0%. However, we noted a 1.3% depreciation of the Shilling against the dollar in the last two weeks of April, which is expected to soften the currency appreciation effects on inflation.
Going forward, we expect inflationary pressures to alleviate in the short term, while remaining in the CBK’s target range of 2.5%-7.5% aided by the strengthening of the Kenya shilling against the US Dollar, which has continued to contribute to a reduction in fuel prices. Furthermore, the decision to maintain the CBR at 13.0% during the latest MPC meeting is meant to continue reducing money supply, in turn easing inflation as well as support the exchange rate. We also anticipate that government initiatives to subsidize key inputs in agricultural production, such as fertilizers, will drive down the costs of farming inputs and support the easing of inflation in the long term.
Rates in the Fixed Income market have been on an upward trend given the continued high demand for cash by the government and the occasional liquidity tightness in the money market. The government is 17.6% ahead of its prorated net domestic borrowing target of Kshs 392.4 bn, having a net borrowing position of Kshs 461.4 bn out of the domestic net borrowing target of Kshs 471.4 bn for the FY’2023/2024. However, we expect a downward readjustment of the yield curve in the short and medium term, with the government looking to increase its external borrowing to maintain the fiscal surplus, hence alleviating pressure in the domestic market. As such, we expect the yield curve to normalize in the medium to long-term and hence investors are expected to shift towards the long-term papers to lock in the high returns.
During the week, the equities market recorded mixed performances, with NSE 10, NSE 25, and NASI gaining by 2.2%, 1.3%, and 0.9% respectively, while NSE 20 declined 0.1%, taking the YTD performance to gains of 23.5%, 19.7%, 17.0%, and 11.9% for NSE 10, NSE 25, NASI, and NSE 20 respectively. The equities market performance was driven by gains recorded by large-cap stocks such as KCB, ABSA Bank, and Stanbic Bank of 7.9%, 4.3%, and 4.2% respectively. The performance was, however, weighed down by losses recorded by large-cap stocks such as Standard Chartered Bank, NCBA, and BAT of 11.9%, 1.9%, and 0.7% respectively.
During the week, equities turnover decreased by 10.2% to USD 11.0 mn from USD 12.2 mn recorded the previous week, taking the YTD total turnover to USD 182.4 mn. Foreign investors remained net buyers for the third consecutive week with a net buying position of USD 4.7 mn, from a net buying position of USD 0.2 mn recorded the previous week, taking the YTD foreign net selling position to USD 10.2 mn.
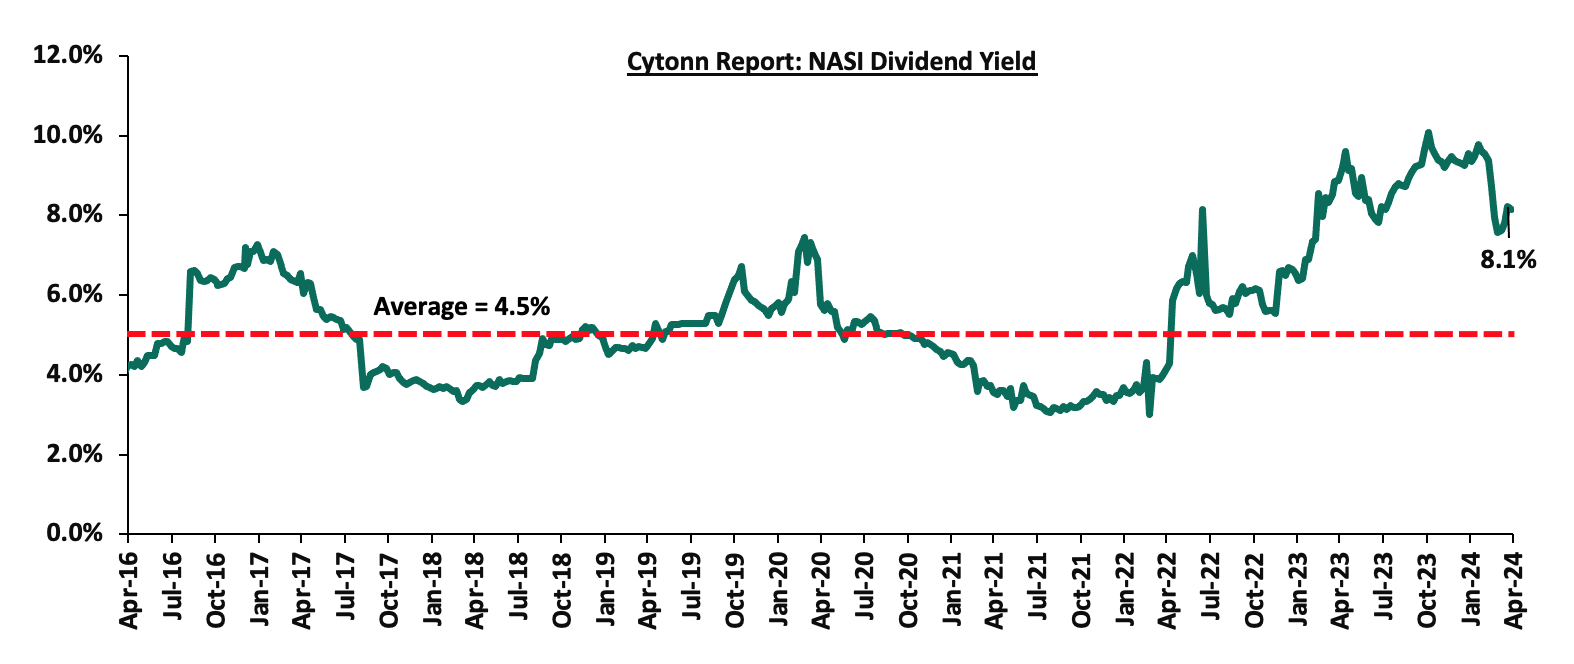
The market is currently trading at a price-to-earnings ratio (P/E) of 5.3x, 55.6% below the historical average of 12.0x. The dividend yield stands at 8.1%, 3.7% points above the historical average of 4.5%. Key to note, NASI’s PEG ratio currently stands at 0.7x, an indication that the market is undervalued relative to its future growth. A PEG ratio greater than 1.0x indicates the market is overvalued while a PEG ratio less than 1.0x indicates that the market is undervalued. The charts below indicate the historical P/E and dividend yields of the market

Universe of coverage:
|
Cytonn Report: Equities Universe of Coverage |
|||||||||
|
Company |
Price as at 19/04/2024 |
Price as at 26/04/2024 |
w/w change |
YTD Change |
Target Price* |
Dividend Yield |
Upside/ Downside** |
P/TBv Multiple |
Recommendation |
|
Jubilee Holdings |
191.0 |
182.8 |
(4.3%) |
(1.2%) |
260.7 |
6.6% |
49.2% |
0.3x |
Buy |
|
Equity Group*** |
42.1 |
43.1 |
2.3% |
25.9% |
60.2 |
9.3% |
49.1% |
0.8x |
Buy |
|
Co-op Bank*** |
13.6 |
14.0 |
3.3% |
23.3% |
19.2 |
10.7% |
47.9% |
0.6x |
Buy |
|
Standard Chartered*** |
195.3 |
172.0 |
(11.9%) |
7.3% |
225.2 |
16.9% |
47.8% |
1.1x |
Buy |
|
I&M Group*** |
19.1 |
17.3 |
(9.4%) |
(1.1%) |
22.5 |
14.8% |
45.2% |
0.4x |
Buy |
|
ABSA Bank*** |
12.8 |
13.4 |
4.3% |
15.6% |
17.3 |
11.6% |
41.2% |
1.1x |
Buy |
|
Diamond Trust Bank*** |
50.0 |
50.0 |
0.0% |
11.7% |
65.2 |
10.0% |
40.4% |
0.2x |
Buy |
|
Kenya Reinsurance |
1.9 |
1.9 |
0.0% |
4.9% |
2.5 |
10.3% |
39.7% |
0.2x |
Buy |
|
Stanbic Holdings |
112.5 |
117.3 |
4.2% |
10.6% |
145.3 |
13.1% |
37.0% |
0.8x |
Buy |
|
NCBA*** |
44.9 |
44.1 |
(1.9%) |
13.4% |
55.2 |
10.8% |
36.1% |
0.8x |
Buy |
|
Sanlam |
6.0 |
6.6 |
10.0% |
10.0% |
8.8 |
0.0% |
33.5% |
1.9x |
Buy |
|
KCB Group*** |
28.0 |
30.2 |
7.9% |
37.4% |
37.2 |
0.0% |
23.4% |
0.5x |
Buy |
|
Liberty Holdings |
5.0 |
5.3 |
5.4% |
36.3% |
6.1 |
7.1% |
23.1% |
0.4x |
Buy |
|
CIC Group |
2.3 |
2.3 |
(2.6%) |
(0.4%) |
2.5 |
5.7% |
15.4% |
0.7x |
Accumulate |
|
Britam |
5.7 |
5.6 |
(1.4%) |
9.7% |
6.5 |
0.0% |
15.2% |
0.8x |
Accumulate |
|
HF Group |
4.0 |
4.1 |
2.2% |
18.8% |
4.6 |
0.0% |
12.9% |
0.2x |
Accumulate |
Weekly Highlights:
- Sanlam Kenya Holdings FY’2023 Financial Results.
During the week, Sanlam Kenya Holdings released their FY’ 2023 results. Below is a summary of the performance.
|
Cytonn Report: Sanlam Kenya Plc's Income Statement |
|||
|
Income Statement (Kshs bn) |
FY'2022 |
FY'2023 |
y/y change |
|
Insurance Revenue |
8.3 |
6.9 |
(16.5%) |
|
Insurance Service Expense |
(8.2) |
(5.0) |
(38.2%) |
|
Net Expense from reinsurance contracts held |
(0.2) |
(1.2) |
417.6% |
|
Insurance Service Result |
(0.1) |
0.7 |
803.9% |
|
Insurance Investment Revenue |
2.0 |
1.1 |
(48.1%) |
|
Net Insurance Finance expenses |
(0.7) |
(0.8) |
23.7% |
|
Profit before tax |
0.3 |
0.2 |
(15.0%) |
|
Income tax expense |
(0.4) |
(0.4) |
0.2% |
|
Profit after tax |
(0.08) |
(0.13) |
52.6% |
|
Core Earnings/(Loss) Per Share |
(0.5) |
(1.1) |
124.0% |
|
Cytonn Report: Sanlam Kenya Plc's Balance Sheet |
|||
|
Balance Sheet items |
FY'2022 |
FY'2023 |
y/y change |
|
Financial Investments |
30.2 |
29.8 |
(1.3%) |
|
Insurance and Reinsurance contract assets |
2.0 |
1.2 |
(41.1%) |
|
Other assets |
4.6 |
4.6 |
0.5% |
|
Total assets |
36.7 |
35.5 |
(3.2%) |
|
Insurance contract liabilities |
29.6 |
27.9 |
(5.7%) |
|
Other liabilities |
6.1 |
6.7 |
10.5% |
|
Total liabilities |
35.7 |
34.7 |
(3.0%) |
|
Shareholder funds |
1.0 |
0.8 |
(16.6%) |
As per the above results, Sanlam Kenya Plc announced a 52.6% increase in Loss After Tax to Kshs 0.13 bn, from Kshs 0.08 bn recorded in FY’2022. The performance was mainly driven by a significant 417.6% increase in Net Expense from reinsurance contracts held to Kshs 1.2 bn, from Kshs 0.2 bn in FY’2022, coupled with the 16.5% decline in insurance revenue to Kshs 6.9 bn from Kshs 8.3 bn in FY’2022.
Key take outs from the results:
- Core Loss Per share increased by 124.0% to Kshs 1.1 from Kshs 0.5 in FY’2022, driven by a significant 417.6% increase in Net Expense from reinsurance contracts held to Kshs 1.2 bn, from Kshs 0.2 bn in FY’2022, coupled with the 16.5% decline in insurance revenue to Kshs 6.9 bn from Kshs 8.3 bn in FY’2022
- Net Investment revenue decreased by 48.1% to Kshs 1.1 bn in FY’2023, from Kshs 2.0 bn in FY’2022. This was majorly attributable to a significant 103.7% increase in losses from other investments to Kshs 1.9 bn from Kshs 1.0 bn in FY’2022, but was supported by a 37.3% increase in interest revenue to Kshs 0.24 bn from Kshs 0.18 bn in FY’2022,
- Insurance revenue decreased by 16.5% to Kshs 6.9 bn in FY’2023 from Kshs 8.3 bn in FY’2022, while insurance expenses decreased by 38.2% to Kshs 5.0 bn from Kshs 8.2 bn in FY’2022. In addition, there was a significant 417.6% reduction in net expenses from reinsurance contracts held to Kshs 0.2 bn from Kshs 1.2 bn registered in FY’2022. This translated to a Net insurance service result increase of 803.9% to Kshs 0.7 bn from a loss of Kshs 0.1 bn in FY’2022,
- The balance sheet recorded a contraction as total assets decreased by 3.2% to Kshs 35.5 bn in FY’2023 from Kshs 36.7 bn in FY’2022 mainly driven by 41.1% decrease in Insurance and Reinsurance contract assets to Kshs 1.2 bn from Kshs 2.0 bn in FY’2022, coupled with a 1.3% decrease in financial investments to Kshs 29.8 bn from Kshs 30.2 bn, and,
- Total liabilities decreased by 3.0% to Kshs 34.7 bn from Kshs 35.7 bn in FY’2022, majorly on the back of the 5.7% decrease in insurance contract liabilities to Kshs 27.9 bn from Kshs 29.6 bn in FY’2022.
Other highlights from the release include:
- Non-declaration of dividends – The directors of Sanlam Kenya Plc have not recommended a dividend payment for the FY’2023, making this the 10th consecutive year of no dividend payments, and,
- Implementation of IFRS 17 – The company has fully implemented IFRS 17 reporting standards in line with the new regulations.
Going forward, the factors that would drive the company’s growth would be:
- Life and General insurance profitability - Sanlam Life Insurance Limited recorded a profit after tax of Kshs 0.53 bn representing a 15.0% growth from Kshs 0.46 bn restated profit after-tax recorded in the FY’2022. Similarly, Sanlam General Insurance Limited recorded a profit after tax of Kshs 0.1 bn, a significant improvement from the prior year’s restated loss after tax of Kshs 0.03 bn. These results showcase the company's resilience and effectiveness in both life and general insurance sectors, strengthening its financial position. This profitability is expected to fuel strategic investments, market expansion, and innovation. It will also boost investor confidence, attracting capital for future growth and delivering sustainable long-term value to shareholders and stakeholders, and,
- Capital preservation – The directors have implemented strategies to return to profitability through sustainable business growth, effective controls, strategic expense management, and effective investment strategies. The Board of Directors has not proposed payment of dividends in the financial year ending 31st December 2023. This is to enable the business to preserve capital and continue to service its operational and finance costs. Consequently, the Group’s performance is expected to improve in the foreseeable future.
Valuation Summary:
- We are of the view that Sanlam Kenya Plc is an “Buy” with a target price of Kshs 8.8 representing an upside of 33.5%, from the current price of 6.6 as of 26th April 2024.
We are “Neutral” on the Equities markets in the short term due to the current tough operating environment and huge foreign investor outflows, and, “Bullish” in the long term due to current cheap valuations and expected global and local economic recovery. With the market currently being undervalued for its future growth (PEG Ratio at 0.7x), we believe that investors should reposition towards value stocks with strong earnings growth and that are trading at discounts to their intrinsic value. We expect the current high foreign investors’ sell-offs to continue weighing down the equities outlook in the short term.
- Residential Sector
During the week, President Ruto presided over the ground-breaking ceremony of the Naivasha Special Economic Zone (SEZ) Affordable Housing Project, which aims to construct 1000 housing units. The project is located on a 1000-acre piece of land in Mahiu, Nakuru County, along the Nairobi-Naivasha Standard Gauge Railway (SGR) line, with 30 acres set aside for the Affordable Housing Program (AHP). Phase 1 will involve the development of 520 housing units. An additional 500 affordable housing units and market-rate units will be included in Phase 2, consisting of 2-bedroom and 3-bedroom units. Additionally, Phase 2B will feature social units and cottage industries. Phase one will comprise thirteen blocks with a combination of residential units, commercial areas, and social amenities. The project will also include other associated amenities such as a primary school with an Early Childhood Development (ECD) center, a health center with a maternity ward, a police post, a community center, and a playing field.
We expect the project to achieve the following through implementation to completion; i) generate both direct and indirect employment opportunities for the local community, ii) elevate living standards in the area, iii) stimulate economic growth within the region, iv) attract further investment activities to the area, v) mitigate the current housing deficit across the nation, which stands at a national level 61.3%. This is in comparison to other African countries like Angola and Algeria with 75.4% and 74.8% national home ownership rates respectively, according to Centre of Affordable Housing Finance in Africa (CAHF). The graph below shows the national home ownership percentages for different countries compared to Kenya.
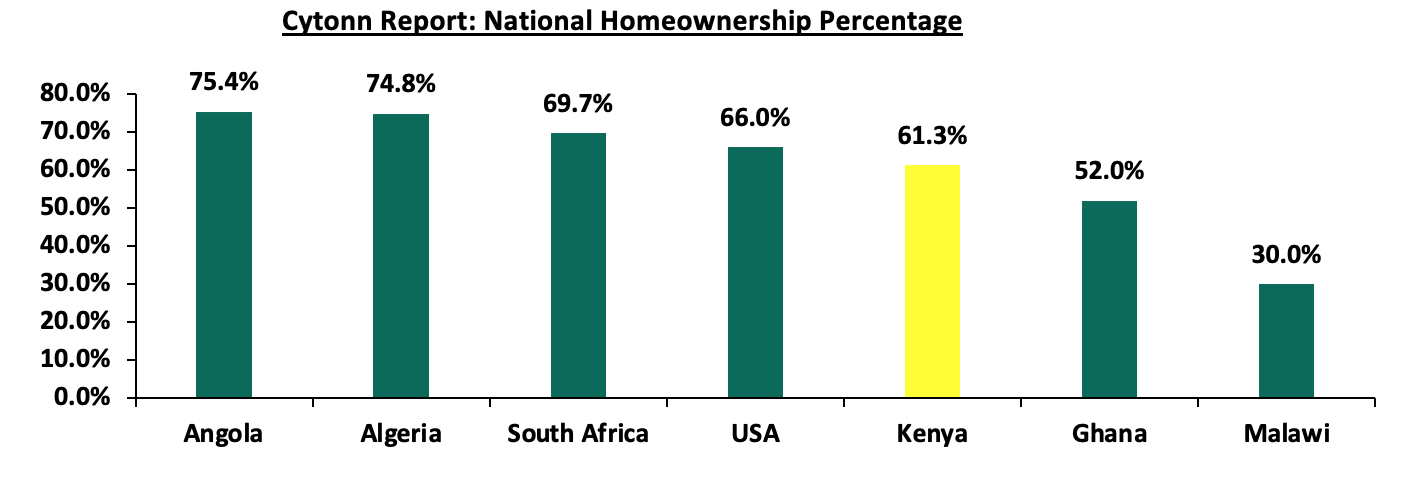
Source: US Census Bureau, CAHF
- Retail Sector
During the week, Naivas Supermarket, a local retail chain, opened its Naivas Lang’ata Medlink branch, situated along Lang’ata Road, thereby increasing its nationwide total to 104 outlets. This outlet is poised to benefit from heavy traffic along Lang’ata Road and the growing middle-class population in the area. Naivas continues its expansive agenda, as evidenced by the recent openings of additional branches in Nairobi's Survey and Westlands regions. In the year 2024 alone, Naivas has launched four new branches, solidifying its status as a prominent player in the retail industry. Retailers, recognizing the importance of expanding their presence to meet evolving market demands, have been actively pursuing expansion initiatives. Besides Naivas, other retailers that have embarked on expansion in 2024 include Jaza Stores and Quick Mart. The following table outlines the current store counts of major local and international supermarket chains operating in Kenya;
|
Cytonn Report: Main Local and International Retail Supermarket Chains |
||||||||||
|
Name of retailer |
Category |
Branches as at FY’2018 |
Branches as at FY’2019 |
Branches as at FY’2020 |
Branches as at FY’2021 |
Branches as at FY’2022 |
Branches as at FY’2023 |
Branches opened in FY’2024 |
Closed Branches |
Current Branches |
|
Naivas |
Hybrid* |
46 |
61 |
69 |
79 |
91 |
100 |
4 |
0 |
104 |
|
Quick Mart |
Hybrid** |
10 |
29 |
37 |
48 |
55 |
59 |
1 |
0 |
60 |
|
Chandarana |
Local |
14 |
19 |
20 |
23 |
26 |
26 |
0 |
0 |
26 |
|
Carrefour |
International |
6 |
7 |
9 |
16 |
19 |
22 |
0 |
0 |
22 |
|
Cleanshelf |
Local |
9 |
10 |
11 |
12 |
12 |
13 |
0 |
0 |
13 |
|
Tuskys |
Local |
53 |
64 |
64 |
6 |
6 |
5 |
0 |
59 |
5 |
|
Game Stores |
International |
2 |
2 |
3 |
3 |
0 |
0 |
0 |
3 |
0 |
|
Uchumi |
Local |
37 |
37 |
37 |
2 |
2 |
2 |
0 |
35 |
2 |
|
Choppies |
International |
13 |
15 |
15 |
0 |
0 |
0 |
0 |
15 |
0 |
|
Shoprite |
International |
2 |
4 |
4 |
0 |
0 |
0 |
0 |
4 |
0 |
|
Nakumatt |
Local |
65 |
65 |
65 |
0 |
0 |
0 |
0 |
65 |
0 |
|
Panda Mart |
International |
0 |
0 |
0 |
0 |
0 |
0 |
1 |
0 |
1 |
|
Jaza Stores |
Local |
0 |
0 |
0 |
0 |
0 |
4 |
2 |
0 |
6 |
|
Total |
|
257 |
313 |
334 |
189 |
211 |
231 |
8 |
181 |
239 |
|
*51% owned by IBL Group (Mauritius), Proparco (France), and DEG (Germany), while 49% owned by Gakiwawa Family (Kenya) |
||||||||||
|
**More than 50% owned by Adenia Partners (Mauritius), while Less than 50% owned by Kinuthia Family (Kenya) |
||||||||||
Source: Cytonn Research
Going forward, we expect more retailers to join the expansion drive as they continue to compete for market share in response to the exit of retailers such as Tuskys, Uchumi and Nakumatt in the Kenyan market. We therefore anticipate that more retailers will anchor their establishments in densely populated areas, locations with high vehicular traffic, and nodes with the potential for growth of the middle class.
- Real Estate Investments Trusts (REITs)
In the Unquoted Securities Platform, Acorn D-REIT and I-REIT traded at Kshs 24.4 and Kshs 21.7 per unit, respectively, as of 26th April 2024. The performance represented a 22.0% and 8.3% gain for the D-REIT and I-REIT, respectively, from the Kshs 20.0 inception price. The volumes traded for the D-REIT and I-REIT came in at 12.3 mn and 30.7 mn shares, respectively, with a turnover of Kshs 257.5 mn and Kshs 633.8 mn, respectively, since inception in February 2021.
REITs offer several advantages such as tax benefits, diversified investment portfolios, and consistent long-term returns. However, the ongoing decline in the performance of Kenyan REITs and the restructuring of their business portfolios are hindering significant investments that were previously made. Other common challenges include: i) insufficient understanding of the investment vehicle among investors, ii) lengthy approval processes for establishing REITs, and iii) high minimum capital requirements of Kshs 100.0 mn for trustees.
We anticipate that Kenya's real estate sector will receive support from several factors: i) the ongoing development of affordable housing projects across the country, which are expected to bolster the residential sector; ii) the relatively positive demographics in the country, leading to increased demand for housing and real estate; iii) heightened activity from both local and international retailers; and iv) ongoing infrastructural improvements that are opening up new areas for investment. However, challenges such as escalating construction costs, limited investor knowledge in Real Estate Investment Trusts (REITs), and existing oversupply in certain real estate sectors will persist, constraining the sector's optimal performance by limiting developments and investments.
The Nairobi Securities Exchange (NSE) last recorded an Initial Public Offers (IPOs) in 2015, when Stanlib Investments issued an IPO of the first Real Estate Investment Trust (Fahari I-REIT) at the bourse, managing to raise Kshs 3.6 bn against the target of Kshs 12.5 bn, 28.8% success rate. This translates to an eight-year IPO drought, with the most recent activity at the bourse being the listing by introduction, meaning no money was raised) out of the Local Authority Pension Trust (LAPTRUST) Imara Income Real Estate Investment Trust (I-REIT) under the Restricted Sub-Segment in 2022. LAPTRUST holds 100.0% of the Imara I-REIT shares with no initial offer to the public. Currently, the bourse has 66 listed securities with a total market capitalization of Kshs 1.7 tn as at 25th April 2024. The bourse continues to be Safaricom-dominated, with Safaricom’s market capitalization of Kshs 653.1 bn equivalent to 39.1% of the entire market capitalization. Additionally, Safaricom (39.1%) and Banks (37.7%) and foreign corporates (12.3%) make up 89.1% of the total bourse, leaving all other local sectors to share the remaining 10.9%. The Capital Markets Authority (CMA) raised concerns that Kenya has been unable to achieve its projected listings targets as articulated in its Capital Markets Master Plan released in 2016 which envisioned at least four listings on the NSE every year; by its own masterplan CMA is now behind by 28 listings. To cure this, the President in September 2022 set a target of 10 listings in one year, however this has not been achieved as of 2024. The chart below highlights the composition of stocks at the Nairobi Securities Exchange;
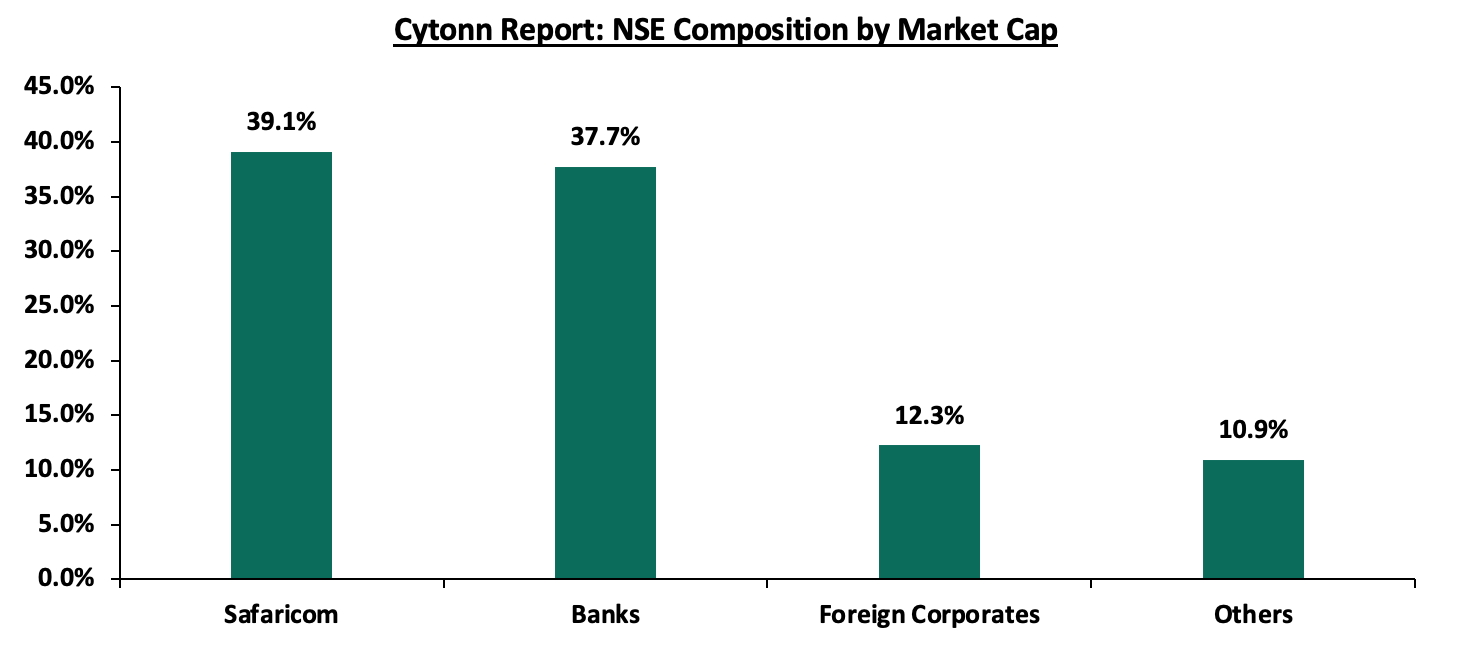
Source: Cytonn Research
Given that a few large-cap stocks, namely Safaricom PLC, Equity Group Holdings, KCB Group Ltd and East African Breweries Ltd hold almost 62.0% of the total market capitalization, the market remains volatile, which presents a risk of a market collapse due to concentration risk.
It is important to note that capital markets development is crucial for the growth of the Kenyan economy for several reasons; Firstly, the capital markets increase the proportion of long-term savings (pensions, life covers, et cetera) that is channelled to long-term investment. Capital markets enable the contractual savings industry (pension and provident funds, insurance companies, medical aid schemes, collective investment schemes, etc.) to mobilize long-term savings from small individual households and channel them into long-term investments. In this way, the capital markets enable corporations to raise funds to finance their investment in real assets. In addition, capital markets development increases the efficiency of capital allocation. Efficient capital allocation means that funds are allocated to the investment projects or firms that bring the most value to the economy; the marginal product of capital value is the highest.
Given the significant role that the capital markets play, we shall then focus on Unlocking Kenya’s Capital Markets. As such, we shall cover;
- Current State of the Nairobi Securities Exchange (NSE),
- Current State of other Components of the Kenya Capital Markets,
- Challenges facing Kenya’s Capital Markets, and,
- Recommendations and Conclusion.

Disclaimer: The views expressed in this publication are those of the writers where particulars are not warranted. This publication, which is in compliance with Section 2 of the Capital Markets Authority Act Cap 485A, is meant for general information only and is not a warranty, representation, advice or solicitation of any nature. Readers are advised in all circumstances to seek the advice of a registered investment advisor.

- Talk to us
- Kenya
- P.O Box 20695 - 00200, Nairobi, Kenya
- Cell +254709101200
- Tel +254709101200
- WhatsApp +254741676635
- United States
- +254709101200
- DOWNLOAD OUR APP
-


- Kenya
- 8th Floor, Pinetree Plaza, Kaburu Drive, Ngong Road, Nairobi, Kenya
- USA
- Suite 1150, 1775 Eye Street NW, USA, Washington DC 20006, USA
- Investments
- High Yield
- Private Equity
- Real Estate
- Real Estate
- RiverRun Estates
- Cytonn Towers
- The Ridge
- Taraji Heights
- The Alma