What Real Estate Bubble?, & Cytonn Weekly #51/2017
By Cytonn Research Team, Dec 24, 2017
Executive Summary
Fixed Income
Treasury bills continued to be undersubscribed this week with the overall subscription rate coming in at 84.8%, compared to 73.7% recorded the previous week. The yields on the 91 and 364-day papers remained unchanged at 8.0% and 11.1%, respectively, while the yield on the 182-day paper increased to 10.6% from 10.5% the previous week. We are projecting the inflation rate for the month of December to decline to a range of between 4.2% - 4.6%, from 4.7% in November, mainly due to an expected decline in food prices following favourable weather conditions in most parts of the country, despite pressure on fuel and electricity prices during the month;
Equities
During the week, the equities market recorded mixed trends with NSE 20 gaining 0.3% and NASI losing 0.3% while NSE 25 remained unchanged, taking their YTD performance to 28.7%, 22.0% and 16.7% for NASI, NSE 25 and NSE 20, respectively. As part of the Kenya Commercial Bank’s (KCB) transformation strategy, which began in upgrading the bank’s technology infrastructure to reduce operational costs and improve clients’ convenience, KCB is set to close 3 of its outlets in the country by the end of June, 2018, effectively bringing the Group’s branch network to 251 from 254 branches as at Q3’2017;
Private Equity
Enko Capital Management, an asset management company based in London and Johannesburg, announced its first-ever investment in French-speaking African Countries from its private equity fund targeting Africa, Enko Africa Private Equity Fund. Branch, a Facebook-linked mobile phone money-lending app, is set to receive an equity investment of Kshs 309.0 mn from the International Finance Corporation (IFC), the World Bank’s private financing arm. This investment is in line with World Bank’s objective of achieving competitive low-cost lending from alternative sources for countries in Sub Saharan Africa where most financing is by Banking Institutions;
Real Estate
The Government continues to push for Public-Private Partnerships (PPPs) in the country with Treasury Cabinet Secretary Hon. Henry Rotich approving plans by Embu University, South Eastern Kenya University (Seku) and Moi University to build hostels through a PPP arrangement. Also during the week, the High Court granted the Ministry of Lands 30 more days to comply with an order to regularize over 3 mn title deeds granted since 2013 as the period earlier issued expired on Monday 18th December 2017;
Focus of the Week
This week, we look into whether there is a real estate bubble in Kenya. We look at the growth drivers of the Kenyan real estate market compared to major property bubbles that have been experienced before in Baltic States, United States and Spain, their causes and how they burst, thereby concluding that the Kenyan market is not experiencing a bubble but a normal real estate cycle, and the rapid price increments witnessed are as a result of low supply and high demand.
- During the week, we continued to hold the annual thanks giving lunch for workers at our construction sites. This week we held a thanks-giving lunch at Amara Ridge and Taraji Heights, our real estate projects in Karen and Ruaka, respectively, as well as with employees at our Corporate Social Responsibility (CSR) development site at Friends Secondary School, Dandora. The annual events are aimed at appreciating the projects’ site employees. See event note here
- Our Investments Analyst, Caleb Mugendi, discussed the evolution of Safaricom's share price at the Nairobi Securities Exchange. Watch Caleb Mugendi on CNBC here
- We continue to showcase our real estate developments through weekly site visits. Watch progress videos and pictures of The Alma, Amara Ridge, The Ridge, and Taraji Heights. The site visits target both investors looking to invest in real estate directly and those interested in high yield investment products to familiarize themselves with how we support our high yields. Key to note is that our cost of capital is priced off the loan markets where all-in pricing ranges from 16.0% to 20.0% and our yield on real estate developments ranges from 23.0% to 25.0%, hence our top-line gross spread is about 6.0%. If interested in attending the site visits, kindly register here
- We continue to see very strong interest in our Private Wealth Management training (largely covering financial planning and structured products), which is at no cost, and is held bi-weekly, but is open only to pre-screened participants. We also continue to see institutions and investment groups interested in the trainings for their teams. The Wealth Management Trainings are run by the Cytonn Foundation under its financial literacy pillar, and if interested in the training for your employees or investment group please get in touch with us through clientservices@cytonn.com or book through this link Wealth Management Training. To view the wealth management training topics click here
- For recent news about the company, see our news section here
- We have 10 investment-ready projects, offering attractive development and buyer targeted returns of around 23.0% to 25.0% p.a. See further details here: Summary of investment-ready projects
- To invest in any of our current or upcoming real estate projects, please visit Cytonn Real Estate
- Cytonn Towers, where we are only selling residential units in the first phase of residential apartments, is currently about 20.0% sold. See Cytonn Towers
- The Alma, which is 55.0% sold. See The Alma
- Amara Ridge has currently 100.0% uptake See Amara Ridge
- Situ Village is currently 22.0% sold. See Situ Village
- The Ridge (Phase 1) is currently 31.0% sold. See The Ridge
- Taraji Heights is currently 14.0% sold. See Taraji Heights
- RiverRun Estates (Phase 1) is currently 11.0% sold. See RiverRun Estates
- With over 10 investment ready projects worth over Kshs 82.0 billon of project value, we shall be very selective on new real estate projects going forward, only focusing on Joint Ventures and real estate opportunities with deep value. We are increasingly focused on private equity deals. Should you have any deals in banking, insurance, education, hospitality and technology sectors, kindly email a teaser to PE@cytonn.com
- We continue to beef up the team with ongoing hires for a Senior Manager, Hospitality and Hospitality Business Manager, among others. Visit our website Careers at Cytonn to apply.
During the week, T-bills were undersubscribed, with the overall subscription rate improving to 84.8%, from 73.7% recorded the previous week, as liquidity improved in the money market supported by Treasury bond redemptions and government payments worth Kshs 75.7 bn and Kshs 32.0 bn, respectively. The subscription rates for the 91, 182 and 364-day papers came in at 22.7%, 89.1%, and 105.5% compared to 36.7%, 77.8%, and 84.3%, respectively, the previous week. Yields on the 91 and 364-day papers remained unchanged at 8.0% and 11.1%, respectively, while the yield for the 182-day paper increased to 10.6% from 10.5% the previous week. The overall acceptance rate came in at 90.8%, compared to 82.3% the previous week, with the government accepting a total of Kshs 18.5 bn of the Kshs 20.4 bn worth of bids received, against the Kshs 24.0 bn on offer. The government is still behind its domestic borrowing target for the current fiscal year, having borrowed Kshs 78.6 bn, against a target of Kshs 197.2 bn (assuming a pro-rated borrowing target throughout the financial year of Kshs 410.2 bn budgeted for the full financial year as per the Cabinet-approved 2017 Budget Review and Outlook Paper (BROP)).
Following the undersubscription of the previous two re-opened bonds, a 15-year (FXD 1/2008/15) and a 10-year (FXD 1/2017/10), the government has moved back to the market with a tap sale to raise Kshs 20.0 bn. The last bid was undersubscribed with the subscription rate coming in at 73.0% and the acceptance rate was low at 45.9%. For the two bonds the weighted average yields came in at 12.6% and 13.1% and will be the going yields for the tap sale. The tap sale is running from Tuesday 19th December 2017 to Thursday 28th December 2017, and will provide an opportunity for investors who missed out in the issue to participate.
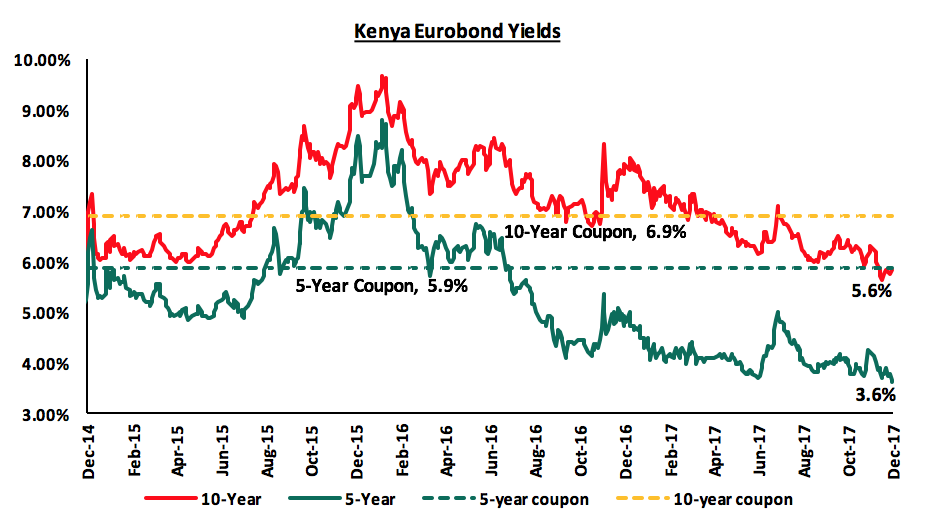
According to Bloomberg, yields on the 5-year and 10-year Eurobonds remained unchanged during the week, to close at 3.6% and 5.6%, respectively. Since the mid-January 2016 peak, yields on the Kenya Eurobonds have declined by 5.2% points and 4.0% points for the 5-year and 10-year Eurobonds, respectively, due to the relatively stable macroeconomic conditions in the country. The declining Eurobond yields and stable rating by Standard & Poor (S&P) are indications that Kenya’s macro-economic environment remains stable and hence an attractive investment destination. However, concerns from Moody’s and the International Monetary Fund (IMF) around Kenya’s rising debt to GDP levels may see Kenya receive a downgraded sovereign credit rating.
The Kenya Shilling appreciated marginally by 0.1% against the US Dollar during the week to close at Kshs 103.1 from Kshs 103.2, the previous week as remittances exceeded demand from oil importers. On a year to date basis, the shilling has depreciated against the dollar by 0.6%. In our view, the shilling should remain relatively stable against the dollar in the short term supported by (i) expected calm in the political front as the government settles into office, (ii) the weakening of the USD in the global markets as indicated by the US Dollar Index, which has shed 9.0% year to date, and (iii) the CBK’s intervention activities, as they have sufficient forex reserves, currently at USD 7.1 bn (equivalent to 4.8 months of import cover).
We are projecting the inflation rate for the month of December to decline marginally to a range of between 4.2% - 4.6%, from 4.7% in November, due to a decline in food prices following improved weather conditions in most parts of the country, despite pressure on fuel prices during the month that increased by 1.0%, 4.2% and 7.6% for petrol, diesel and kerosene, respectively. In 2018, we expect upward pressure on inflation, though minimal, due to rising transport costs brought about by expected increases in diesel and petrol prices due to the gradual recovery in global oil prices. Food inflation is however expected to remain subdued and hence we expect 2018 inflation to average within the government target range of 2.5% - 7.5%, compared to 2017, which we expected to average around 8.0%.
Rates in the fixed income market have remained stable, and we expect this to continue in the short-term as the government rejects expensive bids despite being behind their borrowing target. However, a budget deficit that is likely to result from depressed revenue collection creates uncertainty in the interest rates environment as any additional borrowing in the domestic market to plug the deficit could lead to upward pressures on interest rates. Our view is that investors should be biased towards short-to medium-term fixed income instruments to reduce duration risk.
During the week, the equities market recorded mixed trends with NSE 20 gaining 0.3% while NASI lost 0.3% with NSE 25 remaining unchanged, taking their YTD performance to 28.7%, 22.0% and 16.7% for NASI, NSE 25 and NSE 20, respectively. This week’s performance was driven by gains in large cap stocks such as KCB Group and DTBK, which gained 1.8% and 1.0%, respectively, while Safaricom lost 1.9%. Since the February 2015 peak, the market has lost 3.3% and 32.4% for NASI and NSE 20, respectively.
Equities turnover declined by 18.7% to USD 30.6 mn from USD 37.6 mn the previous week. Foreign investors remained net sellers with a net outflow of USD 1.1 mn compared to a net outflow of USD 2.7 mn recorded the previous week. We expect the market to remain supported by improved investor sentiment following the conclusion of the elections and as investors take advantage of the attractive stock valuations.
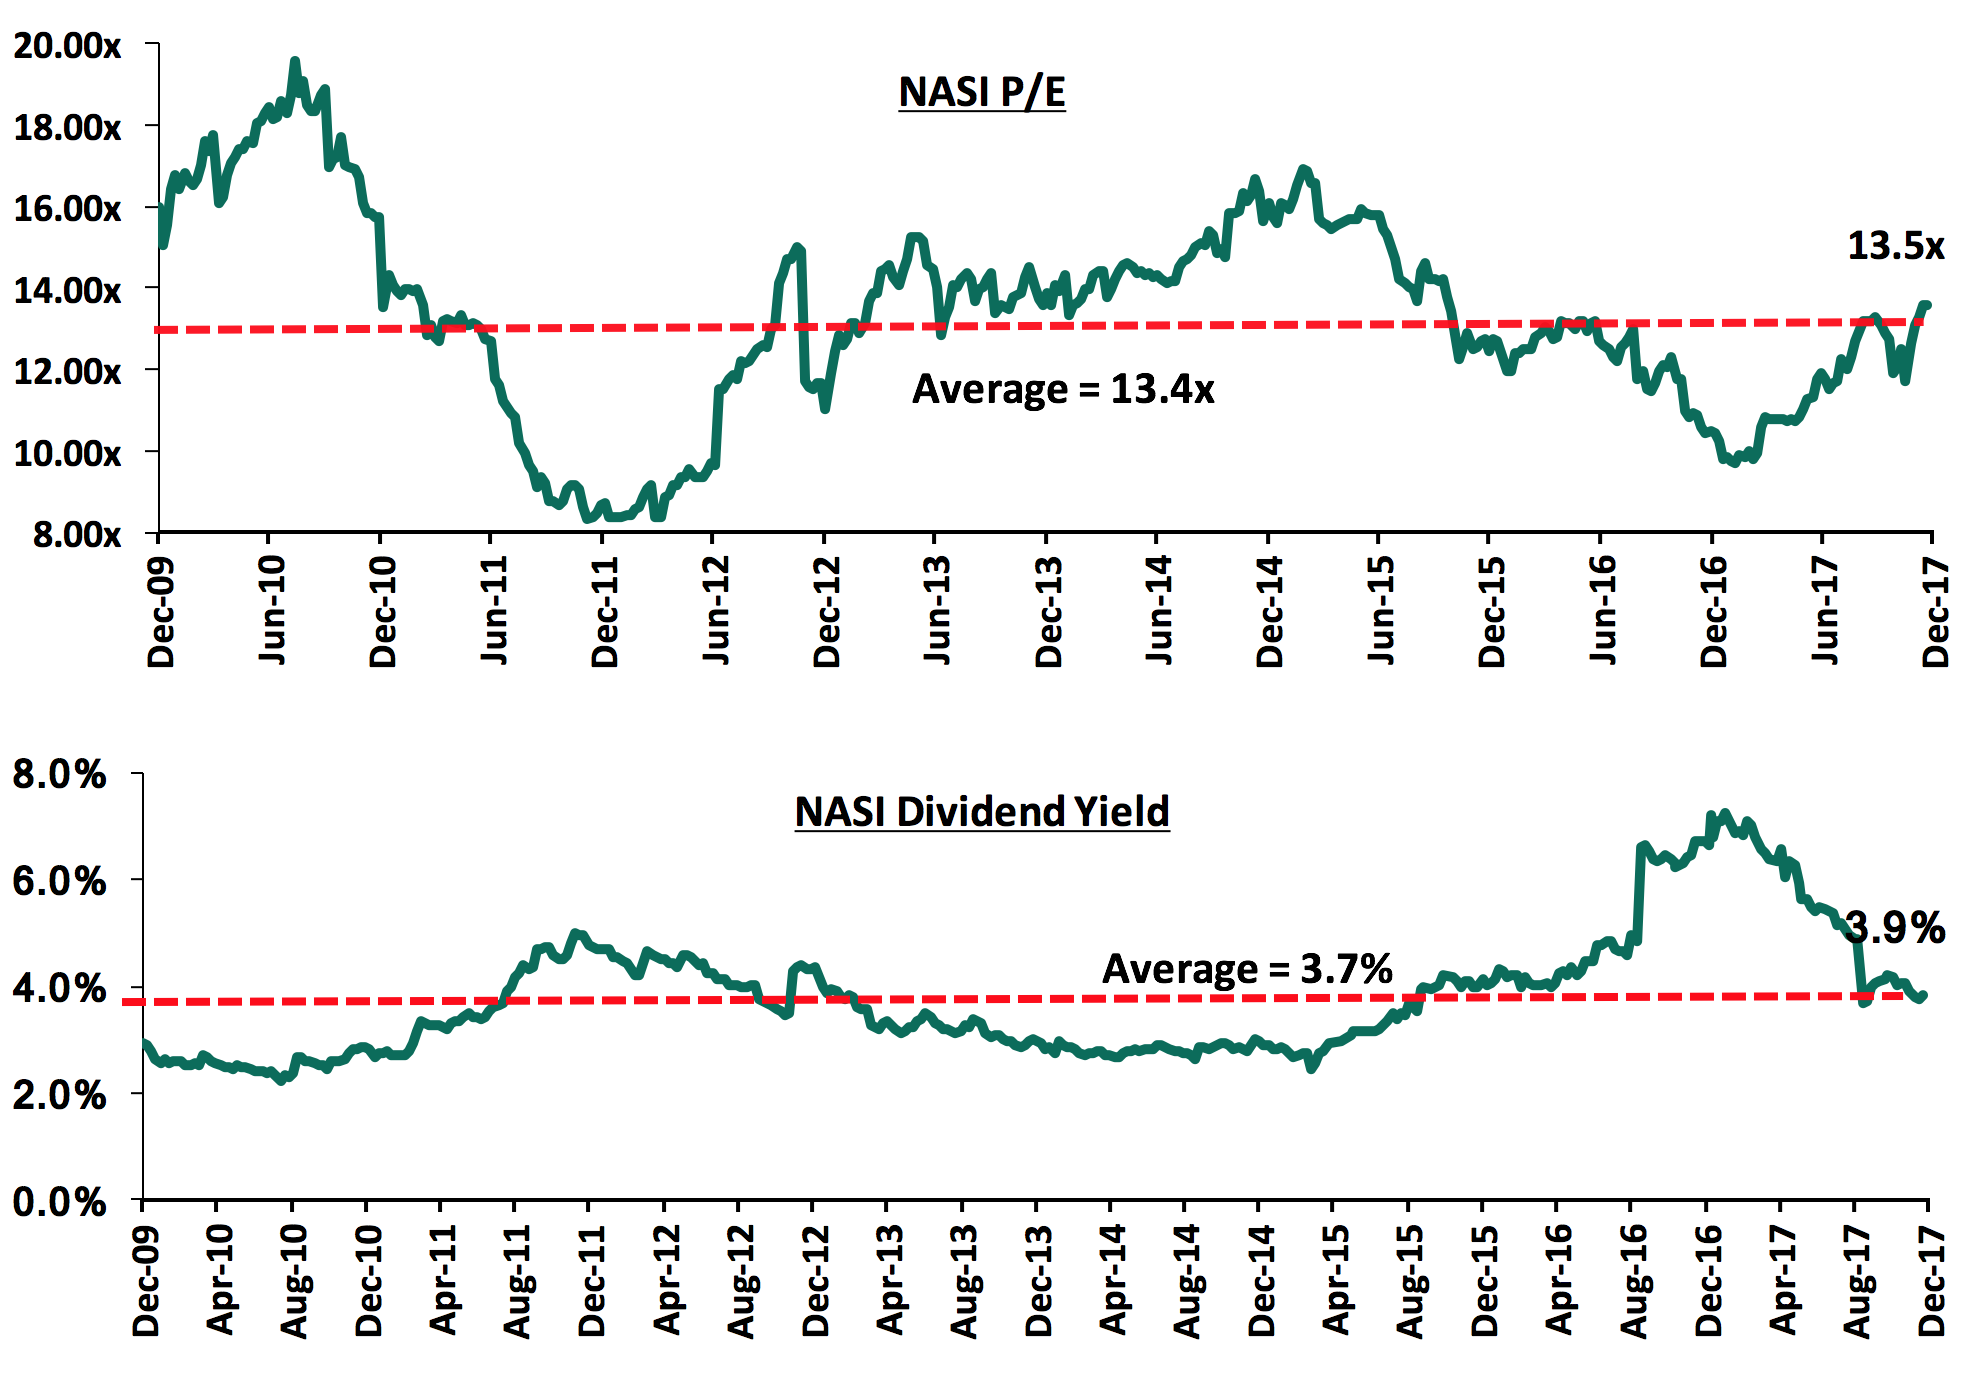
The market is currently trading at a price to earnings ratio (P/E) of 13.5x, slightly above the historical average of 13.4x, and a dividend yield of 3.9%, compared to a historical average of 3.7%. In our view, there still exist pockets of value in the market, with the current P/E valuation being 20.0% below the most recent peak of 16.9x in February 2015. The current P/E valuation of 13.4x is 39.6% above the most recent trough valuation of 9.7x experienced in the first week of February 2017, and 62.9% above the previous trough valuation of 8.3x experienced in December 2011. The charts below indicate the historical P/E and dividend yields of the market.
In response to the challenging operating environment, banks have increasingly adopted cost rationalization measures such as laying off staff, closure of branches, reviewing operating hours for some branches, or outright sales in the case of Tier III banks, all in a bid to remain competitive since the implementation of the interest rate cap. KCB Group is the latest to announce plans to close three of its branches in the country by the end of June, 2018. This will bring KCB Group’s branch network to 251 from 254 branches as at Q3’2017. This step is part of the bank’s transformation strategy, which began with an investment of Kshs 2.5 bn in upgrading the bank’s technology infrastructure to reduce operational costs and improve clients’ convenience. 2017 being the year in which the full impact of the Banking (Amendment) Act, 2016 was felt, we have witnessed banks’ push for efficiency gather pace to balance off the reduction in profitability as they shy away from a physical branches model, which is very expensive compared to other alternative channels such as digital platforms. The table below highlights the restructuring in the Kenya banking sector highlighted by the number of staff retrenched and branches closed by financial institutions:
|
Kenya Banking Sector Restructuring |
|||
|
No |
Bank |
Staff Retrenchment |
Branches Closed |
|
1 |
Bank of Africa |
- |
12 |
|
2 |
Barclays Bank |
301 |
7 |
|
3 |
Ecobank |
- |
9 |
|
4 |
Equity Group |
400 |
7 |
|
5 |
Family Bank |
Unspecified |
- |
|
6 |
First Community Bank |
106 |
- |
|
7 |
KCB Group |
223 |
4 |
|
8 |
National Bank |
Unspecified |
- |
|
9 |
NIC |
32 |
Unspecified |
|
10 |
Sidian Bank |
108 |
- |
|
11 |
Standard Chartered |
300 |
4 |
|
12 |
I&M Holdings |
- |
Unspecified |
|
Total |
1,470 |
43 |
|
Below is our Equities Universe of Coverage:
|
all prices in Kshs unless stated otherwise |
||||||||
|
No. |
Company |
Price as at 15/12/17 |
Price as at 22/12/17 |
w/w Change |
YTD Change |
Target Price* |
Dividend Yield |
Upside/ (Downside)** |
|
1. |
NIC*** |
35.5 |
33.8 |
(4.9%) |
29.8% |
61.4 |
3.5% |
85.4% |
|
2. |
DTBK |
191.0 |
193.0 |
1.0% |
63.6% |
281.7 |
1.4% |
47.4% |
|
3. |
KCB Group |
42.0 |
42.8 |
1.8% |
48.7% |
59.7 |
7.1% |
46.7% |
|
4. |
Barclays |
9.8 |
9.8 |
(0.5%) |
15.0% |
12.8 |
10.2% |
41.5% |
|
5. |
Liberty |
12.9 |
12.5 |
(3.1%) |
(5.3%) |
16.4 |
0.0% |
31.2% |
|
6. |
Kenya Re |
20.0 |
19.7 |
(1.5%) |
(12.4%) |
24.4 |
3.7% |
27.6% |
|
7. |
Co-op Bank |
16.0 |
15.9 |
(0.6%) |
20.5% |
18.6 |
5.8% |
22.7% |
|
8. |
I&M Holdings |
120.0 |
127.0 |
5.8% |
41.1% |
150.4 |
2.5% |
20.9% |
|
9. |
Jubilee Insurance |
470.0 |
495.0 |
5.3% |
1.0% |
575.4 |
1.9% |
18.1% |
|
10. |
Sanlam Kenya |
28.8 |
27.8 |
(3.5%) |
0.9% |
31.4 |
1.0% |
14.0% |
|
11. |
Britam |
14.0 |
13.8 |
(1.8%) |
37.5% |
15.2 |
1.5% |
12.1% |
|
12. |
HF Group*** |
10.8 |
10.8 |
0.0% |
(23.2%) |
11.7 |
0.8% |
9.8% |
|
13. |
Equity Group |
40.3 |
40.3 |
0.0% |
34.2% |
42.3 |
4.4% |
9.5% |
|
14. |
CIC Group |
5.8 |
5.8 |
0.0% |
52.6% |
6.2 |
1.8% |
8.7% |
|
15. |
Stanbic Holdings |
82.0 |
82.0 |
0.0% |
16.3% |
79.0 |
5.1% |
1.4% |
|
16. |
Standard Chartered |
206.0 |
207.0 |
0.5% |
9.5% |
201.1 |
4.2% |
1.3% |
|
17. |
NBK |
9.6 |
9.4 |
(2.1%) |
30.6% |
5.6 |
0.0% |
(40.7%) |
|
*Target Price as per Cytonn Analyst estimates |
||||||||
|
**Upside / (Downside) is adjusted for Dividend Yield |
||||||||
|
***Banks in which Cytonn and/or its affiliates holds a stake |
||||||||
|
For full disclosure, Cytonn and/or its affiliates holds a significant stake in NIC Bank, ranking as the 9th largest shareholder |
||||||||
We maintain a “NEUTRAL” view on equities for investors with short-term investment horizon since, despite the lower earnings growth prospects for 2017, the market has rallied and brought the market P/E back to its’ historical averages. Pockets of value exist, with a number of undervalued sectors like Financial Services, which provide an attractive entry point for long-term investors and thus we are positive for investors with a long-term investment horizon.
Branch, a Facebook-linked mobile phone money-lending app, is set to receive an equity investment of Kshs 309.0 mn from the International Finance Corporation (IFC), the World Bank’s private financing arm. The investment will be channeled towards growing the loan book and increasing the tenure of its loans. Currently, Branch lends out about Kshs 400.0 mn a month to its over 350,000 customers, with loans capped at Kshs 50,000, and repayable between 1 and 12 months, with interest rates ranging from 13.6% per month and can drop to 1.2% p.m. as a borrower builds a credit history. The investment by IFC is in line with World Bank’s objective of achieving competitive low-cost lending from alternative sources in countries in Sub Saharan Africa where most financing is by commercial banks. In Kenya, bank funding accounts for 95% of business funding compared to 40% business funding by banks in developed markets. Branch, which was launched in Kenya in April 2015; has since then disbursed loans worth Kshs 4.0 bn via mobile money platform M-Pesa. It also has a presence in Tanzania and Nigeria.
Enko Capital Management, an Asset Management Company based in London and Johannesburg, announced its investment in French-speaking Africa from its private equity fund targeting Africa, Enko Africa Private Equity Fund. The Fund led a consortium that participated in the public offering of Ecobank Ivory Coast, (ECI) for a total amount of Euros 68.6 mn (Kshs 8.4 bn), on the Regional Securities Exchange (BRVM), however, the value of the shares acquired was not disclosed. Created in April 2014, Enko Africa Private Equity Fund (EAPEF) is a USD 64.0 mn (Kshs 7.1 bn) investment fund that aims to invest in growing African companies operating in a wide range of economic sectors. According to data available on the firm's website, Madison Finance, a leading financial company based in Zambia, is also in the fund's portfolio.
Private equity investments in Africa remains robust as evidenced by the increasing investor interest attributed to (i) rapid urbanization, a resilient and adapting middle class and increased consumerism, (ii) the attractive valuations in Sub Saharan Africa’s private markets, (iii) the attractive valuations in Sub Saharan Africa’s markets compared to global markets, and (iv) better economic projections in Sub Sahara Africa compared to global markets. We remain bullish on PE as an asset class in Sub-Sahara Africa. Going forward, the increasing investor interest and stable macro-economic environment will continue to boost deal flow into African markets.
The Government continues to push for Public – Private Partnerships (PPP) in the country. This week, Treasury Cabinet Secretary Hon. Henry Rotich approved plans by Embu University, South Eastern Kenya University (Seku) and Moi University to build hostels through the public private partnership, the projects are open to both competent local and international bidders. The PPP models involve build operate transfer framework (BOT) which allow investors to build and collect rent over a period approximately 15-20 years before transferring the asset back to the institutions. While PPP’S have various advantages such as, (i) better public services delivery through improved operational efficiency, and (ii) timely projects delivery and within budgets, similar projects by Kenyatta University (K.U) and Moi University are yet to kick off. The key constraint has been lack of legal framework to enable transfer of public land into special purpose vehicles that can attract private capital and bank debt, since, for a PPP to attract private capital into a project, the respective land has to be separated and moved into a special purpose development vehicle that has title to the land. We therefore remain sceptical on the success of the initiative, based on the above challenge and the pilot projects such as construction of Hostels in K.U, in partnership with US fund, Africa Integra yet to break ground three years after the tender award.
The land sector has recorded various activities this week, all focussed on land reforms. These activities include;
- The High Court granted the Ministry of Lands 30 more days to comply with an order on the regularization of over 3 mn title deeds granted since 2013 as the period earlier issued expired on Monday 18th December 2017. This is a follow up to the 12-months suspension issued by the high court to allow for public participation and consultation with the National Land Commission before declaring invalid all forms, regulations and forms of titles such as Title Deeds promulgated by the ministry of lands in an effort to bring onto operation provisions of the Land Act, 2012. The case that led to the above ruling was; the forms and regulations issued by the land Ministry since 2013 were not recognizable under Section 43 of the Lands Registration Act, 2012 due to lack of, (i) the National Land Commission’s (NLC’s) input, (ii) approval by parliament, and (iii) public participation as provided under Article 40 of the Constitution. The High Court has therefore agreed to offer the deadline extension in order to prevent adverse effects on the real estate sector, financial services sector and the economy in general. This judgement is, in our view, a step in the right direction to protect the real estate practitioners. However, the courts should push the Ministry of lands to comply with the ruling as part of land reforms which will provide a conducive environment for a vibrant real estate sector; and
- High Court ordered the Ministry of Land and Physical Planning to honour a 2012 ruling on compensation to Orbit Chemicals Industries Ltd, for a 95.2-acre plot in Embakasi, Nairobi after the High Court found that Land Ministry officials had colluded to illegally take possession of and sub-divide the land.
These rulings by the High court, in our view are a clear indication of the government’s efforts to reform the lands ministry in order to provide a conducive environment for a vibrant real estate sector.
Naivas supermarket opened its 3rd 24-hour store at Bank House located at the junction of Moi Avenue and Kenyatta Avenue within Nairobi’s Central Business District. This effectively brings to a total of 43 outlets for the Kenyan retailer. The retailer has been on an expansion and rebranding strategy that seeks to tap into the uptown Nairobi market, which is currently served mainly by Tuskys and Nakumatt Supermarkets. The retailer continues to implement its expansion strategy despite the tough operating environment characterized by low bank credit accessibility and increased competition from international retailers such as Carrefour as it remains bullish on market performance informed by the increased demand due to growth in middle class income earners, translating to an increase in purchasing power.
The Government announced the completion of 2,000 houses for police and prisons officers located in rural and urban areas such as CID training school, GSU Recce Ruiru, Garissa police station, among others, in a period of 6 months. The project was undertaken using Industrialised building system (IBS), which included Expanded Polystyrene System (EPS), Hollow interlocking concrete blocks, waffles and precast concrete. In our view, this a move in the right direction, as an adoption of Alternative Building Technology (ABT) by the government will give the products validation and thus help in reducing the housing deficit mainly concentrated in the low-income earners bracket.
The real estate sector remains vibrant driven by sustained demand for housing, positive demographics and favourable legal policies being adopted hence reducing opacity and easing transaction processes in the real estate sector.
We first wrote about the commonly discussed topic of a Kenyan real estate bubble in our Focus dated March 2017, and titled ‘Is there a Real Estate Bubble in Kenya?’ It touched on characteristics and conditions precedent for a bubble, and also reviewed the United States and Ireland as case studies, concluding that the Kenyan market is not experiencing a bubble but the normal real estate cycles of rising demand, peaking market, falling market then bottoming out, and the rapid price increments witnessed were a result of low supply and high demand. We revisit the matter this week as we come close to the end of 2017, to evaluate the metrics, consider additional case studies, and review if our previously arrived at conclusion still holds.
We start by defining a bubble and look at previous examples of major real estate bubbles globally, in the Baltic States, United States and Spain, focusing on the causes and how they burst, we then look at the key growth drivers of the Kenyan real estate market, and conclude with an outlook for the sector.
A bubble refers to a periodic phenomenon characterized by an astonishing rise in prices of a commodity or service to levels that are not supported by any fundamentals. For property, it results due to property being too expensive for the general population to afford, which results into lower demand hence prices declining tremendously (what is known as a “bubble bursting”). The main features of a property bubble are:
- Increase in demand for property leading to overvaluation relative to fundamentals that support the pricing. This is due to increasing demand that supersedes supply, which eventually leads to a property bubble as the prices rise to levels that are unaffordable by the public;
- Speculation in the real estate market, which increases demand and hence rapid rise in prices. Most investors become irrational believing that the high prices being witnessed will continue to prevail in the future. This environment thus creates need of acquiring property immediately for speculation hence increased demand of property;
- Easy access to credit: Most economies that have experienced property bubbles are characterized by ease of access to credit. Access to credit also leads to excessive credit growth in the market which increases the demand for property leading to prices increasing to unsustainable levels;
- Disruption in the credit market, which leads to an increase in interest rates leading to an increase defaults levels and non-performing loans, which exposes the banking system. This results into reduced credit supply, and hence demand suddenly falls leading to a sharp fall in prices, and hence loss of value for homeowners, speculators and lenders, and the bubble is said to have burst.
There have been a couple of property bubbles that burst in the world the worst of them being the global financial crisis of 2008, which we analysed in Cytonn Weekly #10. Today, we look at the Baltic States, Spain, and the United States:
- Baltic States Real Estate Bubble
The Baltic States housing bubble was an economic crisis involving major cities in Estonia, Latvia and Lithuania. Between 2005 and 2007, the official house price index for Estonia, Latvia and Lithuania recorded a sharp jump of 104.6%, 134.3% and 106.7%, respectively, against the Euro Area’s 11.8%. The bubble eventually burst in 2007 due to the financial crisis of 2007-2008, which led to weak Baltic economies.
In 2005, property markets rose drastically between 2004 and 2007, with average price per SQM increasing to €1,159 in 2007 from an average of €642 in 2004, an 80.5% hike. Credit was also highly available and at low interest rates. In a bid to obtain the highest market share, Nordic banks relaxed their financial regulations by making credit more readily available leading to historically low rates on the mortgage loans. The low housing taxation rates, coupled with overly optimistic sentiment on the integration with the European Union, led to investors’ risk appetite on property to increase tremendously, which contributed in the ballooning of the real estate bubble.
As of 2007, most properties in the three states were unaffordable by the citizens resulting in a devastating real estate meltdown as no more properties were being sold for the period 2007/2008. However, the price correction began in Estonia by mid-2007, followed by Latvia and Lithuania in mid-2008. The situation worsened after the September 2008 global credit crunch, sending the entire region into a full-blown recession. In 2007, the Baltic States economy began to decelerate due to a slowdown in real estate related activities, with average interest rates for mortgage loans increasing to 10.3% in 2007 from 6.8% in 2006. In 2008, Estonia recorded a decline in GDP growth rates of -9.7% from 11.2% in 2006, Latvia recorded -10.3% from 11.9%, while Lithuania had 3.0% from 7.7% over the same period. This was attributed to lack of domestic demand with the house price index going down by 19.6% in Estonia, 17.8% in Latvia and 15.5% in Lithuania. In 2009, the Baltic States went into a full-blown recession with GDP growth rates recording -14.3%, -17.7% and -14.8% in Estonia, Latvia and Lithuania, respectively
- Spanish Property Bubble
Experts divide the Spanish property bubble in three periods:
- 1985–1991, in which prices nearly tripled;
- 1992–1996, in which prices remained somewhat stable; and
- 1996–2008, in which prices grew exceptionally high. However, with the financial crisis of 2007–08, prices began to fall,
In 1999, a poorly performing Spain joined the European single currency, which enabled it to borrow credit in Euros promoting a credit and property boom. At the same time, Spain received many immigrants from Latin America, Eastern Europe and Northern Africa who sparked demand for property. According to statistics, Spain had more new houses in 2007 than France, Germany, Britain and Italy combined with 13% of its national workforce being in the real estate construction industry. The indebtedness of the Spanish Government tripled in less than 10-years. In 1986, debt represented 34% of disposable income, in 1997 it rose to 52%, and in 2005 it came to 105%. Banks provided cheap mortgages to the masses, covering house, furniture and car costs. In 2006, a quarter of the population was indebted with maturities of more than 15-years. From 1990 to 2004, the average length of mortgages increased from 12 to 25-years. Average property prices rose by at least 155% from 1997 to 2007, which was beyond affordability for majority of the population, resulting in at least 400,000 foreclosures and an eventual bust.
In 2008, new constructions reduced significantly, and the real estate market started to drop fast, with house prices decreasing dramatically by 8.0% in that year. In the period of 2007-2013, Spanish house prices had fallen by 37.0%.
- United States Property Bubble
The US property bubble began with the 2000 dotcom bubble, which led to a recession in the American economy. In a bid to revive it, the Federal Reserve lowered the fed rate and hence low interest rates in the economy that made mortgages cheaper, which led to increased demand for housing. Rapid increase in demand led to house prices increasing from a median of USD 169,000 in 2000 to USD 246,500 at the peak of the bubble in 2006, translating to a CAGR of 7.8%. The market then developed irrational exuberance believing that the prices would continue on an upward trend and hence increased demand. In 2006, with the recovery of the stock market, the Federal Reserve raised the interest rates from the average of 1%-4% to a high of 5.25%. At these high rates, the mortgage subscribers were unable to service the mortgages and hence there were massive defaults in the financial sector.
This led to the prices and value of such mortgage backed securities plunging, leading to huge losses for banks and other financial institutions that had securitized the mortgages, which then led to investors panic and sell-off and hence the bubble burst.
Therefore, as is evident from the three case studies, real estate bubbles are always characterized by overheated economies followed by laxity in lending requirements and low interest rates, which drive house prices higher. This is often followed by massive defaults with foreclosures flooding the market as demand stalls, and soon house prices collapse resulting to more supply than is demanded.
Overview of Kenyan Real Estate
The Kenyan real estate market has grown tremendously, experiencing a boom that is in line with the country’s economic growth, which thus far has been characterized by (i) an expanding middle class, (ii) stable GDP growth which has averaged at 5.2% for the past 5 years with GDP per capita increasing by 260.3% to USD 1,455 in 2016 from USD 403.98 in 2000 following the GDP rebasing in 2014, and (iii) infrastructural development which has opened up new areas for development, especially in the Nairobi Metropolitan Area.
Real estate as a sector has grown over the past two decades to become the fifth largest contributor to the nation’s GDP, and while other sectors’ contribution such as agriculture and manufacturing continue to dwindle, real estate’s contribution has grown from 4.8% in 2010 to 8.4% in 2016, compared to other market such as the US and China where the sector contributed 6.0% and 6.5%, respectively in 2016.
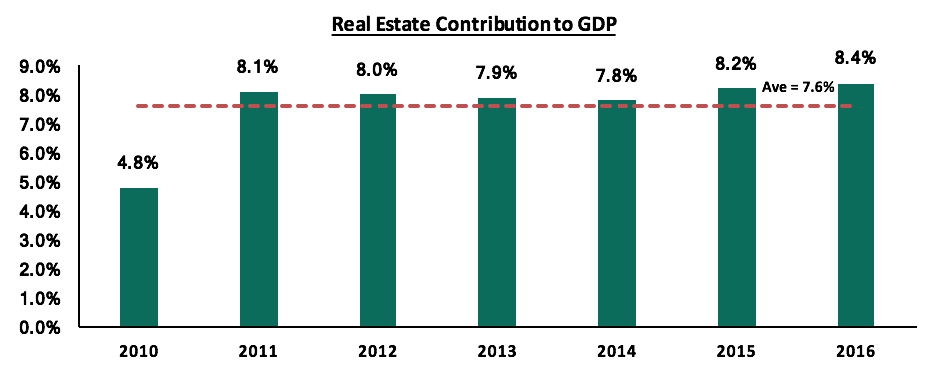
Source: KNBS
The growth of the sector has been characterized by a rise in selling prices with housing in the Nairobi metropolitan area for instance rising to an average of Kshs 31.4 mn in 2016 from Kshs 7.1 mn in 2000, according to the Hass Consult, resulting in many speculating about a real estate bubble.
Real Estate Sector Overview in Kenya – Why some investors confuse this for a bubble
The real estate sector’s growth can be demonstrated by the rise in building approvals, which increased by 128.2% to 308.4 bn in 2016 from 135.1 bn in 2012, as per The Kenya National Bureau of Statistics, Economic Survey 2017. Additionally, the average price for a house has increased to Kshs 31.4 mn in 2016 compared to Kshs 7.1 mn in 2000, a CAGR of 9.7%. This is a clear indication that real estate has become the ideal investment diversification portfolio for investors.
As a result of the sector’s resilient performance despite the long electioneering period, the property prices have held with the low increases in both rents and asking prices, investors have ascribed this to a possible property bubble. This is due to:
- High Returns: The growth of the sector has been mainly characterized by soaring house and land prices, as well as rental rates, resulting in high returns to investors. Over the last half decade, real estate returns have offered returns at an average of 25.0%, higher than the traditional investment classes, which offer an average return of 12.4%. This growth in prices has left some investors apprehensive,
- Oversupply in some themes such as commercial office: As of 2016, the office sector recorded an oversupply of 3.2 mn SQFT, leading to investors speculating a similar outcome for the housing market,
- Peaks and troughs in price growth: As per the Kenya Banker’s Association – Housing Price Index, house prices grew by an average of 0.8% year to date, compared to a 1.8% growth the same period last year leaving investors wondering whether this is a bubble burst. Additionally, some attribute the increase in prices to a boom that is headed for a bust. However, the average price- to-rent ratio in Kenya is 3, compared to bubble periods in places like the US where the price-to-rent ratio was as high as 20 times.
We still see value in the Kenya Real Estate sector since the sector has a couple of supporting fundamentals:
- Demographics: Kenya’s population continues to grow rapidly at double the global rate at an average of 2.6% p.a. and the urbanization rates are high at 4.4%. Additionally, the middle-class population segment has continued to expand thereby increasing disposable income and hence creating real demand for property unlike in a bubble where demand is fuelled by investors interested solely in capital growth, hold it for a short period before reselling it at a higher price,
- Stable economy: In a bubble economy, the burst is most often than not followed by an economic recession. However, the Kenyan real estate growth has been supported mainly by a stable and growing economy as evidenced by the country’s growing GDP, which has averaged at 5.1% for the last five years with 2017’s expected to come in at 4.7% - 5.2%, against Sub-Saharan Africa’s 2.7%. The country’s GDP has grown to 5.8% in 2016 from 4.6% in 2012 with GDP Per Capita growing by 26.0% to USD 1,455 from USD 1,155 in the same period,
- Low Credit supply: Property bubbles are mainly characterized by ‘cheap’ mortgages and access to credit, available to a majority of the population and at low interest rates thus making house buying possible for a majority of the population. With the introduction of the Banking (Amendment) Act, 2015 in Kenya, we have witnessed a steep decline in credit advancement to the private sector with record lows of 1.6% in August 2017, down from 5.4% in August 2016, before the bill was amended into law. This is a clear indication that home buyers rely on cash buys and thus, mortgage rates remain at record lows - and could fall further as lending institutions become more unwilling to extend credit to individuals. As per the CBK, the number of mortgages fell by 1.5% at the end of 2016, to 24,085 from 24,458 in 2015,
- High genuine demand: A real estate bubble bursts when supply exceeds demand. However, according to the World Bank, the country has a deficit of 2.0 mn units, with the National Housing Corporation estimating an annual demand of 200,000 units. This is supported by the rapid population growth, which means the demand for properties is real and is expected to continue to be so as the country is only able to provide 35,000 homes annually. Additionally, entry of long term foreign investors has added onto the demand, especially for high end properties,
- Increase in house prices is in tandem with an increase in earnings: A real estate bubble more often than not results from a credit-driven market resulting in a bust where households are overridden with debt beyond their property’s value. According to Kenya National Bureau of Statistics Economic Survey 2017, wage earnings increased to Kshs 1.6 tn in 2016 from Kshs 1.5 tn in 2015, a 9.1% increase against a 7.4% increase in property prices. This indicates that there is still room for property prices to grow in order to match the population’s income,
- Availability of land and government incentives: Land prices in Kenya have been driven by a justified demand and infrastructural development that has opened up more areas for development. States that have experienced a property bubble are characterized by limited land supply, against a high population growth coupled by government’s negative restrictions against densification; as seen in the United States bubble as well as a raise in stamp duty in the Spanish bubble. Recently, the government has been keen on streamlining the land ministries to make it easier for developers to acquire land and introduced a new law that will enable densification of exclusive low-rise residential areas.
Conclusion
The key indicators of a bubble are:
- More people taking on more debt. However, in Kenya today, the key constraint is access to credit as the government is crowding out the private sector given the 2016 interests rate cap law. For instance, mortgage accounts were reported to have decreased by 1.5% by December 2016 to 24,085 from 24,458 the same period in 2015,
- Relaxed lending standards. Despite the Kenyan government lowering interests rates, institutions have tightened their credit supply to the private sector, especially for long-term loans such as mortgages, as evidenced by the slowdown in private sector credit growth, at 2.0% in October 2017 compared to 4.6% in October 2016 and 19.5% in October 2015,
- Historically low interest rates. From our case studies, interest rates declined to below 7%. In Kenya, The Bank Amendment Act of 2015 capped bank lending rates to a maximum of 14.0%, which is 4% above the Central Bank Rate that has remained at 10% throughout 2017,
- High demand from high levels of speculation. Unlike in a bubble where most of the demand is driven by speculators, in Kenyan the demand is driven by real demand which is estimated to be at least 200,000 units p.a.
- Incredible rise in house prices. As is evidenced in our case studies, a housing bubble is characterized by most often than not, a triple digit growth in prices and as per the IMF standards, the decline in a bust must be at least 14% over a period of 16 quarters. In Kenya however, the prices are growing, albeit softening, with 2016 recording an average appreciation rate of 7.4%, which slowed to 3.8% in 2017, as per the Cytonn Residential Report 2017.
From the above it is clear that the real estate sector in Kenya is not in a bubble based on the five indicators. The sector is experiencing the normal real estate cycles, and the rapid price increments being witnessed are a result of low supply and high demand. Thus, it still presents attractive opportunities for investors. Additionally, there are ways to invest either directly or indirectly and ensure that you continue to get the best returns.
- For direct long-term investors, there’s opportunity in land banking (buying land for capital appreciation) while despite the reported office sector glut, there continues to be a high demand for Grade A office stock to support the multinational firms and growing local firms.
- For indirect investment, Real Estate Investment Trusts (REITs), where investors buy shares in a company that operates rental property and passes the rental income to its investors in form of dividends, is gaining traction in the country.
- Modern firms also offer other ‘sharp’ ways in the form of client-based structured products such as:
- Real Estate Backed Medium-Term Notes (MTN), a debt note that usually matures in 5–10 years and is backed by cash flows from Real Estate projects, and
- A short to medium-term debt obligation issued to finance a project or multiple projects such as Cytonn Project Notes (CPN)
Disclaimer: The views expressed in this publication are those of the writers where particulars are not warranted. This publication, which is in compliance with Section 2 of the Capital Markets Authority Act Cap 485A, is meant for general information only, and is not a warranty, representation, advice or solicitation of any nature. Readers are advised in all circumstances to seek the advice of a registered investment advisor.

- Talk to us
- Kenya
- P.O Box 20695 - 00200, Nairobi, Kenya
- Cell +254709101200
- Tel +254709101200
- WhatsApp +254741676635
- United States
- +254709101200
- DOWNLOAD OUR APP
-


- Kenya
- 8th Floor, Pinetree Plaza, Kaburu Drive, Ngong Road, Nairobi, Kenya
- USA
- Suite 1150, 1775 Eye Street NW, USA, Washington DC 20006, USA
- Investments
- High Yield
- Private Equity
- Real Estate
- Real Estate
- RiverRun Estates
- Cytonn Towers
- The Ridge
- Taraji Heights
- The Alma