Oct 14, 2018
Corporate governance constitutes the mechanisms, processes and relations used to direct and manage the business and affairs of a company. Corporate governance is founded on the pillars that businesses have to practice accountability to stakeholders, fairness, have transparency in business activities, and exhibit independence in decision making. Corporate governance has taken centre stage given the recent bank failures and operational crisis in firms such as:
- ARM Cement, after three-years of incurring heavy losses following an ambitious yet ultimately unsuccessful expansion plan, became the second major company to be placed under administration in 2018. In August 2018, the NSE issued a statement that it had suspended trading of ARM’s shares,
- Chase Bank, which was also placed under receivership in 2016 following cases of unsound banking practices such as large unsecured loans to directors. In 2018, it was acquired by SBM Holdings,
- Uchumi and Nakumatt, which have experienced cash-flow problems due to mismanagement of the retailers, with the latter being put under administration earlier this year,
- Imperial Bank, which was placed under receivership by the CBK in 2015 following what was described as unsound business conditions in the bank,
- Kenya Airways, whose issues around governance came into light following four consecutive years of massive losses resulting from high debt levels after a botched expansion plan, and reduction in passenger numbers, and,
- Other recent investor losses that may be related to failure of corporate governance include: National Bank of Kenya, Mumias Sugar, EA Portland Cement, Home Afrika, and CMC, among others.
The total investor loses that can be associated to failure of corporate governance from the above situations is roughly Kshs. 312.9 bn, consequently demonstrating that improved corporate governance is key to investor protection.
Last year, we released the Cytonn Corporate Governance Report - 2017, in which we highlighted the importance of sound corporate governance in enhancing investor’s confidence that their wealth is secure. Following the significant losses experienced by investors as discussed above, in April this year, ‘The Code of Corporate Governance Practices for Issuers of Securities to the Public, 2015’ by the Capital Markets Authority (CMA) came into full effect. In line with this regulatory effort to increase investor protection, the theme of our report this year is ‘Improved Corporate Governance Key to Investor Protection’. This topical highlights the provisions of the Code as well as the performance from this year’s ranking, covering the following sections:
- The Code of Corporate Governance Practices; A Summary
- Enforcement of the Code by the CMA; Case Study of NBK
- Outlook; Areas That Could be Improved, and
- Cytonn Corporate Governance Report - 2018
Section I: The Code of Corporate Governance Practices; A Summary
In December 2015, CMA issued ‘The Code of Corporate Governance Practices for Issuers of Securities to the Public, 2015’. This Code replaced ‘The Guidelines on Corporate Governance Practices by Public Listed Companies in Kenya, 2002’, as the standard for application by both listed and unlisted public companies in Kenya. It was meant to come into effect in March 2017, however since most listed companies were in the middle of their financial years, the deadline for compliance was pushed to April 2018. The Code advocates for the adoption of standards that go beyond the minimum prescribed by legislation. The implementation approach moved away from the “Comply or Explain” approach to “Apply or Explain”. The new approach is principle-based rather than rule-based, and recognizes that a satisfactory explanation for any non-compliance may be acceptable in certain circumstances. This however requires boards to fully disclose any non-compliance with the Code to relevant stakeholders including CMA with a firm commitment to move towards full compliance. The Code still maintains some mandatory provisions, which are the minimum standards that issuers must implement.
The 2015 Code has significantly enhanced the 2002 Guidelines and addresses some of the shortcomings of the previous guidelines. Key highlights of the new Code are as follows:
- Implementation & Oversight: The Code has become more stringent on implementation and oversight. At the end of every financial year, the board is required to disclose in its Annual Report, a statement of policy on good governance and the status of application of this Code. The board is also required disclose to CMA the reasons for any non-application, and clearly indicate the time frame required and the strategies to be put in place towards full application,
- Stakeholder Engagement: Undefined terms such as conflict of interest and stakeholders are now clearly defined. It also provides for previously unmentioned but important issues such as stakeholder engagement and governance, legal compliance and ethical compliance audits to supplement financial audits,
- Conflict of Interest: It more thoroughly provides for conflict of interest arising at all management levels and the roles and duties of directors. It also requires more disclosure by Issuers improving transparency. It is more comprehensive in the issue of efficiency and effectiveness of boards as it introduces mandatory professional training and development for directors and mandates frequent evaluation of the board across various areas. In addition, it gives guidelines on multiple directorships, independence of directors and restrictions for alternate representatives, and,
- Performance Evaluation: Performance evaluation is also a key issue. The Code requires the board to undertake an annual evaluation of its own performance, the performance of the Chairperson, that of its committees, individual members, the Chief Executive Officer and Company Secretary. In addition, the board is required to disclose in its annual report, its policies for remuneration including incentives for the board members and senior management.
Section II: Enforcement of the Code by the CMA; Case Study of NBK
Management of National Bank of Kenya (NBK) faced allegations of misrepresentation of financial statements for the periods ended 30th June 2015 and 30th September 2015, where profits were allegedly overstated. During the same period, approximately Kshs 1.0 bn was alleged to have been siphoned out of the bank through an embezzlement scheme. The misrepresentation of financial statements was occasioned by premature recognition of sale of assets amounting to Kshs 800.0 mn and under provisioning of loan amounts and wrongful recognition of interest income leading to the overstatement of profit in the respective periods. The bank had published unaudited financial statements reporting profits of Kshs 1.7 bn for the quarter ended 30th June 2015, and Kshs 2.2 bn for the quarter ended 30th September 2015, but subsequently reported a loss of Kshs 1.2 bn in its audited financial statements for the period ended 31st December 2015.
In April 2018, the Board of CMA issued a statement that it had taken administrative action against the NBK Board Members and former Senior Managers who served at the bank as at 31st December 2015 for the alleged misrepresentation of financial statements and embezzlement of funds at NBK. The Authority also recommended to the Office of the Director of Public Prosecutions the prosecution of some of the Senior Managers and further criminal investigations of additional individuals. Based on whistle-blower information, CMA conducted an inquiry into the affairs of the bank leading to the commencement of enforcement proceedings against the then NBK Board Members and its Senior Managers; the Former Managing Director, the Former Chief Credit Officer, the Former Chief Finance Officer, the Former Ag. Chief Finance Officer, the Former Head of Treasury, the Former Director Corporate and Institutional Banking, and the Former Relationship Manager for Business Banking. The following was the outcome of the proceedings:
- CMA disqualified the Former Managing Director from holding a board position in a public issuer of securities or working for a licensed entity for a period of 3-years and imposed a financial penalty of Kshs 5.0 mn for his role in the ineffective management of the bank, his failure to ensure the board was furnished with complete and reliable information, and for the misrepresentation of the financial statements;
- CMA disqualified the Former Head of Treasury and the Former Chief Finance Officer from holding board positions for a period of 10-years and 3-years, respectively, in line with evidence of their active involvement in the embezzlement scheme together with recommending their criminal prosecution to the Director of Public Prosecutions;
- The Former Head of Treasury was fined Kshs 104.8 mn being twice the amounts so far traced to him from the embezzled funds. CMA, in addition, sought restriction on two properties associated with him, which were purchased with the embezzled funds;
- The Former Chief Finance Officer was fined Kshs 1.0 mn for his role in the embezzlement scheme;
- The Former Ag. Chief Finance Officer and the Former Chief Credit Officer were also fined Kshs 1.0 mn each for misrepresentation of financial statements, and failure to relay correct information on provisioning to the board, respectively.
CMA reinforced the importance of board members and key officers in public issuers of securities exercising their fiduciary responsibilities to protect shareholders’ investments and investors interests by putting in place internal controls and improving capacity of board audit committees to ensure financial statements published disclose accurate and complete information.
This is just a case study of recent CMA action on corporate governance issues, The Authority has become much more aggressive in tackling malfeasance, and for that the market needs to applaud them for this positive step. In its Capital Markets Report for 2017, The Authority reported a total of 21 cases of regulatory action against market participants.
Section III: Outlook; Areas That Could be Improved
The Code has had extremely positive results so far as we have witnessed more enforcement actions, better transparency and better corporate governance reporting in annual reports this year; majority of the companies have now included a statement of corporate governance as a standalone section in their reports, providing more details on their corporate governance status. However, there are some issues that the CMA needs to address;
- Enforceability will remain a challenge because some of the provisions of the 2015 Code do not, by their nature, declare themselves enforceable. An example; One provision states that Boards are required to be of a “sufficient size”. The statement remains subject to interpretation and cannot be prescribed as it will vary from company to company depending on several considerations such as the size of the firm and the nature of its business,
- There is also need for clarification on some of the provisions of the 2015 Code. It would be useful for the CMA to provide templates or further guidelines for board policies such as the evaluation toolkit and annual work plan it must adhere to,
- The Authority shall need to clarify the consequences of noncompliance and the instances in which an explanation by a company for noncompliance shall be sufficient,
- There is need to harmonise the various corporate governance guidelines being issued by the various authorities because the Codes have conflicting provisions. For example, the Central bank of Kenya Prudential Guidelines for Institutions Licensed under the Banking Act, 2013 prohibits directors of such institutions from holding more than two (2) concurrent directorships while the 2015 Code allows them to hold three (3) concurrent directorships,
The Authority needs to address the market perception, however false, that some market participants are untouchable. For example, the full market knowledge that Britam irregularly used insurance funds to meet The Authority’s threshold for an IPO gives the appearance of untouchables. The claim by Britam that it lost up to Kshs. 9.0 bn of client funds in its CMA regulated subsidiary, and while at the same time invoking The Authority’s name in reassuring their clients that no money was lost comes across as aiding market mischief. Market manipulation and mischief, in plain sight and in some circumstances invoking the name of The Authority, may be construed as aiding and abetting market manipulation by market participants – a claim of loss of colossal sums by a listed company and a regulated asset manager ought to attract regulatory review. (For full disclosure, we are engaged with Britam in active litigation, however the analysis remains objective.)
In conclusion, good governance is to key to exemplary and sustainable performance of a company. The 2015 Code has moved corporate governance standards in Kenya one step closer to international corporate standards. Companies need to understand the 2015 Code to enable them to implement the necessary processes and policies so as to improve their performance and ensure the sustainability of this performance. This is ultimately in the interest of both the company and the stakeholders.
Section IV: Cytonn Corporate Governance Report 2018
Summary of Methodology: Cytonn’s Corporate Governance Report 2018 ranks 47 listed companies, each with a market cap of above Kshs 1.0 bn, using 24 metrics on their corporate governance structure. The companies are ranked on these 24 metrics to arrive at a composite score that provides a deeper understanding of the level of corporate governance in each firm. The main areas of analysis are in the (i) board composition, (ii) audit functions, (iii) CEO tenure and evaluation, (iv) remuneration, and (v) transparency. The score is a diffusion score with 50.0% as the base, meaning that any score below 50.0% is flagged as having serious corporate governance issues, while any score above 50.0% is skewed towards proper governance. However, the variance from 100% gives the risk associated with corporate governance. We sent the draft analysis and data to all the listed companies for their comments and confirmation. Of the 47 companies, 18 responded.
We are glad to note that 2017/18 has witnessed a notable improvement on corporate governance and corporate governance reporting. This has led to more transparency and better disclosure, which we believe have been as a result of regulation aimed at establishing proper oversight. This increased level of oversight and improved quality of corporate governance reporting informs the theme of our report this year, ‘Improved Corporate Governance Key to Investor Protection’.
Summary of Key Findings:
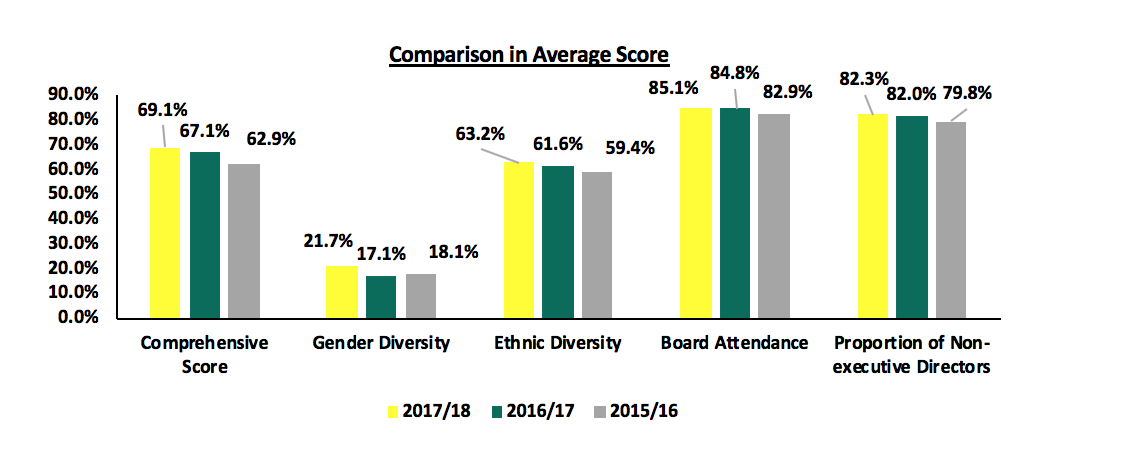
- Improvement in Overall Governance: Compared to last year, the average performance for companies has improved by 2.0% points to an average score of 69.1% from 67.1% in 2017, and by 6.2% points from 62.9% in 2016, mainly driven by better disclosures around governance. This is an indication that Kenyan listed companies are firming up to better governance practices, which is expected to lead to better performance of various companies,
- Improvement in Ethnic Diversity: Companies also registered better performance on ethnic diversity with an average score of 63.2% compared to a score of 61.6% registered last year. A higher score on ethnic diversity indicates better assortment in board composition, which improves the quality of decision making and enhances creativity and innovation translating to better performance by the companies,
- Improvement in Gender Diversity: The average score on gender diversity, also improved to 21.7% from 17.1% in 2017,
- Improvement in Board Attendance: The average board attendance also increased to 85.1% from 84.8% in 2016,
- Improvement in % of Non-Executive Directors: Average proportion of non-executive directors on the board also increased to 82.3% from 82.0% in 2016, and,
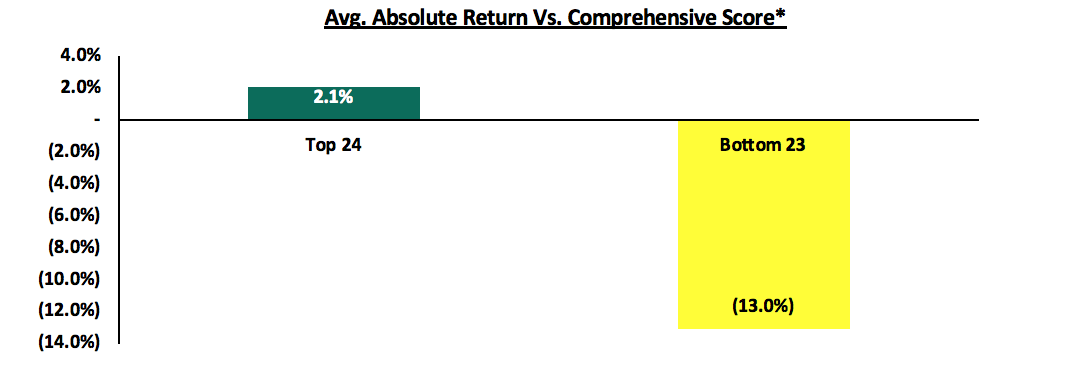
- Strong Correlation Between Governance Score and Returns to Shareholders: The top 24 companies in the Cytonn Corporate Governance Report (CGR) have delivered an absolute return of approximately 2.1% over the last 5-years compared to the bottom 23 companies, which have delivered an absolute return of (13.0%) over the last 5-years.
The improvement across the board is an indication that more companies are on track to full compliance to the CMA’s Code of Corporate Governance Practices, which will be key in achieving this. Below is a graph highlighting the comparison in average score under the comprehensive score, ethnic diversity and gender diversity categories.
Below is a summary of the top 10 companies in the categories cited above;
|
Table 1 - Top 10 by Comprehensive Score |
||||
|
Company |
Current Score |
Previous Score |
Current Position |
Previous Position |
|
KCB |
85.4% |
91.7% |
1 |
1 |
|
NSE |
85.4% |
81.3% |
1 |
5 |
|
Safaricom |
85.4% |
81.3% |
1 |
5 |
|
DTB Bank |
83.3% |
85.4% |
4 |
2 |
|
CIC |
81.3% |
79.2% |
5 |
8 |
|
Standard Chartered |
79.2% |
83.3% |
6 |
3 |
|
NIC |
79.2% |
68.8% |
6 |
21 |
|
Kenya Power & Lighting Co Ltd |
79.2% |
79.2% |
6 |
8 |
|
BAT Kenya |
77.1% |
79.2% |
9 |
8 |
|
East Africa Breweries |
77.1% |
79.2% |
9 |
8 |
|
Table 2 - Top 10 by Ethnic Diversity Ranking |
||||
|
Company |
Current Score |
Previous Score |
Current Position |
Previous Position |
|
Sanlam Kenya |
87.5% |
87.5% |
1 |
1 |
|
ARM** |
87.5% |
77.8% |
1 |
7 |
|
East Africa Breweries |
81.8% |
81.8% |
3 |
3 |
|
Kenya Re |
81.8% |
72.7% |
3 |
15 |
|
Kenol/Kobil |
80.0% |
75.0% |
5 |
9 |
|
National Bank |
80.0% |
75.0% |
5 |
10 |
|
Nation Media Group |
80.0% |
71.4% |
5 |
17 |
|
KCB Group |
77.8% |
81.8% |
8 |
2 |
|
BAT Kenya |
77.8% |
77.8% |
8 |
6 |
|
Standard Group |
77.8% |
75.0% |
8 |
14 |
** ARM Significantly improved it’s score after the recent board reshuffle in an effort to remedy the current ongoing crisis
|
Table 3- Top 10 by Gender Diversity Rank |
||||
|
Company |
Current Score |
Previous Score |
Current Position |
Previous Position |
|
Barclays |
50.0% |
50.0% |
1 |
1 |
|
Mumias Sugar |
44.4% |
40.0% |
2 |
2 |
|
Kenol/Kobil |
40.0% |
0.0% |
3 |
41 |
|
Stanbic Holdings |
40.0% |
18.2% |
3 |
24 |
|
Centum |
40.0% |
27.3% |
3 |
13 |
|
B.O.C Kenya |
37.5% |
37.5% |
6 |
3 |
|
Safaricom |
36.4% |
30.0% |
7 |
7 |
|
Housing Finance |
33.3% |
33.3% |
8 |
4 |
|
Kengen |
33.3% |
27.3% |
8 |
15 |
|
BAT Kenya |
33.3% |
22.2% |
8 |
17 |
In comparison to last year, a number of companies recorded improvement in their comprehensive score due to various reasons, as outlined below:
- Limuru Tea: It was the most improved company with a score of 41.7% from a score of 16.7% in our last report. This was due to (i) increase of board members to an odd number, (ii) introduction of a female board member, and (iii) better disclosure on board member details, work experience, and remuneration.
- Kenya Re: Kenya Re’s score improved to 75.0% from a score of 60.4% last year. This was due to better disclosures around the directors’ ages and CEO’s contract of service and positive correlation between remuneration and earnings.
- Carbacid: The company’s score improved to 75.0% from 60.4% also due to better disclosure on board composition, correlation between remuneration and earnings and an odd number of board members.
Key to note from all these companies is the common improvement in disclosures, which forms an integral part in corporate governance.
On the contrary, a number of companies also recorded declines in their comprehensive score, including:
- ARM Cement: ARM Cement recorded a decline to a comprehensive score of 58.3% from a score of 66.7% in our last report. This was due to lack correlation between board remuneration and earnings, shareholding of the board, and evenness of the board.
- I&M Holdings: The company’s score declined to 66.7% from a score of 75.0% last year attributed to increase in tangible common ratio, change of audit committee composition to include more non-executive directors and increased director’s shareholding.
- Barclays: Barclays saw its score drop to 72.9% from a previous score of 79.2%. This is due to change in composition of the audit committee to include more non-executive board members, and increased loans to directors.
Correlation between governance score and returns: We continue to highlight the strong correlation between corporate governance and returns on stocks of the listed entities.
- The top 24 companies in the Cytonn Corporate Governance Report (CGR) have delivered an absolute return of approximately 2.1% over the last 5-years compared to the bottom 23 companies, which have delivered an absolute return of (13.0%) over the last 5-years, meaning that the advantage to better governance delivered 15.1% better returns to shareholders.
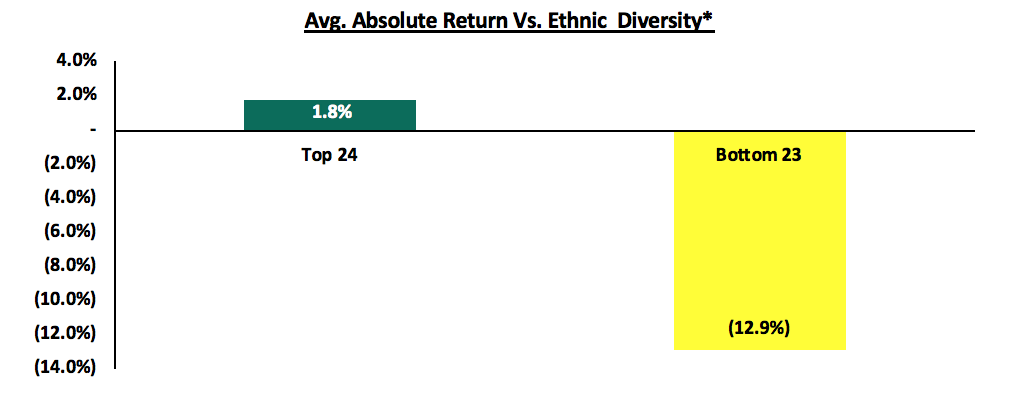
- Top 24 companies under the ethnic diversity criteria recorded a 5-year absolute return of 1.8% compared to a negative return of 12.9% recorded by the bottom 23 companies. This again indicates that the advantage to better governance delivered 14.7% better returns to shareholders as highlighted below:
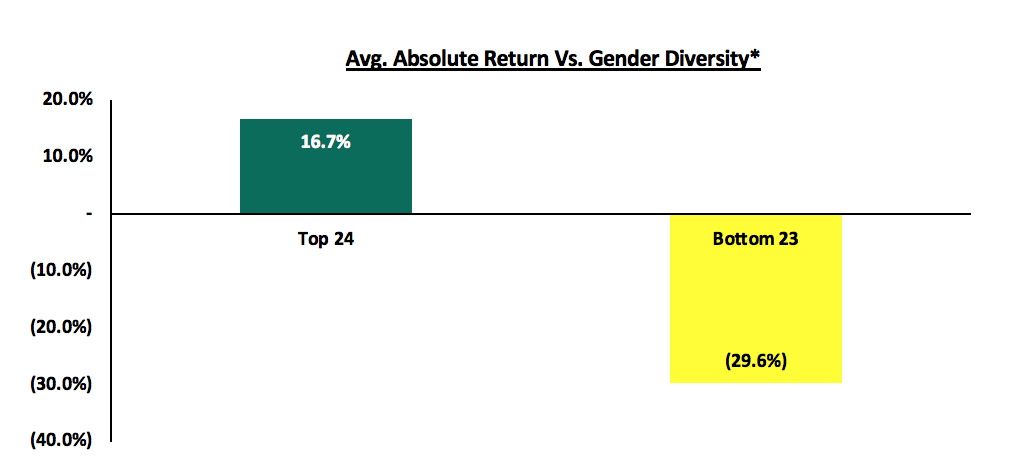
- Under gender diversity, the top 24 companies delivered a 5-year absolute return of 16.7% compared to a negative return of 29.6% recorded by bottom 23 companies. This metric gave the widest margin with the top companies having outperformed the bottom half by 46.3%.
These three graphs indicate the strong correlation between the level of governance in an entity and the investor sentiments on the company as measured by the performance of its stock.
*We have excluded agricultural stocks due to their repricing as they were priced due to their real estate holdings.
As shown in the above graphs, sound corporate governance is essential to well-functioning and vibrant financial markets. Kenyan listed entities are firming up to sound corporate governance practices as shown by overall improvement in market score from 62.9% in 2016 to 69.1% in 2018, the improvement is supported by increased regulation from various bodies and organizations responsible for corporate governance oversight and greater focus on governance, which is essential for stability of the companies and the general market. We therefore hope that the regulations put in place will go a long way in instilling a proper governance culture and ultimately, deepening the capital markets.
For the comprehensive report please see our Cytonn Corporate Governance Report 2018
Appendix: below is a ranking of all the listed entities that we ranked:
|
Cytonn's Corporate Governance Report Comprehensive Score Ranking |
||||||
|
Company |
Current Score |
2017 Score |
2016 Score |
Current Ranking |
2017 Ranking |
2016 Ranking |
|
KCB |
85.4% |
91.7% |
95.8% |
1 |
1 |
1 |
|
NSE |
85.4% |
81.3% |
68.8% |
1 |
5 |
15 |
|
Safaricom |
85.4% |
81.3% |
83.3% |
1 |
5 |
2 |
|
DTB Bank |
83.3% |
85.4% |
75.0% |
4 |
2 |
9 |
|
CIC |
81.3% |
79.2% |
64.6% |
5 |
8 |
25 |
|
Standard Chartered |
79.2% |
83.3% |
83.3% |
6 |
3 |
2 |
|
NIC |
79.2% |
68.8% |
66.7% |
6 |
21 |
18 |
|
Kenya Power & Lighting Co Ltd |
79.2% |
79.2% |
68.8% |
6 |
8 |
15 |
|
BAT Kenya |
77.1% |
79.2% |
77.1% |
9 |
8 |
5 |
|
East Africa Breweries |
77.1% |
79.2% |
77.1% |
9 |
8 |
5 |
|
Liberty |
77.1% |
81.3% |
66.7% |
9 |
5 |
18 |
|
Jubilee Holdings |
77.1% |
83.3% |
77.1% |
9 |
3 |
5 |
|
Kenya Re |
75.0% |
60.4% |
58.3% |
13 |
33 |
32 |
|
Carbacid Investments |
75.0% |
60.4% |
45.8% |
13 |
33 |
44 |
|
Standard Group |
75.0% |
70.8% |
60.4% |
13 |
20 |
28 |
|
Kengen |
75.0% |
75.0% |
79.2% |
13 |
16 |
4 |
|
EQUITY |
75.0% |
75.0% |
72.9% |
13 |
16 |
10 |
|
National Bank |
75.0% |
77.1% |
68.8% |
13 |
14 |
15 |
|
Umeme Ltd Ord 0.50 |
75.0% |
77.1% |
72.9% |
13 |
14 |
10 |
|
COOP |
75.0% |
79.2% |
70.8% |
23 |
8 |
13 |
|
Britam |
72.9% |
60.4% |
54.2% |
21 |
33 |
38 |
|
Sasini |
72.9% |
64.6% |
60.4% |
21 |
27 |
28 |
|
WPP Scan Group |
72.9% |
66.7% |
45.8% |
21 |
27 |
44 |
|
Barclays |
72.9% |
79.2% |
77.1% |
21 |
8 |
5 |
|
Kenya Airways |
70.8% |
60.4% |
66.7% |
25 |
33 |
18 |
|
Nation Media Group |
70.8% |
64.6% |
58.3% |
25 |
27 |
32 |
|
Sanlam Kenya |
68.8% |
72.9% |
70.8% |
27 |
19 |
13 |
|
Centum |
68.8% |
64.6% |
64.6% |
27 |
27 |
18 |
|
Kenol/Kobil |
66.7% |
54.2% |
52.1% |
28 |
42 |
40 |
|
Longhorn Publishers |
66.7% |
72.9% |
67.0% |
28 |
||
|
I&M Holdings |
66.7% |
75.0% |
72.9% |
28 |
16 |
10 |
|
Stanbic Holdings |
64.6% |
58.3% |
56.3% |
32 |
40 |
35 |
|
TPS East Africa |
64.6% |
64.6% |
58.3% |
32 |
27 |
32 |
|
Unga |
64.6% |
64.6% |
66.7% |
32 |
27 |
18 |
|
Total Kenya Ltd Ord 5.00 |
64.6% |
65.2% |
65.2% |
32 |
26 |
24 |
|
Housing Finance |
64.6% |
66.7% |
60.4% |
32 |
22 |
28 |
|
East Africa Portland Cement |
62.5% |
60.4% |
50.0% |
37 |
33 |
42 |
|
B.O.C Kenya |
62.5% |
60.4% |
56.3% |
37 |
33 |
35 |
|
Trans-Century Ltd Ord 0.50 AIM |
62.5% |
62.5% |
56.3% |
37 |
32 |
35 |
|
Bamburi |
62.5% |
66.7% |
66.7% |
47 |
22 |
18 |
|
Mumias Sugar |
60.4% |
52.1% |
52.1% |
41 |
45 |
40 |
|
ARM |
58.3% |
66.7% |
64.6% |
42 |
22 |
25 |
|
Crown Paints |
56.3% |
50.0% |
43.8% |
43 |
47 |
46 |
|
Williamson Tea |
54.2% |
52.1% |
47.9% |
44 |
45 |
43 |
|
Kakuzi |
54.2% |
54.2% |
60.4% |
44 |
42 |
28 |
|
Limuru Tea |
41.7% |
16.7% |
18.8% |
46 |
49 |
49 |
|
Kenya orchards |
10.4% |
10.4% |
10.4% |
47 |
50 |
50 |
|
Average Comprehensive Score |
69.1% |
67.1% |
62.9% |
|
|
|
Disclaimer: The views expressed in this publication, are those of the writers where particulars are not warranted. This publication, which is in compliance with Section 2 of the Capital Markets Authority Act Cap 485A, is meant for general information only, and is not a warranty, representation, advice or solicitation of any nature. Readers are advised in all circumstances to seek the advice of a registered investment advisor.

- Talk to us
- Kenya
- P.O Box 20695 - 00200, Nairobi, Kenya
- Cell +254709101200
- Tel +254709101200
- WhatsApp +254741676635
- United States
- +254709101200
- DOWNLOAD OUR APP
-


- Kenya
- 8th Floor, Pinetree Plaza, Kaburu Drive, Ngong Road, Nairobi, Kenya
- USA
- Suite 1150, 1775 Eye Street NW, USA, Washington DC 20006, USA
- Investments
- High Yield
- Private Equity
- Real Estate
- Real Estate
- RiverRun Estates
- Cytonn Towers
- The Ridge
- Taraji Heights
- The Alma