Mar 18, 2018
In a bid to offer a diversified investment portfolio to our clients, Cytonn has been conducting comprehensive studies in various markets across Africa in our key focus areas of real estate, banking, education, and hospitality. We have so far released the following reports:
- Kampala Real Estate Investment Opportunity in September 2017,
- Accra Real Estate Investment Opportunity in November 2017,
- Sub-Saharan Africa Financial Services Report in November 2017,
- Kigali Rwanda Real Estate Report in February 2018.
This week, we turn our focus to Tanzania with a focus on Dar es Salaam, its largest city and commercial hub, where we conducted real estate research with a focus on the performance of its residential, commercial office, retail and hospitality sectors. We cover the following areas:
- The macro-economic overview of Tanzania and Dar es Salaam city,
- Overview of real estate market in Tanzania,
- Factors driving real estate and challenges facing the sector in Dar es Salaam,
- We then delve into the real estate thematic performance for Dar es Salaam,
- We compare the market to other markets in Sub-Saharan Africa including Nairobi, Kampala, Accra, and Kigali,
- We then conclude with our outlook on the Dar es Salaam real estate investment opportunity.
i. Tanzania Overview
Located in East Africa, Tanzania is one of the largest countries in Africa with an area of 947,303 SQKM and the second highest population in Eastern Africa, with a current population of 56.9 mn, after Ethiopia, which has a population of 102.4 mn. In comparison, Kenya has a population of 48.5 mn. The population has been growing at a five-year CAGR of 3.1%, compared to the global average of 1.2% p.a. It also has a relatively high urban population of 32.3% compared to Kenya’s 26.5%, Rwanda’s 29.8% and Uganda’s 18.0%, with an urbanization rate of 5.3% p.a compared to the global average of 2.1% p.a. The United Republic of Tanzania is composed of mainland Tanzania and the semi-autonomous Zanzibar Island and while the capital city is Dodoma, the main economic city is Dar es Salaam. Tanzania is bordered by Kenya, Burundi, DRC Congo, Zimbabwe, Rwanda, Mozambique, Malawi, Zambia, and Uganda as well as the Indian Ocean to the East.
Economically, Tanzania has had one of the strongest economic growths in Sub-Saharan Africa with a GDP growth rate averaging at 6.6% for the period 2012-2016, and a marginal decline to 6.5% expected for 2017. The trend is however, expected to continue in 2018 and 2019, with World Bank projecting 6.8% and 6.9%, respectively. The stable economic growth is supported by the mining, construction, financial services, and information and communication sectors. As at 2017, the service sector, entailing real estate, accommodation, and finance industries, has been the largest contributor to GDP with a 42.0% share, while agriculture, forestry, and fishing accounted for 31.0% and the industrial and construction sectors accounted for 27.0% of the GDP. In comparison, Kenya’s service sector accounted for 50.8% of the GDP, agriculture, forestry and fishing accounted for 23.1%, with the industrial and construction sector accounted for 13.8%.
Dar es Salaam Overview
Dar es Salaam is the largest city and main economic hub of Tanzania. It has an area of 1,590 SQKM, as per United Nations data, with a population of 5.1 mn as at 2017 according to the African Development Bank, resulting in a population density of 3,661 persons per SQKM. Dar es Salaam served as Tanzania’s capital city up to 1996, before the capital city function was moved to Dodoma. The city has the second largest port in Eastern Africa after Kenya’s Mombasa. The main drivers of the economy in Dar es Salaam are the financial services, transport, manufacturing and tourism sectors.
Services & Amenities
Dar es Salaam is served by major roads such as Ali Hassan Mwinyi, Nyerere, Bagamoyo, Morogoro and Kilwa roads, which are in a good state of repair. It is also served by a 6-phased Bus Rapid Transit System (BRTS), with Phase 1 of the project consisting of 29 stations having being completed in 2015. This has helped to ease congestion in the city and also opened up the area for development. Ferry services are also common especially for transit to surrounding islands, while the newly constructed 680-meter-long Kigamboni Bridge, which was completed in 2016, links the district of Kigamboni and Dar es Salaam’s CBD at Kurasini.
Electricity is provided by Tanzania Electric Supply Company Limited (TANESCO), which accounts for approximately 60% of the total power generation, while other players include US-based Symbion, and Tanzanian Firms Independent Power Tanzania and Songas, which account for the remaining 40%. Water and sewerage disposal services are provided by Dar es Salaam Water & Sewerage Corporation (DAWASCO).
ii. Overview of Real Estate in Tanzania
A bulk of real estate property, especially housing, in Tanzania is dominated by individual home-builders who account for over 70.0% of the total supply. The public sector through local governments, National Housing Corporation, Tanzania Building Agency, Watumishi Housing and pension funds such as National Social Security Fund (NSSF), account for approximately 12.6% of the supply while residential private developers cater for approximately 3.9%. The housing demand is estimated to grow by 200,000 units annually with the cumulative deficit currently at 3.0 mn units, according to National Housing Corporation (NHC).
The sector contributed to 3.8% of Tanzania’s GDP in H1’2017, a decline from 4.0% during the same period in 2016 while its growth softened to 2.3% in H1’2017, from a 2.4% growth in H1’2016. Similarly, the construction sector’s growth declined to 8.6% in H1’2017 compared to a 10.0% growth in the same period in 2016. The decline in growth of the two sectors is attributable to tight liquidity, inadequate infrastructural development and slowed real estate uptake following a tough macroeconomic environment.
iii. Factors Driving Real Estate in Dar es Salaam
Majority of Dar es Salaam’s investment grade real estate is developed by government entities through the National Housing Corporation, Tanzania Building Agency, and pension bodies. The sector has however seen an increase in private developers with players such as Avic, Nevada Properties, Quality Group, Shamo Group, Actis, and GSM Group, among others, carrying out developments.
The factors driving growth of real estate in Dar es Salaam include:
- Stable Economic Growth: Tanzania has had one of the fastest growing economies with GDP growth averaging at 6.6% annually since 2012 driven mainly by growth in mining, construction, financial services, and information and communication sectors. The World Bank projects a GDP growth rate of 6.5% for 2017, a decline of 0.5% points from 7.0% in 2016, attributable to the government’s ban on export of raw minerals and ores for metallic minerals. However, this is expected to pick up in 2018 and 2019, with projections of 6.8% and 6.9%, respectively, premised on the recovery of the global commodity prices, scaled-up investments in public infrastructure and a tightening trade deficit with a drop in imports,
- Influx of Multinational Players: The discovery of gas in 2015 and the presence of a seaport has attracted multinational companies in the transport, manufacturing and mining sectors, who demand institutional grade real estate including housing, offices, retail as well as hospitality facilities,
- Positive Demographic Dividend: Tanzania has a population of 56.9 mn people growing at 3.1% p.a., compared to the global average of 1.2% p.a. and East African average of 2.9% p.a. This translates to a density of 60.5 people per SQKM (Kenya has 87 people per SQKM). 32.3% of its population is urban and growing at 5.3% p.a. compared to the global average of 2.1% p.a. and East African average of 5.1% p.a, thus creating demand for real estate,
- Infrastructural Development: The government has invested in infrastructure through construction of roads to remote areas such as Kigamboni through construction of the Kigamboni Bridge, implementation of the Bus Rapid Transit System and ongoing construction of a Standard Gauge Railway to ease accessibility, thus boosting real estate growth in out of town areas,
- Institutional Funds: Government corporations such as National Housing Corporation (NHC) and Watumishi Housing, pension schemes such as National Social Security Fund (NSSF), Government employees pension Fund (GEPF), Local Authorities Pension Fund (LAPF), among others, have been at the forefront of real estate investments. As per the Social Security Regulatory Authority investment guidelines, pension schemes are mandated to invest a maximum of30% of their funds in real estate. As at 2017, NHC accounted for 70% of all housing in Dar es Salaam,
- Housing Deficit: As per the National Housing Corporation, housing deficit in Tanzania stands at an approximately cumulative 3.0 mn units and expanding by 200,000 units per annum. The gap has attracted interest from both the public and private players especially for lower-mid end and low-end segments, evidenced by the various masterplan communities by NHC, Watumishi Housing, Avic, across the country.
The real estate sector has been facing fundamental challenges, among them:
- Access to Credit: Credit growth fell from 24.8% in 2015 to 7.2% in 2016 and to 0.3% in August 2017, attributable to a rise in the risk premium due to an increase in non-performing loans and thus banks preferred to lend to the Tanzanian Government. Despite the Bank of Tanzania lowering the monetary policy rate to 9.0% in H2’2017, banks still charge relatively high interest rates reaching highs of 17% - 21% p.a. and a 5-year average of 16.1% p.a., thus limiting the uptake of mortgages, which affects property purchases. The Mortgage to GDP ratio in Tanzania stood at 0.5% as at 2016 compared to Kenya at 2.7% and Uganda at 0.9% in the same period,
- Unfavourable Government Policies: The implementation of austerity measures such as surplus income cuts for government employees thus restricting their property purchasing capabilities, as well as a strict new tax regime by the new government since 2015 resulting in reduced spending, leading to low purchasing power of real estate consumers. It has also resulted in the closure of firms and scaling back of multinational firms. The imposed 18% VAT on all property purchases increases the cost of buying property, limiting affordability, compared to countries such as Kenya where VAT is only imposed on commercial real estate purchases,
- Insufficient Infrastructure: Various parts of Dar es Salaam such as Mwenge, parts of Mikocheni and Kigamboni lack requisite infrastructure such as adequate water connection, mains sewers, mains electricity and proper road access hindering the growth of real estate as developers have to incur extra costs to provide these services.
iv. Real Estate Market Performance
|
Real Estate Performance Summary 2018 – Dar es Salaam |
||||
|
Theme |
Average Rent per SQM (USD) |
Average Price per SQM (USD) |
Average Occupancy Rates |
Average Rental Yield |
|
Retail Sector |
20.0 |
2,200.0 |
87.1% |
9.4% |
|
Office Sector |
15.0 |
2,200.0 |
72.1% |
6.4% |
|
Residential Sector |
5.3 |
902.0 |
79.5% |
5.2% |
|
Hotels |
59.8% |
|||
|
Average |
74.6% |
7.0% |
||
|
· The retail sector has higher returns to investors with an average rental yield of 9.4% compared to commercial office’s 6.4% and the residential sector at 5.2%. This is due to the high occupancy rates of 87.1%, indicating demand for retail space · The performance of the office sector has recorded increasing vacancy rates due to the exit of multinationals, migration of government offices to Dodoma and the increasing supply, thus relatively lower yields at 6.4% with 72.1% occupancy · The residential sector has seen a reduction in rents and prices due to reduced spending power, thus has yields of 5.2% as at 2017 and occupancy of 79.4% |
||||
Source: Cytonn Research
Below is a review of performance across the various sectors:
- Residential Sector
The residential sector in Tanzania is dominated by individual home builders and the public sector either through the National Housing Corporation or the Tanzania Building Agency (TBA) who cater for Tanzanians or government employees.
We conducted research on housing by both private and public developers and sub-divided Dar es Salaam into the following segments:
- High End - Areas such as Oyster Bay, Masaki, Morocco, and Msasani,
- Mid End - Areas such as Mbezi, Kunduchi, Kinondoni, Mikocheni, Mwenge, Upanga, Kariakoo, and Kisutu,
- Low End - Areas such as Mbagala and satellite locations such as Kigamboni and Bunju.
In summary, the residential sector has been recording subdued performance for the past two-years, especially in the high and mid-end segments, which have continued to record negative price growth, attributable to tight liquidity, slow credit growth, which declined to 7.2% in 2016 and to 0.3% in August 2017 from 24.8% in 2015. However, the low-end segment had the best performance with an annual uptake of 53.7%, and average total returns to investors of 5.2%.
Due to a tough operating environment in the market, prices have either stagnated or declined indicating that the market is more suitable for investors targeting returns in terms of rental income as opposed to price appreciation.
NB: (All yields are dollarized)
|
Residential Performance Summary |
||||||||
|
Segment |
Unit Type |
Price per SQM (USD) |
Rent per SQM (USD) |
Occupancy |
Annual Uptake |
Rental Yield |
Price Appreciation |
Total Returns |
|
High End |
Apartments |
1,394 |
6.5 |
90.2% |
20.0% |
4.9% |
(6.2%) |
(1.3%) |
|
High End |
Detached |
1,071 |
7.7 |
86.5% |
7.8% |
(6.2%) |
1.6% |
|
|
Mid End |
Apartments |
1,204 |
7.6 |
79.4% |
20.8% |
7.8% |
(9.2%) |
(1.4%) |
|
Mid End |
Detached |
1,243 |
4.6 |
71.2% |
19.7% |
3.4% |
(9.2%) |
(5.8%) |
|
Low End |
Apartments |
390 |
1.6 |
8.3% |
3.3% |
1.4% |
4.8% |
|
|
Low End |
Detached |
388 |
1.7 |
70.0% |
53.7% |
3.9% |
1.4% |
5.4% |
|
Average |
|
948 |
4.9 |
79.5% |
24.5% |
5.2% |
(4.7%) |
0.5% |
|
· Detached units in the high-end sector have the highest yields at 7.8% as they charge a premium on rent due to the relatively low supply given the increasing land prices in their locations · Apartments in the mid-end sector have the highest yields at 7.8% due to their relative affordability for the growing middle class · Detached units in the low-end sector have a relatively high annual uptake of 53.7% due to their relative affordability. They, however, have low yields of 3.9% and are thus more suitable for prospective residents as opposed to investors |
||||||||
Source: Cytonn Research
The performance breakdown of the various market segments and typologies is as shown below:
a. High End
|
Performance Summary - High End |
||||||||||||||||
|
Apartments |
||||||||||||||||
|
Typology |
Unit Plinth Area (SQM) |
Price (USD) |
Price (Kshs) |
Price (Tshs) |
Price per SQM (USD) |
Rent per SQM (USD) |
Occupancy (%) |
Annual Uptake (%) |
Rental Yield (%) |
|||||||
|
2 Bed |
168 |
260,000 |
27.6m |
580.7m |
1,377 |
6.4 |
90.6% |
23.3% |
4.9% |
|||||||
|
3 Bed |
228 |
254,050 |
26.3m |
567.4m |
1,402 |
6.3 |
87.4% |
20.0% |
4.7% |
|||||||
|
4 Bed |
256 |
370,375 |
38.3m |
827.2m |
1,403 |
6.8 |
92.7% |
16.7% |
5.2% |
|||||||
|
Average |
|
|
|
|
1,394 |
6.5 |
90.2% |
20.0% |
4.9% |
|||||||
|
Detached |
||||||||||||||||
|
Typology |
Unit Plinth (SQM) |
Price (USD) |
Price (Kshs) |
Price (Tshs) |
Price per SQM (USD) |
Rent per SQM (USD) |
Occupancy (%) |
Rental Yield (%) |
||||||||
|
2 Bed |
216 |
8.1 |
83.3% |
7.6% |
||||||||||||
|
3 Bed |
323 |
8.9 |
71.1% |
8.2% |
||||||||||||
|
4 Bed |
430 |
8.0 |
91.7% |
9.1% |
||||||||||||
|
5 Bed |
560 |
600,000 |
61.4m |
1,340.1m |
1,071 |
5.6 |
100.0% |
6.3% |
||||||||
|
Average |
|
|
|
|
1,071 |
7.7 |
86.5% |
7.8% |
||||||||
|
· Detached units had the highest yields at 7.8% as they are relatively lower in supply, compared to apartments, which are the most common in the Dar es Salaam market, thus detached units are able to charge premium rents |
||||||||||||||||
Source: Cytonn Research
b. Mid End
|
Performance Summary - Mid End |
|||||||||
|
Apartments |
|||||||||
|
Typology |
Unit Plinth (SM) |
Price (USD) |
Price (Kshs) |
Price (Tshs) |
Price per SM (USD) |
Rent per SM (USD) |
Occupancy (%) |
Annual Uptake (%) |
Rental Yield (%) |
|
2 Bed |
73 |
134,648 |
13.9m |
300.7m |
1,750 |
10.5 |
82.2% |
18.3% |
8.7% |
|
3 Bed |
136 |
143,097 |
14.8m |
319.6m |
1,026 |
6.9 |
81.0% |
25.6% |
6.9% |
|
4 Bed |
181 |
151,231 |
15.6m |
337.8m |
835 |
5.4 |
75.0% |
18.5% |
7.8% |
|
Average |
|
|
|
|
1,204 |
7.6 |
79.4% |
20.8% |
7.8% |
|
Detached |
|||||||||
|
Typology |
Unit Plinth (SM) |
Price (USD) |
Price (Kshs) |
Price (Tshs) |
Price per SM (USD) |
Rent per SM (USD) |
Occupancy (%) |
Annual Uptake (%) |
Rental Yield (%) |
|
2 Bed |
110 |
136,500 |
14.0m |
304.9m |
1,281 |
27.8% |
3.2% |
||
|
3 Bed |
171 |
224,814 |
23.0m |
502.1m |
1,303 |
4.3 |
75.0% |
13.0% |
2.8% |
|
4 Bed |
327 |
311,848 |
31.9m |
696.5m |
1,143 |
4.9 |
67.5% |
18.4% |
4.2% |
|
Average |
|
|
|
|
1,243 |
4.6 |
71.2% |
19.7% |
3.4% |
|
· Apartments had the highest yields at 7.8% and annualized uptake at 20.8% compared to detached units with a yield of 3.4% and annual uptake of 19.7% driven by demand from the growing middle class who seek quality developments with relatively affordable prices/rents |
|||||||||
Source: Cytonn Research
c. Low End
|
Performance Summary: Low End |
|||||||||
|
Apartments |
|||||||||
|
Typology |
Unit Plinth (SM) |
Price (USD) |
Price (Kshs) |
Price (Tshs) |
Price per SM (USD) |
Rent per SM (USD) |
Occupancy (%) |
Annual Uptake (%) |
Rental Yield (%) |
|
2 Bed |
76 |
30,331 |
3.1m |
67.7m |
402 |
1.5 |
70.0% |
8.3% |
3.2% |
|
3 Bed |
101 |
57,028 |
3.9m |
127.4m |
379 |
1.6 |
70.0% |
8.3% |
3.5% |
|
Average |
|
|
|
|
390 |
1.6 |
70.0% |
8.3% |
3.3% |
|
Detached |
|||||||||
|
Typology |
Unit Plinth (SM) |
Price (USD) |
Price (Kshs) |
Price (Tshs) |
Price per SM (USD) |
Rent per SM (USD) |
Occupancy (%) |
Annual Uptake (%) |
Rental Yield (%) |
|
2 Bed |
61 |
23,477 |
2.4m |
52.4m |
361 |
1.6 |
70.0% |
66.7% |
4.1% |
|
3 Bed |
104 |
43,242 |
4.4m |
96.6m |
414 |
1.9 |
70.0% |
40.7% |
3.8% |
|
Average |
|
|
|
|
388 |
1.7 |
70.0% |
53.7% |
3.9% |
|
· Apartments have relatively slow uptake at 8.3% annually compared to detached units with 53.7% due to preference to own-compound houses · Rentals in the low-end sector are relatively low ranging from USD 1.5-USD 1.9 per SQM indicating low demand and thus is more of a buyers’ market |
|||||||||
Source: Cytonn Research
2. Commercial Sector
The commercial sector has been steadily growing, especially in terms of supply. According to Cytonn Research, office stock in Dar es Salaam stands at approximately 350,000 - 450,000 SQM, and another 100,000 - 150,000 SQM expected to be delivered in 2018/19. Commercial office supply growth is propelled by infrastructural development in key regions around the city, a stable economic growth and continued entry of multinational firms into the country and the budding small and medium enterprises industry, especially in the manufacturing, financial and telecommunication industries. However, as demand stabilizes and stock supply increases, the sector has been recording subdued returns and increasing vacancy rates in the last three-years. This has been attributed to high rental rates that do not sustain the small and medium enterprises, emerging cities that are slowly catching up such as Dodoma, Arusha and Mwanza and the high cost of borrowing affecting expansion of enterprises.
The performance is as shown below:
|
Commercial Office Performance Summary by Grade |
|||||
|
Grade |
Monthly Rent Per SQM (USD) |
Monthly Rent Per SQFT (Kshs) |
Monthly Rent Per SQFT (Tshs) |
Occupancy |
Rental Yield |
|
A |
17.0 |
193 |
37,968.5 |
92.9% |
8.6% |
|
B |
16.0 |
186 |
35,735.0 |
70.7% |
6.7% |
|
C |
12.0 |
135 |
26,801.3 |
68.4% |
5.2% |
|
Average |
15.0 |
167 |
33,501.6 |
72.1% |
6.4% |
|
*Rents are exclusive of service charge · Grade A offices recorded the highest yields in the market with average yields of 8.6%, 2.2% points higher than the market average of 6.4%. We attribute this to their high occupancy rates whose demand stem from the multinational players who demand top notch quality office stock |
|||||
Source: Cytonn Research
|
Commercial Office Performance Summary by Node |
|||||||
|
Node |
Monthly Rent Per SQM (USD) |
Monthly Rent Per SQFT (Kshs) |
Monthly Rent Per SQFT (Tshs) |
Service Charge per SQM (USD) |
Service Charge per SQFT (Kshs) |
Occupancy |
Rental Yield |
|
Kinondoni |
15.8 |
161 |
35,288.4 |
1.9 |
18 |
79.0% |
7.3% |
|
Masaki/Oyster Bay |
20.4 |
211 |
45,562.2 |
2.6 |
25 |
66.3% |
7.2% |
|
CBD |
15.9 |
167 |
35,511.7 |
2.3 |
22 |
76.0% |
6.3% |
|
Mwenge |
11.9 |
123 |
26,577.9 |
2.2 |
21 |
60.1% |
4.3% |
|
Average |
16.0 |
165.5 |
35,288.4 |
2.2 |
22 |
70.4% |
6.3% |
|
· Kinondoni was the best performing node with average rental yields of 7.3%, 1.0% points higher than the market average of 6.3%, attributable to good infrastructure, proximity to key upscale neighbourhoods such as Masaki, Oyster bay and Msasani Peninsula as well as its proximity to the CBD and the fact that firms are increasingly relocating here away from the congestion of the city centre thus raising its occupancy rates · Mwenge area had the lowest yields at 4.3% being the node with most grade C office stock thus the lowest rents. In addition, firms are increasingly moving to more prime nodes such as Kinondoni thus resulting in lower occupancies at 60.1% |
|||||||
Source: Cytonn Research
3. Retail Sector
Tanzania’s formal retail activity is centered in Dar es Salaam, which is considered the main economic hub of the country. As per JLL Dar es Salaam Report 2017, Dar es Salaam had a retail stock of 153,000 SQM. The main premium malls are Mlimani City Mall in Mwenge, Aura Mall in Upanga and Mkuki Mall in Kisutu. According to the Cytonn Research, at least 84,000 SQM is expected to be complete in the next five-years with malls such as Peninsula Plaza in Masaki, AICC Shopping Mall and Ngorongoro Towers in Arusha as well as shopping plazas in the upcoming MNF Square and Morocco Square in Dar es Salaam. Other premium malls in the country include Aim Mall in Arusha and Rock City Mall in Mwanza, measuring 15,454 SQM and 5,000 SQM, respectively.
The retail sector has grown on the back of positive demographic dividends with increased consumerism from the expanding middle class, increased interest from foreign players, and the growth of e-commerce. The performance is as shown below:
|
Retail Performance Summary by Node |
|||||
|
Location |
Monthly Rent Per SQM (USD) |
Monthly Rent Per SQFT (Kshs) |
Monthly Rent Per SQFT (Tshs) |
Occupancy Rate |
Rental Yield |
|
Masaki & Oysterbay |
20.0 |
206.7 |
44,668.8 |
96.1% |
10.9% |
|
Upanga |
19.8 |
205.1 |
44,222.1 |
91.9% |
10.3% |
|
CBD |
17.0 |
171.6 |
37,968.5 |
71.1% |
6.9% |
|
Average |
18.9 |
194.5 |
42,212.0 |
86.4% |
9.4% |
|
*(all rents are exclusive of service charge) · The Masaki and Upanga regions offer the highest retail yields to investors with 10.9%. This is attributable to the high upper mid-end populations as well as expatriates that reside in the neighborhood which drives demand for retail space · The CBD region is congested and businesses are now shifting to the outskirts of the city which has resulted in the low occupancy rates and hence low yields of 6.9%, 2.5% lower than the market average |
|||||
Source: Cytonn Research
|
Retail Performance Summary by Classification |
|||||
|
Type |
Monthly Rent Per SQM (USD) |
Monthly Rent Per SQFT (Kshs) |
Monthly Rent Per SQFT (Tshs) |
Occupancy Rate |
Rental Yield |
|
Community |
14.7 |
151.5 |
32,831.6 |
85.7% |
7.5% |
|
Neighborhood |
19.7 |
204.1 |
43,998.8 |
87.0% |
9.8% |
|
Regional |
39.6 |
409.8 |
88,444.2 |
95.0% |
11.1% |
|
Average |
19.4 |
201.1 |
43,328.7 |
87.1% |
9.4% |
|
*(all rents are exclusive of service charge) · The regional mall recorded the highest returns in terms of yield with an average of 11.1%, due to the high rental rates it attracts averaging at USD 39-40 per SQM as well as high occupancy rates of 95% · Neighborhood malls which are the main malls in Dar es Salaam also performed well with average yields of 9.8%, 0.4% higher than the market average as they also attract premium rates as they are limited in supply despite demand especially from foreign retailers |
|||||
Source: Cytonn Research
4. Hospitality Sector
The hospitality sector is growing supported by (i) holiday travelers who are the main drivers of Tanzania’s hospitality sector accounting for 78.0% of international arrivals over the last 5-years attracted mostly by key attractions such as wildlife, coastal beaches and mountain climbing, and (ii) political and social security in the last few years making it a preferred destination in East Africa compared to countries such as Kenya that suffered a setback between 2013 and 2015 due to terrorism and negative travel advisories. The sector’s performance, however, was low in 2016 due to the introduction of VAT to tourism services making Tanzania a relatively more expensive tourism destination. The sector, however, recorded improved performance in 2017 and is expected to sustain growth due to political stability and government efforts to improve infrastructure.
|
Hospitality Sector Performance (Tanzania) |
||||||||
|
Factor |
2011 |
2012 |
2013 |
2014 |
2015 |
2016 |
2017F |
2016/17F |
|
Accommodation and Food Services contribution to GDP |
1.6% |
1.6% |
1.5% |
1.5% |
1.4% |
1.4% |
1.3% |
(0.1)% |
|
Growth of GDP from Accommodation and Food Services |
4.1% |
6.7% |
2.8% |
2.2% |
2.3% |
3.7% |
2.0% |
(1.7)% |
|
International Visitor Arrivals ('000) |
867 |
1,077 |
1,096 |
1,140 |
1,137 |
1,284 |
1,389 |
8.2% |
|
Earnings in USD (mn) |
1,353 |
1,713 |
1,853 |
2,006 |
1,902 |
2,132 |
2,300 |
7.9% |
|
Bed Occupancy |
32.9% |
30.7% |
27.4% |
27.8% |
0.4% |
|||
|
Room Occupancy |
|
|
|
71.0% |
66.0% |
58.9% |
59.8% |
0.9% |
|
· International arrivals increased by a 6-year CAGR of CAGR of 9.9% while tourism earnings have grown by 11.2% during the same period, indicating the growth of the sector · However, the sector declined in 2015 evidenced by the reduction in international visitor arrivals and reduction in bed occupancy from 32.9% to 30.7%. This is because 2015 was an election year in Tanzania and may have resulted in security concerns due to the annulment of elections in Zanzibar. In addition, there may have been a spill-over effect of reduced tourist arrivals to Africa due to terrorist activities in Kenya and the Ebola pandemic in West Africa that resulted in issuance of negative travel advisories |
||||||||
Source: Cytonn Research, NBS
5. Land Sector
Land in Tanzania is divided into 3 categories; general land, village land and reserved land. The Land Act provides for rights of occupancy for between 33-years and 99-years for general land and reserved land. The Village Land Act recognizes the rights of villages to land held collectively by village residents under customary law. Under the TIC (Tanzania Investment Centre), a foreigner can be allocated land designated for investment purposes and which is already listed, or can look for desirable land owned by a Tanzanian national, and after agreeing on the acquisition of such land with the owner, the owner will submit the existing title deed to the Ministry of Lands whereby it will be re-issued as a land designated for investment purposes under the name of TIC and thereafter derivative rights issued to the investor (foreign entity).
The table below shows the average land prices in various parts of Dar es Salaam:
|
Average Land Prices in Dar es Salaam |
||||
|
Location |
Price Per SQM (USD) |
Price per Acre (USD) |
Price per Acre (Kshs) |
Price per Acre (Tshs) |
|
CBD |
732 |
2,927,906 |
302,745,474 |
6,539,302,231 |
|
Oysterbay& Masaki |
931 |
3,722,081 |
384,863,140 |
8,313,043,827 |
|
Victoria |
1,071 |
4,285,714 |
443,142,857 |
9,571,885,714 |
|
Bagamoyo Road |
392 |
1,567,341 |
162,063,093 |
3,500,562,802 |
|
Goba, Mbezi Beach |
12 |
38,625 |
3,993,876 |
86,267,727 |
|
Kurasini |
210 |
841,248 |
86,985,075 |
1,878,877,612 |
|
· Land prices are highest in commercial areas such as Victoria and CBD, and also the two most prime neighborhoods, Masaki and Oysterbay · Areas located far from the city centre such as Goba and Mbezi Beach are affordable. However, developers in these areas have to incur extra costs of providing infrastructure which is either poor or non-existent |
||||
Source: Cytonn Research
v. Comparison to Other Sub-Saharan African Markets
In comparison with other cities in Sub-Saharan Africa, Dar es Salaam has low residential and office yields at 5.2% and 6.4%, respectively, attributable to the shrinking demand resulting in reduced rents mainly in the residential and office sector.
The retail sector, however, has relatively competitive yields at 9.4% compared to Kenya’s and Accra’s at 9.6% and 9.5%, respectively.
Sub-Saharan Africa Cities Dollarized Rental Yields Comparison
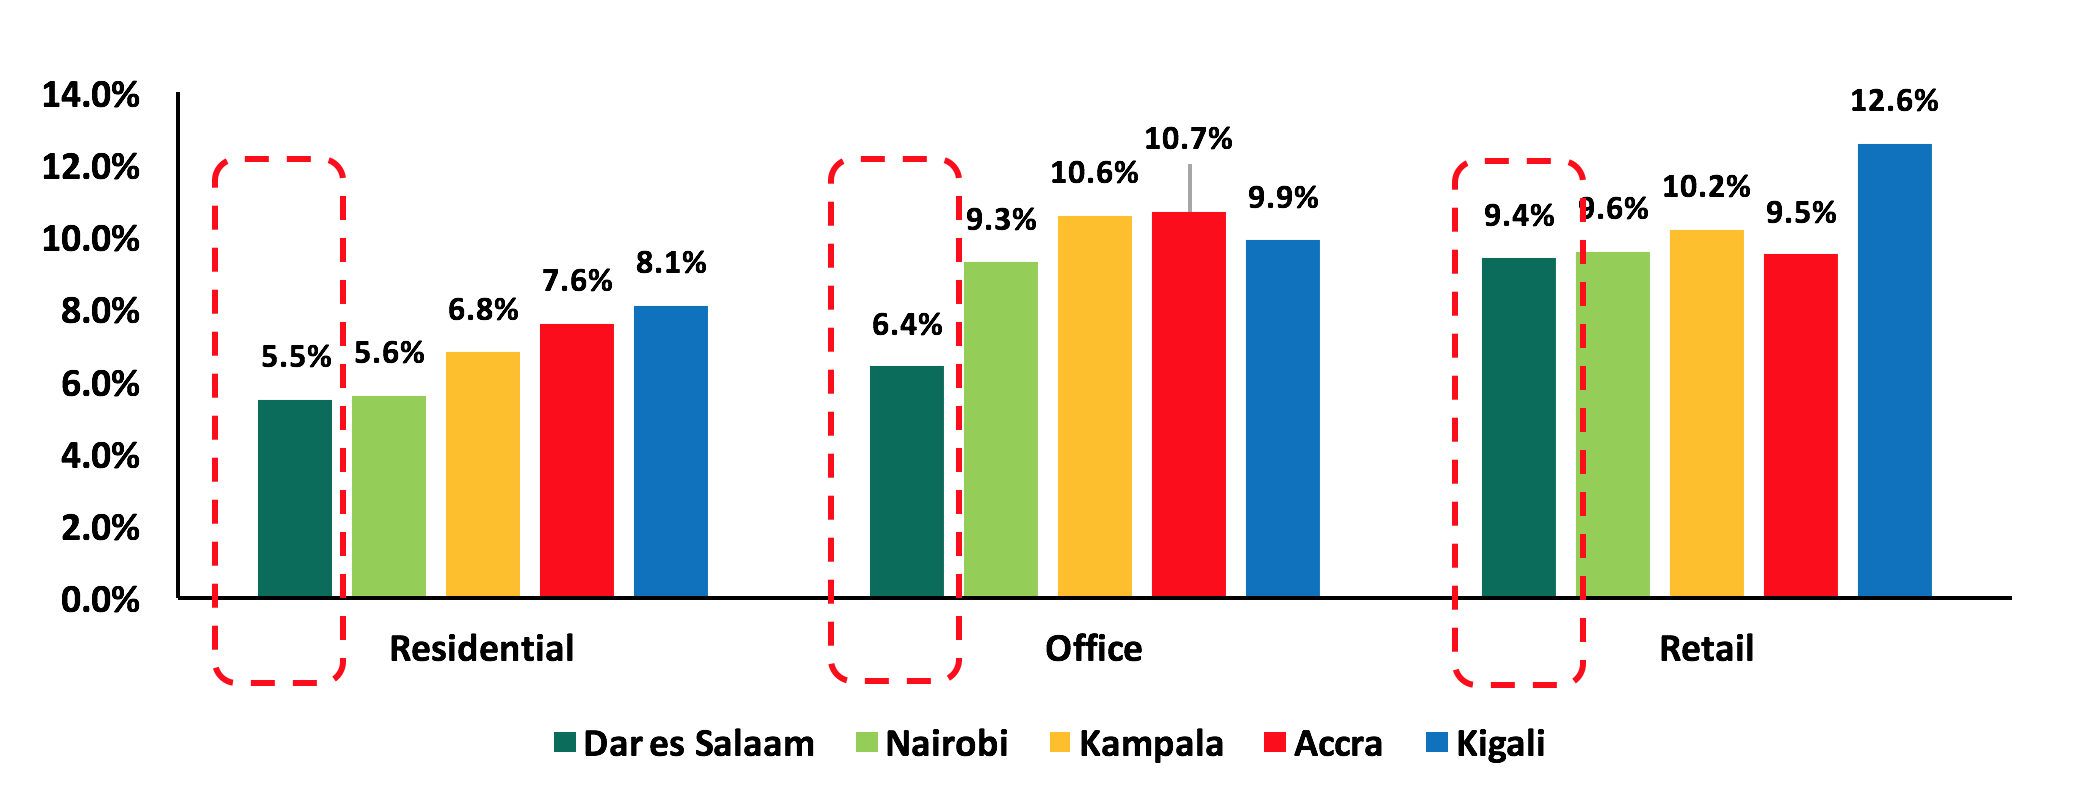
Source: Cytonn Research
vi. Real Estate Investment Outlook
Our outlook on the Dar es Salaam real estate sector is neutral with a bias to positive. We have a positive view on the retail and hospitality sectors, a negative on the commercial sector and a neutral view on the residential sector. Investors entering the real estate market should, therefore, focus on the retail and hospitality sectors, which have potential and therefore offer new opportunities for growth. In addition, the residential sector has pockets of value in the low-end segment where demand is highest for detached units and in the mid-end segment where rental apartments have the best yields.
|
Theme |
Recommendation/Outlook |
Area of Focus |
Outlook |
|
Commercial Office |
The office market is on a declining trend and vacancy rates are likely to increase due to i) increasing supply ii) firms increasingly taking up smaller office spaces iii) migration of government offices to Dodoma |
Affordable offices/co-working stations
Investors should seek opportunities in other regions such as Arusha, Dodoma, and Mwanza |
 |
|
Retail |
The formal retail sector is gaining traction, with demand being driven by foreign retailers looking to set up shop in the region, and consumer’s preference for international brands |
Good quality community malls in prime areas such as Masaki and Upanga, which are densely populated
Growing cities; Dodoma, Arusha, and Mwanza |
 |
|
Residential Sector |
The best performing segment for rentals is the mid-end apartments with 7.4% yields and for sales being low-end detached units with 54.0% annual uptake. Demand remains strong for low-end affordable housing |
Mid-end apartments in areas such as Mbezi, Kawe, and Mwenge for rent
Low-mid end detached units in satellite areas such as Kigamboni |
 |
|
Hospitality Sector |
Despite the slight decline recorded in 2016, the sector is expected to recover driven by growth in leisure tourism and government efforts to improve infrastructure |
Luxury hotel class developments which have low supply in Dar es Salaam |
|
From the above themes we track, two are positive, one is negative, and one is neutral. As a result, our outlook is neutral with a bias to positive. We remain cautious about the real estate sector in Dar es Salaam. However, we expect the pockets of value identified in themes such as hospitality and retail to deepen against the backdrop of (i) continued stable economic growth, (ii) an expanding middle class, (iii) increased tourism, (iv) improved infrastructure, and (v) improving policy environment.
For a comprehensive market research refer to the full report here: Dar es Salaam Real Estate Investment Opportunity

- Talk to us
- Kenya
- P.O Box 20695 - 00200, Nairobi, Kenya
- Cell +254709101200
- Tel +254709101200
- WhatsApp +254741676635
- United States
- +254709101200
- DOWNLOAD OUR APP
-


- Kenya
- 8th Floor, Pinetree Plaza, Kaburu Drive, Ngong Road, Nairobi, Kenya
- USA
- Suite 1150, 1775 Eye Street NW, USA, Washington DC 20006, USA
- Investments
- High Yield
- Private Equity
- Real Estate
- Real Estate
- RiverRun Estates
- Cytonn Towers
- The Ridge
- Taraji Heights
- The Alma