Apr 19, 2026
Following the release of the FY’2025 results by Kenyan listed banks, the Cytonn Financial Services Research Team undertook an analysis on the financial performance of the listed banks and identified the key factors that shaped the performance of the sector. For the earnings notes of the various banks, click the links below:
- Equity Group FY’2025 Earnings Note
- KCB Group FY’2025 Earnings Note
- Standard Chartered Bank Kenya FY’2025 Earnings Note
- ABSA Bank Kenya FY’2025 Earnings Note
- NCBA Group FY’2025 Earnings Note
- Co-operative Bank FY’2025 Earnings Note
- Stanbic Holdings FY’2025 Earnings Note
- I&M Group Holdings FY’2025 Earnings Note
- Diamond Trust Bank Kenya FY’2025 Earnings Note
- HF Group FY’2025 Earnings Note
The core earnings per share (EPS) for the listed banks recorded a weighted growth of 15.1% in FY’2025, compared to a weighted growth of 25.7% recorded in FY’2024, an indication of deteriorated performance mainly on the back of a 1.9% growth in non-funded income in FY’2025, compared to a growth of 12.2% in FY’2024. The slowdown reflects muted growth across key NFI components, notably fees and commissions on loans in an easing interest rate environment following CBK rate cuts, alongside lower foreign exchange income due to reduced dollar demand and subdued transaction volumes, highlighting banks’ reliance on interest income. Notably, the inflation rate in FY’2025 averaged 4.1%, 0.4% points lower than the 4.5% average in FY’2024, with the Kenyan Shilling remaining stable against the US Dollar, gaining by 0.2% in FY’2025, to close the year at Kshs 129.0 from the Kshs 129.3 recorded at the beginning of the year. Similarly, credit risk decreased with the asset quality of listed banks improving slightly in FY’2025, with the weighted average Gross Non-Performing Loan ratio (NPL) decreasing by 1.3% points to 11.9%, from 13.2% recorded in FY’2024. The NPL performance remained 0.2% points above the ten-year average of 11.7%.
The report is themed “Earnings Growth Moderates, with Improving Asset Quality and Credit Recovery” where we assess the key factors that influenced the performance of the banking sector in FY’2025, the key trends, the challenges banks faced, and areas that will be crucial for growth and stability of the banking sector going forward. As such, we shall address the following:
- Key Themes that Shaped the Banking Sector Performance in FY’2025,
- Summary of the Performance of the Listed Banking Sector in FY’2025,
- The Focus Areas of the Banking Sector Players Going Forward, and,
- Brief Summary and Ranking of the Listed Banks based on the outcome of our analysis
Section I: Key Themes That Shaped the Banking Sector Performance in FY’2025
In this section, we will highlight the main factors influencing the banking sector in FY’2025. These include regulation, digitization, interest rates, regional expansion through mergers and acquisitions, and asset quality:
- Regulation:
- Risk-based Lending: Over the years, the government has deployed various policy tools to manage interest rates and improve private sector access to credit. Following the repeal of the Interest Rate Cap Law in 2019, the Central Bank of Kenya (CBK) directed banks to adopt risk-based lending models that price loans according to borrower risk profiles, improving fairness and transparency for MSMEs. Although the CBK introduced a revised pricing framework in August 2025 anchored on the Kenya Shilling Overnight Interbank Average (KESONIA), a benchmark derived from actual overnight interbank transactions meant to replace the Central Bank Rate (CBR) for shilling-denominated variable loans, most commercial banks have opted to continue using the CBR as their reference rate under the new model. Institutions such as KCB, Equity, Absa, NCBA, DTB, Stanbic applied CBR plus a customer-specific risk premium since 1st December 2025, despite having previously rejected CBR as a benchmark and championed the creation of KESONIA. Banks cited ongoing systems testing and the need for operational readiness as the reason for delaying adoption of KESONIA, whose higher volatility would also require more frequent lending-rate adjustments and additional regulatory approvals. Co-operative Bank and Kingdom Bank were the first banks to adopt the interbank-based rate. CBK continues publishing KESONIA, currently marginally higher than the 8.75% CBR by 0.15 bps. The revised banking sector Risk-Based Credit Pricing Model (RBCPM) was fully implemented in March 2026. Overall, although the revised framework is intended to strengthen monetary policy transmission, align Kenya with global benchmarks such as SOFR and SONIA, and enhance transparency through mandatory disclosure of lending rates, premiums, and fees, its impact will vary: borrowers with strong credit profiles may benefit from more competitive pricing, while higher-risk customers could face steeper charges, and lending rates are likely to become more responsive, but also more volatile, once full adoption of KESONIA eventually takes effect.
- Higher capital requirements: Following the enactment of the Business Laws (Amendment) Act, 2024, the Central Bank of Kenya (CBK) increased the minimum core capital requirement for commercial banks to Kshs 10.0 bn from the previous Kshs 1.0 bn, which had been in effect since 2012. The new framework requires lenders to comply gradually, Kshs 5.0 bn by 2026, Kshs 6.0 bn by 2027, Kshs 8.0 bn by 2028, and full compliance at Kshs 10.0 bn by 2029. As of December 2025, 6 banks were below the Kshs 3.0 bn threshold and needed a combined Kshs 9.4 bn to meet the December 2025 deadline. The table below shows the core capital requirement gap of the ten banks as of December 2025;
|
Cytonn Report: Selected Banks Core Capital Requirement Gap |
|||
|
No |
Bank |
Core Capital (Kshs Bn) |
December 2025 Gap (Kshs Bn) |
|
1 |
Consolidated Bank of Kenya |
(0.5) |
3.5 |
|
2 |
UBA Kenya Bank |
1.9 |
1.1 |
|
3 |
Access Bank Kenya |
1.1 |
1.9 |
|
4 |
Credit Bank Plc* |
1.2 |
1.8 |
|
5 |
Development Bank of Kenya |
2.2 |
0.8 |
|
6 |
ABC Bank Kenya |
2.7 |
0.3 |
|
Total |
|
9.4 |
|
source: Company Financials, *as of September 2025
The table below shows the core capital requirement gap of the ten banks by December 2026;
|
Cytonn Report: Selected Banks Core Capital Requirement Gap |
|||
|
No |
Bank |
Core Capital (Kshs Bn) |
December 2026 Gap (Kshs Bn) |
|
1 |
Consolidated Bank |
(0.5) |
5.5 |
|
2 |
Credit Bank* |
1.2 |
3.8 |
|
3 |
Access Bank Kenya |
1.1 |
4.9 |
|
4 |
UBA Kenya |
1.9 |
3.1 |
|
5 |
Development of Kenya |
2.2 |
2.8 |
|
6 |
ABC Bank Kenya |
2.7 |
2.3 |
|
7 |
Commercial International Bank |
3.1 |
1.9 |
|
8 |
Middle East Bank |
3.1 |
1.9 |
|
9 |
M Oriental Bank |
3.1 |
1.9 |
|
10 |
Premier Bank |
3.1 |
1.9 |
|
11 |
Bank of Africa |
3.5 |
1.5 |
|
12 |
Guardian Bank |
3.6 |
1.4 |
|
13 |
DIB Bank |
3.7 |
1.3 |
|
14 |
Habib Bank AG Zurich |
3.8 |
1.2 |
|
15 |
Kingdom Bank |
4.9 |
0.1 |
|
Total |
35.5 |
||
source: Company Financials as of December 2025, *as of September 2025
By December 2026, banks will be required to meet the minimum threshold of a core capital of Kshs 5.0 bn. Currently, 15 banks are yet to meet the threshold, and need a combined Kshs 35.5 bn to meet the deadline. Consolidated Bank remains the most distressed, with a negative core capital of Kshs 546.1 mn, requiring over Kshs 5.5 bn to meet the 2026 minimum amid ongoing plans for a rights issue and long-delayed government support. Although the Kenya Bankers Association (KBA) did not expect significant merger and acquisition activity in 2025, arguing that most banks could meet the Kshs 3.0 bn threshold individually, it anticipated heightened consolidation pressure from 2026 onward as capital requirements rise to Kshs 5.0 bn and beyond. In 2026, Paramount Bank has led early consolidation activity with the acquisition of its 100% stake by Nigeria’s Zenith Bank. CBK is currently reviewing the submitted capital plans and monitoring ongoing efforts as banks race to achieve compliance ahead of the phased deadlines.
- Lifting of moratorium on licensing of new commercial banks: In a significant policy shift, the Central Bank of Kenya (CBK) lifted the moratorium on licensing new commercial banks on July 1, 2025, ending a restriction that had been in place since November 2015. The moratorium had been introduced to address governance, risk management, and operational weaknesses in the sector, providing space for reforms. Over the past decade, the industry has undergone substantial strengthening, with improvements in legal and regulatory frameworks, a wave of mergers and acquisitions, and the entry of new strategic investors. With the moratorium now lifted, early indications point to renewed investor interest, particularly from regional financial groups and non-bank financial institutions seeking to upgrade to full banking licenses. While no large-scale greenfield entries have yet materialized, the policy shift is expected to stimulate competition, product innovation, and capital inflows over the coming year, especially as potential entrants assess compliance with the revised minimum core capital requirement of Kshs 10.0 bn. In the near term, the move is likely to deepen financial sector resilience and broaden consumer choice, although the pace of new licensing is expected to remain measured as CBK maintains a cautious, risk-based approval approach.
- Digitization: In FY’2025, digitization continued to be a transformative force in the banking sector, significantly improving how banks operate and deliver services. There has been a significant increase in the adoption of mobile and online banking platforms as customers now prefer to perform banking transactions from the comfort of their homes, leading to a decline in the use of physical branches. For instance, most of the listed banks disclosed that the majority of transactions were conducted through alternative channels, with Equity Group and KCB Group reporting that 4% and 99.0% of their transactions, respectively, were done digitally through non-branch channels in FY’2025,
- Interest Rates: Interest rates were on a downward trajectory during the period under review. Notably, the yields on Kenyan government securities declined during the period under review, with the yield on the 91-day paper averaging 8.3% during the period, 6.9% points lower than the average of 15.2% in FY’2024. The significant declines in rates in FY’2025 led to a decrease in the listed bank’s interest income growth, softening to a weighted average drop of 3.8% in FY’2025, from a weighted average growth of 21.1% in FY’2024. However, the lower interest rate environment led to a substantial reduction in interest expense which declined by a weighted average of 24.9% in FY’2025, compared to the 43.6% growth in FY’2024 this decline in funding cost helped support overall profitability contributing to a 10.8% growth in net interest income in FY’2025,
- Regional Expansion through Mergers and Acquisitions: Kenyan banks are increasingly expanding their regional footprint, with subsidiaries contributing significantly to overall profitability. For instance, Equity Group reported that regional subsidiaries contributed 51.0% of the Group’s Profit Before Tax (PBT) in FY’2025, up from 50.0% in the same period last year, demonstrating the continued importance of these subsidiaries to the Group’s earnings. Additionally, KCB Group’s subsidiaries contributed 29.1% of the Group’s Profit After Tax (PAT) in FY’2025. In terms of consolidation activity, 2025 saw one confirmed acquisition agreement between Access Bank Plc and KCB Group for the acquisition of National Bank of Kenya. More recently, Nedbank announced the intention of acquisition of 66.0% NCBA Group’s shareholding to diversify its regional presence into East Africa.
- On March 19,2026, the Central Bank of Kenya announced the acquisition of 100.0% shareholding of Paramount Bank Ltd by Zenith Bank Plc. The deal was first announced in November 2025, however, the transaction values and details were not disclosed. The acquisition is a strategic entry point into Kenya’s established banking ecosystem, enhancing its geographic diversification and positioning it to tap into Kenya’s relatively mature and dynamic banking sector as a gateway to the broader region. Zenith bank joins other Nigerian banks in the Kenyan market including Access Bank, UBA and GTBank.
- On January 21, 2026, Nedbank announced the intention to acquire approximately 1.1 bn ordinary shares, representing 66.0% of NCBA’s issued share capital, from NCBA shareholders through a partial tender offer, subject to regulatory approvals. The acquisition will be made at a par value of Kshs 5.0 per share, resulting to a total transaction value of Kshs 5.4 bn. If successfully completed, the transaction will result in Nedbank acquiring a controlling interest in NCBA, while the remaining 34.0% of the shares will remain listed on the Nairobi Securities Exchange (NSE). The planned acquisition values NCBA at a multiple of 1.4x its book value. This proposed transaction is part of Nedbank’s stated strategy to extend its reach beyond Southern Africa, prioritizing the high-growth markets of East Africa, especially with Kenya's prominent role as a financial center, bolstered by robust institutions, advanced capital markets and a dynamic technology sector.
- On November 4, 2025 KCB Group Plc revealed its acquisition of an undisclosed minority stake in Pesapal Limited, one of the region’s leading digital payment providers, as part of its strategic initiative to bolster digital capabilities and reinforce its footprint in banking, agency solutions, and business services across Kenya, Uganda, and Rwanda. This move proves to be strategic as KCB strives to capture the biggest market share of the fast-growing fintech market.
- On March 24, 2025, KCB Group Plc disclosed its acquisition of a 75.0% controlling interest in Riverbank Solutions Limited, a fintech entity focused on payment systems, as part of its strategic initiative to bolster digital capabilities and reinforce its footprint in banking, agency solutions, and business services across Kenya, Uganda, and Rwanda. Riverbank, a collaborator with KCB since 2013 in agency banking, brings expertise in digital payments, payroll management, and financial reporting, which KCB aims to harness to enhance its offerings tailored for small and medium enterprises (SMEs) and micro, small, and medium enterprises (MSMEs). The integration of Riverbank’s capabilities is expected to facilitate the unification of KCB’s agent banking channels into a single platform, optimizing operational efficiency.
- On April 14, 2025, the Central Bank of Kenya announced the acquisition of 100.0% shareholding of National Bank of Kenya Limited (NBK) by Access Bank Plc from KCB Group Plc, following CBK’s approval on April 4, 2025 under Section 13 (4) of the Banking Act, and approval by the Cabinet Secretary for the National Treasury and Economic Planning on April 10, 2025, pursuant to Section 9 of the Banking Act. As part of the transaction, CBK, on April 4, 2025, further approved the transfer of certain assets and liabilities of National Bank of Kenya Limited to KCB Bank Kenya Limited pursuant to Section 9 of the Banking Act. The acquisition and completion of the transaction was finalised on 30th May 2025 in accordance with the terms of the Agreement between the parties.
- On March 20, 2024 Access Bank Plc announced that it had entered into a share purchase agreement with KCB Group Plc that would allow Access Bank Plc to acquire 100% shareholding in National Bank of Kenya Limited (NBK) from KCB. Access Bank Plc is a wholly owned subsidiary of Access Holdings Plc listed on the Nigerian Exchange as Access Corporation. Notably, KCB Bank had acquired the National Bank of Kenya back in 2019 in a rescue deal that was supervised by the Central Bank of Kenya. The announcement followed the release of the Q1’2024 results for the KCB group, which revealed a decline in earnings with its Core earnings per share (EPS) declining by 8.3% to Kshs 11.7, from Kshs 12.7 in FY’2022. The transaction represents an important milestone for Access Bank as it moves closer to the achievement of its five-year strategic plan through increased scale in the Kenyan market. In the signed deal, Access Bank will pay multiples of 1.3x the book value of NBK, which stood at Kshs 10.6 bn as of end December 2023. This values the deal at about Kshs 13.3 bn with the actual figure to be announced when the transaction is completed.
The following are Mergers and Acquisitions that were completed in 2024:
- In April 2024, Sidian Bank disclosed that the founders of the bank and other nine individual shareholders relinquished a combined stake of 728,525 shares representing 16.6% stake to Pioneer General Insurance Limited, pioneer Life Investments Limited, Wizro Enterprises Limited, Afrah Limited, and Telesec Africa Limited. The transaction amounted to Kshs 0.8 bn translating to a price to book multiple (p/bv) of 1.0x. This follows an earlier transaction executed on October 2023 when Pioneer General Insurance, Wizpro Enterprise and Afram Limited bought 38.9% stake in the lender following a shareholders’ resolution passed on 20th September 2023 approving the sale,
Below is a summary of the deals in the last 13 years that have either happened, been announced or expected to be concluded:
|
Cytonn Report: Banking Sector Deals and Acquisitions |
||||||
|
Acquirer |
Bank Acquired |
Book Value at Acquisition (Kshs bn) |
Transaction Stake |
Transaction Value (Kshs bn) |
P/Bv Multiple |
Date |
|
Zenith Bank |
Paramount Bank |
Unknown |
100.0% |
Undisclosed |
N/A |
Apr-26 |
|
Nedbank |
NCBA |
6.0 |
66.0% |
5.4 |
1.4x |
Jan-26 |
|
KCB |
Pesapal |
Unknown |
Undisclosed |
Undisclosed |
N/A |
Nov-25 |
|
KCB |
Riverbank |
Unknown |
75.0% |
2.0 |
N/A |
Mar-25 |
|
Access Bank PLC (Nigeria) |
National Bank of Kenya |
10.6 |
100.00% |
13.3 |
1.3x |
Apr-25 |
|
Pioneer General Insurance and four other companies |
Sidian Bank |
5.0 |
16.57% |
0.8 |
1.0x |
Apr-24 |
|
Pioneer General Insurance and two other companies |
Sidian Bank |
5.0 |
38.91% |
2.0 |
1.0x |
Oct-23 |
|
Equity Group |
Cogebanque PLC ltd |
5.7 |
91.13% |
6.7 |
1.3x |
Dec-23 |
|
Shorecap III |
Credit Bank Plc |
3.6 |
20.00% |
0.7 |
1.0x |
Jun-23 |
|
Premier Bank Limited |
First Community Bank |
2.8 |
62.50% |
Undisclosed |
N/A |
Mar-23 |
|
KCB Group PLC |
Trust Merchant Bank (TMB) |
12.4 |
85.00% |
15.7 |
1.5x |
Dec-22 |
|
Equity Group |
Spire Bank |
Unknown |
Undisclosed |
Undisclosed |
N/A |
Sep-22* |
|
Access Bank PLC (Nigeria)* |
Sidian Bank |
4.9 |
83.40% |
4.3 |
1.1x |
June-22* |
|
KCB Group |
Banque Populaire du Rwanda |
5.3 |
100.00% |
5.6 |
1.1x |
Aug-21 |
|
I&M Holdings PLC |
Orient Bank Limited Uganda |
3.3 |
90.00% |
3.6 |
1.1x |
Apr-21 |
|
KCB Group** |
ABC Tanzania |
Unknown |
100.00% |
0.8 |
0.4x |
Nov-20* |
|
Co-operative Bank |
Jamii Bora Bank |
3.4 |
90.00% |
1 |
0.3x |
Aug-20 |
|
Commercial International Bank |
Mayfair Bank Limited |
1.0 |
51.00% |
Undisclosed |
N/A |
May-20* |
|
Access Bank PLC (Nigeria) |
Transnational Bank PLC. |
1.9 |
100.00% |
1.4 |
0.7x |
Feb-20* |
|
Equity Group ** |
Banque Commerciale Du Congo |
8.9 |
66.50% |
10.3 |
1.2x |
Nov-19* |
|
KCB Group |
National Bank of Kenya |
7.0 |
100.00% |
6.6 |
0.9x |
Sep-19 |
|
CBA Group |
NIC Group |
33.5 |
53%.47% |
23 |
0.7x |
Sep-19 |
|
Oiko Credit** |
Credit Bank |
3.0 |
22.80% |
1 |
1.5x |
Aug-19 |
|
CBA Group** |
Jamii Bora Bank |
3.4 |
100.00% |
1.4 |
0.4x |
Jan-19 |
|
AfricInvest Azure |
Prime Bank |
21.2 |
24.20% |
5.1 |
1.0x |
Jan-18 |
|
KCB Group |
Imperial Bank |
Unknown |
Undisclosed |
Undisclosed |
N/A |
Dec-18 |
|
SBM Bank Kenya |
Chase Bank Ltd |
Unknown |
75.00% |
Undisclosed |
N/A |
Aug-18 |
|
DTBK |
Habib Bank Kenya |
2.4 |
100.00% |
1.8 |
0.8x |
Mar-17 |
|
SBM Holdings |
Fidelity Commercial Bank |
1.8 |
100.00% |
2.8 |
1.6x |
Nov-16 |
|
M Bank |
Oriental Commercial Bank |
1.8 |
51.00% |
1.3 |
1.4x |
Jun-16 |
|
I&M Holdings |
Giro Commercial Bank |
3.0 |
100.00% |
5 |
1.7x |
Jun-16 |
|
Mwalimu SACCO |
Equatorial Commercial Bank |
1.2 |
75.00% |
2.6 |
2.3x |
Mar-15 |
|
Centum |
K-Rep Bank |
2.1 |
66.00% |
2.5 |
1.8x |
Jul-14 |
|
GT Bank |
Fina Bank Group |
3.9 |
70.00% |
8.6 |
3.2x |
Nov-13 |
|
Average |
|
|
74.5% |
|
1.3x |
|
|
Average: 2013 to 2018 |
|
|
73.5% |
|
1.7x |
|
|
Average: 2019 to 2026 |
|
|
73.2% |
|
1.0x |
|
|
* Announcement Date ** Deals that were dropped |
||||||
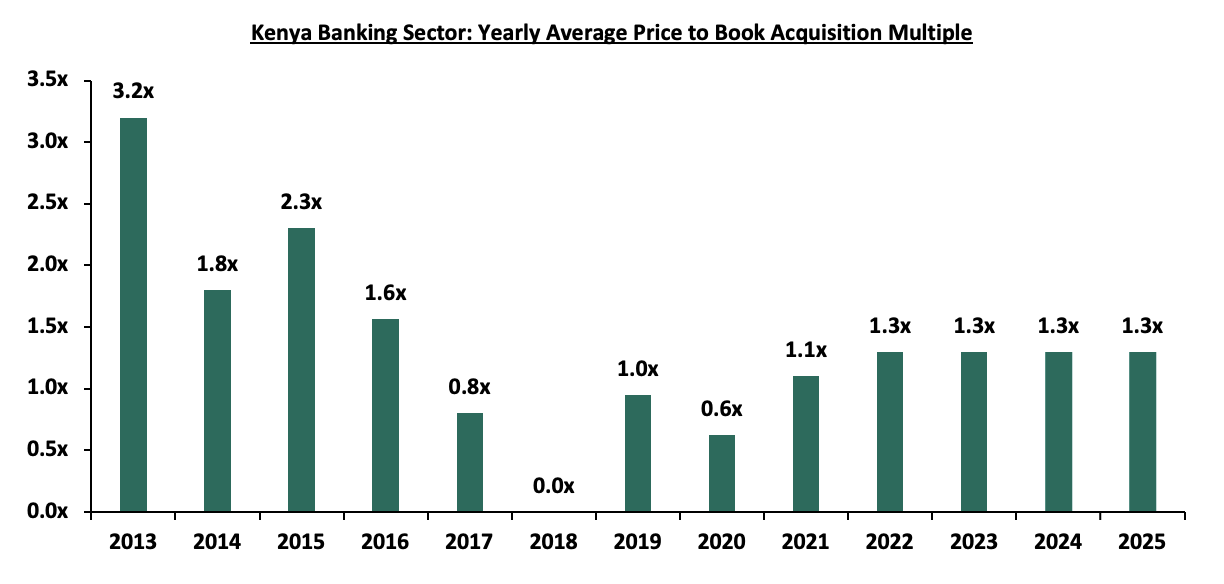
In 2025, the average acquisition valuations for banks have remained unchanged at 1.3x, similar to what was recorded in a similar period in 2024. As such, the valuations still remain low compared to historical prices paid, as highlighted in the chart below;
As at the end of FY’2025, the number of commercial banks in Kenya stood at 38, same as in FY’2024, but lower than the 43 licensed banks in FY’2015. The ratio of the number of banks per 10 million population in Kenya now stands at 6.5x, which is a reduction from 9.0x in FY’2015, demonstrating continued consolidation in the banking sector. However, despite the ratio improving, Kenya still remains overbanked as the number of banks remains relatively high compared to the African major economies. To bring the ratio to 5.6x, we ought to reduce the number of banks from the current 38 banks to about 33 banks. This is partly expected to be supported by the enactment of The Business Laws (Amendment) Act 2024 that mandated a significant increase in the minimum core capital for banks to Kshs 10.0 bn from the previous Kshs 1.0 bn that had been in effect since 2012. To facilitate compliance, lenders below this threshold were directed to incrementally grow the figure over a 5-year period, required to close 2025 with a minimum core capital of Kshs 3.0 bn, rising to Kshs 5.0 bn by the end of 2026, and full compliance at Kshs 10.0 bn by the end of 2029. The new capital requirement is likely to trigger further mergers and acquisitions (M&As), especially for smaller lenders that may struggle to meet the threshold, potentially reducing the number of banks even further. However, the effect could be muted by the lifting of the moratorium which ended on 1st July 2025. The chart below shows the commercial bank ratio per 10 million people across select African nations in comparison to Kenya;
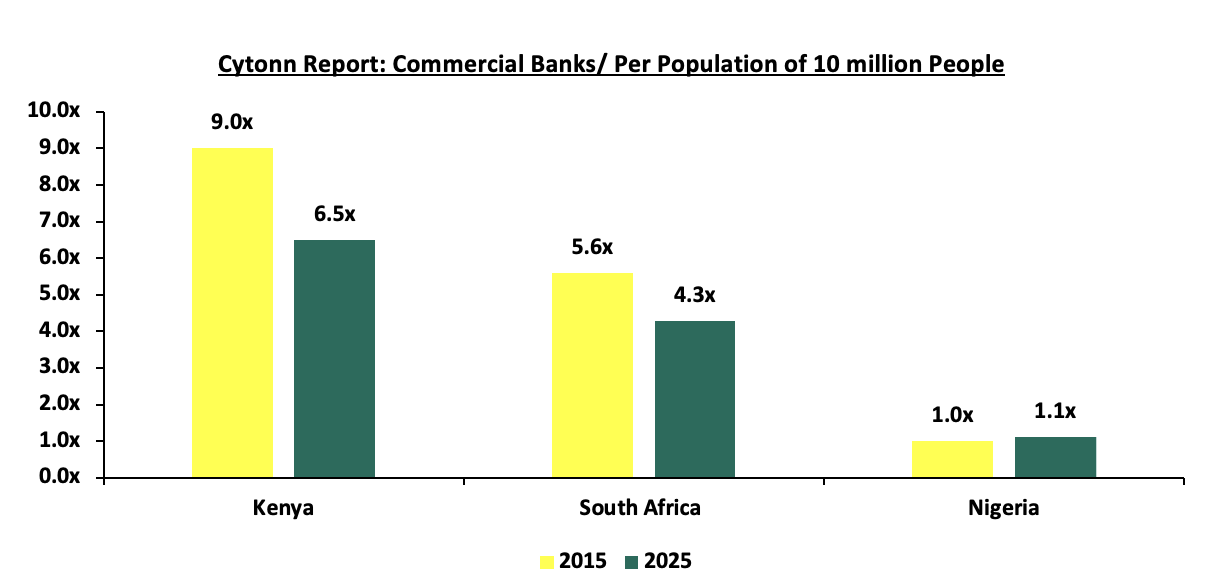
Source: World Bank, Central Bank of Kenya, South Africa Reserve Bank, Central Bank of Nigeria
The Central Bank of Kenya (CBK) ended its moratorium on licensing new commercial banks, effective July 1, 2025, a restriction that had been in place since November 2015 to support sector reforms. During the moratorium period, the banking sector strengthened through improved regulatory frameworks, greater consolidation, and the entry of strategic investors, with the number of banks declining to 38 from 43 in 2015. With the restriction lifted, new entrants can now apply for greenfield banking licenses, provided they meet the revised minimum core capital requirement of Kshs 10.0 billion. This shift reduces dependence on mergers and acquisitions as the main entry route and opens up direct market entry under stricter capital requirements.
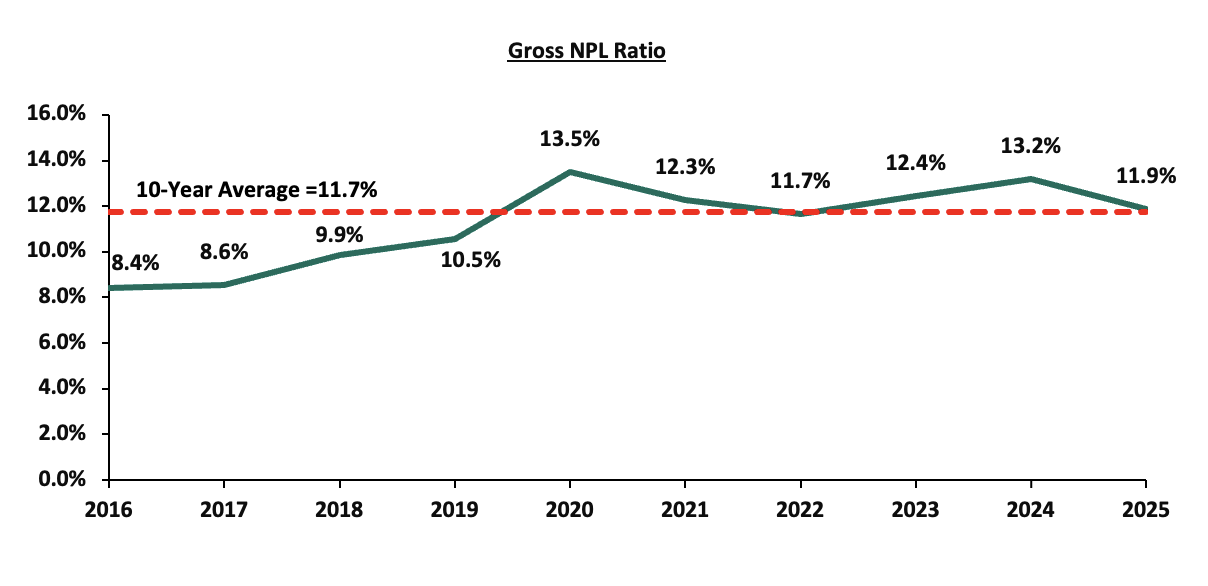
- Asset Quality: Asset quality for listed banks improved in FY’2025, with the weighted average Gross Non-Performing Loan ratio (NPL) decreasing by 1.3% points to 11.9%, from 13.2% recorded in FY’2024. The performance remained 1.2% points above the ten-year average of 11.7%. Notably, all the 10 listed banks recorded a decrease in their NPL ratios, signalling an improvement in asset quality even as credit risk remains elevated compared to historical levels, albeit showing signs of moderation following recent monetary policy easing and improving lending conditions. Similarly, most banks experienced a decline in gross non-performing loans coupled with growth in gross loans. As a result, the overall gross non-performing loans (NPL) ratio in the banking industry decreased by 1.5% points, falling to 15.4% in December 2025 from 16.9% in September 2025. Additionally, KCB Group’s NPL ratio declined the most by 3.7% points to 16.2%, from 19.8% in FY’2024, while HF Group’s NPL ratio decreased by 3.1% points to 22.2%, from 25.3% in FY’2024. KCB’s asset quality improved due to a 0% increase in gross loans to Kshs 1,308.3 bn, from Kshs 1,137.2 bn recorded in FY ‘2024 compared to the 6.1% decrease in Gross non-performing loans to Kshs 211.8 bn, from Kshs 225.7 bn in FY’2024. Similarly, HF Group’s asset quality improved due to a 5.3% growth in gross loans to Kshs 49.8 bn from Kshs 47.3 bn in FY’2024, compared to the 7.5% decline in gross non-performing loans to Kshs 11.1 bn from Kshs 12.0 bn in FY’2024. The chart below highlights the asset quality trend for the listed banks:
All the ten listed Kenyan banks recorded an improvement in asset quality, supported by enhanced credit risk management and early signs of economic recovery as the recent Central Bank Rate (CBR) cuts began to filter through the economy. In a bid to curb inflation and support the Shilling the Monetary Policy Committee (MPC) had adopted an accommodative monetary policy stance, lowering the Central Bank Rate (CBR) to 9.00% in December 2025 compared to 11.25% in December 2024. With commercial banks required to reflect these lower rates in their loan pricing, the banks weighted average lending rates therefore declined by 2.1% points to 14.8% in December 2025 from 16.8% in December 2025. As a result of the low interest rates, the private sector credit growth improved recording expansions of 5.9% in December 2025 and further to 8.1% in March 2026, up from a contraction of 1.4% in December 2024. The chart below shows the private sector credit growth:
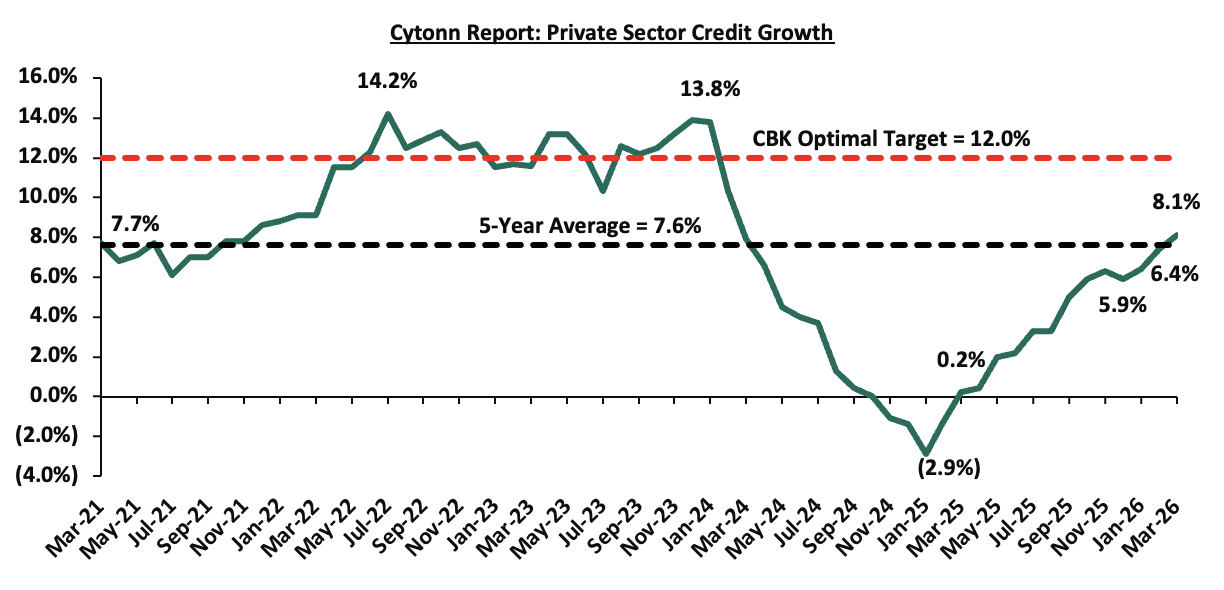
The Central Bank of Kenya has lowered the Central Bank Rate (CBR) by a cumulative 425 basis points, from 13.0% in July 2024 to 8.75% in February 2026, signalling a gradual easing of monetary policy following the successful stabilization of the currency and anchoring of inflation. However, in the April 2026 meeting, the MPC maintained the CBR rate at 8.75% pausing the easing, to anchor inflation expectations within the 2.5%–7.5% target band while also supporting exchange rate stability. The Committee further highlighted that rising global oil prices, driven largely by geopolitical tensions in the Middle East, present upside inflation risks through potential second-round effects.
The earlier easing cycle, with the CBR cut to 8.75% from 13.00% in July 2024, has supported stronger credit demand and improved loan growth prospects as borrowing costs declined. The decision to pause now is likely to keep lending conditions steady, sustaining the recovery in credit uptake without further accelerating it, as banks continue benefiting from the prior rate cuts already transmitted into the market. Notably, growth in private sector credit grew by 8.1% in March 2026 from 7.4% in February 2026 and a contraction of 2.9% in January 2025, reflecting improved demand for credit in line with the declining lending interest rates. Going forward, we expect credit risk to decline gradually as earlier interest rate easing supports stronger repayment capacity and improving credit growth. Nonetheless, the ongoing US–Iran tensions add an upside risk to credit risk through potential oil price shocks, which could reignite inflationary pressures, squeeze disposable incomes, and raise debt servicing burdens for households and corporates, slowing the pace of improvement.
The table below highlights the asset quality for the listed banking sector:
|
Cytonn Report: Listed Banks Asset Quality |
||||||
|
FY'2025 NPL Ratio* |
FY'2024 NPL Ratio** |
% point change in NPL Ratio |
FY'2025 NPL Coverage* |
FY'2024 NPL Coverage** |
% point change in NPL Coverage |
|
|
KCB Group |
16.2% |
19.8% |
(3.7%) |
74.0% |
65.1% |
9.0% |
|
HF Group |
22.2% |
25.3% |
(3.1%) |
78.2% |
70.3% |
8.0% |
|
Equity Group |
11.5% |
13.6% |
(2.1%) |
66.8% |
63.7% |
3.1% |
|
Standard Chartered Bank |
5.5% |
7.4% |
(2.0%) |
87.0% |
81.8% |
5.2% |
|
I&M Group |
9.6% |
11.5% |
(1.8%) |
71.6% |
62.3% |
9.3% |
|
Co-operative Bank |
15.7% |
17.0% |
(1.3%) |
66.0% |
63.9% |
2.1% |
|
Diamond Trust Bank |
11.3% |
12.6% |
(1.3%) |
52.8% |
39.9% |
13.0% |
|
Stanbic Holdings |
8.0% |
9.1% |
(1.1%) |
84.3% |
78.4% |
5.9% |
|
Absa Bank Kenya |
11.5% |
12.6% |
(1.1%) |
64.6% |
66.0% |
(1.4%) |
|
NCBA Group |
10.4% |
11.5% |
(1.0%) |
71.6% |
59.2% |
12.4% |
|
Mkt Weighted Average* |
11.9% |
13.2% |
(1.3%) |
71.5% |
66.8% |
4.7% |
|
*Market cap weighted as at 17/04/2026 |
||||||
|
**Market cap weighted as at 17/04/2025 |
||||||
Key take-outs from the table include;
- Asset quality for the listed banks improved in FY’2025, with market weighted average NPL decreasing by 1.3% points to 11.9% from 13.2% in FY’2024. The improvement in the asset quality was mainly driven by an Improvement in KCB Group, HF Group, Equity Group, Standard Chartered Bank and I&M Group’s asset quality with their NPL ratio decreasing by 3.7%, 3.1%, 2.1%, 2.0% and 1.8% points respectively,
- KCB Group and HF Group had the highest NPL ratio declines by 3.7% and 3.1% points respectively to 16.2% and 22.2%, from 19.8% and 25.2% respectively in FY’2024. KCB’s asset quality improved due to a 15.0% increase in gross loans to Kshs 1,308.3 bn, from Kshs 1,137.2 bn recorded in FY ‘2024 compared to the 6.1% decrease in Gross non-performing loans to Kshs 211.8 bn, from Kshs 225.7 bn in FY’2024. Similarly, HF Group’s asset quality improved due to a 5.3% growth in gross loans to Kshs 49.8 bn from Kshs 47.3 bn in FY’2024, compared to the 7.5% decline in gross non-performing loans to Kshs 11.1 bn from Kshs 12.0 bn in FY’2024, and,
- Market weighted average NPL Coverage for the listed banks increased by 4.7% points to 71.5% in FY’2025, from 66.8% recorded in FY’2024, majorly on the back of increased NPL coverage recorded by Diamond Trust Bank Kenya, NCBA Group, I&M Group, KCB Group, HF Group, Stanbic, Standard Chartered Bank, Equity Group and Co-operative Bank by 13.0%, 12.4%, 9.3%, 9.0%, 8.0%, 5.9%, 5.2%, 3.1% and 2.1% points respectively in FY’2025. However, the NPL coverage ratio of Absa Bank Kenya decreased by 1.4% points in FY’2025.
Section II: Summary of the Performance of the Listed Banking Sector in FY’2025:
The table below highlights the performance of the banking sector, showing the performance using several metrics, and the key take-outs of the performance;
|
Cytonn Report: Kenyan Listed Banks Performance FY’2025 |
|||||||||||||||
|
Bank |
Core EPS Growth |
Interest Income Growth |
Interest Expense Growth |
Net Interest Income Growth |
Net Interest Margin |
Non-Funded Income Growth |
NFI to Total Operating Income |
Growth in Total Fees & Commissions |
Deposit Growth |
Growth in Government Securities |
Loan to Deposit Ratio |
Loan Growth |
Return on Average Equity |
COF |
YIEA |
|
Equity Group |
54.7% |
2.0% |
(24.2%) |
16.8% |
7.8% |
6.7% |
41.7% |
7.9% |
4.0% |
11.4% |
60.6% |
7.7% |
27.8% |
3.1% |
10.6% |
|
Diamond Trust Bank |
23.1% |
2.8% |
(16.3%) |
24.1% |
6.7% |
(9.1%) |
25.3% |
10.4% |
13.8% |
17.7% |
63.7% |
13.6% |
11.7% |
5.2% |
11.8% |
|
I&M Group |
21.2% |
(1.4%) |
(23.9%) |
16.0% |
8.5% |
30.8% |
23.8% |
20.9% |
17.4% |
55.5% |
63.3% |
6.5% |
17.8% |
4.7% |
12.8% |
|
Co-operative Bank |
16.9% |
8.0% |
(12.8%) |
22.0% |
9.2% |
(0.3%) |
31.6% |
1.2% |
13.4% |
12.6% |
73.3% |
12.6% |
19.1% |
5.0% |
13.6% |
|
KCB Group |
11.2% |
(1.7%) |
(18.9%) |
7.8% |
8.6% |
(2.6%) |
30.8% |
0.7% |
15.2% |
10.2% |
72.3% |
16.3% |
22.5% |
3.8% |
12.1% |
|
Absa Bank Kenya |
9.7% |
(10.9%) |
(22.2%) |
(6.4%) |
9.1% |
12.2% |
29.4% |
18.8% |
1.4% |
20.7% |
83.8% |
1.0% |
24.7% |
3.5% |
12.2% |
|
NCBA Group |
7.0% |
(10.0%) |
(41.6%) |
27.7% |
7.5% |
3.8% |
39.9% |
4.0% |
5.9% |
4.6% |
59.6% |
5.0% |
19.7% |
4.5% |
11.7% |
|
Stanbic Group |
0.0% |
(17.2%) |
(41.4%) |
(1.0%) |
5.7% |
(6.4%) |
37.5% |
(10.0%) |
19.5% |
36.4% |
70.3% |
17.2% |
17.6% |
3.8% |
10.2% |
|
HF Group |
(16.7%) |
17.3% |
(15.8%) |
63.9% |
6.9% |
19.9% |
29.3% |
(3.5%) |
17.7% |
66.6% |
73.6% |
5.8% |
8.5% |
5.7% |
11.9% |
|
Standard Chartered Bank |
(38.0%) |
(15.4%) |
(29.1%) |
(13.1%) |
8.7% |
(23.0%) |
31.7% |
1.0% |
(4.1%) |
11.8% |
54.4% |
1.8% |
18.0% |
1.4% |
9.8% |
|
FY'2025 Mkt Weighted Average* |
15.1% |
(3.8%) |
(24.9%) |
10.8% |
8.1% |
1.9% |
33.9% |
5.4% |
8.7% |
17.4% |
67.5% |
8.9% |
21.5% |
3.8% |
11.6% |
|
FY’2024 Mkt Weighted Average** |
25.7% |
21.1% |
43.6% |
11.7% |
7.7% |
12.2% |
36.3% |
7.3% |
(4.4%) |
15.4% |
66.3% |
(7.7%) |
22.9% |
5.0% |
12.5% |
|
*Market cap weighted as at 17/04/2026 |
|||||||||||||||
|
**Market cap weighted as at 17/04/2025 |
|||||||||||||||
Key takeaways from the table include:
- The listed banks recorded a 15.1% growth in core Earnings per Share (EPS) in FY’2025, compared to the weighted average growth of 25.7% in FY’2024, an indication of weaker performance on the back of a 9% growth in non-funded income in FY’2025, compared to a growth of 12.2% in FY’2024. This was majorly attributable to a decline in foreign exchange income due to reduced dollar demand and lower transaction volumes weighing down on fees and commissions income growth which declined by 1.9% points to 5.4% in FY’2025 from 7.3% in FY’2024. The performance during the period highlights banks’ reliance on interest income as reflected in the faster decline in the non-funded income weighted average growth to 1.9% from 12.2% in FY’2024 compared to a marginal decline in net interest income weighted average growth to 10.8% from 11.7% in FY’2024 that resulted in a slowdown in earnings growth,
- Investments in government securities investments by listed banks increased in FY’2025, having recorded a market-weighted average growth of 17.4%, from the 15.4% growth recorded in FY’2024, with all of the listed banks recording increases in government securities investments. The increase was as a result of banks deploying excess liquidity into safe, attractive government securities, while the decline in treasury bonds yields in 2025 also boosted the market value of existing bonds, generating capital gains and reinforcing the appeal of holding government debt. HF Group and I&M Group recorded the largest increases of 66.6% and 55.5% respectively,
- The listed banks’ Net loans and advances to customers recorded a weighted average growth of 8.9% in FY’2025, an increase from the 7.7% decline recorded in FY’2024, indicating increased lending activity supported by easing borrowing costs, as a result of declining lending interest rates,
- Interest income recorded a weighted average decline of 3.8% in FY’2025, compared to a growth of 21.1% in FY’2024. Similarly, interest expenses recorded a market-weighted average decline of 24.9% in FY’2025 compared to a growth of 43.6% in FY’2024. Consequently, net interest income recorded a weighted average growth of 10.8% in FY’2025, slightly lower than the 11.7% growth recorded in FY’2024, on the back of easing monetary policy leading to lower lending and deposit rates,
- Notably, non-funded income growth softened during the year, as evidenced by non-funded income weighted average growth of 1.9% in FY’2025 compared to a weighted average growth of 12.2% in FY’2024. The performance was largely attributable to the decrease in foreign exchange income recorded by the banks during the period as a result of decreased dollar demand in the country. Additionally, listed banks recorded a weighted average growth of 5.4% in total fees and commissions income in FY’2025 compared to a weighted growth of 7.3% in FY’2024, and,
- The listed banks recorded a 21.5% weighted average growth on return on average equity (RoaE), 1.4% points lower than the 22.9% growth registered in FY’2024. Similarly, the entire banking sector’s Return On Equity (ROE) stood at 22.2% as of December 2025, unchanged from September 2025 and a 0.2% points increase from the 22.0% recorded in December 2024 . On a global level, the Kenyan banking sector continues to record high profitability compared to other economies in the world, as highlighted in the chart below:
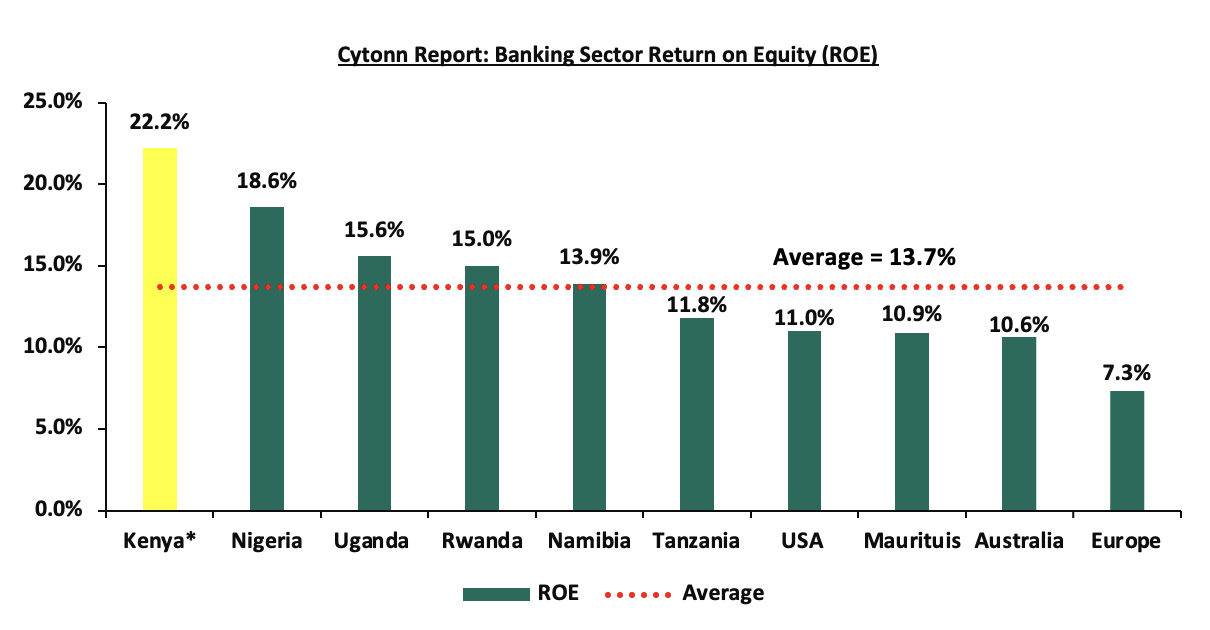
Source: Cytonn research
* Figure as of December 2025
Section III: The Focus Areas of the Banking Sector Players Going Forward:
The banking sector witnessed a slowdown in profitability during the period under review, with the Core Earnings Per Share (EPS) increasing by 15.1% compared to the 25.7% growth registered last year in a similar period, this is primarily due to a 10.3% points decline in non-funded income growth to 1.9% in FY’2025, compared to a growth of 12.2% in FY’2024. This was majorly attributable to a decline in foreign exchange income due to reduced dollar demand and lower transaction volumes weighing down on fees and commissions income Notably, five of the ten listed banks recorded a decline in non-funded income in FY’2025, while Equity and HF recorded slower growths in non-funded income compared to FY’2024, highlighting the sector’s continued reliance on interest income. This concentration has exposed banks to earnings pressure in an increasingly interest-rate-sensitive environment. While there were expectations of an improved operating environment following continued monetary policy easing, evidenced by a lower Central Bank Rate (CBR) of 9.0% as of December 2025 and 8.75% as of April 2026, and a relatively stable Shilling, the broader economic performance has yet to translate into meaningful revenue diversification or asset quality improvement. Consequently, profitability remains constrained, and it is uncertain whether banks will reduce provisioning levels in the near term. Any moderation in provisioning will largely depend on sustained economic recovery and a material easing of credit risk. Notably, general provisions among listed banks recorded a lower weighted growth of 0.2% in FY’2025, compared to 3.2% in FY’2024, indicating that banks have started to decrease their provisioning to cushion themselves from credit risk due to the more accommodative monetary policy stance. However, the escalation of geopolitical tensions, particularly the US–Iran conflict, could reverse this trend by heightening inflationary pressures through oil price shocks, weakening borrower repayment capacity, and potentially prompting banks to maintain higher precautionary provisioning levels. Based on the current operating environment, we believe the future performance of the banking sector will be shaped by the following key factors:
- Growth in Interest income: Going forward, we expect interest income growth to remain a key driver in the banking industry. With the recent easing of monetary policy by the Central Bank of Kenya, which lowered the Central Bank Rate (CBR) by 25 basis points to 8.75% in February 2026 and maintained in the April 2026 MPC meeting, signals a gradual reduction in borrowing costs. This is likely to support an increase in credit uptake, expanding banks' loan books and consequently boosting interest income. Additionally, the continued use of banks' risk-based lending models will enable banks to effectively price their risk, further contributing to the growth of interest income.,
- Revenue Diversification: In FY’2025, non-funded income (NFI) recorded a 1.9% weighted average growth, compared to the 12.2% weighted growth in FY’2024. This contraction was largely driven by lower foreign exchange income, reflecting subdued FX trading volumes and reduced transactional activity as exchange rate volatility remained relatively muted, limiting trading and revaluation gains despite the broadly stable Shilling. In addition, the slowdown in fees and commissions income, one of the key components of NFI, also contributed to the weaker performance, with growth moderating to 5.4% in FY’2025 from 7.3% in FY’2024, reflecting softer transactional volumes and a potential tapering in digital revenue momentum. Notably, this deceleration occurred with 5 of the 10 listed Banks recording a decrease in their non-funded income. As a result of the decline in non-funded income (NFI) the weighted average contribution of NFI to total operating income came in at 33.9% in FY’2025, 2.4% points lower than the 36.3% weighted average contribution recorded in FY’2024 and as such, there still exists an opportunity for the sector to further increase NFI contributions to revenue given the continuous adoption of digitization,
- Growth in Loans and Advances: All the 10 listed banks recorded growth in loans and advances to customers, resulting in a weighted average growth in loans of 8.9% relative to the 7.7% decline recorded in a similar period in 2024. With the consistent ease in the Central Bank Rate (CBR) recently, borrowing costs are expected to decline. The MPC’s decision to maintain the CBR at 8.75% in April 2026, after prior easing, signals a pause in the monetary policy easing cycle. This is likely to stabilise borrowing costs at their current lower levels rather than drive further declines, meaning credit growth will continue to benefit from earlier rate cuts but without additional near-term stimulus from policy easing. As a result, loan growth should remain supported by improved affordability and stronger private sector demand, but its pace may moderate compared to a scenario of continued rate reductions. To drive further loan growth, banks must leverage opportunities such as risk-based lending models, improved customer segmentation, and expanding access to credit in underserved sectors, and,
- Regional Expansion and Further Consolidation: Consolidation remains a key theme going forward with the current environment offering opportunities for larger banks with a sufficient capital base to expand and take advantage of the market's low valuations, as well as further consolidate out smaller and weaker banks. Notably, the majority of the bigger banks have continued to cushion over unsystematic risks specific to the local market by expanding their operations into other African nations. Banks such as KCB and Equity Group have been leveraging on expansion and consolidation, which has largely contributed to their increased asset base as well as earnings growth. Additionally, we expect the increased capital requirements imposed on banks to further accelerate consolidation, as only well-capitalized banks are able to meet these thresholds while pursuing expansion opportunities. As such, we expect to see a continued expansion trend aimed at revenue optimization.
- Geopolitical Tensions: Geopolitical tensions stemming from the US–Iran conflict are likely to weigh on the Kenyan banking sector through higher global oil prices, which feed into domestic inflation and raise the cost of living, thereby pressuring borrowers’ repayment capacity and elevating credit risk. This environment may also dampen economic activity and investor sentiment, leading to more cautious lending behaviour, slowed credit growth, and a preference by banks to hold higher precautionary buffers in anticipation of potential asset quality deterioration. In addition, the resulting external shocks could weaken the Kenyan shilling through a wider current account deficit and higher import costs, negatively affecting banks by increasing the cost of servicing foreign currency liabilities, heightening FX-related credit risk for unhedged borrowers, and amplifying volatility in foreign currency income and balance sheet valuations.
Section IV: Brief Summary and Ranking of the Listed Banks:
As per our analysis of the banking sector from a franchise value and a future growth opportunity perspective, we carried out a comprehensive ranking of the listed banks. For the franchise value ranking, we included the earnings and growth metrics as well as the operating metrics shown in the table below in order to carry out a comprehensive review of the banks:
|
Cytonn Report: Listed Banks Earnings, Growth and Operating Metrics FY’2025 |
||||||||
|
Bank |
Loan to Deposit Ratio |
Cost to Income (With LLP) |
Return on Average Capital Employed |
Deposits/ Branch (bn) |
Gross NPL Ratio |
NPL Coverage |
Tangible Common Ratio |
Non-Funded Income/Revenue |
|
Absa Bank |
83.8% |
46.7% |
24.7% |
4.2 |
11.5% |
64.6% |
18.5% |
29.4% |
|
HF Group |
73.6% |
75.9% |
8.5% |
2.5 |
10.4% |
71.6% |
17.0% |
39.9% |
|
Coop Bank |
73.3% |
56.6% |
19.1% |
2.6 |
11.5% |
66.8% |
14.9% |
41.7% |
|
KCB Group |
72.3% |
57.5% |
22.5% |
3.5 |
16.2% |
74.0% |
14.7% |
30.8% |
|
Stanbic Bank |
70.3% |
50.9% |
17.6% |
12.8 |
5.5% |
87.0% |
17.0% |
31.7% |
|
DTBK |
63.7% |
70.1% |
11.7% |
3.2 |
15.7% |
66.0% |
19.5% |
31.6% |
|
I&M Holdings |
63.3% |
61.2% |
17.8% |
4.4 |
8.05% |
84.3% |
13.2% |
37.5% |
|
Equity Bank |
60.6% |
57.7% |
27.8% |
3.6 |
11.3% |
52.8% |
15.1% |
25.3% |
|
NCBA Group |
59.6% |
62.1% |
19.7% |
4.3 |
9.6% |
71.6% |
16.3% |
23.8% |
|
SCBK |
54.4% |
60.2% |
18.0% |
12.9 |
22.2% |
78.2% |
21.0% |
29.3% |
|
Weighted Average FY'2025 |
67.5% |
57.1% |
21.5% |
5.3 |
11.9% |
71.5% |
16.4% |
33.9% |
|
Market cap weighted as at 17/04/2026 |
||||||||
The overall ranking was based on a weighted average ranking of Franchise value (accounting for 60.0%) and intrinsic value (accounting for 40.0%). The Intrinsic Valuation is computed through a combination of valuation techniques, with a weighting of 40.0% on Discounted Cash-flow Methods, 35.0% on Residual Income, and 25.0% on Relative Valuation, while the Franchise ranking is based on a bank’s operating metrics, meant to assess efficiency, asset quality, diversification, and profitability, among other metrics. The overall FY’2025 ranking is as shown in the table below:
|
Cytonn Report: Listed Banks FY’2025 Rankings |
|||||
|
Bank |
Franchise Value Rank |
Intrinsic Value Rank |
Weighted Rank Score |
FY'2024 Rank |
FY'2025 Rank |
|
Equity Bank |
2 |
2 |
2.0 |
7 |
1 |
|
Coop Bank |
5 |
1 |
3.4 |
5 |
2 |
|
KCB Group |
3 |
5 |
3.8 |
2 |
3 |
|
Absa Bank |
1 |
9 |
4.2 |
1 |
4 |
|
SCBK |
3 |
8 |
5.0 |
3 |
5 |
|
NCBA Group |
7 |
3 |
5.4 |
8 |
6 |
|
I&M Holdings |
6 |
7 |
6.4 |
4 |
7 |
|
DTBK |
9 |
4 |
7.0 |
9 |
8 |
|
HF Group |
10 |
6 |
8.4 |
10 |
9 |
|
Stanbic Bank |
8 |
10 |
8.8 |
6 |
10 |
Major Take-outs from the FY’2025 Ranking are:
- Equity Bank climbed up 6 places to position 1 in FY’2025 from position 7 in FY’2024, mainly supported by strong franchise value score and intrinsic value score, attributable to decrease in the cost to income ratio by 11.0% points to 57.7% in FY’2025, from 68.7% in FY’2024 coupled with an increase in the bank’s return on average equity ratio by 5.7% points to 27.8% in FY’2025 from 22.1% in FY’2024,
- Absa Bank slid 3 places to rank at position 4 in FY’2025, down from position 1 in FY’2024 supported by decline in its intrinsic value score and franchise value score. Its performance attributable to the decrease in its return on average equity by 2.4% points to 24.7% in FY’2025 from 27.0% in FY’2024. Notably, the bank’s Net Interest Margin decreased by 1.0% points to 9.1% in FY’2025 from 10.1% in FY’2024,
- Stanbic slid 4 places to rank at position 10 in FY’2025, down from position 6 in FY’2024, attributable a decline in intrinsic value score and the franchise value score mainly on the back of 1.4% points decline in Return on average equity to 17.6% in FY’2025 from the 19.1% recorded inFY’2024, coupled with the 2.1% points increase in its cost to income without LLPs to 46.6% in FY’2025, from 44.5% in FY’2024.
For more information, see our Cytonn FY’2025 Listed Banking Sector Review full report.
Disclaimer: The views expressed in this publication are those of the writers where particulars are not warranted. This publication, which is in compliance with Section 2 of the Capital Markets Authority Act Cap 485A, is meant for general information only and is not a warranty, representation, advice, or solicitation of any nature. Readers are advised in all circumstances to seek the advice of a registered investment advisor.

- Talk to us
- Kenya
- P.O Box 20695 - 00200, Nairobi, Kenya
- Cell +254709101200
- Tel +254709101200
- WhatsApp +254741676635
- United States
- +254709101200
- DOWNLOAD OUR APP
-


- Kenya
- 8th Floor, Pinetree Plaza, Kaburu Drive, Ngong Road, Nairobi, Kenya
- USA
- Suite 1150, 1775 Eye Street NW, USA, Washington DC 20006, USA
- Investments
- High Yield
- Private Equity
- Real Estate
- Real Estate
- RiverRun Estates
- Cytonn Towers
- The Ridge
- Taraji Heights
- The Alma