Aug 14, 2022
In September 2021, we published the Kenya Retail Report 2021 themed “Rapid Expansion by Retailers to Cushion the Retail Sector,” which highlighted that the Kenyan retail sector performance recorded a 0.1% increase in the average rental yield to 6.8%, from 6.7% in 2020. The average occupancy rate and rent also increased by 1.8% points and 2.2% points, respectively, to 78.4% and Kshs 118 per SQFT in 2021 from 76.6% and Kshs 115 per SQFT in 2020, respectively. This was mainly attributed to an improved business environment as well as aggressive expansion by local and international retailers such as Carrefour and Naivas which cushioned the overall performance of the retail market.
This week, we update our Kenya Retail Report 2021 with the Kenya Retail Report 2022 themed “Accelerated Retail Investments” in which we discuss the progress and performance of the Kenyan retail sector. We conducted research on 9 nodes within the Nairobi metropolitan Area (NMA), as well as other key urban cities in Kenya which include Nakuru, Kisumu, Eldoret, Mombasa, and the Mount Kenya Region, in order to identify the market performance based on rents, occupancy rates, and rental yields. We shall therefore cover the topic in the following ways;
- Overview of the Kenya Retail Sector in 2022,
- Kenya Retail Sector 2022 Performance Summary,
- Retail Space Demand Analysis,
- Retail Sector Investment Opportunity, and,
- Retail Sector Outlook.
Section I: Overview of the Kenya Retail Sector in 2022
The Kenya retail sector registered increased market activities in 2022 evidenced by the aggressive expansion by major local and international retailers, and developments. Some of the retailers who have been on an aggressive expansion drive during the year include; i) Naivas supermarket which opened 5 new stores spread across Nairobi, Machakos, Kiambu, and, Nakuru Counties, and plans to open a new outlet in Meru County, ii) QuickMart supermarket which opened 3 new stores in Nairobi and Kitengela Counties, and, iii) Chandarana Food Plus which opened a new outlet in Nairobi’s Westlands, and plans to open 4 new outlets in the country. The table below shows a summary of the number of stores of the key local and international retailer supermarket chains in Kenya;
|
Main Local and International Retail Supermarket Chains |
||||||||||
|
Name of retailer |
Category |
Highest number of branches that have existed as at FY’ 2018 |
Highest number of branches that have existed as at FY’ 2019 |
Highest number of branches that have existed as at FY’ 2020 |
Highest number of branches that have existed as at FY’ 2021 |
Number of branches opened in 2022 |
Closed branches |
Current number of branches |
Number of branches expected to be opened |
Projected number of branches FY’2022 |
|
Naivas |
Local |
46 |
61 |
69 |
79 |
5 |
0 |
84 |
1 |
85 |
|
QuickMart |
Local |
10 |
29 |
37 |
48 |
3 |
0 |
51 |
0 |
51 |
|
Chandarana |
Local |
14 |
19 |
20 |
23 |
1 |
1 |
24 |
4 |
28 |
|
Carrefour |
International |
6 |
7 |
9 |
16 |
0 |
0 |
16 |
0 |
16 |
|
Cleanshelf |
Local |
9 |
10 |
11 |
12 |
0 |
0 |
12 |
0 |
12 |
|
Tuskys |
Local |
53 |
64 |
64 |
3 |
0 |
61 |
3 |
0 |
3 |
|
Game Stores |
International |
2 |
2 |
3 |
3 |
0 |
0 |
3 |
0 |
3 |
|
Uchumi |
Local |
37 |
37 |
37 |
2 |
0 |
35 |
2 |
0 |
2 |
|
Choppies |
International |
13 |
15 |
15 |
0 |
0 |
13 |
0 |
0 |
0 |
|
Shoprite |
International |
2 |
4 |
4 |
0 |
0 |
4 |
0 |
0 |
0 |
|
Nakumatt |
Local |
65 |
65 |
65 |
0 |
0 |
65 |
0 |
0 |
0 |
|
Total |
|
257 |
313 |
334 |
186 |
9 |
179 |
195 |
5 |
200 |
Source: Cytonn Research
Other franchisees that have embarked on expansion in Kenya include:
- Eat’N’Go Limited, an international fast food chain, which opened a new outlet in Westlands Square, Nairobi, bringing its total operating outlets in Nairobi to 9. In March 2022, the master franchisee for the Domino’s Pizza, Cold Stone Creamery, and Pinkberry Gourmet Frozen Yoghurt brands, also announced plans to open 100 new stores in Kenya, beginning with Nanyuki, Kisumu, Eldoret, and Nakuru towns,
- Optica Limited, a local eye-wear retailer, which opened four new outlets in Kitengela, Imaara Mall, Kilimani, and Ruiru, bringing its total number of operating outlets countrywide to 62,
- Chicken Cottage, a UK fast-food chain announced a partnership deal with Express Kitchen, a subsidiary of AAH Limited to open 50 outlets at Hass Petroleum’s service stations in Kenya, Rwanda, Tanzania and Uganda this year,
- Simbisa Brands, Zimbabwe’s largest fast-food restaurant operator, which runs quick-service restaurants such as Chicken Inn, Pizza Inn, Bakers Inn, and Creamy Inn, announced plans to expand to 245 outlets in Kenya in 2022 from the 190 outlets as at December 2021,
- ChicKing, an international fast food chain, in partnership with M/s Crispy Limited, a local franchise, announced plans to open 30 new outlets in Kenya, over the next five years, and,
- Java House, an international restaurant chain, announced plans to open five new outlets in the country by October 2022.
The aggressive expansion moves by some of the retailers who are also taking up space previously occupied by troubled retailers has continued to cushion the market’s performance. Other developments in the pipeline include the Ojijo Mall in Westlands, and, Beacon Mall in Nairobi’s CBD.
Some of the factors driving growth in the sector include;
- Accessibility- The government has continued to focus on the development of infrastructure roads such as the Nairobi Kisumu Highway and Nairobi Expressway, which have improved access to retail stores, while also opening various parts of the country for investment opportunities as well as boosting retail space prices,
- Positive Demographics- Kenya’s relatively high urbanization and population growth rates have continued to drive demand for goods and services which trickles down to the demand for more retail spaces,
- Increasing Foreign Investor Appetite- Kenya’s recognition as a regional hub worldwide has attracted many international organizations and retailers into the country who have continued to increase the demand for retail space in the country,
- Availability of Prime Retail Spaces- This is evidenced by the aggressive expansion of both local and international retailers such as Naivas and Eat’N’Go Limited taking up new as well as spaces previously occupied by troubled retailers such as Tuskys and Nakumatt supermarkets, which has continued to cushion the sector against dwindling occupancy rates. This is in addition to the rapid competition among retailers for the retail spaces in a bid to gain and maintain market popularity and footprint, and,
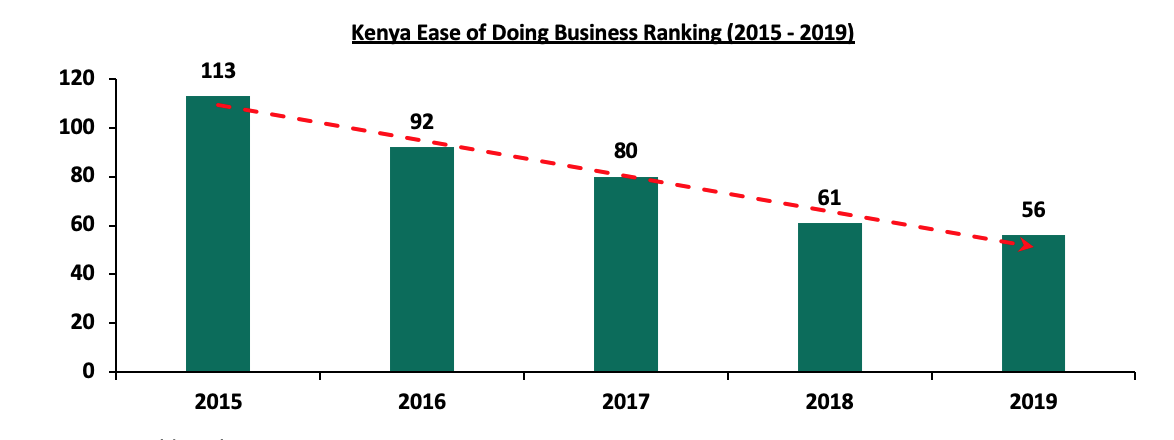
- Ease of Doing Business- Investor confidence has also been enhanced with Kenya currently ranking position 56 in terms of ease of doing business as at 2019 according to the World Bank. This is compared to position 113 five years ago. The improvement has driven more expansion activities and developments in the country thereby initiating growth of the sector. The graph below shows Kenya’s ranking performance over the last five years;
Source; World Bank
Despite the above supporting factors, there exists challenges that impede the growth and overall performance of the sector which include;
- High Construction Costs- The increased building cost indices which stood at 112.1 as of Q1’2022, up from the 102.5 that was recorded in a similar period in 2021, continues to discourage potential development in the sector due to the overall high construction costs,
- Inaccessibility to Credit Loans- Access to adequate credit has remained a challenge, given the increasing loan default rates in the property sector as financial institutions such as commercial banks continue to tighten their lending terms. According to the Central Bank of Kenya, the overall non-performing loans in the Real Estate sector came in at Kshs 78.5 bn in Q1’2022, an 11.3% increase from Kshs 70.5 bn that was recorded in Q1’2021,
- Online Shopping and E-Commerce Strategy- At the onset of the COVID-19 pandemic, most retail business adopted the online and e-commerce business strategy which has led to a decline in the demand for physical retail space and an overall hindrance of its growth and performance, and,
- Oversupply- Urban cities such as Nairobi and Kisumu continue to remain oversupplied at 3.0 mn SQFT and 0.2 mn SQFT, respectively, thereby causing developers to halt their plans awaiting the absorption of the existing spaces.
Section II: Kenya Retail Sector 2022 Performance Summary
Our analysis of the retail market performance covers the general market performance within key nodes in the Nairobi Metropolitan Area (NMA), as well as the performance of key urban cities in the country. The Kenyan retail sector’s overall performance remained stable, with the average rental yield coming in at 6.8% in 2022, unchanged from what was recorded in 2021. Notably, the average rent per SQFT increased by 3.5% to Kshs 122 in 2022 from Kshs 118 in 2021, owing to an improved economy that resulted to increased transaction volumes, coupled with the addition of high end malls that attracted higher rental rates such as the GTC Mall in Nairobi. The average occupancy rate however declined by 1.1% points to 77.3% in 2022, from 78.4% that was recorded in 2021, mainly attributed to the addition of new malls into the market such as the GTC and Meru Greenwood Malls among others, which in turn weighed down the overall absorption rate.
- Retail Sector Performance in Kenya Over Time
The Kenyan retail sector has remained stable over time, despite the decline in the rental yields, with the average rent per SQFT recording a five year negative CAGR of 2.9% to Kshs 122 in 2022, from Kshs 141 that was recorded in 2017. This is as a result of the growing supply of retail spaces that has forced landlords to provide rent discounts in order to attract and retain existing clients while also filling up the excess space. The average occupancy rate also declined by 2.9% points to 77.3% in 2022, from 80.2% that was recorded in 2017, mainly attributed to the addition of new malls into the market, which in turn weighed down the overall absorption rate. The performance of the sector across the key cities is as summarized below:
|
Kenya’s Retail Performance Summary-2022 |
||||||||
|
Item |
2016 |
2017 |
2018 |
2019 |
2020 |
2021 |
2022 |
∆ Y/Y 2022/2021 |
|
Asking rents (Kshs/SQFT) |
155 |
141 |
132 |
118 |
115 |
118 |
122 |
3.5% |
|
Average Occupancy (%) |
82.9% |
80.2% |
86.0% |
77.3% |
76.6% |
78.4% |
77.3% |
(1.1%) |
|
Average Rental Yield |
8.7% |
8.3% |
8.6% |
7.0% |
6.7% |
6.8% |
6.8% |
0.0% |
Source: Cytonn Research
- Nairobi Metropolitan Area (NMA) Retail Market Performance
The NMA retail market recorded an average rental yield of 7.8% in 2022, 0.3% points higher than the 7.5% that was recorded in 2021. The performance was driven by the increased rental and occupancy rates which came in at Kshs 173 per SQFT and 75.9%, respectively in 2022, from Kshs 168 per SQFT and 75.8%, respectively, in 2021.
- Performance by Nodes
Kilimani, Westlands, and, Karen were the best performing nodes with average rental yields of 9.7%, 9.0% and 8.9%, respectively, compared to the overall market average of 7.8%. The remarkable performance was driven by the presence of quality retail spaces fetching prime rents and yields. Additionally, superior locations containing affluent residents with a high consumer purchasing power, and adequate infrastructure supported the performance. However, Westlands recorded the largest decline in the average rental yield, having declined by 0.7% points, from 9.7% in 2021 due to the additional mall supply which hindered the optimum performance.
Eastlands ranked last recording an average rental yield of 5.9%, unchanged from what was recorded in 2021. The rental rates slightly declined by 1.9% to Kshs 133 Per SQFT from Kshs 135 per SQFT as a result of the high competition from informal retail centers. However, the occupancy rate increased by 1.7% points to 74.2% in 2022 from 72.5% in 2021 following the improved uptake of retail spaces in the area such as Naivas supermarket which opened a new outlet at Greenspan Mall, in February 2022.
The table below shows the submarket performance of nodes in the Nairobi Metropolitan Area (NMA):
|
Nairobi Metropolitan area (NMA) 2022 Retail Performance |
||||||||||
|
Area |
Rent Kshs /SQFT 2021 |
Occupancy% 2021 |
Rental Yield 2021 |
Rent Kshs /SQFT 2022 |
Occupancy% 2022 |
Rental Yield 2022 |
2022 ∆ in Rental Rates |
2022 ∆ in Occupancy (% points) |
2022 ∆ in Rental Yield (% points) |
|
|
Kilimani |
172 |
83.6% |
9.0% |
182 |
85.0% |
9.7% |
5.8% |
1.4% |
0.7% |
|
|
Westlands |
209 |
80.4% |
9.7% |
215 |
72.9% |
9.0% |
2.9% |
(7.5%) |
(0.7%) |
|
|
Karen |
214 |
80.8% |
9.4% |
205 |
78.6% |
8.9% |
(4.2%) |
(2.2%) |
(0.5%) |
|
|
Kiambu road |
178 |
70.4% |
7.2% |
187 |
73.3% |
8.1% |
5.1% |
2.9% |
0.9% |
|
|
Ngong Road |
175 |
78.0% |
7.8% |
169 |
78.0% |
7.5% |
(3.3%) |
0.0% |
(0.3%) |
|
|
Mombasa Road |
136 |
70.5% |
6.0% |
150 |
78.5% |
7.3% |
10.3% |
8.0% |
1.3% |
|
|
Thika Road |
158 |
74.2% |
6.7% |
165 |
74.8% |
7.3% |
4.4% |
0.5% |
0.6% |
|
|
Satellite towns |
138 |
72.2% |
6.1% |
138 |
70.7% |
6.0% |
0.0% |
(1.5%) |
(0.1%) |
|
|
Eastlands |
135 |
72.5% |
5.9% |
133 |
74.2% |
5.9% |
(1.9%) |
1.7% |
0.0% |
|
|
Average |
168 |
75.8% |
7.5% |
173 |
75.9% |
7.8% |
2.9% |
0.1% |
0.3% |
|
Source: Cytonn Research 2022
- Performance by Class
To analyze the performance of malls by class we classified them into three bands as below:
- Regional Centers / Destination Malls: These malls are characterized by their higher lettable areas ranging between 400,000 - 800,000 SQFT, and as a result usually have more than one anchor tenants. They include; Sarit Centre, Two Rivers Mall, Garden City Mall, and, Next Gen Mall,
- Community Centers: They are the second largest malls with a lettable area ranging between 125,001 - 400,000 SQFT, and can also host more than one anchor tenants. They include malls such as Thika Road Mall, Valley Arcade, Gateway Mall, and the Village Market, among others, and,
- Neighborhood Centers: These malls are characterized by their lettable areas ranging between 20,000 SQFT hence can only host a single anchor tenant. They include the Well, Ciata City Mall, and Unicity Mall, among others.
The table below shows the summary of performance by class:
(All Values in Kshs unless stated otherwise)
|
Retail Market Performance in Nairobi by Class 2022 |
|||
|
Class |
Average Rent |
Average Occupancy |
Average Rental Yield |
|
Destination |
283 |
82.6% |
10.2% |
|
Community |
174 |
79.3% |
8.1% |
|
Neighborhood |
148 |
69.9% |
6.4% |
|
Grand Total |
173 |
75.9% |
7.8% |
Source: Cytonn research
The key take-outs from the table include;
- Destination malls were the best performing, having recorded an average rental yield of 10.2%, attributable to the premium rents that the quality malls fetch averaging Kshs 283 per SQFT, compared to the market average of Kshs 173 per SQFT. Additionally, the destination class recorded the highest occupancy rate of 82.6% against the NMA average of 75.9% due to their limited supply matched by increased demand,
- Community malls recorded an average rental yield of 8.1%, 0.3% points higher than the market average of 7.8%, with occupancy and rental rates coming in at 79.3% and Kshs 174 per SQFT, respectively against a market average of Kshs 173 per SQFT and 75.9%, respectively as a result of an improved demand, and,
- Neighborhood malls recorded the lowest average rental yield at 6.4% against the market average of 7.8%. This was mainly attributed to the lower rental rates averaging Kshs 148 per SQFT compared to the market average of Kshs 173 per SQFT, coupled with the low average occupancy rate which came in at 69.9% against the market average of 75.9% in 2022.
- Retail Market Performance in Key Urban Cities in Kenya
For all the cities that we conducted our research on, Nairobi was the best performing region with an average rental yield of 7.8% in 2022, 1.0% points higher than the market average of 6.8%, driven by the increased rental and occupancy rates which came in at Kshs 173 per SQFT and 75.9%, respectively in 2022, from Kshs 168 per SQFT and 75.8%, respectively, in 2021. On the other hand, Mount Kenya was the least performing region with the average rental yield having declined by 2.6% points to 5.3% in 2022, from 7.9% in 2021 as a result of the additional Meru Greenwood Mall which hindered the overall occupancy rate and yield. Notably, Nakuru was the most improved region, attributable to the improved economic performance following its elevation into a city in December 2021. This saw an increase in the rental yield by 1.3% points to 7.4%, from 6.1% recorded in 2021. The performance of the key urban centers in Kenya is as summarized below:
|
Summary of Retail Performance in Key Urban Cities in Kenya 2022 |
|||||||||
|
Region |
Rent 2021 |
Occupancy Rate 2021 |
Rental yield 2021 |
Rent 2022 |
Occupancy Rate 2022 |
Rental yield 2022 |
Change in Occupancy Y/Y |
Change in Yield Y/Y |
|
|
Nairobi |
168 |
75.8% |
7.5% |
173 |
75.9% |
7.8% |
0.1% |
0.3% |
|
|
Nakuru |
59 |
80.0% |
6.1% |
73 |
81.3% |
7.4% |
1.3% |
1.3% |
|
|
Mombasa |
119 |
77.6% |
6.8% |
110 |
84.0% |
7.0% |
6.4% |
0.2% |
|
|
Kisumu |
101 |
74.6% |
6.4% |
108 |
79.7% |
7.0% |
5.1% |
0.6% |
|
|
Eldoret |
131 |
80.8% |
6.3% |
132 |
86.1% |
6.6% |
5.3% |
0.3% |
|
|
Mount Kenya |
128 |
81.7% |
7.9% |
138 |
56.7% |
5.3% |
(25.0%) |
(2.6%) |
|
|
Average |
118 |
78.4% |
6.8% |
122 |
77.3% |
6.8% |
(1.1%) |
0.0% |
|
Source: Cytonn Research
Section III: Retail Space Demand Analysis
To identify the retail market gap for investment opportunity, we worked out the retail space demand for various urban regions in Kenya, to shed light on the undersupplied and oversupplied areas. The analysis was based on the retail spaces available as well as the ones in pipeline against the existing demand by the population available per region. By this, we identified the net space uptake per person in SQM, the shopping population, and current retail market occupancy rates. In addition to this, we used the average uptake in Kilimani as a guideline to calculate the net space uptake for the various regions:
- Total Demand/ Gross Uptake - This measures the total retail space required by a population in a particular region and is calculated by multiplying the net space uptake per person by the total shopping population,
- Net Demand/ Uptake - This is a measure of the gross uptake and is calculated by multiplying the gross uptake by respective market occupancy rates. It is exclusive of the occupancy rates of malls in particular regions, and,
- Supply - This is the summation of the existing malls as well as the ones in pipeline. To get the over/undersupply (gap) in the market, the supply is subtracted from the demand/net uptake.
Also, the key assumptions used in the analysis include:
- Number of persons per household was estimated at 3.6 based on the average household size in urban areas as per Kenya Population and Housing Census 2019, and,
- Percentage of shopping population (14 years and above).
(If the figure is positive, then the market has an undersupply i.e, demand is more than supply and if it is a negative figure then the market has an oversupply, i.e. supply is more than demand).
The retail space demand across key regions in Kenya is as shown below;
|
Demand Analysis 2022 |
|||||||||||
|
Region |
2019 |
Urban Population |
Urban population 2019 |
Shopping People |
Net Space Uptake per pax in SQM (Based on Uptake per pax in Kilimani) |
Occupancy (2 year Average) |
Gross Space Uptake per Pax (Required Space Kilimani) |
Net Uptake (Space Required) for each market |
Total supply |
GAP at current market performance |
|
|
Kiambu |
2.1 |
60% |
1.3 |
0.7 |
1.9 |
69.2% |
2.1 |
1.4 |
0.9 |
0.5 |
|
|
Mt Kenya |
2.8 |
38% |
1.1 |
0.6 |
1.5 |
69.2% |
1.7 |
1.2 |
0.6 |
0.5 |
|
|
Mombasa |
1.3 |
100% |
1.3 |
0.8 |
1.9 |
75.8% |
2.1 |
1.7 |
1.6 |
0.2 |
|
|
Kajiado |
1.1 |
41% |
0.5 |
0.3 |
0.7 |
71.4% |
0.7 |
0.5 |
0.4 |
0.1 |
|
|
Machakos |
1.3 |
52% |
0.7 |
0.4 |
1.0 |
75.8% |
1.1 |
0.9 |
0.7 |
0.1 |
|
|
Nakuru |
2.2 |
45% |
1.0 |
0.6 |
1.4 |
80.8% |
1.6 |
1.3 |
1.4 |
(0.1) |
|
|
Uasin Gishu |
1.3 |
44% |
0.6 |
0.3 |
0.8 |
83.5% |
0.9 |
0.8 |
1.0 |
(0.12) |
|
|
Kisumu |
1.2 |
50% |
0.6 |
0.3 |
0.9 |
77.1% |
1.0 |
0.7 |
1.0 |
(0.2) |
|
|
Nairobi |
4.6 |
100% |
4.6 |
2.7 |
6.7 |
75.8% |
7.4 |
5.6 |
8.6 |
(3.0) |
|
|
Total |
18.0 |
|
11.6 |
6.7 |
16.8 |
|
18.6 |
14.1 |
16.1 |
(2.2) |
|
Source: Cytonn Research
Based on our demand analysis, Nairobi, Kisumu, Uasin Gishu and Nakuru are the most oversupplied retail markets by 3.0 mn SQFT, 0.2 mn SQFT, 0.12 mn SQFT, and 0.1 mn SQFT, respectively, with occupancies of 75.8%, 77.1%, 83.5% and 80.8%, respectively.
Section IV: Retail Space Investment Opportunity
We analyzed the various urban regions in Kenya in order to determine the investment opportunity within the Real Estate retail market of the country. This was based on three metrics which include the rental yields, the retail spaces required, and the household purchasing power, with allocations of 30.0%, 30.0% and 40.0% weights, respectively:
- Rental Yield- This is a measure of the value of the profit that an investor generates from an investment as a percentage of its value hence the higher the better. The weighted score for rental yields was 30.0%, and the area with the highest yield was ranked with the highest score of 9 whereas the area with lower yields was given the lowest score of 1,
- Household Expenditure - This measures the consumption expenditure of the target population hence the higher the better as well. The weighted score for this was at 40.0% and the area with the highest expenditure was given the highest score at 9, and the lowest given the lowest score at 1, and,
- Retail Space Demand- This measures the amount of retail space required by a particular region hence the higher the better as it increases occupancy rates of the available developments. 30.0% was the allocated weight for this and the area with the highest demand was given the highest score at 9 as well whilst the area with the lowest demand was allocated the lowest score at 1.
Based on our analysis, Mombasa, Nairobi, Kiambu, Nakuru, Kisumu, and, Mount Kenya, offer the best investment opportunities to retail mall developers having achieved a higher weighted score of 6.8, 6.6, 5.5, 5.2, 5.1, and, 5.0, respectively.
The table below shows the retail space investment opportunity in Kenya:
|
Retail Space Opportunity 2022 |
||||||||||
|
2021 |
2022 |
|||||||||
|
Region/Weight
|
Retail Yield Score |
Retail Space Score |
Household expenditure (per adult) score |
Retail Yield Score |
Retail Space Score |
Household expenditure (per adult) score |
||||
|
30% |
30% |
40% |
Weighted score |
2021 Rank |
30% |
30% |
40% |
Weighted score |
2022 Rank |
|
|
Mombasa |
9 |
5 |
8 |
7.4 |
1 |
5 |
7 |
8 |
6.8 |
1 |
|
Nairobi |
4 |
1 |
9 |
5.1 |
4 |
9 |
1 |
9 |
6.6 |
2 |
|
Kiambu |
7 |
8 |
7 |
7.3 |
2 |
1 |
8 |
7 |
5.5 |
3 |
|
Nakuru |
1 |
3 |
4 |
2.8 |
8 |
8 |
4 |
4 |
5.2 |
4 |
|
Kisumu |
3 |
2 |
6 |
3.9 |
7 |
7 |
2 |
6 |
5.1 |
5 |
|
Mount Kenya |
7 |
9 |
5 |
6.8 |
3 |
1 |
9 |
5 |
5.0 |
6 |
|
Machakos |
4 |
6 |
3 |
4.2 |
5 |
5 |
5 |
3 |
4.2 |
7 |
|
Kajiado |
4 |
7 |
2 |
4.1 |
6 |
3 |
6 |
2 |
3.5 |
8 |
|
Uasin Gishu |
1 |
4 |
1 |
1.9 |
9 |
4 |
3 |
1 |
2.5 |
9 |
Source: Cytonn Research
Section V: Retail Sector Outlook
The table below summarizes metrics that have a possible impact on the retail sector, that is the retail space supply, performance, retail space demand, and concluding with the market opportunity/outlook in the sector;
|
Kenya Retail Sector Outlook 2022 |
||||
|
Sentiment 2021 |
Sentiment 2022 |
2021 Outlook |
2022 Outlook |
|
|
Retail Space Supply |
Nairobi, Kisumu, Uasin Gishu and Nakuru were the most oversupplied areas by 3.0 mn, 0.3 mn, 0.1 mn and 0.1 mn SQFT of space, respectively while areas such as Kiambu and Mt Kenya regions were under supplied by 0.8 mn and 0.7 mn SQFT, respectively |
Nairobi, Kisumu, Uasin Gishu and Nakuru remain the most oversupplied retail markets by 3.0 mn SQFT, 0.2 mn SQFT, 0.12 mn SQFT, and 0.1 mn SQFT, respectively, whereas areas such as Kiambu and Mt Kenya regions are both under supplied by 0.5 mn SQFT. We expect the supply to further increase particularly in Nairobi with the addition of malls such as Ojijo Properties |
Neutral |
Positive |
|
Retail Space Demand |
Performance of cities such as Nairobi, Kisumu, Uasin Gishu and Nakuru continued to be affected by the slow absorption rates of the retail spaces due to the existing demand that doesn’t match the higher supply, which was also expected to increase with the additional spaces such as the Imaara mall along Mombasa road, Britam Mall in Kilimani, and the Beacon Mall in Nairobi CBD |
We expect the aggressive expansion by local and international retailers to cushion the overall demand and uptake for spaces in the sector. However, factors such as e-commerce which is still being adopted by some retailers, is expected to weigh down the optimum uptake of physical retail space in the market |
Neutral |
Neutral |
|
Retail Market Performance |
Kenyan retail sector performance recorded a 0.2% increase in the average rental yield to 6.8% in 2021, from 6.7% in 2020. Average occupancy rates and rental rates also realized an increase of 1.8% points and 2.2% points, respectively, to 78.4% and Kshs 117.8 per SQFT in 2021 Mount Kenya and Nairobi were the best performing regions with the average rental yield coming in at 7.9% and 7.5%, respectively, against the market average of 6.8% We expected to see increased market activity with the expansion efforts by local retailers such as Naivas taking up space left by troubled retailers such as Tuskys |
Kenyan retail sector performance on overall remained stable, with the average rental yield coming in at 6.8% in 2022, unchanged from what was recorded in 2021. However, the average rent per SQFT increased by 3.5% to Kshs 122, whereas the average occupancy rate declined slightly by 1.1% points to 77.3% Nairobi Metropolitan Area was the best performing region with an average rental yield of 7.8% in 2022, driven by the increased rental and occupancy rates which came in at Kshs 173 per SQFT and 75.9%, respectively in 2022 We expect to see improved performance driven by increasing foreign investor confidence in the Kenyan retail market, coupled with the aggressive expansion by local and international retailers such as Naivas, Simbisa Brands, Eat’N’Go, and, QuickMart among many others. However, factors such as online shopping strategy and oversupply of spaces continue to be major challenges hindering the optimum performance of the sector |
Neutral |
Neutral |
|
Our outlook for the Kenya retail market remains NEUTRAL with factors such as the e-commerce strategy and high construction costs expected to impede the optimum performance of the sector. However, the increasing foreign investor confidence in the Kenyan retail market, rapid infrastructure developments, retailers aggressively taking up retail spaces, and, positive demographics are expected to cushion the sector’s performance |
||||
For the full Kenya Retail Report 2022, click here.
Disclaimer: The views expressed in this publication are those of the writers where particulars are not warranted. This publication, which is in compliance with Section 2 of the Capital Markets Authority Act Cap 485A, is meant for general information only and is not a warranty, representation, advice or solicitation of any nature. Readers are advised in all circumstances to seek the advice of a registered investment advisor.

- Talk to us
- Kenya
- P.O Box 20695 - 00200, Nairobi, Kenya
- Cell +254709101200
- Tel +254709101200
- WhatsApp +254741676635
- United States
- +254709101200
- DOWNLOAD OUR APP
-


- Kenya
- 8th Floor, Pinetree Plaza, Kaburu Drive, Ngong Road, Nairobi, Kenya
- USA
- Suite 1150, 1775 Eye Street NW, USA, Washington DC 20006, USA
- Investments
- High Yield
- Private Equity
- Real Estate
- Real Estate
- RiverRun Estates
- Cytonn Towers
- The Ridge
- Taraji Heights
- The Alma