Dec 28, 2025
In 2024, we published the Nairobi Metropolitan Area Serviced Apartments Report 2024, which highlighted that the average rental yield for serviced apartments within the NMA increased by 0.5% points to 7.3% in 2024 from 6.8% in 2023. The improvement in performance was primarily on the back of improved occupancy rates and monthly charges by 5.9% points and 3.6%, to 72.2% and Kshs 3,155 per SQM, respectively, in 2024. This week, we update our report using 2025 market research data and by focusing on;
- Overview of the Kenyan Hospitality Sector,
- Introduction to Serviced Apartments,
- Supply and Distribution of Serviced Apartments within the NMA,
- Performance of Serviced Apartments in the NMA,
- Serviced Apartments Performance by Node
- Comparative Analysis - 2024/2025 Market Performance
- Performance per Typology
- Recommendations and Outlook.
Section I: Overview of the Kenyan Hospitality Sector
In 2025, Kenya's hospitality sector continues to display remarkable resilience in the aftermath of the COVID-19 pandemic. Its performance is largely supported by Nairobi's emergence as a regional business hub, attracting multinational companies to set up offices and hosting major international conferences. Additionally, Kenya’s status as a leading tourist destination has further driven recovery and growth, with increased business travel and tourism playing a significant role in strengthening the sector's contribution to the economy.
In terms of international arrivals, Kenya National Bureau of Statistics’ Leading Economic Indicators – September 2025 report highlighted that the number of arrivals was 745,720 reflecting a 35.1% increase from 552,108 arrivals recorded in Q2’2025. On a year-on-year basis, this represented a 52.2% increase compared to 489,831 arrivals in Q3’2024. The improved performance can be attributed to several factors; i) recovery globally in the tourism industry coupled with a strong marketing campaigns, ii) visa openness following the introduction of the Electronic Tourist Authorization (eTA) at the beginning of the year, iii) improvements in air connectivity through introduction of new routes and more frequencies by major airlines and the introduction of direct flights by three new airlines—IndiGo (Mumbai-Nairobi), Fly Dubai (Dubai-Mombasa), and Airlink (Johannesburg-Nairobi), iv) the creation of specialized tourism offerings such as cruise, adventure, cultural, and sports tourism, and, v) expanded global promotion of Kenya's tourism by the Ministry of Tourism and the Kenya Tourism Board using platforms like Magical Kenya. The chart below shows the number of international arrivals in Kenya between Q1’2023 and Q3’2025;
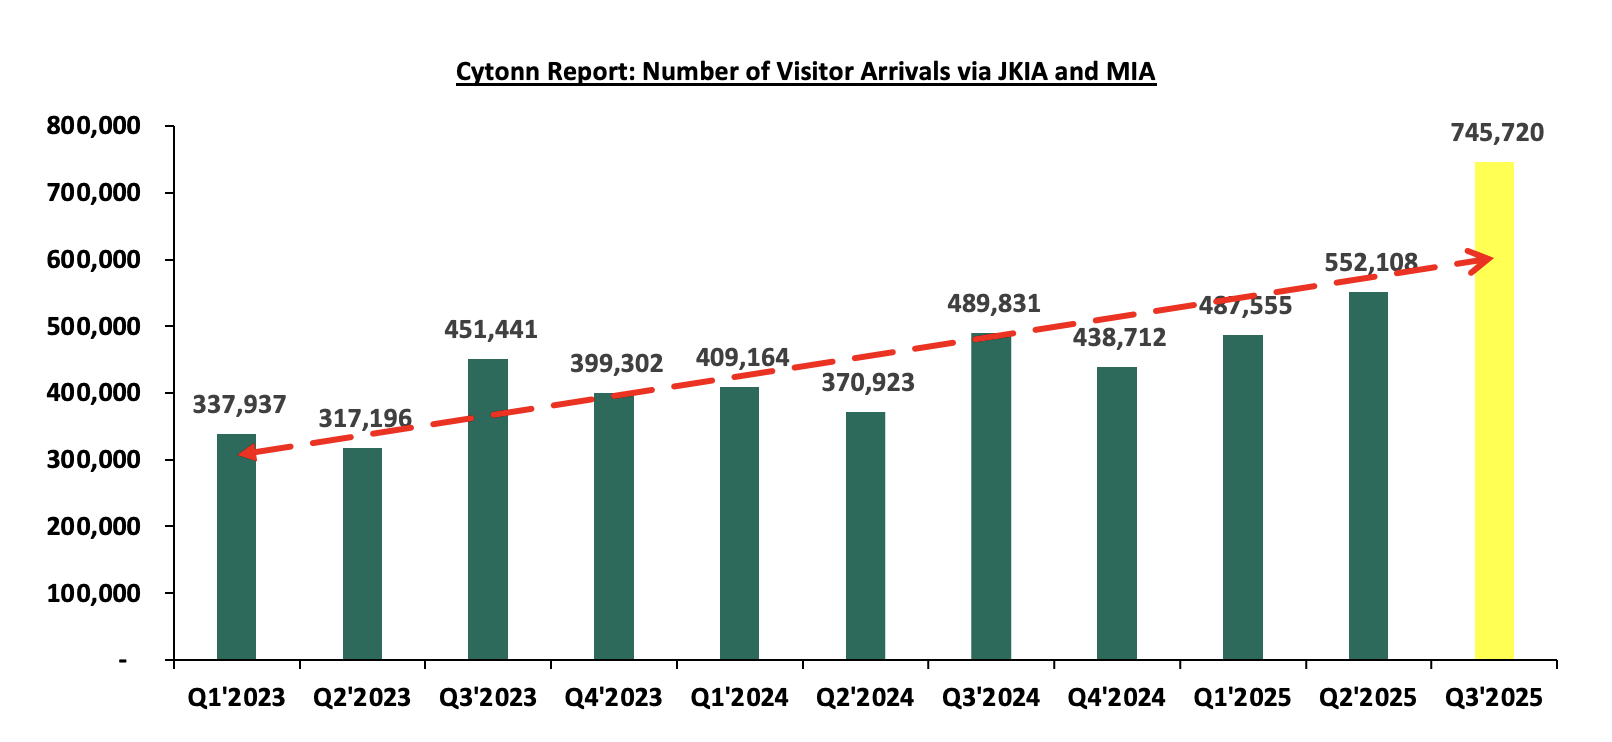
Source: Kenya National Bureau of Statistics
Some of the factors that continue to cushion the hospitality sector include;
- Tourism recovery and growth- International arrivals rebounded strongly post-COVID, driven by renewed long-haul travel, aggressive destination marketing by the Kenya Tourism Board, and the return of conferences, safaris, and beach tourism.
- Active promotion of Kenya as a Tourist Hub: The government continues to market the country as leading tourist destination. Initiatives such as Magical Kenya Travel Expo, Ziara campaign and strategic partnership with airlines have been instrumental in attracting a broad range of visitors strengthening the industry.
- Diverse tourist attractions: The country boasts of rich variety of attractions—including its iconic wildlife reserves, cultural landmarks, and stunning landscapes—continues to draw global attention. Key sites such as the Lake Turkana National Parks, Lake Nakuru National Park, Mount Kenya National Park, Lamu Old Town, and Fort Jesus remain popular due to ongoing conservation efforts and innovative tourism experiences that offer travelers authentic and immersive adventures.
- Expansion of business and diplomatic travel: Nairobi’s role as a regional business, UN, and diplomatic hub continues to drive demand for hotels and serviced apartments, especially from expatriates, consultants, NGOs, and multinational firms.
- Growth of serviced apartments and alternative accommodation: Increased preference for long-stay, flexible, and cost-efficient accommodation has boosted serviced apartments, particularly among corporate travelers and relocating professionals.
- Improved air connectivity and infrastructure: Expansion of direct international flights (e.g. Europe, Middle East, Asia) and upgrades at JKIA and regional airports have improved accessibility and reduced travel friction.
- Rise of domestic and regional tourism: Growth of Kenya’s middle class, regional travel from East and Central Africa, and “staycation” culture has supported occupancy, especially during low international seasons.
- Entry of international hotel brands and professional management: Global brands (Marriott, Accor, Ascott, Radisson, CityBlue) have improved service standards, marketing reach, and investor confidence, lifting overall sector performance.
Nevertheless, the sector continues to face challenges, mainly;
- Escalating Costs of Operation: In 2025, persistently high energy, food, water, and logistics costs have compressed margins, making it difficult for operators to maintain service quality without raising room rates. Increased Non-Performing Loans (NPLs) by 2% in hospitality-related lending reflect liquidity stress, constrained refinancing options, and pressure on cash flows.
- Inadequate Reputational Management: Kenya’s hospitality sector remains vulnerable to the impacts of negative travel advisories issued during times of crisis, resulting in reduced international visitor numbers. Currently, there is no dedicated government strategy to proactively manage or mitigate these reputational risks. Consequently, the industry continues to face setbacks from travel advisories sometimes issued by foreign governments.
Section II: Introduction to Serviced Apartments
Serviced apartments, fully furnished for both short-term and extended stays, have firmly established themselves as a key segment of the hospitality industry within the Nairobi Metropolitan Area (NMA). Combining the comfort of a home with the convenience of hotel services, these residences offer a variety of amenities. They typically include spacious living areas, fully equipped kitchens, separate bedrooms, and en-suite bathrooms, creating a self-contained and adaptable living space for guests. As of 2025, serviced apartments continued to transform the hospitality experience by catering to a wide audience, such as business professionals, families, digital nomads, and vacationers, with customized offerings to meet diverse preferences. Their popularity stems from distinct advantages and features, including:
- Ample Space and Flexibility: Serviced apartments offer significantly more room than standard hotel accommodations, featuring separate areas for living, dining, and sleeping. This spacious setup provides a home-like atmosphere that enhances guest comfort,
- Personalized Services: These apartments deliver a variety of personalized services, such as housekeeping, concierge support, and amenities, ensuring guests’ unique needs and preferences are met.
- Technological Integration: Equipped with cutting-edge technology, including smart home features and intuitive apps, serviced apartments provide guests with greater convenience and control over their experience.
- Integration with Local Communities: Often situated within or near residential neighbourhoods, serviced apartments allow guests to immerse themselves in the local culture, fostering a sense of belonging and community integration, and,
- Long-term Stay Options: With the growing popularity of remote work and long-term travel, serviced apartments cater to guests seeking longer stays, offering dedicated workspaces and amenities designed for extended comfort and productivity.
Section III: Supply and Distribution of Serviced Apartments in the Nairobi Metropolitan Area
The number of serviced apartments within the Nairobi Metropolitan Area (NMA) has increased by a 7-year CAGR of 3.5% to 7,115 apartments in 2025, from 5,593 apartments in 2019 with Divine residences in Riverside adding more than 200 units to the market. The table below shows the growth in supply of serviced apartments in the Nairobi Metropolitan Area over the last seven years;
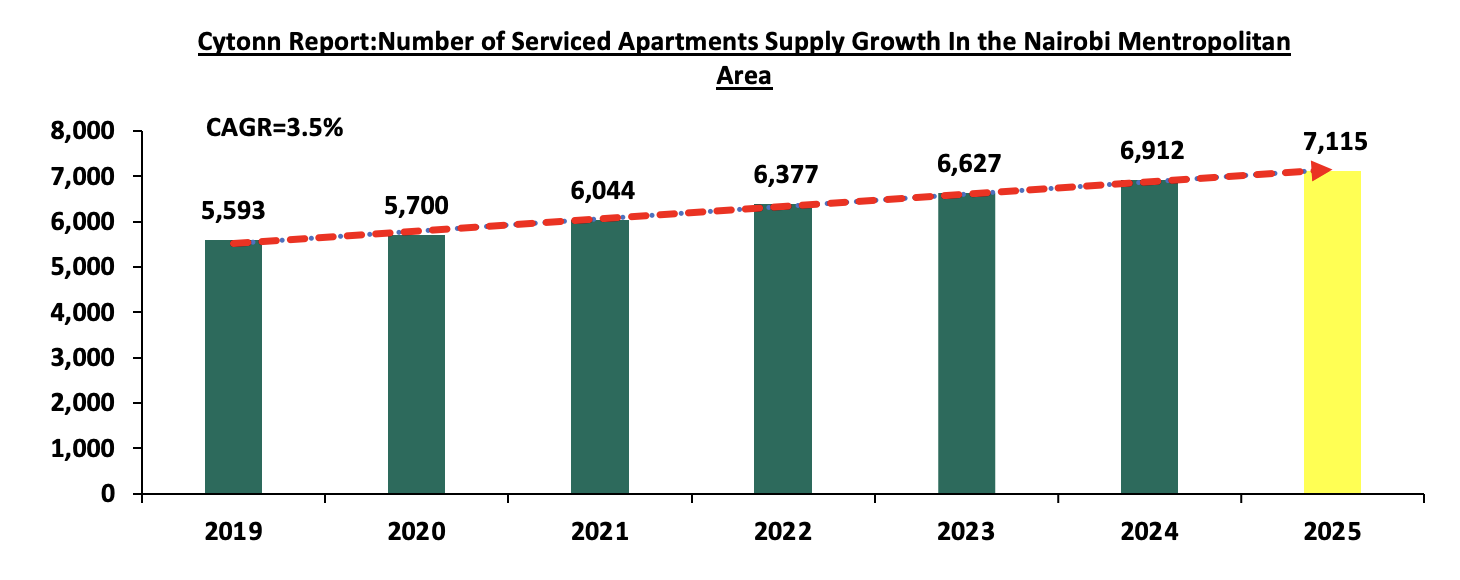
Source: Cytonn Research
In terms of distribution, Westlands and Kilimani have approximately the largest market share of serviced apartments within the Nairobi Metropolitan Area, at 29.4% and 27.6%, respectively attributable to;
- The growing presence of international organizations aiming to strengthen their operations in Africa, such as PricewaterhouseCoopers Kenya Headquarters, United Nations agencies, and various embassies, has resulted in an increasing number of expatriates and a rising demand for serviced apartments. The presence of premium serviced apartments commanding higher rents and rental yields, has instilled confidence among investors in the region,
- Improved infrastructure, including projects like the Nairobi Expressway, enhances connectivity to Jomo Kenyatta International Airport (JKIA) and provides better road networks, making key locations more accessible,
- Premium serviced apartments in the region command higher rents and offer attractive rental yields, fostering greater confidence among investors.
- Vast social amenities, such as shopping centres and well-coordinated delivery service providers, further enhances the convenience and appeal of these areas.
The table provided below illustrates the market share of serviced apartments in the Nairobi Metropolitan Area in 2025;
|
Cytonn Report: Nairobi Metropolitan Area (NMA) Serviced Apartments Market Share 2025 |
|
|
Area |
Percentage Market share |
|
Westlands |
29.4% |
|
Kilimani |
27.6% |
|
Nairobi CBD |
10.4% |
|
Limuru Road |
9.8% |
|
Kileleshwa |
9.8% |
|
Upperhill |
8.0% |
|
Thika road |
4.9% |
|
Total |
100.0% |
Source: Cytonn Research
For the projects in the pipeline, serviced apartments and hotels with serviced apartments’ concepts currently under development in the Nairobi Metropolitan Area currently include;
|
Cytonn Report: NMA Serviced Apartments Projects in the Pipeline 2025 |
|||
|
Name |
Location |
Number of Units |
Estimated Completion Date |
|
DG West Apartments |
Westland’s |
200 |
2026 |
|
Somerset Rosslyn Nairobi |
Runda |
150 |
2026 |
|
Total |
|
350 |
|
Source: Cytonn Research
Section IV: Performance of Serviced Apartments in the Nairobi Metropolitan Area
In the development of the report, the performance of seven nodes within the Nairobi Metropolitan Area was tracked, and compared to the performance in 2024, with emphasis on the following metrics;
- Charged Rates: It is the daily, weekly and monthly rates that are charged to guests for serviced apartments in specific markets. This which form the basis for evaluation of the likely rental income to be received by investors in serviced apartments,
- Occupancy Rates: It measures the number of inhabited apartments as a percentage of the total number of units available. It also guides in determining the expected rental yields for various developments, and,
- Rental Yields: It measures the Real Estate investment return from the annualized collected rental income. It provides investors with an estimate of the returns expected from the property, as well as the time it will take to recover the investment. In the calculation of rental yields, we estimate annual income from monthly revenues and deduct operational costs (assumed as 40.0% of revenues).
In the estimations for the investment value, we have calculated development costs per SQM through factoring in land costs (location-based), costs of construction, equipping costs, professional fees and other costs relating to development. The formula thus used in the calculation rental yields is as follows;
It is important to note that investors will generally incur varying costs depending on the actual land costs incurred, the plot ratios, and the level of finishing and equipping. In analyzing performance, we will start by the node during the year, followed by a comparison with 2024 then the performance by typology will then be covered.
- Serviced Apartments Performance by Node
The average rental yield for serviced apartments within the NMA increased by 0.1% points to 7.4% in 2025 from 7.3% recorded in 2024. Westlands and Limuru Road emerged the best performing nodes, with rental yields of 11.4% and 9.2% respectively, compared to the market average of 7.4%. The performance was attributed to, i) enhanced accessibility through well-developed infrastructure and road networks, making these areas more convenient for residents and visitors, ii) close proximity to Nairobi’s Central Business District (CBD) and other high-end neighborhoods further adds to their appeal and desirability, iii) availability of high-quality serviced apartments in these areas, allowing for premium pricing and attracting high-end clients, iv) proximity to international organizations and embassies, which has significantly boosted demand for serviced apartments due to an influx of expatriates and foreign nationals. On the other hand, Thika Road was the least performing node, with an average yield of 4.5%, 2.9% points lower than the market average of 7.4%. The performance is attributed to, i) low demand for serviced apartments due to their unpopularity, ii) heavy traffic during rush hours due to congestions, which can deter potential tenants who prioritize convenience and ease of movement. The table below highlights the performance of the various nodes within the NMA;
|
NMA Serviced Apartments Performance per Node - 2025 |
|||||||||
|
Node |
Studio |
1 Bed |
2 Bed |
3 bed |
Monthly Charge/ |
Occupancy |
Devt Cost/SQM (Kshs) |
Rental Yield |
|
|
SQM (Kshs) |
|||||||||
|
Westlands |
220,920 |
317,965 |
373,147 |
413,280 |
4,658 |
81.5% |
231,000 |
11.4% |
|
|
Limuru Road |
6,435 |
219,403 |
382,500 |
322,000 |
4,826 |
63.0% |
245,000 |
9.2% |
|
|
Kilimani |
185,531 |
254,945 |
320,378 |
484,784 |
3,410 |
78.2% |
220,000 |
8.6% |
|
|
Kileleshwa & Lavington |
233,800 |
228,667 |
358,851 |
357,000 |
3,304 |
82.7% |
235,000 |
8.3% |
|
|
Nairobi CBD |
195,000 |
187,955 |
265,881 |
567,506 |
3,110 |
66.0% |
250,000 |
4.7% |
|
|
Upperhill |
|
196,370 |
333,071 |
350,000 |
2,342 |
59.5% |
225,500 |
4.6% |
|
|
Thika Road |
|
104,200 |
1,965 |
1,284 |
1,915 |
92.1% |
231,000 |
4.5% |
|
|
Average |
168,337 |
215,643 |
290,828 |
356,551 |
3,366 |
74.7% |
233,929 |
7.4% |
|
Source: Cytonn Research
- Comparative Analysis - 2024/2025 Market Performance
The performance of the serviced apartments improved on y/y, with the occupancy rates coming in at 74.7% in 2025, a 2.5%-points increase from the 72.2% recorded in 2024. The improvement in performance can be attributed to increase in the number of arrivals to 745,720 reflecting a 52.2% increase compared to 489,831 arrivals in Q3’2024 boosting the occupancy in the serviced apartments. The average monthly charges for 2025 increased by 6.7% to Kshs 3,366 per SQM from 3,155 recorded in 2024. This was attributed to increased demand for serviced apartments in Westlands and Limuru nodes. Consequently, the average rental yield increased to 7.4% in 2025, 0.1% points increase from the 7.3% recorded in 2024. The improvement in performance was primarily on the back of; i) Increase in the number of visitors arriving in the country compared to a similar period in 2024, ii) The country effecting a Visa free policy at the start of the year for all visitors in a bid to boost number of arrivals in the country, iii) continued recovery of the Kenyan hospitality sector, iv) the intensive marketing of Kenya’s tourism market through platforms such as the Magical Kenya platform and various, v) Guests preference to stay within the city for extended periods. The table below shows the comparative analysis between 2024 and 2025;
|
All values in Kshs unless stated otherwise |
|||||||||
|
Comparative Analysis-2024/2025 Market Performance |
|||||||||
|
Node |
Monthly Charge/SQM 2024 |
Occupancy 2024 |
Rental Yield 2024 |
Monthly Charge/SQM 2025 |
Occupancy 2025 |
Rental Yield 2025 |
Change in Monthly Charges/SQM |
Change in Occupancy |
Change in Rental Yield |
|
Westlands |
4,148 |
77.1% |
11.0% |
4,658 |
81.5% |
11.4% |
12.3% |
4.4% |
0.4% |
|
Limuru Road |
4,768 |
62.6% |
9.1% |
4,826 |
63.0% |
9.2% |
1.2% |
0.4% |
0.1% |
|
Kilimani |
3,269 |
70.2% |
8.8% |
3,410 |
78.2% |
8.6% |
4.3% |
8.0% |
(0.2%) |
|
Kileleshwa & Lavington |
3,109 |
75.8% |
7.6% |
3,304 |
82.7% |
8.3% |
6.3% |
6.9% |
0.7% |
|
Nairobi CBD |
2,753 |
64.1% |
3.9% |
3,110 |
66.0% |
4.7% |
13.0% |
1.9% |
0.8% |
|
Upperhill |
2,339 |
66.7% |
5.4% |
2,342 |
59.5% |
4.6% |
0.1% |
(7.2%) |
(0.8%) |
|
Thika Road |
1,698 |
89.1% |
5.3% |
1,915 |
92.1% |
4.5% |
12.8% |
3.0% |
(0.8%) |
|
Average |
3,155 |
72.2% |
7.3% |
3,366 |
74.7% |
7.4% |
7.1% |
2.5% |
0.1% |
Source:Cytonn Research
Section V: Recommendations and Outlook
Having looked at the various factors driving the hospitality industry and with a particular focus on the serviced apartments sector, including challenges and current performance, we conclude with a recommendation of existing investment opportunities in the sector, and outlook as depicted below;
|
|
Cytonn Report: Serviced Apartments Sector Outlook 2026 |
|
|
Measure |
Sentiment |
Outlook |
|
Serviced Apartments Performance |
· The average rental yield for serviced apartments within the NMA increased by 0.1% points to 7.4% in 2025 from 7.3% recorded in 2024. The occupancy rates came in at 74.7% in 2025, a 2.5%-points increase from the 72.2% recorded in 2024. The average monthly charges for 2025 increased by 6.7% to Kshs 3,366 per SQM from 3,155 recorded in 2024 · Our outlook for the sector is positive, as we expect that performance will be supported by increased tourist arrivals into the country and the continued positive performance of the overall Kenyan hospitality industry. Additionally, Nairobi’s growing popularity as a leading business travel destination, alongside the above factors will propel the sector’s performance on an upward trajectory · However, we anticipate that the current increasing operational costs will weigh down optimum performance of the sector. |
Neutral |
|
International Tourism |
· In terms of international arrivals, Kenya National Bureau of Statistics’ Leading Economic Indicators – September 2025 report highlighted that the number of arrivals was 745,720 reflecting a 35.1% increase from 552,108 arrivals recorded in Q2’2025. On a year-on-year basis, this represented a 52.2% increase compared to 489,831 arrivals in Q3’2024. The improved performance can be attributed to several factors; i) recovery globally in the tourism industry coupled with a strong marketing campaign, ii) visa openness following the introduction of the Electronic Tourist Authorization (eTA) at the beginning of the year, iii) improvements in air connectivity through introduction of new routes and more frequencies by major airlines and the introduction of direct flights by three new airlines—IndiGo (Mumbai-Nairobi), Fly Dubai (Dubai-Mombasa), and Airlink (Johannesburg-Nairobi), iv) the creation of specialized tourism offerings such as cruise, adventure, cultural, and sports tourism, and, v) expanded global promotion of Kenya's tourism by the Ministry of Tourism and the Kenya Tourism Board using platforms like Magical Kenya. The chart below shows the number of international arrivals in Kenya between Q1’2023 and Q3’2025; · While the sector demonstrated resilience in its overall performance in 2025, the outlook remains cautiously optimistic. Kenya continues to face significant competition from neighboring markets, such as Rwanda, which employs aggressive promotional strategies, alongside Zanzibar, Tanzania, and South Africa. These regions actively position themselves as attractive alternatives, challenging Kenya's market share in the region. |
Neutral |
|
Supply |
· The number of serviced apartments within the Nairobi Metropolitan Area (NMA) has increased by a 7-year CAGR of 3.5% to 7,115 apartments in 2025, from 5,593 apartments in 2019 with Divine residences in Riverside adding more than 200 units to the market · In addition, the Nairobi Metropolitan Area has several developments in the pipeline. The upcoming developments are positioned to boost the existing supply. · Furthermore, the year-on-year (y/y) gross loans advanced to the Real Estate sector increased by 1.0% to Kshs 507.0 bn, from Kshs 502.0 bn in Q2’2024. |
Positive |
Given that majority of our key metrics are neutral, we have a NEUTRAL overall outlook for the serviced apartments sector. The Investment opportunity lies in Westlands, Limuru Road, Kilimani, and Kileleshwa-Lavington which performed the best among all the nodes, with rental yields of 11.1%, 9.2%, 8.6% and 8.3% respectively, compared to the market average of 7.4%.
Disclaimer: The views expressed in this publication are those of the writers where particulars are not warranted. This publication, which is in compliance with Section 2 of the Capital Markets Authority Act Cap 485A, is meant for general information only and is not a warranty, representation, advice or solicitation of any nature. Readers are advised in all circumstances to seek the advice of a registered investment advisor.

- Talk to us
- Kenya
- P.O Box 20695 - 00200, Nairobi, Kenya
- Cell +254709101200
- Tel +254709101200
- WhatsApp +254741676635
- United States
- +254709101200
- DOWNLOAD OUR APP
-


- Kenya
- 8th Floor, Pinetree Plaza, Kaburu Drive, Ngong Road, Nairobi, Kenya
- USA
- Suite 1150, 1775 Eye Street NW, USA, Washington DC 20006, USA
- Investments
- High Yield
- Private Equity
- Real Estate
- Real Estate
- RiverRun Estates
- Cytonn Towers
- The Ridge
- Taraji Heights
- The Alma