Jul 12, 2020
In June 2019, we published the Cytonn H1’2019 Market Review which highlighted the land sector’s performance in the Nairobi Metropolitan Area. According to the report, the land sector recorded a 0.5% y/y decline in asking prices, 4.3% points lower than the 3.8% growth rate in 2017/18, attributed to an overall slowdown in real estate investment during the year. Despite the rest of the zones recording a decline in asking prices, unserviced land in satellite towns such as Ruiru and Limuru registered a 3.9% annual capital appreciation on average during the year, attributed to the relatively high demand for land in these areas fueled by the affordable housing initiative which has been a key focus sector by both the government and private sector players.
This week, we update that report with 2019/2020 research data, highlighting the land sector’s performance in the Nairobi Metropolitan Area based on annual capital appreciation, identify market trends and the investment opportunity. In this topical, we shall cover:
- Introduction to the land sector in the Nairobi Metropolitan Area,
- Performance summary in 2020 based on zones and locations,
- Summary and the investment opportunity in the sector, and
- Conclusion and outlook for the sector.
- Introduction to the land Sector in the Nairobi Metropolitan Area
The land sector within the Nairobi Metropolitan Area recorded several activities in 2019/2020 despite an overall slowdown in real estate development activities, attributed to a tough economic environment, and an existing oversupply of space within the commercial sector and the high end residential market. During the period under review, transactions in the land sector were driven by;
- Increased focus on the affordable housing initiative by both the government and private sector developers. This has generated increased real estate activities especially in satellite towns where land is available in bulk and at affordable prices thus increasing demand for development class real estate,
- Development of infrastructure which has opened up new areas for development leading to increased demand for development land,
- Positive demographics with a relatively high population growth rate and urbanization rate of 2.5% and 4.3% respectively, against a global average of 1.2% and 2.0%, and a rising middle class with increasing purchasing power creating sustained demand for development land, and,
- Reduced supply of development land at affordable prices in areas close to the Nairobi CBD resulting in demand for the same in satellite towns.
Despite the above drivers, the sector was constrained by;
- Inadequate infrastructure leading to the growth of informal settlements such as slums, making land less preferred by investors especially in the urban areas in the wake of high urbanisation,
- Inaccessibility to loans mainly due to low-income levels that cannot service the loans, the high interest rates and deposit requirements which lock out many borrowers. This has continued to cripple real estate development as it has resulted in low demand for property including land, and,
- Reduced real estate development activities in the wake of the COVID-19 pandemic which has resulted in the disruption of construction materials supply chains and constrained development funding as investors adopt a wait and see attitude given the uncertainties in the market.
Some of the factors likely to shape the sector include;
- Digitization of the Lands Ministry- In May 2020, the Ministry Of Lands and Physical Planning issued a notice to the public inviting them for public participation on the regulatory impact statement for the proposed Land Transactions (Electronic) Regulations 2020. If approved, the regulations will guide land processes in the country. We expect this to boost the real estate sector through faster land transactions thus reducing delays experienced by developers during the pre-construction period,
- Government Land Repossession- In a bid to streamline the land sector in Kenya, the government is in the process of reclaiming all unclaimed and grabbed land in areas such as Kariobangi and Ngong , which is set to increase security in the fraud-ridden sector, and
- Implementation of Land Management Reforms- Earlier this year, The National Land Commission (NLC) and the Institution of Surveyors of Kenya (ISK) agreed to form a joint team that will spearhead land reforms especially in the areas of research, land management, women land rights, compulsory land acquisition and compensation among others.
- Performance Summary in 2019/20 Based on Zones and Locations
For our analysis, we classified the various nodes based on the zoning regulations and locations as below;
- High Rise Residential Areas: These are areas characterized by high rise residential developments mainly apartments and include: Kileleshwa, Dagoretti, Githurai, Embakasi, and Kasarani,
- Low Rise Residential Areas: These are areas zoned for low rise residential developments, mainly villas, townhouses and maisonettes and include; Kitisuru, Runda, Ridgeways, Karen and Spring Valley,
- Commercial Zones: These are areas characterized by commercial office buildings in Kilimani, Westlands, Riverside and Upperhill,
- Satellite Towns: Land in the area was categorized into serviced (site and service schemes) and unserviced land.
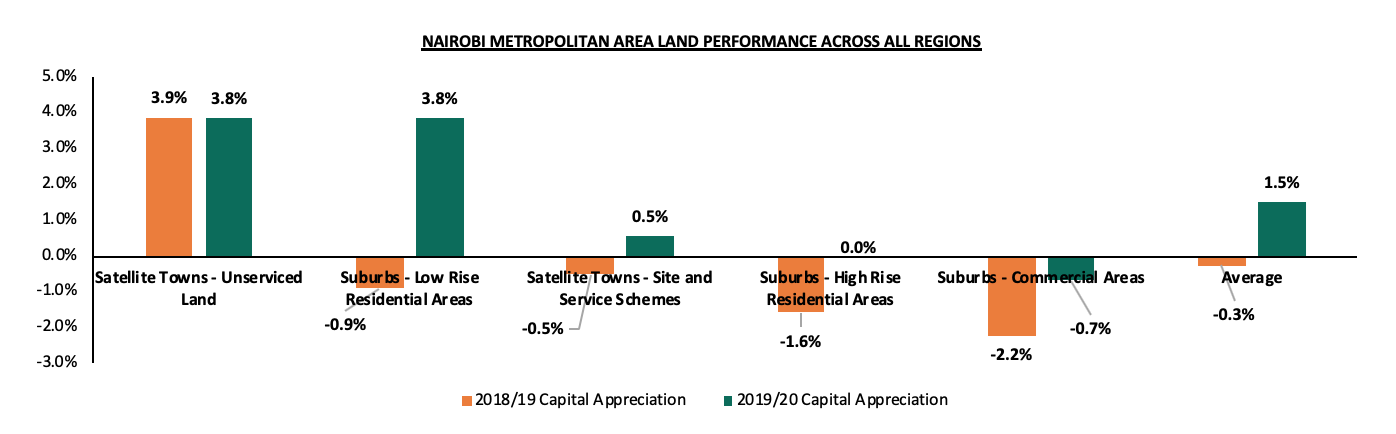
In 2019/2020, the land sector recorded an 8-year CAGR of 13.5% and an annual capital appreciation of 1.5%, compared to the (0.3%) recorded in 2018/2019, attributed to increased demand for land mainly in the low rise residential areas and satellite towns. Asking land prices in low rise residential areas recorded a 3.8% capital appreciation y/y, attributed to the availability of development land in these areas. Additionally, people are attracted to these areas as they are sparsely populated, thus offering exclusivity and privacy. Unserviced land in satellite towns such as Ruaka also recorded a capital appreciation of 3.8% y/y, attributable to the growing demand for land in these areas fueled by the demand for housing by the growing working population as the areas act as Nairobi’s dormitory, coupled by the improving infrastructure.
The summary of the performance is as shown below;
Source: Cytonn Research
All values in Kshs unless stated otherwise
|
SUMMARY OF THE LAND PERFORMANCE ACROSS ALL REGIONS |
||||||||||
|
Location |
*Price in 2011 |
*Price in 2015 |
*Price in 2016 |
*Price in 2017 |
*Price 2018/19 |
*Price 2019/20 |
8- Year CAGR |
2018/19 Capital Appreciation |
2019/20 Capital Appreciation |
∆ in capital appreciation |
|
Satellite Towns - Unserviced Land |
9m |
17m |
22m |
23m |
24m |
25m |
15.8% |
3.9% |
3.8% |
(0.1%) |
|
Nairobi Suburbs - Low Rise Residential Areas |
36m |
68m |
79m |
82m |
81m |
84m |
11.3% |
(0.9%) |
3.8% |
4.8% |
|
Satellite Towns - Site and Service Schemes |
8m |
15m |
18m |
15m |
15m |
15m |
15.1% |
(0.5%) |
0.5% |
1.0% |
|
Nairobi Suburbs - High rise Residential Areas |
52m |
92m |
111m |
117m |
117m |
116m |
11.0% |
(1.6%) |
0.0% |
1.5% |
|
Nairobi Suburbs - Commercial Areas |
145m |
359m |
422m |
433m |
421m |
419m |
14.5% |
(2.2%) |
(0.7%) |
1.5% |
|
Average |
13.5% |
(0.3%) |
1.5% |
1.8% |
||||||
|
*Asking land prices
|
||||||||||
Source: Cytonn Research
- Satellite Towns-Unserviced Land
Asking land prices for unserviced land in satellite towns such as Ruiru, Limuru and Utawala, recorded a capital appreciation of 3.8% y/y, a marginal decline of 0.1% points from the 3.9% recorded in 2018/19. The relatively high capital appreciation is supported by the high demand for development land fuelled by; i) affordability in comparison to Nairobi’s suburbs, and ii) improving infrastructures such as sewerage systems and roads in areas such as Ruaka and Ruiru.
All values in Kshs unless stated otherwise
|
Land Price Performance- Unserviced Land in Satellite Towns in Nairobi Metropolitan Area 2019/20 |
||||||||||
|
Location |
*Price in 2011 |
*Price in 2015 |
*Price in 2016 |
*Price in 2017 |
Price 2018/19* |
*Price 2019/20 |
8- year CAGR |
2018/19 Capital Appreciation |
2019/20 Capital Appreciation |
∆ in capital appreciation |
|
Satellite Towns - Unserviced Land |
||||||||||
|
Ruiru |
7m |
15m |
19m |
20m |
21m |
22m |
16.5% |
6.5% |
6.2% |
(0.3%) |
|
Ruaka |
40m |
58m |
74m |
77m |
80m |
84m |
9.8% |
4.0% |
5.2% |
1.2% |
|
Utawala |
6m |
9m |
10m |
11m |
12m |
12m |
9.7% |
5.6% |
4.1% |
(1.4%) |
|
Athi River |
2m |
3m |
4m |
4m |
4m |
4m |
10.1% |
3.1% |
3.4% |
0.3% |
|
Juja |
3m |
7m |
9m |
10m |
10m |
10m |
15.3% |
1.0% |
3.4% |
2.4% |
|
Limuru |
5m |
13m |
17m |
20m |
20m |
21m |
18.4% |
4.5% |
2.9% |
(1.7%) |
|
Ongata Rongai |
2m |
10m |
18m |
18m |
18m |
19m |
31.2% |
2.2% |
1.6% |
(0.7%) |
|
Average |
9m |
17m |
22m |
23m |
24m |
25m |
15.8% |
3.9% |
3.8% |
(0.1%) |
|
*Asking land prices
|
||||||||||
Source: Cytonn Research
- Nairobi Suburbs- Low Rise Residential Areas
Low-rise residential areas such as Karen and Runda recorded an average capital appreciation of 3.8% y/y, compared to the 0.9% y/y price correction recorded in 2018/19. The improved performance is attributed to a growing demand for development land supported by the resilience of the detached units residential market within the nodes evidenced by the 0.3% annual price appreciation in H1’2020, in addition to the relative affordability of land at approximately Kshs 84.2mn per acre as compared to the high-rise nodes, selling at Kshs 115.6 mn per acre on average. Additionally, family units are attracted to these areas as they are sparsely populated, thus offering exclusivity and privacy.
All values in Kshs unless stated otherwise
|
Land Price Performance- Low Rise Residential Areas in Nairobi Metropolitan Area 2019/20 |
||||||||||||
|
Location |
*Price in 2011 |
*Price in 2015 |
*Price in 2016 |
*Price in 2017 |
*Price 2018/19 |
*Price 2019/20 |
8- Year CAGR |
2018/*19 Capital Appreciation |
2019/20 Capital Appreciation |
∆ in capital appreciation |
||
|
Low Rise Residential Areas |
||||||||||||
|
Karen |
25m |
40m |
46m |
52m |
53m |
56m |
10.7% |
3.4% |
5.6% |
2.2% |
||
|
Spring Valley |
64m |
131m |
147m |
154m |
148m |
156m |
11.7% |
(4.1%) |
5.4% |
9.5% |
||
|
Runda |
33m |
58m |
67m |
68m |
68m |
70m |
9.8% |
0.2% |
3.3% |
3.1% |
||
|
Kitisuru |
32m |
59m |
70m |
70m |
71m |
73m |
10.8% |
0.8% |
3.0% |
2.2% |
||
|
Ridgeways |
24m |
51m |
62m |
68m |
65m |
66m |
13.5% |
(4.9%) |
1.8% |
6.7% |
||
|
Average |
36m |
68m |
79m |
82m |
81m |
84m |
11.3% |
(0.9%) |
3.8% |
4.8% |
||
|
*Asking land prices
|
||||||||||||
Source: Cytonn Research
- Satellite Towns- Site and Service Schemes
Site and service schemes recorded a 0.5% annualized capital appreciation, compared to the 0.5% y/y price correction in 2018/19. The capital appreciation is attributed to increased demand driven by the relatively affordable land at approximately Kshs 15 mn asking land price per acre and provision of infrastructure by the developers. Compared to unserviced land in the same areas, the asking price of serviced land recorded a slower appreciation due to decreased demand as buyers are not willing to pay a premium for the services provided, thus opt for unserviced land.
All values in Kshs unless stated otherwise
|
Land Price Performance- Serviced Land -Satellite Towns in Nairobi Metropolitan Area 2019/20 |
||||||||||
|
Location |
*Price in 2011 |
*Price in 2015 |
*Price in 2016 |
*Price in 2017 |
*Price 2018/19 |
*Price 2019/20 |
8- Year CAGR |
2018/19 Capital Appreciation |
2019/20 Capital Appreciation |
∆ in capital appreciation |
|
Site and service schemes |
||||||||||
|
Ruiru |
8m |
18m |
19m |
21m |
23m |
24m |
17.5% |
8.1% |
5.8% |
(2.2%) |
|
Athi River |
2m |
11m |
13m |
13m |
12m |
12m |
25.6% |
(7.3%) |
3.5% |
10.8% |
|
Ruai |
8m |
12m |
13m |
15m |
14m |
14m |
7.4% |
(9.4%) |
1.0% |
10.4% |
|
Thika |
5m |
7m |
8m |
10m |
10m |
10m |
9.0% |
1.7% |
0.5% |
(1.2%) |
|
Syokimau-Mlolongo |
3m |
12m |
12m |
12m |
12m |
12m |
18.0% |
3.5% |
(3.8%) |
(7.3%) |
|
Ongata Rongai |
7m |
16m |
19m |
19m |
19m |
18m |
12.9% |
0.4% |
(3.8%) |
(4.3%) |
|
Average |
8m |
15m |
18m |
15m |
15m |
15m |
15.1% |
(0.5%) |
0.5% |
(2.2%) |
|
*Asking land prices
|
||||||||||
- Nairobi Suburbs- High Rise Residential Areas
Asking land prices in high-rise residential areas stagnated, compared to a 1.6% price correction in 2018/19. The stagnation in asking land prices is attributed to reduced demand for development land given the reduced development activities due to the relatively high land prices averaging at approximately Kshs 116 mn per acre, compared to low rise residential areas and unserviced land in satellite towns averaging at Kshs 84 mn and Kshs 25 mn, respectively, in the wake of an economic slowdown in addition to the existing oversupply of residential units in the high-end market segment.
All values in Kshs unless stated otherwise
|
Land Price Performance- High Rise Residential Areas in Nairobi Metropolitan Area 2019/20 |
||||||||||
|
Location |
*Price in 2011 |
*Price in 2015 |
*Price in 2016 |
*Price in 2017 |
*Price 2018/19 |
*Price 2019/20 |
8- Year CAGR |
2018/19 Capital Appreciation |
2019/20 Capital Appreciation |
∆ in capital appreciation |
|
High Rise Residential Areas |
||||||||||
|
Kasarani |
32m |
51m |
60m |
64m |
61m |
65m |
9.2% |
(3.6%) |
5.7% |
9.3% |
|
Dagoretti |
28m |
81m |
95m |
99m |
100m |
103m |
17.8% |
1.5% |
2.5% |
1.0% |
|
Githurai |
21m |
37m |
45m |
46m |
45m |
44m |
10.2% |
(0.9%) |
(1.4%) |
(0.5%) |
|
Kileleshwa |
149m |
227m |
286m |
306m |
311m |
303m |
9.3% |
1.8% |
(2.6%) |
(4.4%) |
|
Embakasi |
33m |
61m |
69m |
70m |
66m |
63m |
8.5% |
(6.7%) |
(4.4%) |
2.3% |
|
Average |
52m |
92m |
111m |
117m |
117m |
116m |
11.0% |
(1.6%) |
0.0% |
1.6% |
|
*Asking land prices
|
||||||||||
Source: Cytonn Research
- Nairobi Suburbs- Commercial Zones
Commercial zones recorded a 0.7% y/y correction in asking land prices, 1.5% points lower than the 2.2% correction recorded in 2018/19. We attribute this to the decreased demand for development land in the sub-markets given the relatively high asking land prices of Kshs 419 mn per acre on average thus developers are not able to achieve favorable returns from the investments, in addition to the existing oversupply of commercial office and retail spaces which stand at 5.2 mn SQFT and 2.8 mn SQFT, respectively, as at 2019.
All values in Kshs unless stated otherwise
|
Land Price Performance- Commercial Zones in Nairobi Metropolitan Area 2019/20 |
||||||||||
|
Location |
*Price in 2011 |
*Price in 2015 |
*Price in 2016 |
*Price in 2017 |
*Price 2018/19 |
*Price 2019/20 |
8- Year CAGR |
2018/*19 Capital Appreciation |
2019/20 Capital Appreciation |
∆ in capital appreciation |
|
Commercial Zones |
||||||||||
|
Upper Hill |
200m |
450m |
512m |
510m |
488m |
506m |
12.3% |
(4.4%) |
3.8% |
8.1% |
|
Kilimani |
114m |
294m |
360m |
387m |
403m |
398m |
16.9% |
4.1% |
(1.2%) |
(5.3%) |
|
Westlands |
150m |
350m |
453m |
474m |
430m |
421m |
13.8% |
(9.3%) |
(1.9%) |
7.4% |
|
Riverside |
116m |
343m |
362m |
361m |
363m |
351m |
14.8% |
0.7% |
(3.3%) |
(4.0%) |
|
Average |
145m |
359m |
422m |
433m |
421m |
419m |
14.5% |
(2.2%) |
(0.7%) |
1.5% |
|
*Asking land price *Key to note the Nairobi CBD was exempted from the list of submarkets within the commercial zones, due to unavailability of undeveloped land for sale
|
||||||||||
Source: Cytonn Research
- Summary and Investment Opportunity in the Sector
Ruiru, Kasarani, Karen, Spring Valley and Ruaka are among the best performing submarkets in terms of capital appreciation, recording annual rates of more than 5.0% in 2019/20, while Ruiru offers site and service investors the highest expected returns averaging 5.8%.
The table below summarizes the performance of the various areas:
|
Summary and Conclusions- y/y Capital Appreciation Nairobi Metropolitan Area |
|
|
Land Appreciation |
|
|
2019-2020 |
Areas |
|
>5.0% |
Ruiru, Kasarani, Karen, Spring Valley, Ruaka |
|
1.0%- 4.9% |
Dagoretti, Runda, Kitisuru, Ridgeways, Utawala, Athi River, Juja, Limuru, Ongata Rongai, Upper Hill |
|
<1.0% |
Githurai, Embakasi, Kileleshwa, Kilimani, Westlands, Riverside |
|
Site and Service Capital Appreciation |
|
|
2019-2020 |
Areas |
|
>5.0% |
Ruiru |
|
1.0%- 4.9% |
Athi River, Ruai |
|
<1.0% |
Thika, Syokimau- Mlolongo, Ongata Rongai |
Source: Cytonn Research
Investment Opportunity
Given the above performance of the various areas, the investment opportunity in the land sector lies in sub-markets such as Karen, Spring Valley and Kasarani which recorded relatively high annualized capital appreciation of 5.6%, 5.4% and 5.7%, respectively, and satellite towns such as Ruiru and Ruaka for unserviced land, and Ruiru for site and service schemes which were the best performing sub-markets with average annualized capital appreciation of 6.2%, 5.2%, and 5.8%, respectively, supported by a growing demand for development land by the growing middle class and improving infrastructure.
- Conclusion and Outlook for the Sector
|
Indicator |
2019 Projections |
2020 Projections |
2019 Outlook |
2020 Outlook |
|
Infrastructure Development |
It was expected that the continued infrastructural development supported by the 2018/2019 national budget allocation of Kshs 418.8 bn, would open up areas for development and translate to an increase in land value. |
Despite the reduced allocation on development expenditure, we expect continued commitment by the government to its infrastructure developmental agenda, thus opening up areas for development thus boosting land value. For the 2020/2021 budget, the infrastructure sector budget allocation stands at Kshs 172.4 bn 58.8% lower than the previous allocation and we expect this to slowdown infrastructural development works. |
Positive |
Neutral |
|
Legal Reforms |
The digitization of the land ministry was expected to enhance transparency and efficiency of land transactions hence reduced transaction cost |
We expect reforms such as the recent amendment of the Business Laws Act to allow for online assessment, payment, and franking of stamp duty; allowance for the use of electronic signatures in the execution of land documents such as title deeds, lease agreements, land rates clearance and transfer, and the general digitalization of the lands ministry will enhance the ease of doing business within the land sector |
Positive |
Positive |
|
Credit Supply |
It was expected that the low credit supply given the interest rate cap would continue hindering access to funds reducing both development and off take of real estate. |
We expect constrained credit supply to cripple real estate development activities, as financiers such as banks aim to limit exposure amidst increasing loan deferrals and defaults, in the wake of an economic slowdown attributed to the ongoing COVID-19 pandemic. |
Negative |
Negative |
|
Real Estate Activities |
We expected decreased real estate development activities attributed to the existing space supply in the commercial office and retail sectors and the unmatched demand and supply in the residential sector. However, we expected continued focus on the affordable housing initiative by both the government and private developers. |
We expect the real estate sector to record a slowdown in development activities attributed to the current global and local economy slowdown and the existing oversupply of space in select sectors namely commercial office, retail and high-end residential markets. However, we expect the sector to improve significantly towards the end of 2020 once economic activity regains momentum. |
Neutral |
Neutral |
|
Performance |
We expected the growth of asking land prices to be fuelled by the demand for development land, improving infrastructure and demographics despite the reduced real estate activities in the NMA |
Despite the current slowdown in real estate development activities, we expect the performance of the land sector to be cushioned by; (i) the growing demand for development land, especially in the satellite towns as developers, strive to drive the government’s Big Four government agenda on the provision of affordable housing, (ii) improving infrastructure such as the ongoing construction of the Western bypass, and (iii) increased demand for development land by the growing middle income population. |
Neutral |
Neutral |
With 1 positive, 1 negative, and 3 neutral factors from our analysis, we have a neutral outlook for the land sector, with a bias to positive supported by the high demand for development land boosted by affordability in satellite towns, availability of development land and the improving infrastructure. However, we expect the COVID-19 pandemic to continue impacting on real estate development activities thus a resultant sluggish growth in land value going forward.
Disclaimer: The views expressed in this publication are those of the writers where particulars are not warranted. This publication is meant for general information only and is not a warranty, representation, advice, or solicitation of any nature. Readers are advised in all circumstances to seek the advice of a registered investment advisor.

- Talk to us
- Kenya
- P.O Box 20695 - 00200, Nairobi, Kenya
- Cell +254709101200
- Tel +254709101200
- WhatsApp +254741676635
- United States
- +254709101200
- DOWNLOAD OUR APP
-


- Kenya
- 8th Floor, Pinetree Plaza, Kaburu Drive, Ngong Road, Nairobi, Kenya
- USA
- Suite 1150, 1775 Eye Street NW, USA, Washington DC 20006, USA
- Investments
- High Yield
- Private Equity
- Real Estate
- Real Estate
- RiverRun Estates
- Cytonn Towers
- The Ridge
- Taraji Heights
- The Alma