Jan 21, 2018
Over the last few years, we have been investing in the Nairobi metropolitan area. We however continuously do research in the other regions to see in what places we can undertake investments and developments on behalf of our investors. Our Real Estate Research & Deal Origination (RDO) team spends time in the target market, collecting and analyzing data to make the best investment recommendation both for our own proprietary use and to inform the investors of the trends in the markets. As such, and in line with our regional expansion strategy, we have been carrying out research on various markets across the Kenyan Counties. Currently we have covered 13 Counties, among them being Laikipia, Meru, Mombasa, Kisumu and Uasin Gishu. We have chosen Nyeri County to serve as the Mt. Kenya Regional Office due to its centrality in the region. We also target to open offices in other Counties such as Kisumu, Mombasa, Nakuru and Uasin Gishu as they remain attractive from a macroeconomic perspective, are in need of modern real estate developments, and can support good returns for investors.
This week we look at our real estate findings in the commercial, residential, holiday homes, and site and service schemes markets in Nyeri Town. We start by a general overview of the area, and then cover the key drivers and challenges for the real estate market in Nyeri, followed by an analysis of the performance of the various themes, before finally concluding with our outlook on the market.
Overview
Nyeri Town is situated in the Central Highlands of Kenya, about 150 km north of Kenya's capital city Nairobi, lying between the eastern base of the Aberdare (Nyandarua) Range, which forms part of the eastern end of the Great Rift Valley, and the western slopes of Mount Kenya. It is the largest town in Nyeri County and the headquarter of Nyeri County, and former central administrative headquarters of Central Province. This therefore makes the area a strategic location to serve all the counties located in Mt. Kenya region such as Kirinyaga, Meru, Laikipia, Nyandarua, Muranga, Embu and Tharaka Nithi.
Nyeri has witnessed growth in infrastructure and amenities over the last five years attributed to:
- devolution due to flow of money from central government to county governments most of which is invested locally,
- tourism in the area which continues to grow,
- infrastructure development,
- relatively higher incomes, with it being the second richest county in terms of GDP per capita in the country at USD 1,503, after Kiambu at USD 1,785. Rounding up the top 5 richest Counties are Kajiado at USD 1,466, Nakuru at USD 1,413 and Laikipia at USD 1,226 on 3rd, 4th and 5th positions respectively
- its strategic central location in the Mount Kenya Region.
The water supply and sewerage are from Nyeri water and sewerage Company limited (NYEWASCO). The area is served by a number of main roads including: Nyeri – Nyahururu road, Nyeri-Karatina road and the Nyeri – Nanyuki road
The main factors driving the Real Estate Market in Nyeri are;
- Kenya Regional Headquarters – Nyeri is centrally located bordering over five counties in the Mt. Kenya Region, such as Nyandarua, Laikipia, Meru, Embu and Murang’a. This has led to attracting Mt. Kenya Regional offices for both local and international companies such as the Safaricom Mt. Kenya regional hub, National Construction Authority (NCA) Mt. Kenya Regional Office, and Coca Cola Mt. Kenya Bottlers Ltd, hence creating demand for office space, retail and in the housing sector,
- Devolution – Devolution has opened up Nyeri town, attracting government institutions, private investors and entrepreneurs to the county headquarters. This has therefore created demand for office space, retail space and residential to host all the investors and government officials,
- Growth of middle-income earners –Growth of the middle-income earners has translated to increased disposable income hence creating demand in the housing sector and retail facilities, which translates to towns such as Nyeri,
- Tourism – Nyeri County is on a major tourist circuit to Mt. Kenya and the northern region, hosting key tourist attractions such as the Lord and Lady Baden Powell graves, Mount Kenya and the Aberdares National Park. These therefore promotes the hospitality sector, hence creating demand for hotels, holiday homes and conference facilities, and,
- Growth of SMEs – The increase in the number of SMEs due to ease in business registration that takes a maximum of 2-weeks. Mt. Kenya Region hosts many of these companies, and requires office space and housing for the employees, hence drive the demand for real estate.
However, despite all the factors supporting the real estate sector in Nyeri, there are still a number of factors, which if not properly addressed present challenges to real estate development in the county:
- Availability of Land - Availability of land for development in Nyeri County has been low owing to the dense population at 208/km² in comparison to Kenya’s population density at 85/km², hence resulting in relatively high land prices. The county has also been operating largely like a closed circuit with minimal land sales to non-locals. This is mainly due to ownership of ancestral land; hence, people have sentimental attachment. This operation has therefore led to slow investment growth,
- Access to Funds – Just like other counties in Kenya, Nyeri is facing challenges on lack of proper funding for developments due to limited access to finance, characterized by few sources of funds to both developers and homeowners, hence low housing supply and commercial properties that are capital intensive. The Banking Amendment Act 2015 and more prudent lending by banks has also resulted in a decline in credit supply in the market which will hinder Real Estate developments,
- Unstructured planning regulations – Unstructured planning regulations, which currently does not clearly outline areas zoned for commercial, residential and special needs. This may lead to urban sprawl in urban centers and reduced land use maximization. The county is however working on setting up zoning regulations to formulate land use standards, zoning schemes and ordinances for all urban settlements in the county.
- Inadequate Infrastructure - Inadequate infrastructure such as access roads, with most being earthen roads, water services and drainage systems are poor, hence slowing the growth of real estate due to reluctant investors.
Nyeri Market Performance:
We undertook our research in August 2017, our market research focused on;
- Plinth Area - Research on the size of the units found in the market allows us to gauge the current offering, and put into consideration the home buyer’s preferences for sizes of houses,
- Prices - Research on prices will be used in comparison of our products against the market prices,
- Rental Rates - Research on rental income allows us to inform potential investors on the current rental rates in other developments and also inform the investors on the prospective rental yield they can gain from investing in Nyeri,
- Annual Uptake - This allows the investor to appreciate the rate at which available homes are sold over a specific period. This helps him/her gauge on whether it is profitable to invest in a given area.
The key themes covered are:
- Residential
Generally, the residential sector is picking up, with most of the estates having existed for less than 5-years. This has been driven by the government decentralization, urbanization and growth of middle class in the region. The residential houses are distributed in the outskirts of the Central Business District (CBD), such as Ring Road, Kamakwa and Kingongo areas. The key estates in the area are Garden Estate, Mountain View Estate, Ring Road Estate, which comprise mainly of owner-built and occupied standalone houses.
National Housing corporation (NHC) is the only institutional developer in Nyeri, having constructed residential bungalows available for sale to the public. Other real estate companies, operating in Nyeri real estate sector are Mhasibu Housing Company Limited, Gakuyo Real Estate and Madiba Properties Limited, among others that are selling land with a gated community concept.
We analyzed the performance of NHC bungalows performance, to gauge the market and the research findings are as follows;
|
All values in Kshs unless otherwise stated |
||||||||||||
|
Nyeri NHC Bungalow Units Performance Summary |
||||||||||||
|
Room Typology |
Unit Plinth Area (SQM) |
Initial Price (2014) |
Initial price per SQM |
Current Price (2017) |
current price per SQM |
Monthly Rent |
Monthly rent per SQM |
Sales achieved |
Annual Sales achieved |
Price App. |
Rental Yield |
Total Return |
|
1 bed |
42 |
2,800,000 |
66,667 |
3,200,000 |
76,190 |
10,000 |
238 |
100% |
33% |
4.6% |
3.8% |
8.3% |
|
2 beds |
54 |
3,500,000 |
64,815 |
4,000,000 |
74,074 |
20,000 |
370 |
71% |
24% |
4.6% |
4.3% |
8.8% |
|
3 beds |
69 |
4,000,000 |
57,971 |
4,400,000 |
63,768 |
28,000 |
406 |
67% |
22% |
3.2% |
5.1% |
8.3% |
|
Average |
63,151 |
71,344 |
338 |
79% |
26% |
4.1% |
4.4% |
8.5% |
||||
|
· The NHC development, have registered a total return of 8.5%, due to low appreciation rate, given the market has not accepted the build and sale exit model |
||||||||||||
|
· The 1-bedroom units have recorded the highest uptake at 33% annual uptake as compared to other typologies averaging at 23% annual uptake. This can be attributed to the fact that 1-bedroom are cheaper, and investors are targeting renters market, comprising of young working adults |
||||||||||||
Source: Cytonn Research August 2017
The residential apartments in and around Nyeri town are available for rent and the market is yet to witness a build for sale model. The analysis assumes an exit price of Kshs 71,344 per SQM, similar to the standalone units.
The performance on the sector is as follows;
|
All values in Kshs unless otherwise stated |
||||||
|
Nyeri 1- Bedroom Units Performance Summary |
||||||
|
Project |
Location |
Unit Plinth Area (SQM) |
Monthly Rent |
Monthly rent per sqm |
Occupancy % |
Rental Yield |
|
Hill View Place |
Kamakwa |
10,000 |
238 |
100% |
4.0% |
|
|
Pamki House |
CBD |
10,000 |
238 |
100% |
4.0% |
|
|
Kingongo Apartments |
Kingongo |
7,500 |
179 |
100% |
3.0% |
|
|
San Homes |
Ringroad |
52 |
10,000 |
238 |
60% |
2.4% |
|
Urban Premier Properties |
Kamakwa |
32 |
6,000 |
143 |
90% |
2.2% |
|
Average |
42 |
8,700 |
207 |
90% |
3.1% |
|
|
· 1-bedroom apartments have on average a rental yield of 3.1% at an occupancy rate of 90%. The low rental yields in comparison to Nairobi average rental yield of 6.0% is due to low rental charges, that the market is willing to pay |
||||||
Source: Cytonn Research August 2017
|
All values in Kshs unless otherwise stated |
||||||
|
Nyeri 2- Bedroom Units Performance Summary |
||||||
|
Project |
Location |
Unit Plinth Area (SQM) |
Monthly Rent |
Monthly rent per sqm |
Occupancy % |
Rental Yield |
|
El Dorado Apartments |
Kingongo |
35,000 |
515 |
100% |
8.7% |
|
|
Skyfon Apartment |
CBD |
46 |
12,000 |
261 |
83% |
3.7% |
|
Grand View Apartments |
Kamakwa |
66 |
15,000 |
227 |
94% |
3.6% |
|
Kim Joy Apartments |
Kingongo |
76 |
15,000 |
197 |
100% |
3.3% |
|
Jesma Apartments |
Kingongo |
70 |
15,000 |
214 |
89% |
3.2% |
|
Emma Apartments |
Ringroad |
71 |
13,500 |
190 |
90% |
2.9% |
|
PCEA Apartments |
Kingongo |
80 |
12,000 |
150 |
92% |
2.3% |
|
San Homes |
Ringroad |
67 |
13,500 |
201 |
60% |
2.0% |
|
Average |
68 |
13,714 |
206 |
87% |
3.0% |
|
|
*The average excludes EL Dorado apartments since it’s an outlier, providing better amenities such as parking bays and quality finishing |
||||||
|
· 2-bedroom apartments have on average a rental yield of 3.0% at occupancy rates of 87% driven by young families. The low rental yields are attributable to low rental charges as most people prefer living in their ancestral land or own built houses in the urban centres |
||||||
|
· The average monthly rental charges for 2-bedroom apartments is Kshs. 13,714. The rental charges are mainly informed by the quality of the building, amenities and distance from C.B. D |
||||||
Source: Cytonn Research August 2017
|
All values in Kshs unless otherwise stated |
||||||
|
Nyeri 3- Bedroom Units Performance Summary |
||||||
|
Project |
Location |
Unit Plinth Area (SQM) |
Monthly Rent |
Monthly rent per SQM |
Occupancy % |
Rental Yield |
|
Summers Apartments |
Ringroad |
120 |
40,000 |
333 |
100% |
5.6% |
|
Skyfon Apartment |
CBD |
58 |
17,000 |
293 |
100% |
4.9% |
|
Average |
89 |
28,500 |
313 |
100% |
5.3% |
|
|
· Nyeri Town has very few 3-bedroom apartments, given that families prefer living in their ancestral land facilitated by good infrastructure and amenities in rural areas |
||||||
|
· 3-bedroom apartments have an average rental yield of 5.3%, at 100% occupancy higher than 1 and 2-bedroom apartments since they are located in upper middle-income neighbourhood hence attracting higher rental charges |
||||||
Source: Cytonn Research August 2017
Summary
|
All values in Kshs unless otherwise stated |
||||
|
Nyeri Residential Apartments Summary |
||||
|
Project |
Unit Plinth Area |
Monthly rent per sqm |
Occupancy % |
Rental Yield |
|
1 Bedroom |
42 |
207 |
90% |
3.1% |
|
2 Bedroom |
68 |
206 |
87% |
3.0% |
|
3 Bedroom |
89 |
313 |
100% |
5.3% |
|
Average |
242 |
92% |
3.8% |
|
|
· The Nyeri town residential sector has an average rental yield of 3.8%, at 92% occupancy and Kshs. 242 monthly rent per SQM. The high occupancy rates are driven by increased urban population from young working adults and county officers |
||||
|
· 3-bedroom apartments recorded the highest average rental yield of 5.3%. This is attributable to higher rental charges that the tenants are willing to pay for the better amenities provided such as parking bays, perimeter wall and quality finishes |
||||
Source: Cytonn Research August 2017
- Commercial Properties
The summary of the sector’s performance is as below:
|
All prices in Kshs. Unless stated otherwise |
|||||
|
Commercial Properties Performance in Nyeri August 2017 |
|||||
|
Project |
Location |
Rent per Sqft (Retail) |
Rent per Sqft |
Occupancy |
Rental Yield |
|
KonaHauthi |
Along Townhall rd |
100 |
100% |
24.0% |
|
|
Sohan Plaza |
On Kimathi and Nyayo street Junction |
80 |
80 |
95% |
18.2% |
|
Rware Building |
Gakere road |
80 |
80% |
15.4% |
|
|
Umoja House |
Kimathi Street |
57 |
90% |
12.3% |
|
|
Nyeri Cooperative Union Limited Building |
Along Townhall rd |
50 |
90% |
10.8% |
|
|
Central Plaza |
Kimathi street |
28 |
90% |
6.0% |
|
|
Katsuri building |
Kimathi Street |
100 |
19% |
4.6% |
|
|
Peak centre |
senior Chief Wambugu rd |
125 |
90% |
||
|
Prestige plaza |
Kimathi Street |
103 |
90% |
||
|
Average |
103 |
71 |
83% |
13.0% |
|
|
· Commercial office in Nyeri have an average yield rate of 13% at a rent per Sqft of Ksh. 71 and exit cost of approximately Ksh. 5,000 per sqft informed by buildings on sale and an average occupancy of 83% |
|||||
|
· Nyeri lacks grade A or B offices, with most of the offices being in bad state of repair. Renovated and upcoming buildings are attracting higher occupancy since people are willing to pay for the facilities, hence presents an opportunity for investing in Commercial property |
|||||
Source: Cytonn Research August 2017
- Site and Service Schemes Research
The summary of the sector’s performance is as below:
|
All values in Kshs. Unless otherwise stated |
||||||
|
Nyeri 1/4-acre plots Performance Summary |
||||||
|
Name of the Development |
Location |
Size of Plots (Acres) |
Selling Price (Ksh) - 2017 |
Sales Achieved |
Annual Uptake |
Annual Capital App. |
|
Twin Mount Estate – Nyeri |
5Kms from Nyeri Town |
1/4 acre |
2.0Mn |
87% |
17% |
32.0% |
|
Madiba Gardens Nyeri |
near Kimathi university |
1/4 acre |
2.8Mn |
12% |
8% |
12.0% |
|
Kingongo Plots |
4.4 Km Nyeri-Nyahururu rd. |
1/4 acre |
3.8Mn |
59% |
59% |
7.0% |
|
Average |
2.9Mn |
53% |
28% |
17.0% |
||
|
· 1/4-acre plots have an average price of 2.9Mn, recording an annual capital appreciation of 17.0% mainly driven by infrastructural development |
||||||
Source: Cytonn Research August 2017
|
All values in Kshs. Unless otherwise stated |
|||||||
|
Nyeri 1/8-acre plots Performance Summary |
|||||||
|
Name of the Development |
Location |
Size of Plots (Acres) |
Selling Price (Ksh) - 2017 |
Sales Achieved |
Annual Uptake |
Annual Capital App. |
|
|
Sifa Gardens |
20km Nyeri - Nanyuki rd |
1/8 acre |
0.6Mn |
94% |
94% |
38.0% |
|
|
Rorenu |
1/8 acre |
3.0Mn |
100% |
67% |
13.0% |
||
|
Lusoi Gardens |
29 km Nyeri – Narumoru rd |
1/8 acre |
0.3Mn |
29% |
29% |
12.0% |
|
|
Grace Gardens Nyeri |
Mweiga (Nyeri - Nyahururu rd) |
1/8 acre |
0.8Mn |
80% |
80% |
7.0% |
|
|
Gatitu |
8.6 km Nyeri - Karatina rd |
1/8 acre |
1.4Mn |
93% |
47% |
||
|
Average |
1.2Mn |
79% |
63% |
17.5% |
|||
|
· 1/8-acre plots have an average price of 1.2Mn, recording an annual capital appreciation of 17.5% mainly driven by amenities in proximity and infrastructural development |
|||||||
|
· Cost of land, in Nyeri is dependent on level of servicing and the location, with land within or in close proximity to the CBD recording higher prices |
|||||||
Source: Cytonn Research August 2017
- Holiday Homes Research
The summary of the sector’s performance is as below;
|
All values in Kshs unless stated otherwise |
||||||||||
|
Holiday Homes Performance Summary |
||||||||||
|
Name of Development |
Size of Unit (SQM) |
Land size |
No. of BR |
2017 Price (Ksh) |
2017 Price per SQM (Ksh) |
Monthly Rent (Ksh) |
Monthly Rent per SQM (Ksh) |
Uptake |
Annual Uptake |
Yield (%) |
|
OLosinya Villa Peacock Batuk |
200 |
0.1 |
4 |
16.5 m |
82,500 |
140,000 |
700 |
25% |
25% |
10.2% |
|
Mount Kenya Wildlife Estates |
326 |
0.5 |
5 |
33.0 m |
101,348 |
210,000 |
644 |
98% |
25% |
7.6% |
|
Nanyuki Homes |
250 |
0.5 |
4 |
20.0 m |
80,000 |
120,000 |
480 |
7.2% |
||
|
Swiss International Resort Mt Kenya |
200 |
0.5 |
3 |
27.5 m |
137,500 |
160,000 |
800 |
19% |
6% |
7.0% |
|
Swiss International Resort Mt Kenya |
240 |
0.5 |
4 |
35.0 m |
145,833 |
172,800 |
720 |
19% |
6% |
|
|
Swiss International Resort Mt Kenya |
262 |
0.5 |
4 |
37.5 m |
143,130 |
172,800 |
660 |
19% |
6% |
5.5% |
|
Maiyan+ SQ |
585 |
0.3 |
6 |
54.0 m |
102,273 |
191,600 |
328 |
100% |
33% |
3.8% |
|
Average |
0.4 |
113,226 |
619 |
60% |
22% |
6.8% |
||||
|
•Holiday Homes in Nyeri county and its environs have an average rental yield of 6.8% lower than areas such as Naivasha with rental yield of 8.0%, however the hospitality sector in Nyeri will record higher returns driven by the target demand from leisure tourism, business tourists and conferencing |
||||||||||
Source: Cytonn Research August 2017
Nyeri Market Summary Analysis
|
Nyeri Market Performance Summary |
||||
|
Theme |
Annual Uptake |
Occupancy Rates |
Rental Yield |
Capital Appreciation |
|
Residential |
26% |
89% |
3.9% |
4.4% |
|
Commercial Properties |
- |
83% |
13.0% |
- |
|
Site & Service |
46% |
17.3% |
||
|
Holiday Homes |
22% |
6.8% |
- |
|
|
Average |
31% |
86% |
7.9% |
10.7% |
|
· Nyeri market has an average rental yield of 7.9% and a capital appreciation of 10.7%, hence a total return of 18.6%. The Commercial properties have the highest yields at 13.0% due to high demand & occupancy rates at 83% |
||||
|
· The Residential sector has the highest occupancy rates with 89% indicating high demand for rental houses. However, the sector, lacks sufficient institutional developers with only NHC selling bungalows |
||||
|
· Of key to note is that Nyeri market is predominantly rental in the office, retail and residential sectors |
||||
Comparative Analysis
In comparison with other Counties in Kenya, Nyeri has higher rental yields for commercial properties than Mombasa, Kisumu, Nairobi and Nakuru with yields of 13.0%, 10.0% and 9.6% and 10.9%, respectively. Mombasa and Nairobi however have the highest yields at 6.0% and 5.6%, respectively, for residential sector. Nyeri and Nakuru however have low residential rental yields at 4.1% and 4.3%, respectively, in comparison to Nairobi, Mombasa and Kisumu, as the market comprises of families that prefer living in their ancestral land or own built houses in the urban centers.
Below is a summary of the analysis;
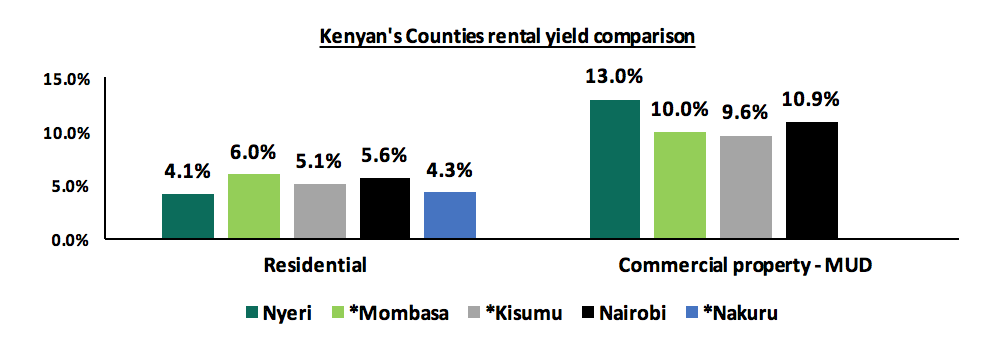
Source: Cytonn Research, * - 2016 data
Market Performance and Outlook:
|
Nyeri Market Performance and Outlook |
|||
|
Theme |
Performance (2017) |
Recommendation |
Outlook |
|
Residential |
The residential sector has total returns of 8.3% on average with rental yield of 3.9% and price appreciation of 4.4%. Residential houses sector is picking up, with most of the estates, having less than 5 years existence and recording high occupancy rates of 89% |
Focus on Standalone houses in the Upper mid end segment of the market for sale For apartments, focus on the low and mid-end segments of the market by providing apartments for rent since the market is yet to accommodate build for sale model |
|
|
Commercial Properties |
The commercial properties sector has yields of 13.0% and average occupancy of 83%. |
Nyeri lacks grade A or B offices, with most of the offices being in bad state of repair and lack lifts and still records high returns and occupancy rates, hence presents an opportunity. The markets lack formal shopping malls with key retailers being Naivas and Mathai supermarket hence a key investment opportunity into the sector |
|
|
Site and service schemes |
Site and service schemes recorded an average annual capital appreciation of 17.3% at an annual uptake of 45% |
With increased demand for residential units, and the markets embracing the tradition of building their own homes, site and service schemes present an investment opportunity in Nyeri |
|
|
Holiday Homes |
Holiday Homes in Nyeri county and its environs have an average rental yield of 6.8% assuming 100% occupancy rates |
With increased leisure tourism, business tourists and conferencing, Holiday homes presents an investment opportunity in Nyeri |
|
We have a positive outlook for the Nyeri real estate market driven by the emerging housing demand, devolution, positive demographics and improved infrastructural development. Our preferred investment areas are commercial properties - MUD, site and service schemes and in the holiday homes sector.
Disclaimer: The views expressed in this publication are those of the writers where particulars are not warranted. This publication, which is in compliance with Section 2 of the Capital Markets Authority Act Cap 485A, is meant for general information only, and is not a warranty, representation, advice or solicitation of any nature. Readers are advised in all circumstances to seek the advice of a registered investment advisor.

- Talk to us
- Kenya
- P.O Box 20695 - 00200, Nairobi, Kenya
- Cell +254709101200
- Tel +254709101200
- WhatsApp +254741676635
- United States
- +254709101200
- DOWNLOAD OUR APP
-


- Kenya
- 8th Floor, Pinetree Plaza, Kaburu Drive, Ngong Road, Nairobi, Kenya
- USA
- Suite 1150, 1775 Eye Street NW, USA, Washington DC 20006, USA
- Investments
- High Yield
- Private Equity
- Real Estate
- Real Estate
- RiverRun Estates
- Cytonn Towers
- The Ridge
- Taraji Heights
- The Alma