Mar 10, 2019
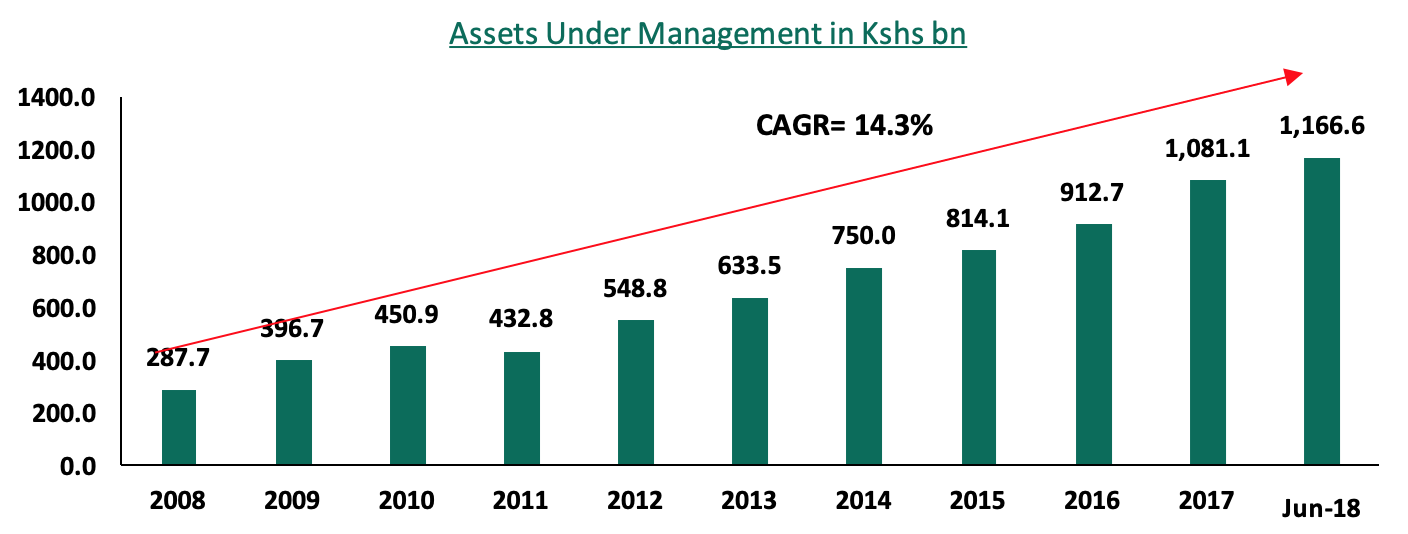
The Retirement Benefits Industry plays a huge role in the economy. According to the Organization for Economic Co-operation and Development (OECD) in 2017, assets in Retirement Benefits Schemes totaled 50.7% of GDP in the OECD countries and 19.7% of total GDP in the non-OECD jurisdictions. It is clear that most non-OECD countries still have a long way to go in the growth of the sector. In Kenya, the Retirement Benefits Assets as a percentage of GDP stood at 13.4%, compared to more developed markets like the USA at 84.1% and the UK at 105.3%. Over the last decades, we have seen reforms and education initiatives by the Retirement Benefits Authority (RBA) to educate people on the importance of saving for retirement. The industry has registered great growth from both member contribution and good performances leading to the assets under management growing to Kshs 1,166.6 bn in 2018, from Kshs 287.7 bn 10-years ago, which is a compound annual growth rate of 14.3% over the 10-years.
We cannot emphasize enough on the importance of saving for retirement, as everyone will have needs at retirement. These needs may vary greatly for different people, but everyone will have basic needs and expenses such as home maintenance or rent, transportation, medical care etc. In order to enjoy your retirement years, one needs a stable source of income, and the primary way to achieve this is through disciplined saving, and investing these funds to grow by gaining interest and returns. This can be achieved by signing up to a registered Retirement Benefits Scheme and contribute to it during your working years. As you contribute, it is also important to review the performance and management of your funds to ensure the returns are attractive on a risk-adjusted basis and outperforming the inflation rates in the economy.
In this report, we will look at how this industry has grown, with a key focus on the performance reported by Fund Managers of Retirement Benefits Schemes in 2018. We shall also analyze this performance and the factors that contributed to the same, as well as give our view on how the growth of this industry and the returns offered can be further supported. As such, we shall cover;
- Retirement Benefits Industry Growth over the Last 10-Years,
- Historical Performance by Retirement Benefits Schemes, and,
- Conclusion and Outlook.
Section I. Retirement Benefits Industry Growth over the Last 10-Years
The Retirement Benefits Industry in Kenya has registered significant growth, with the total Assets Under Management (AUM) having grown by a Compound Annual Growth Rate (CAGR) of 14.3% to the current AUM of Kshs 1,166.6 bn as of June 2018, from Kshs 287.7 bn in 2008. This growth can be attributed to (i) growth in contributions as members registered to Retirement Benefits Schemes continue to increase, (ii) actual individual contributions have also increased driven by the growing middle class, and (iii) increased returns on the investments. Despite the immense growth, the penetration rate of the Retirement Benefits Schemes remains low at 15.0% of the adult population, indicating that most Kenyans are yet to subscribe to a formal Retirement Benefits Scheme.

Changes in the Asset Allocation by Retirement Benefits Schemes in Kenya
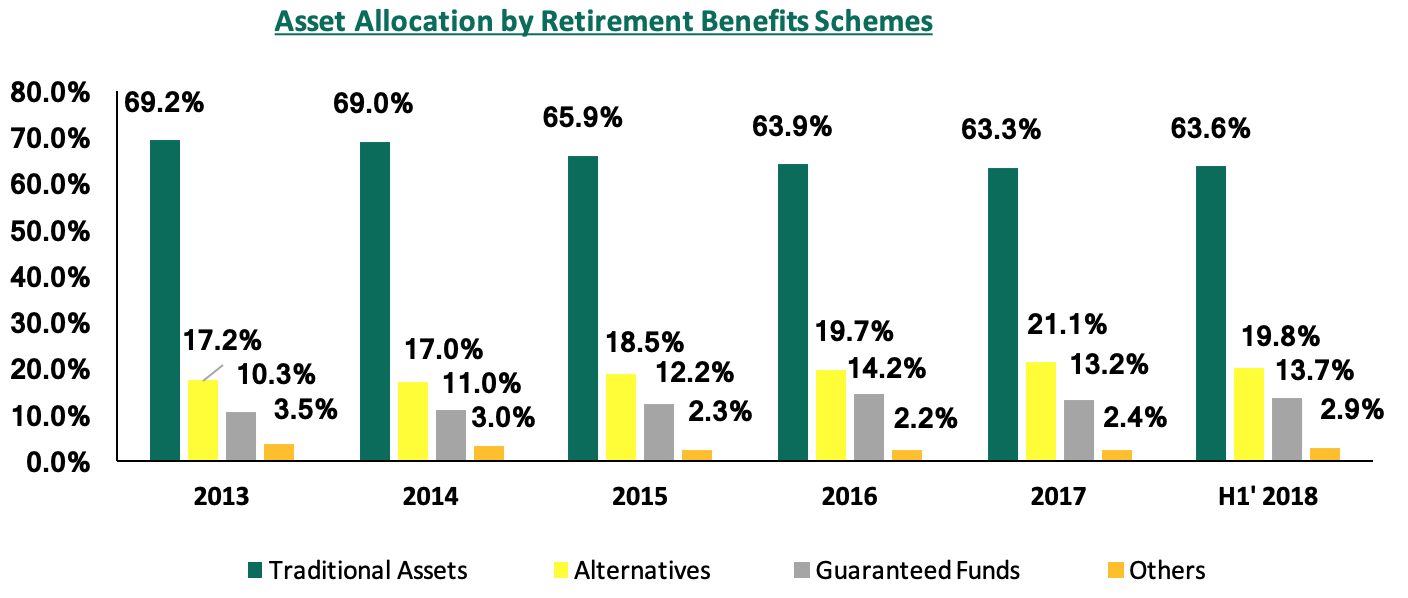
Over the years, allocation by Retirement Benefits Schemes has been skewed towards traditional assets, which include Government Securities and Equities. The allocation to alternative assets, including Property, Private Equity, and REITs, has however been increasing, rising to 19.8% of total Assets Under Management (AUM) as of June 2018 from 17.2% in 2013. There is, however, room for improvement and growth as the regulations allow up to 70% allocation towards alternatives, i.e. (Property 30%, Private Equity 10%, REITs 30%).

Source: RBA Industry Report June 2018
Fund Managers’ low allocation in alternatives can be attributed to lack of expertise and experience with asset classes such as private equity and real estate, as investing in these asset classes requires detailed due diligence and evaluation as well as engaging legal, financial and sector-specific expertise.
Key Drivers that Determine the Investment Performance of Retirement Benefits Schemes:
- Asset Allocation: Asset allocation is the largest determinant of the performance of a scheme. Over the years, we have seen slight changes in the actual holdings of the Retirement Benefits Schemes, with their allocation being skewed towards traditional assets as seen above. It is important for Fund Managers to have a well-balanced portfolio on a risk-return basis to ensure that they offer their members high returns and at the same time protecting their contributions. Some of the factors that play a key role in determining a schemes asset allocation include;
- Regulation: The RBA provides a guide on how the Retirement Benefits Schemes assets are to be invested and the limits to be applied to different asset classes. These limits have changed over time to reflect the changing investment environment with the regulator adding other asset classes such as private equity and real estate investment trusts to the approved investment asset classes in the regulations,
- Average Age of Members: Depending on the average age of the scheme members, it dictates how aggressive a scheme can be. With members who are closer to retirements, schemes cannot be too aggressive and thus will need to structure their Investment Policy Statements to reflect the risk appetite of their members and this will dictate how their portfolio will be constituted to reflect the low-risk appetite,
- Economic Environment: Investments performance is largely driven by the prevailing economic environment as investments are affected by diverse macroeconomic factors such as fluctuations in the exchange rate, inflation rate, interest rate, money supply, among others. It is therefore important for Fund Managers to carry out extensive research on the macroeconomic environment before making investments decisions,
- Size of the Fund: Larger schemes tend to have more flexibility in terms of investments and are able to make calculated bets when investing, and take up more risks than smaller schemes, and therefore benefit from a high-risk high return, and,
- Management Expertise: Management expertise play a huge role in performance by schemes as better managed schemes perform better than schemes where the management lack the relevant expertise to run the scheme. It is therefore important for the management of schemes to undertake regular training to be able to continually develop their skills and expertise and keep abreast with the changing investment environment.
Section II. Historical Performance by Retirement Benefits Schemes
Guaranteed Schemes
Guaranteed Schemes are largely offered by insurance companies and they guarantee a minimum rate of return, with the maximum allowable rate that can be guaranteed is 4.0% p.a. The insurance companies, however, give higher returns based on the portfolio performance, as seen below:

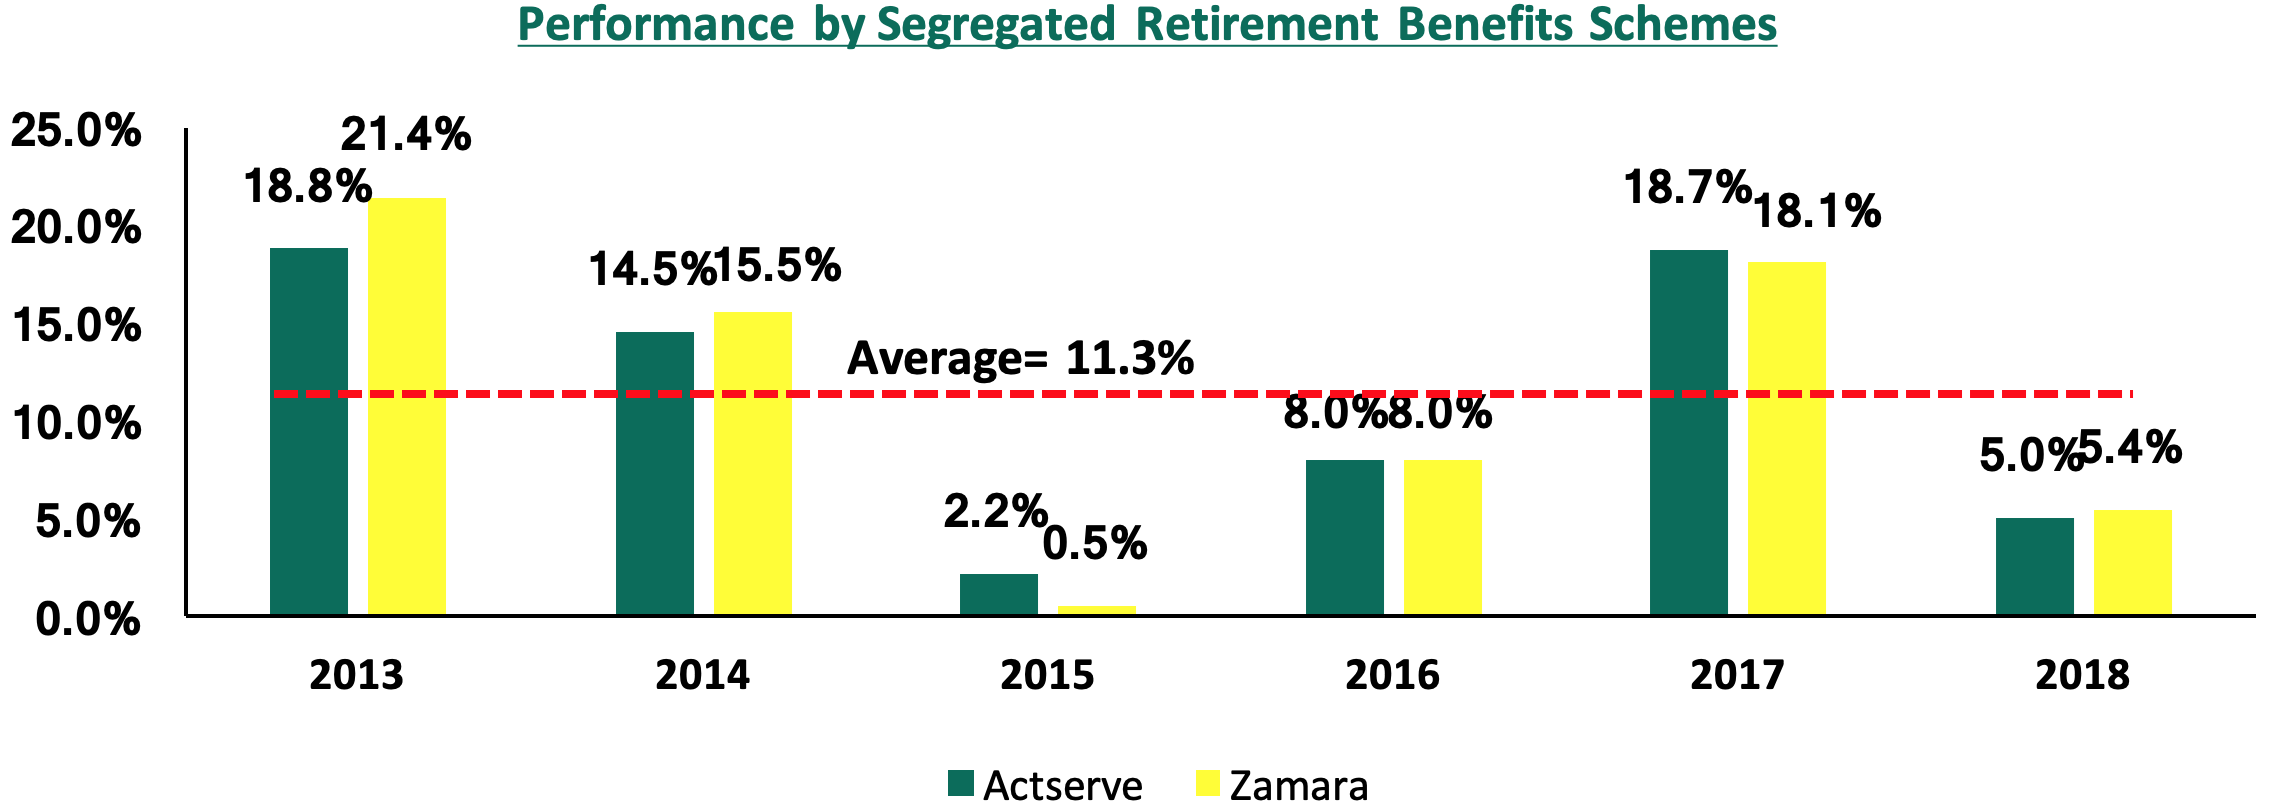
Historically, guaranteed schemes have offered lower returns compared to segregated schemes, at a basic average of 9.8% in the last 5 years compared to the basic average of 11.3% for segregated schemes in the same period, as the insurance companies hold some reserve every year to cater for years where the performance of the market is below the promised rate. For instance, in the year 2013, guaranteed schemes declared a return of 12.1%, which was 8.0% points lower than the average return of 20.1% declared by segregated schemes. However, in 2013 when markets dipped and segregated schemes declared an average return of 1.4%, guaranteed schemes declared a return of 8.1%, 6.7% points higher than the average return declared by segregated schemes. Guaranteed schemes are therefore attractive for members with a conservative risk appetite as the contributions are protected and a minimum return is guaranteed. The 2018 results for guaranteed schemes are yet to be released; we, however, expect them to perform better than segregated schemes, which recorded an average of 5.2% over one year, as they utilize their reserves to shore-up members’ returns and cushion their schemes from the poor performance in the equities markets experienced in 2018.
Segregated Schemes
Segregated Schemes are those where members’ contributions are invested directly by the Trustees via an appointed Fund Manager. The declared returns are based on what the fund achieves, fewer expenses, for the period in the review and the returns are fully accrued to the scheme for the benefit of members. In Kenya, there are two reports that are released on an annual basis. These are the Actuarial Services Company (EA) Limited (Actserve) Pension Schemes Investment Performance Survey, and the Zamara Consulting Actuaries Schemes Survey (Z-CASS).
For the year 2018, the Actserve and Z-CASS reports have indicated average returns for segregated schemes came in at 5.2% (Z-CASS reporting 5.4% and Actserve reporting 5.0%), a 71.7% decline (representing a decline of 13.2% points) from the 18.4% declared in 2017 (Z-CASS reporting 18.1% and Actserve reporting 18.7% in 2017).

The low performance was greatly attributed to the protracted bear run in the equities market in 2018, which wiped out about Kshs 488.0 bn of investors wealth in the bourse, with NASI and NSE 20 declining by 18.0%, and 23.7%, respectively, in contrast to 2017, where NASI and NSE 20 rose by 27.0% and 16.5%, respectively. Schemes that have huge exposures in the equities market reported much lower returns. The lackluster performance in the equities markets can be attributed to;
- Negative investor sentiments that saw foreign investors remain net sellers with a net outflow of USD 425.6 mn, a 274.3% increase to the net outflows of USD 113.7 mn recorded in FY’2017. This can be attributed to higher risk perception of the country by investors, as international investors exited the broader emerging markets due to the expectation of rising US interest rates, coupled with the International Monetary Fund (IMF) raising the risk of Kenya’s debt distress from low to moderate on October 2018, and,
- Poor company performance with some issuing Profit warnings. The year also saw at least eight (8) companies issue profit warnings to investors with the companies citing the relatively tougher operating environment, which affected the top-line revenue, leading to rising inefficiencies, and consequently declining net income. This made investors shy away from the bourse.
Section III. Conclusion and outlook
Given the continued changes in the Retirement Benefits Industry and increased knowledge of investments, the sector is expected to do well both in terms of growth and returns offered to members. This can be further supported through:
- Increase Mass-Market Education to Increase the Penetration Rate: The current pension’s penetration rate of 15.0% of the adult population is still low and the growth of this industry is highly pegged on attracting more people into Retirement Benefits Schemes, especially those in the informal sector where membership is voluntary. Some of the ways to do this would include:-
- Campaigns by both the RBA and players in the industry including Fund Managers and Fund Administrators to educate people on the importance of saving for retirement, and,
- Fund Managers should make investments in Retirement Benefits Schemes more attractive to millions who are not members by offering superior returns compared to other investments to draw them into these schemes,
- Increased Member Education: The regulator, RBA, has made strides in increasing member education through various member education programs and this will empower members in terms of demanding better service and returns from their Fund Managers,
- Trustee Certification: The RBA has also made it compulsory for Trustees of registered Retirement Benefits Schemes to be certified. This will certainly enhance the capability of Trustees in managing the affairs of the schemes professionally, resulting in better-managed schemes,
- Increased Diversification: Increasing diversification in schemes portfolios will enable Fund Managers to cushion their funds from the effects of non-performance in a particular asset class and minimize the erosion of the value of investments. Strides have been made to achieve this by some Fund Managers through the formation of bodies such as the Kenya Pension Fund Investment Consortium, consisting of 10 Fund Managers with over Kshs 150.0 bn of AUM, with the aim of pooling funds to invest in alternative asset classes. This will result in improved performance by Fund Managers as well as diversified portfolios, and reduce the high exposure in the traditional asset classes,
- Increased Competition by the Various Players in the Market: The RBA has continued to issue licenses to new players in the market and this will beef up competition in the industry keeping the Fund Manager on their toes to ensure that they offer higher returns to their members, and,
- Innovation and Product Development: The RBA has been reviewing its regulations to allow for new products such as the Mortgage Regulations, which allow members to utilize a portion of their accrued benefits as security for a mortgage, and the Post-Retirement Medical Regulations, which allow members to utilize part of their accrued benefits to purchase a post-retirement medical cover. These products have not gained traction but we expect that schemes shall in the near future, find ways of utilizing such regulations to the benefit of their members and draw more people into their schemes.
Disclaimer: The views expressed in this publication are those of the writers where particulars are not warranted. This publication, which is in compliance with Section 2 of the Capital Markets Authority Act Cap 485A, is meant for general information only and is not a warranty, representation, advice or solicitation of any nature. Readers are advised in all circumstances to seek the advice of a registered investment advisor.

