Nov 19, 2017
Having established a strong research team and delivery framework in Kenya, we have now launched a Sub Saharan Africa (SSA) research coverage initiative. The initial coverage will be limited to Financial Services, which is one of our strongest research sectors, alongside real estate research.
SSA has long been viewed as the next global growth frontier buoyed by improving macro-economic stability, compelling demographic trends, improved governance and ease of doing business across the continent. However, following a decline in commodity prices and slowing demand from China, the region fell behind the world economy in output, growing at 1.4% in 2016, slower than the aggregate global growth of 3.2%. The slowdown was not evenly distributed amongst countries in SSA, being mainly concentrated in commodity exporters, while more diversified economies sustained robust economic growth, with countries in East Africa including Djibouti, Ethiopia, Kenya, Rwanda and Tanzania, all recording GDP growth rates above 5% in 2016, with Ethiopia leading at 8%. This year, the economic outlook for the Sub-Saharan Africa region is positive with an overall growth forecast set at 2.6% in 2017, rising to 3.4% in 2018, against expected global growth of 3.6% and 3.7%, respectively. A number of factors are supporting this growth, among them; (i) stronger domestic demand following the emergence of a rising middle class, (ii) sound macroeconomic policy management now entrenched in many African countries, (iii) a generally improving and favourable business environment, (iv) a more diversified economic structure, particularly towards the services sector and light manufacturing, and (v) rising commodity prices, which started to rise in the latter part of 2016.
We undertook an analysis on the Sub-Saharan African Financial Services sector to analyse the investments opportunities in the listed financial services firms in order to determine which companies are the most attractive and stable for investment from a franchise value and from a future growth opportunity perspective. In total, we analysed 49 companies operating in 10 Sub Saharan African countries. These countries are (i) Kenya, (ii) Uganda, (iii) Tanzania, (iv) Rwanda, (v) Nigeria, (vi) Ghana, (vii) Mauritius, (viii) Zambia, (ix) Namibia, and (x) Botswana.
For country selection in SSA, we used both Macro and Micro metrics to determine which countries and companies to select in our coverage universe – the goal was to analyse investable countries and companies. The macro ranking involved macro-economic metrics such as GDP growth, interest rates, inflation, exchange rate, corporate earnings, foreign investor sentiment and security & political environment; ranking them as Positive - if we expect improvement supported by good fundamentals, Neutral - if the indicators point to a maintenance of previous levels, and Negative - if we expect a deterioration in conditions. A description of the metrics is highlighted below:
- GDP growth: For the GDP growth metric, we checked what has been the country’s 10-year average GDP growth and compare with the expected growth rate for the current year, with higher expected growth being Positive, declining growth as Negative, and growth within a 1% range from the average being Neutral,
- Interest Rates: The criteria for interest rates checks whether a country is more likely to tighten or loosen financial conditions - with looser monetary policy associated with spurring growth thus Positive, while tighter financial conditions with slowing a heating up an economy- thus Negative and expectations of similar conditions as Neutral,
- Inflation: For the inflation metric, we compare the current and expected inflation rates against policy targets for sustainable growth and cost of money- with inflation rates that are out of range with targets and trending away being Negative- those rates within range being Positive, and expectations of inflation rates within range being Neutral,
- Currency Stability: Here we analysed the local currency performance against the US dollar, with more than a 5% depreciation, or depreciation larger than the previous 5-year average having a Negative outlook, depreciation within range having a Neutral outlook, while sustained appreciation of more than 5% having a Positive outlook,
- Corporate Earnings: For corporate earnings, we looked at annual growth rates and for earnings growth that exceeds the country’s growth rate, we consider that as a Positive, for earnings growth within 2% of the range of the country’s growth rate is Neutral, while slower earnings growth than the country growth rate is Negative,
- Investor Sentiment: This tracks sentiment by foreign investors towards a particular country and their investments. When Positive, more foreign investors are actively investing and establishing new positions in a country, while Negative sentiment means that foreign investors are actively exiting their positions in the country’s markets, while Neutral indicates that investors exiting and establishing new positions is fairly stable,
- Political Stability & Security: This refers to the general security situation in a country, coupled with the social and political stability. Positive outlook suggests minimal unrest in the country, be it political or social, while Neutral indicates a small possibility of unrest, however the country’s security forces have maintained peace and stability, and Negative indicates a state of unrest in the country.
Below is the summary table of the various countries we looked at:
|
Macro-Economic Drivers for Select Sub Saharan Africa Countries |
||||||||||
|
Driver |
Kenya |
Tanzania |
Uganda |
Rwanda |
Nigeria |
Ghana |
Mauritius |
Zambia |
Namibia |
Botswana |
|
GDP Growth |
Neutral |
Positive |
Neutral |
Positive |
Neutral |
Positive |
Positive |
Neutral |
Negative |
Neutral |
|
Interest Rates |
Neutral |
Neutral |
Positive |
Positive |
Neutral |
Positive |
Positive |
Positive |
Negative |
Neutral |
|
Inflation |
Neutral |
Neutral |
Positive |
Neutral |
Negative |
Positive |
Neutral |
Positive |
Neutral |
Positive |
|
Currency Stability |
Neutral |
Negative |
Neutral |
Neutral |
Neutral |
Neutral |
Neutral |
Positive |
Positive |
Neutral |
|
Corporate Earnings |
Neutral |
Positive |
Neutral |
Neutral |
Positive |
Positive |
Neutral |
Neutral |
Neutral |
Neutral |
|
Investor Sentiment |
Neutral |
Positive |
Neutral |
Positive |
Positive |
Neutral |
Positive |
Neutral |
Neutral |
Positive |
|
Stability & Security |
Neutral |
Positive |
Neutral |
Neutral |
Neutral |
Positive |
Positive |
Positive |
Positive |
Positive |
|
Overall |
Neutral |
Slightly Positive |
Slightly Positive |
Slightly Positive |
Slightly Positive |
Strong Positive |
Strong Positive |
Strong Positive |
Neutral |
Slightly Positive |
The 10 countries highlighted in the Macro-ranking table were supported by positive fundamentals, with:
- 3 countries, namely Ghana, Mauritius and Zambia emerged as having strong positive fundamentals,
- 5 countries, namely Tanzania, Uganda, Rwanda, Nigeria and Botswana had slightly positive fundamentals, while
- Kenya and Namibia had a Neutral rating, with their country fundamentals pointing to no significant change from the current operating environment.
Based on the overall ranking, we found these 10 SSA countries to be investable, with a bias to investing in Ghana, Mauritius and Zambia. We then proceeded to single out individual investable companies using our criteria for Micro rankings, which included stock market metrics such as:
- Market Capitalization: We included companies with a minimum of USD 70 mn in our coverage universe, as this presented companies that could absorb a fairly large investment amount,
- Turnover in Individual Stocks: Stocks with a minimum daily turnover of USD 20,000 were included in our coverage, as this presented stocks that were liquid enough to establish a sizeable position in,
- Foreign Investor Participation: Markets with considerable foreign participation and companies with considerable foreign investor interest are preferred, owing to better required disclosures and better price discovery, and
- Free Float: A company’s free float is the proportion of shares that is not locked-in or closely held by controlling interest investors or government and is freely traded in the stock market. We included companies with a minimum free float of 20% in our coverage.
Given our focus was on the Financial Services sector, we sought to identify the factors driving growth, development, and sustainability of the sector. Factors supporting the growth in SSA Financial Services sector include:
-
- Stable macro-economic indicators; from the above table it is clear that the region now enjoys a more stable economy and can be able to attract more capital into the region for growth. The largest beneficiary of a growing economy is the financial services sector,
- Improved regulations: we have seen improved regulations that have made the sector more transparent and adoption of new methods of reporting like Risk based. This means that the population is willing to take up more financial services products as they understand them more,
- The Sub-Saharan Africa region has a young and growing population, registering growth of 2.2% p.a. and is projected to more than double by 2050. This represents an opportunity in the Financial Services sector as, coupled with financial inclusion, which is on a rise in Africa, there is an inherent increase in consumption expenditure and a rise in the percentage of the population requiring financial services,
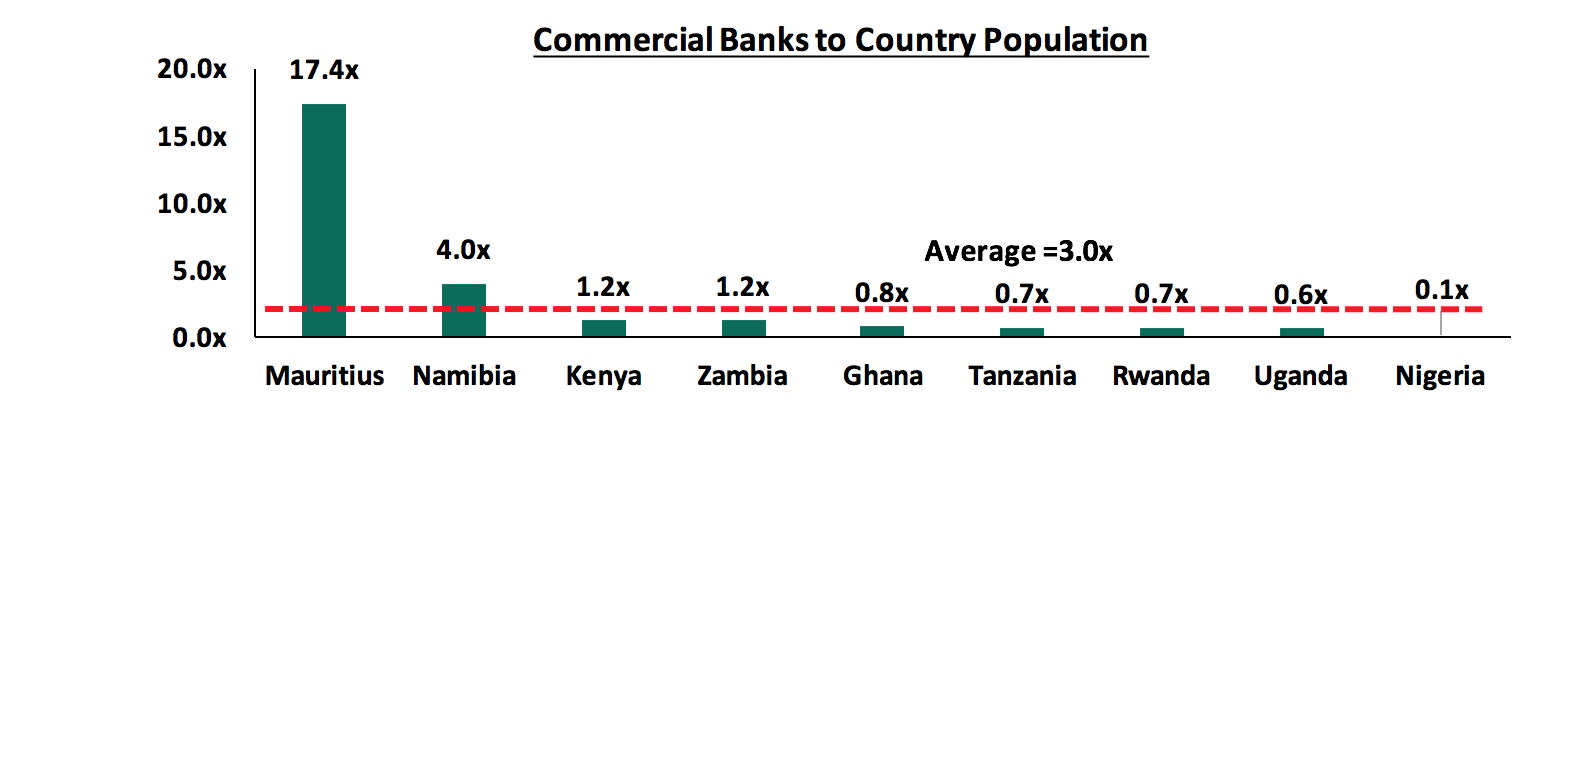
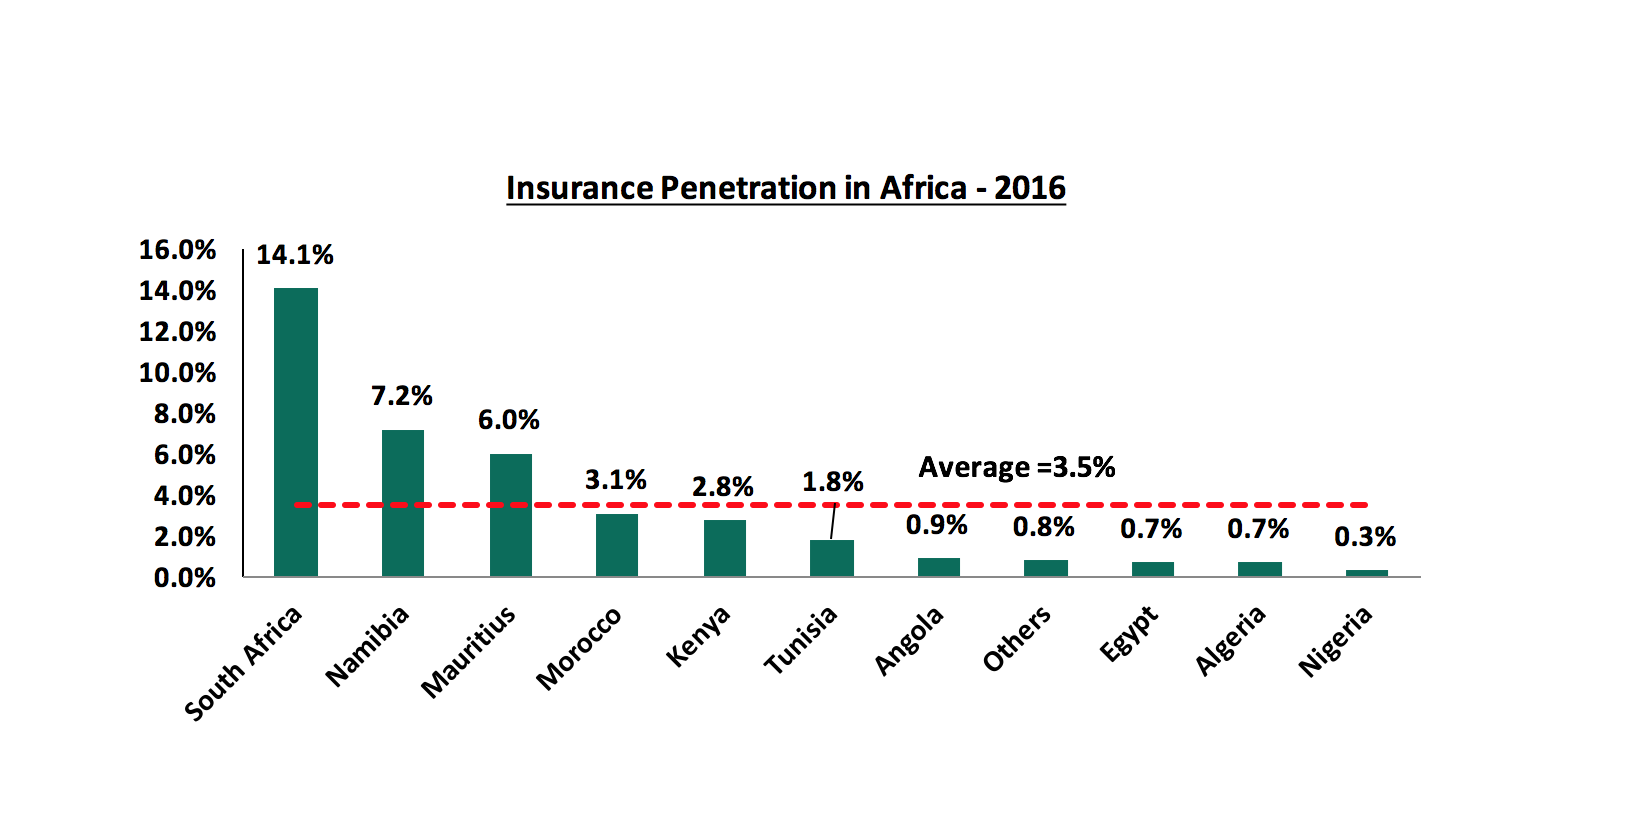
- Financial penetration remains low in Sub-Saharan Africa, with less than a quarter of the population having access to a formal bank account, hence limiting the degree to which private individuals can access financial services, while the average insurance penetration rate in Africa is very low, at 3.5%. Low inclusion presents ample runway for growth, given the backdrop of increased macroeconomic stability, positive consumer oriented reforms and financial sector deepening largely through telephone based systems.
- Increased adoption of technology to improve on efficiency. In a bid to minimize costs, banks and insurance companies have embraced technology to reduce operational costs and hence drive up efficiency. Some of these measures include integration with mobile application platforms and internet-banking to facilitate increased collection of deposits and premiums, and disbursement of loans with lower operating costs.
- Select stocks in the financial services sector provide attractive entry points at low valuations, and potential high returns for investors, with the banking stocks under coverage in Kenya, Nigeria and Ghana currently trading at P/B valuations of 1.4x, 0.7x and 1.9x, compared to 10-year historical averages of 2.0x, 1.0x and 2.3x, respectively
Sub-Saharan African countries have made substantial progress in financial development. The development of mobile telephone-based systems has helped to incorporate a large share of the population into the financial system, especially in East Africa. Nonetheless, there is a large untapped potential in this area in other countries, and this can compensate for some of the infrastructure and other shortcomings that most countries face. In addition to these factors supporting growth, a number of policies, if implemented, can also lead to acceleration in financial development in the region, which include:
- Providing strong legal and institutional frameworks and promoting sound corporate governance: Strengthening legal and institutional frameworks, including protecting the interests of minority shareholders and fostering contract enforcement and judicial independence, is critical for creating an environment in which the financial sector can develop and strive, and
- Strengthening supervision, including cross border oversight: Providing a region wide supervisory body with enforcement power should be at the fore of the agenda in continental unions like the African Union’s economic development program, New Partnership for Africa’s Development, NEPAD, so as to fast track harmonization of regulations and supervisory procedures, especially among Pan-African banks and financial institutions.
Moving to the companies selected for coverage, we segmented the financial services firms into banks and insurance companies in order to rank like for like. The overall ranking was based on a weighted average ranking of Franchise value (accounting for 40%) and Intrinsic value (accounting for 60%). As per our analysis on the banking sector, from a franchise value and from a future growth opportunity perspective, below is the comprehensive ranking of the listed SSA banks in our coverage:
|
CYTONN SUB-SAHARAN AFRICA FINANCIAL SERVICES REPORT – BANK COMPOSITE RANKINGS |
||||||
|
Bank |
Country |
Market Cap (USD mn) |
Franchise Value Total Score |
Total Return Score |
Weighted Score |
H1‘2017 Rank* |
|
KCB Group |
Kenya |
1,232.3 |
126 |
6 |
54.0 |
1 |
|
Zenith Bank Plc |
Nigeria |
2,136.2 |
119 |
11 |
54.2 |
2 |
|
Societe Generale |
Ghana |
70.4 |
134 |
8 |
58.4 |
3 |
|
NIC Bank |
Kenya |
224.6 |
143 |
3 |
59.0 |
4 |
|
DFCU Uganda |
Uganda |
94.2 |
148 |
1 |
59.8 |
5 |
|
Co-operative Bank |
Kenya |
911.6 |
127 |
19 |
62.2 |
6 |
|
Guaranty Trust Bank |
Nigeria |
3,569.9 |
113 |
29 |
62.6 |
7 |
|
Standard Chartered |
Ghana |
563.1 |
123 |
24 |
63.6 |
8 |
|
CAL Bank |
Ghana |
131.8 |
135 |
17 |
64.2 |
9 |
|
I&M Holdings |
Kenya |
480.2 |
142 |
13 |
64.6 |
10 |
|
Bank of Baroda |
Uganda |
76.6 |
150 |
12 |
67.2 |
11 |
|
Equity Group |
Kenya |
1,488.6 |
138 |
22 |
68.4 |
12 |
|
Access Bank |
Nigeria |
791.5 |
142 |
21 |
69.4 |
13 |
|
UBA Bank |
Nigeria |
982.5 |
141 |
26 |
72.0 |
14 |
|
Bank of Kigali |
Rwanda |
226.9 |
151 |
20 |
72.4 |
15 |
|
Barclays Bank |
Kenya |
517.9 |
168 |
9 |
72.6 |
16 |
|
GCB |
Ghana |
256.6 |
180 |
2 |
73.2 |
17 |
|
Access Bank |
Ghana |
101.6 |
174 |
7 |
73.8 |
18 |
|
Union Bank Plc |
Nigeria |
293.8 |
186 |
4 |
76.8 |
19 |
|
Stanbic Bank |
Uganda |
388.7 |
174 |
16 |
79.2 |
20 |
|
Ecobank |
Ghana |
502.0 |
191 |
5 |
79.4 |
21 |
|
MCB Group |
Mauritius |
1,460 |
176 |
15 |
79.4 |
22 |
|
CRDB |
Tanzania |
174.6 |
190 |
10 |
82.0 |
23 |
|
DTBK |
Kenya |
482.1 |
184 |
14 |
82.0 |
24 |
|
Stanbic IBTC Holdings |
Nigeria |
1,201.7 |
166 |
30 |
84.4 |
25 |
|
Stanbic Holdings |
Kenya |
306.2 |
177 |
23 |
84.6 |
26 |
|
NMB Bank |
Tanzania |
614.9 |
180 |
25 |
87.0 |
27 |
|
Standard Chartered |
Zambia |
126.6 |
165 |
36 |
87.6 |
28 |
|
HF Group |
Kenya |
41.6 |
195 |
18 |
88.8 |
29 |
|
SBM Holdings |
Mauritius |
565.3 |
191 |
28 |
93.2 |
30 |
|
Standard Chartered |
Kenya |
724.9 |
196 |
27 |
94.6 |
31 |
|
Ecobank Transnational |
Nigeria |
1,155.7 |
197 |
33 |
98.6 |
32 |
|
FNB Namibia |
Namibia |
940.6 |
205 |
31 |
100.6 |
33 |
|
FBN Holdings |
Nigeria |
698.7 |
205 |
32 |
101.2 |
34 |
|
ZNCB |
Zambia |
42.3 |
213 |
34 |
105.6 |
35 |
|
National Bank |
Kenya |
33.0 |
249 |
35 |
120.6 |
36 |
*- The ranking is based on H1’2017 results
As per our analysis on the insurance sector from a franchise value and from a future growth opportunity perspective, below is the comprehensive ranking of the listed SSA insurance companies in our coverage:
|
CYTONN SUB-SAHARAN AFRICA FINANCIAL SERVICES REPORT –INSURANCE COMPOSITE RANKINGS |
||||||
|
Insurance Company |
Country |
Market Cap (USD mn) |
Franchise Value Total Score |
Total Return Score |
Weighted Score |
H1‘2017 Rank* |
|
Botswana Holdings |
Botswana |
512.2 |
37 |
2 |
22.4 |
1 |
|
Kenya Re |
Kenya |
134.8 |
43 |
4 |
23.8 |
2 |
|
Custodial and Allied |
Nigeria |
62.2 |
52 |
3 |
28.0 |
3 |
|
Mauritius Union |
Mauritius |
80.5 |
47 |
9 |
30.6 |
4 |
|
Mauritian Eagle |
Mauritius |
22.1 |
62 |
1 |
31.6 |
5 |
|
Enterprise Group |
Ghana |
119.2 |
47 |
13 |
32.4 |
6 |
|
Jubilee Holdings |
Kenya |
315.1 |
59 |
6 |
33.6 |
7 |
|
Britam Holdings |
Kenya |
354.3 |
69 |
7 |
39.4 |
8 |
|
Liberty Holdings |
Kenya |
64.8 |
75 |
5 |
39.6 |
9 |
|
Continental Re |
Nigeria |
40.4 |
74 |
12 |
45.0 |
10 |
|
CIC Group |
Kenya |
114.1 |
77 |
11 |
37.4 |
11 |
|
AXA Mansard |
Nigeria |
60.7 |
86 |
10 |
40.4 |
12 |
|
Sanlam Kenya |
Kenya |
37.6 |
92 |
8 |
41.6 |
13 |
*- The ranking is based on H1’2017 results
Comparing the rankings of both the banks and insurance companies, we find that the list of top companies is dominated by Kenyan banks and insurance companies, along with Ghanaian banks and Mauritius and Nigerian insurance companies. This is due to Kenya’s growing financial intermediation and deep penetration of financial services penetration as compared to the rest of Sub-Saharan Africa.
This does not however mean that Kenyan investors should not seek to diversify their investments by investing regionally if they find an attractive investment opportunity. In terms of risk, local investors still have to take a number of factors into consideration when investing globally, these include:
- Currency risk: When investing in a foreign country, investors have to convert their currency into the local currency of that country, and convert back once their investment matures. The uncertainty of the value the future exchange rate most investors
- Political and Economic risk: This is the risk associated with a country’s political environment, governance and ability to meet country obligations.
- Transaction charges and tax implications for their investments: Transaction charges on investments is higher in some countries, while tax regulations also may differ from country to country. This all has affects the overall return an investor finally gets, so should be taken into consideration while investing
- Capital controls: These are measures including outright prohibitions, transaction taxes and other limits that a nation’s government may use to regulate flows from capital markets, thus affecting the direct flow of investments into a country and repatriation of profits out. Countries with capital controls make it harder for would be foreign-investors to invest, and harder to actualize the return from their investments.
For Sub-Saharan Africa, the outlook on the sector is positive, as:
- Technology and innovation capabilities are set to be key anchors of growth for Sub-Saharan Africa in the coming years and thus the adoption of mobile and online modes of product distribution, should drive financial penetration,
- We expect the synergy between banks and insurance companies to offer Bancassurance to continue as well as the integration of mobile money payments to allow for policy payments and mobilization of deposits,
- We also expect that there will be increased regulation in the Financial Services sector, as well as increased consolidation in the banking sector. These efforts will improve efficiency for banks and insurance firms and uptake of insurance products to enhance the sustainability of profitability.
For more details on the ranking, see our Sub Saharan Africa H1’2017 Financial Services Report.
The SSA financial services sector continues to undergo transition, mainly on the regulation front, which is critical for stability and sustainability of a conducive business environment. With, (i) a growing population that is embracing mobile phones for financial penetration, (ii) the increased usage of technology by Financial Services firms to drive alternative channel distribution of products and enhance efficiency, and (iii) the attractive valuations, which provide an attractive entry point for long-term investors, we are positive for investors in Sub Saharan African Financial Services Sector with a long term investment horizon.

- Talk to us
- Kenya
- P.O Box 20695 - 00200, Nairobi, Kenya
- Cell +254709101200
- Tel +254709101200
- WhatsApp +254741676635
- United States
- +254709101200
- DOWNLOAD OUR APP
-


- Kenya
- 8th Floor, Pinetree Plaza, Kaburu Drive, Ngong Road, Nairobi, Kenya
- USA
- Suite 1150, 1775 Eye Street NW, USA, Washington DC 20006, USA
- Investments
- High Yield
- Private Equity
- Real Estate
- Real Estate
- RiverRun Estates
- Cytonn Towers
- The Ridge
- Taraji Heights
- The Alma