Jan 6, 2019
According to the World Bank, Sub-Saharan Africa economic growth remained relatively strong in 2018 with preliminary data indicating that the region recorded a 2.7% GDP growth in 2018, a rise from 2.3% recorded in 2017. In East Africa, a rebound in growth was recorded in Rwanda, Uganda and Kenya, which grew by 7.7%, 6.8% and 6.0%, respectively, as at Q3’2018 driven by improved agricultural performance attributed to improved weather conditions. A slowdown was however recorded in Tanzania mainly underpinned by an unfavorable investment climate following President John Magufuli’s stringent policy changes. In Western Africa, several countries recorded growths of 6.0% and above which include Benin, Burkina Faso, Cote d’Ivoire, and Senegal. There was however subdued growth in other countries in the region such as Nigeria which recorded a growth of 1.5% in Q2’2018 compared to the economic growth rebound of 1.95% and 2.1% recorded in Q1’2018 and Q4’2017, respectively with the subdued growth being attributed to a decline in oil production, which was due to pipeline closures during the period. In the Southern Africa region, growth was subdued in South Africa and Angola, which are the two major economies in the region. Growth in Angola, the region’s second largest oil exporter was dampened by reduced oil output following the maturity of key oil fields. Subdued growth in South Africa was mainly driven by weakness in agriculture, mining, and construction which dragged the economy into a technical recession due to negative growth recorded in two subsequent quarters in Q1’2018 and Q2’2018 at -2.6% and -0.4%, respectively.
Currency Performance
Regional currencies registered a depreciating trend in 2018 with the major decliner being the Zambian Kwacha, which registered a 19.0% depreciation, attributed to negative investor sentiments on the country’s debt sustainability, following the country’s ballooning debt levels, projected to have hit 69.0% of GDP as at the end of 2018. The underperformances of the region’s currencies was also underpinned by:
- Capital outflows from emerging markets to advanced markets following tightening of monetary policy, which saw the Federal Reserve raise the benchmark interest rate 4 times during the year to close the year at a range of 2.25% - 2.5% in its final meeting in December, and,
- The strengthening dollar, coupled with events in the global markets, which included the trade war between China and the USA that put pressure on emerging market currencies.
Below is a table showing the performance of select African currencies, ranked by 2018 y/y change.
|
Select Sub Saharan Africa Currency Performance vs USD |
|||||
|
Currency |
Dec-16 |
Dec-17 |
Dec-18 |
2017 y/y change (%) |
2018 y/y change (%) |
|
Kenyan Shilling |
102.5 |
103.2 |
101.8 |
(0.7%) |
1.4% |
|
Nigerian Naira |
315.3 |
360.0 |
362.6 |
(14.2%) |
(0.7%) |
|
Malawian Kwacha |
727.5 |
725.5 |
736.8 |
0.3% |
(1.6%) |
|
Ugandan Shilling |
3596.5 |
3643.3 |
3708.5 |
(1.3%) |
(1.8%) |
|
Mauritius Rupee |
36.0 |
33.6 |
34.3 |
6.7% |
(2.2%) |
|
Tanzanian Shilling |
2181.0 |
2234.6 |
2298.7 |
(2.5%) |
(2.9%) |
|
Ghanaian Cedi |
4.2 |
4.5 |
4.9 |
(6.8%) |
(8.6%) |
|
Botswana Pula |
10.7 |
9.8 |
10.7 |
8.1% |
(9.0%) |
|
South African Rand |
13.7 |
12.4 |
14.3 |
9.9% |
(15.9%) |
|
Zambian Kwacha |
9.9 |
10.0 |
11.9 |
(0.4%) |
(19.0%) |
Of the currencies covered, the Kenya Shilling was the only currency which appreciated against the dollar in 2018.
African Eurobonds:
Yields on African Eurobonds rose in 2018 partly attributed to the aggressive tightening monetary policy regime adopted by the U.S Federal reserve, coupled with the China-U.S trade tensions, which dampened investor sentiment in emerging markets. Domestic country risks also exacerbated the rise in yields. As a result, most foreign investors began pulling out their capital in the wake of rising US treasury yields and a strong dollar, thereby increasing the risk profile of most emerging market economies.
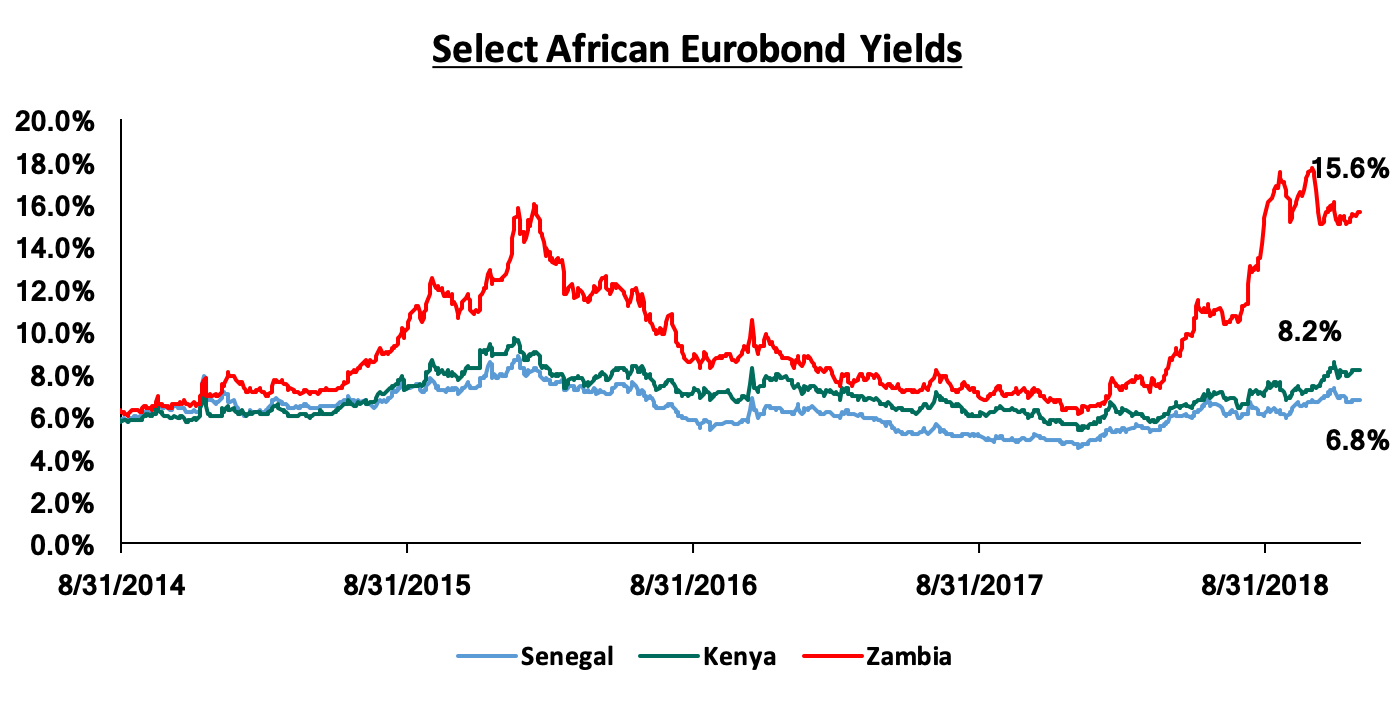
Appetite for government securities in Sub Saharan Africa remained strong in 2018, as risk-adjusted returns remained higher compared to those in developed economies. Eurobonds issued during the year included:
- Ghana, which issued a dual-tranche Eurobond in May 2018, raising a total of USD 2.0 bn in 10-year and 30-year instruments of USD 1.0 bn each. The issue, which was to raise funds for budgetary purposes and liability management, was 4.0x oversubscribed with USD 8.0 bn in bids received,
- Nigeria, which issued a triple-tranche debt note of USD 1.2 bn with a 7-year tenor, USD 1.0 bn with a 12-year tenor and USD 0.8 bn with a 30-year tenor in November 2018, with total bids received amounting to USD 9.5 bn translating to a 3.3x oversubscription.
- Senegal, which issued two bonds of USD 1.0 bn each, which were 8.0x oversubscribed with USD 9.3 bn in bids received. The stated plan was for new infrastructure development as well as refinancing some USD 150.0 mn of foreign debt, due in 2021, and,
- Kenya, which issued a USD 1.0 bn, 10-year tenor bond and another 30-year tenor bond of a similar amount; earmarked for infrastructural development and active debt management. The issue raised USD 14.0 bn from investors, thus an oversubscription by 7.0x.
Equities Market Performance
Most of the Sub-Saharan African (SSA) stock markets recorded negative returns in 2018, erasing the gains made in Q1’2018. The region experienced capital outflows as profit-taking investors exited the markets to realize the gains made in various sectors as at Q1’2018, such as oil and gas that had been boosted by a global rally in crude oil prices, and the financial services sector. The price correction due to the capital outflows coupled with the depreciating currencies resulted in most exchanges registering a decline in performance. Below is a summary of the performance of key exchanges:
|
Equities Market Performance (Dollarized*) & Price to Earnings (P/E) |
||||||
|
Country |
Current Price to Earnings (P/E) |
Dec-16 |
Dec-17 |
Dec-18 |
2017 y/y change (%) |
2018 y/y change (%) |
|
Malawi |
- |
18.3 |
29.8 |
39.8 |
62.5% |
33.6% |
|
Rwanda |
- |
0.2 |
0.2 |
0.1 |
1.0% |
(5.5%) |
|
Ghana |
- |
395.6 |
569.7 |
510.8 |
44.0% |
(10.3%) |
|
Kenya |
10.8x |
1.3 |
1.7 |
1.4 |
27.5% |
(16.9%) |
|
Zambia |
12.1x |
421.7 |
532.1 |
441.1 |
26.2% |
(17.1%) |
|
Tanzania |
11.8x |
1.0 |
1.1 |
0.9 |
6.6% |
(17.1%) |
|
Nigeria |
7.9x |
85.3 |
106.2 |
86.5 |
24.5% |
(18.6%) |
|
Uganda |
- |
0.4 |
0.6 |
0.4 |
35.0% |
(20.9%) |
|
South Africa |
14.5x |
3688.1 |
4802.6 |
3667.1 |
30.2% |
(23.6%) |
|
BRVM |
8.0x |
0.5 |
0.4 |
0.3 |
(4.2%) |
(32.5%) |
|
*The index values are dollarized for ease of comparison |
||||||
The Sub-Saharan Africa region is expected to perform well supported by increased public spending on infrastructural development owing to the high demand for basic needs. Key risks remain difficult business conditions and poor infrastructure, reliance on commodity exports, political tension in some countries and debt sustainability due to high levels of public debt in most economies in the region. Stock markets valuations remain attractive for long-term investors. The improved regional economic growth prospects remain key towards enhancing investor sentiment and attracting investment inflows into the region.

- Talk to us
- Kenya
- P.O Box 20695 - 00200, Nairobi, Kenya
- Cell +254709101200
- Tel +254709101200
- WhatsApp +254741676635
- United States
- +254709101200
- DOWNLOAD OUR APP
-


- Kenya
- 8th Floor, Pinetree Plaza, Kaburu Drive, Ngong Road, Nairobi, Kenya
- USA
- Suite 1150, 1775 Eye Street NW, USA, Washington DC 20006, USA
- Investments
- High Yield
- Private Equity
- Real Estate
- Real Estate
- RiverRun Estates
- Cytonn Towers
- The Ridge
- Taraji Heights
- The Alma