Apr 6, 2025
Sub-Saharan Africa Region Review
According to the World Bank, the Sub-Saharan economy is projected to grow at a moderate rate of 4.1% in 2025, which is 0.9% higher than the 3.2% growth estimate recorded in 2024. The expected recovery is primarily driven by private consumption growth as declining inflation boosts the purchasing power of household incomes. Nevertheless, the risk of debt distress remains high with more than half of countries facing unsustainable debt burdens. The public debt is expected to remain high due to increased debt servicing costs as a result of continued currency depreciation and high interest rates in developed economies. Additionally, many countries are providing subsidies in order to mitigate inflationary pressures, which could worsen public finance, increase public debt, and weigh down on debt sustainability.
Currency Performance:
In Q1’2025, most of the select Sub-Saharan currencies depreciated against the US Dollar, primarily due to elevated inflationary pressures in the region, high debt servicing costs that continued to deplete foreign exchange reserves, and monetary policy tightening by advanced economies. High interest rates in developed countries resulted in significant capital outflows as investors, both institutional and individual, sought higher returns offered in these economies. Additionally, the rising inflation across most Sub-Saharan economies exerted pressure on local currencies due to the increasing cost of imports. However, the Mauritius Rupee emerged as the best performer among the selected currencies, appreciating by 4.2% against the USD on a year-to-date basis, closing Q1'2025 at MUR 45.7, from MUR 47.7 at the beginning of the year. Below is a table showing the performance of select African currencies against the US Dollar:
|
Cytonn Report: Select Sub-Saharan Africa Currency Performance vs USD |
|||||
|
Currency |
Mar-24 |
Jan-25 |
Mar-25 |
Last 12 months |
YTD change (%) |
|
Mauritius Rupee |
46.3 |
47.7 |
45.7 |
1.3% |
4.2% |
|
South African Rand |
19.0 |
18.8 |
18.3 |
3.7% |
2.5% |
|
Botswana Pula |
13.7 |
14.0 |
13.7 |
0.1% |
2.1% |
|
Ugandan Shilling |
3,885.9 |
3,697.6 |
3,662.6 |
5.7% |
0.9% |
|
Nigerian Naira |
1,418.6 |
1,540.7 |
1,538.3 |
(8.4%) |
0.2% |
|
Malawian kwacha |
1,742.0 |
1,750.3 |
1,750.2 |
(0.5%) |
0.0% |
|
Kenyan Shilling |
131.8 |
129.3 |
129.3 |
1.9% |
(0.0%) |
|
Zambian Kwacha |
24.8 |
27.9 |
28.2 |
(13.8%) |
(1.1%) |
|
Ghanaian Cedi |
13.2 |
14.7 |
15.5 |
(17.7%) |
(5.6%) |
|
Tanzanian Shilling |
2,557.5 |
2,374.7 |
2,650.0 |
(3.6%) |
(11.6%) |
Source: Yahoo Finance
The chart below shows the year-to-date performance of different sub-Saharan African countries in Q1’2025;
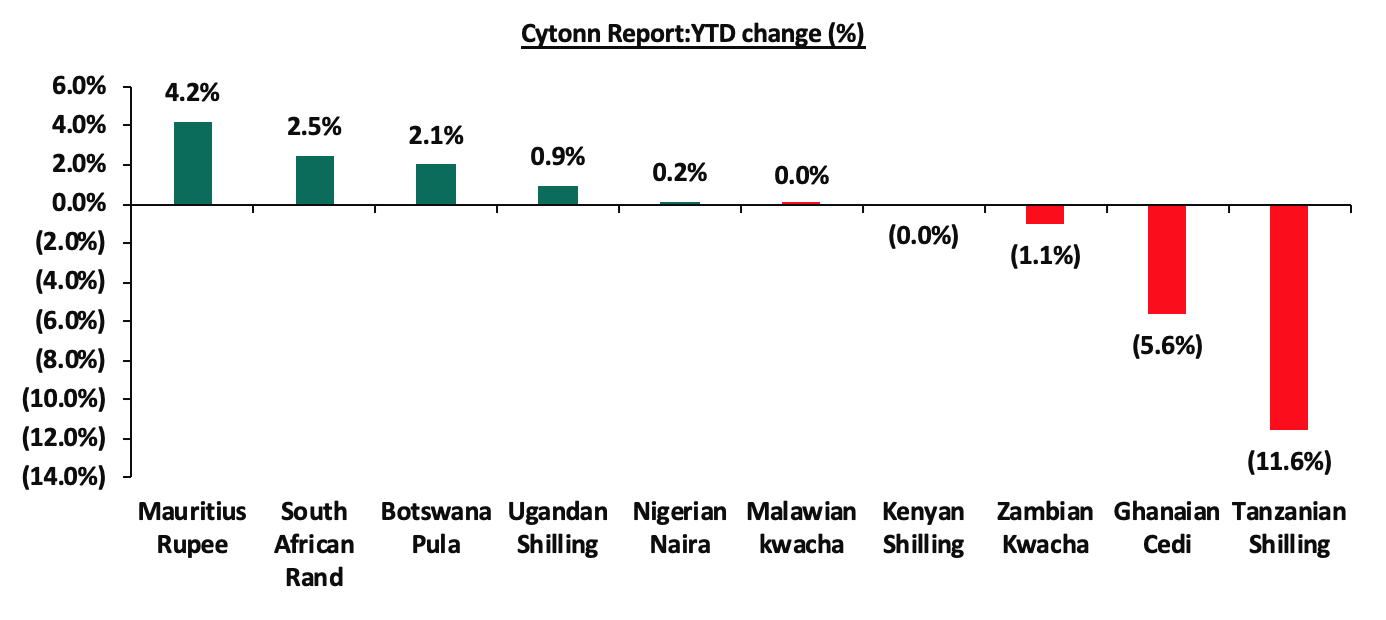
Source: Yahoo Finance
Key take outs from the above table and chart include:
- The Mauritius Rupee was the largest gainer against the USD Dollar, gaining by 4.2% year to date to close at MUR 45.7 as at the end of March from the MUR 47.7 recorded at the beginning of the year. The Rupee's strength has been supported by several factors, including the county’s effort to contain excess volatility of the rupee by market selling USD 120.0 mn in order to intervene the domestic foreign exchange, coupled with the US Federal Reserve's decision to cut its benchmark interest rate by 25 basis points to a range of 4.25%-4.50% has also contributed to a favorable environment for the South African Rand, and,
- The Tanzanian Shilling was the worst performing currency in Q1’2025, depreciating by 11.6%, mainly as a result of rising imports and increased public debt linked to major infrastructure projects.
African Eurobonds:
Africa’s appetite for foreign-denominated debt has increased in recent times with the latest issuers during the three months to end of Q1’2025 being Ivory Coast and Benin raising a total of USD 0.7 bn and USD 0.5 bn respectively. Additionally, 2024 issuers were Ivory Coast, Benin, Kenya, Senegal and Cameroon raising a total of USD 2.6 bn, USD 0.8 bn, USD 1.5 bn, USD 0.8 bn and USD 0.6 bn respectively. Notably, all the bonds were oversubscribed with the high support being driven by the yield hungry investors and also the outlook of positive recovery in the regional economies. It is good to note that there was a general decline in the yields of the various bonds from different countries due to general improvement in investor sentiment as the economy recovers and the easing inflationary pressures in the region. The yields of the Ivory Coasts’ 10-year Eurobond maturing in 2033 increased marginally by 0.3% points to 8.4% as at the end of March 2025 from 7.8% recorded in March 2024. Similarly, the Yields of the Kenya’s 10-year Eurobond maturing in 2028 decreased by 0.1% points to 8.7% as at the end of March 2025 from 8.8% in March 2024, partly attributable to improved investor confidence following the successful buy-back of the 2027 Eurobond maturity, increased IMF Credit funding and the stabilizing of the Kenyan shilling against the dollar. Below is a graph showing the Eurobond secondary market performance of select Eurobonds issued by the respective countries:
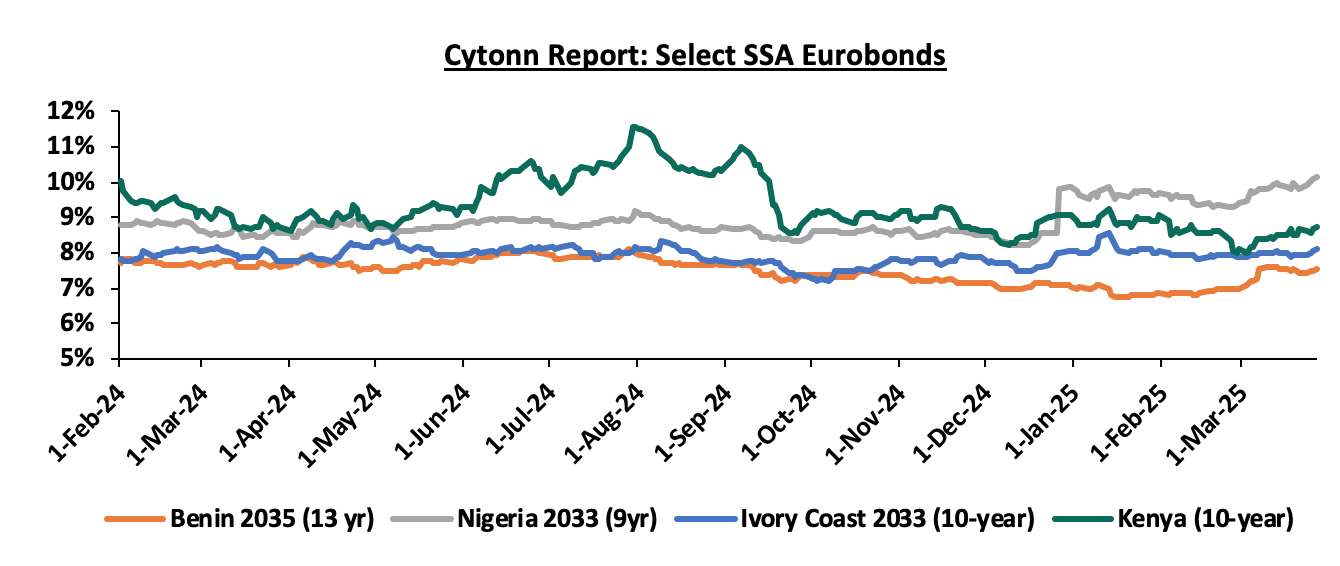
Source: Bloomberg, CBK
Equities Market Performance:
Sub-Saharan Africa (SSA) stock markets recorded mixed performance in Q1’2025, with Ghana’s stock market (GSECI) being the best performing market gaining by 20.6% YTD attributable to gains in the large-cap stocks such as Access Bank, MTN Ghana and Standard Chartered Bank gaining by 74.4%,27.6% and 13.0%, following improved earnings during the period, additionally supported by easing inflation. Rwanda’s RAEASI was the worst performing stock market, declining by 1.3% YTD, mainly attributable to losses recorded by large-cap stocks such as KCB Rwanda and MTN Rwanda of 1.6% and 15.4% respectively. Below is a summary of the performance of key indices:
|
Cytonn Report: Equities Market Performance Q1'2025(Dollarized*) |
||||||
|
Country |
Index |
Mar-24 |
Jan-25 |
Mar-25 |
Last 12 months |
YTD Change |
|
Ghana |
GSECI |
261.8 |
333.8 |
402.5 |
53.7% |
20.6% |
|
Uganda |
USEASI |
0.3 |
0.3 |
0.4 |
29.1% |
13.1% |
|
South Africa |
JALSH |
3,891.5 |
4,502.1 |
4,924.7 |
26.6% |
9.4% |
|
Kenya |
NASI |
0.9 |
1.0 |
1.0 |
17.9% |
5.9% |
|
Zambia |
LASILZ |
524.8 |
578.8 |
608.9 |
16.0% |
5.2% |
|
Nigeria |
NGEASI |
73.9 |
67.5 |
68.8 |
(6.8%) |
2.0% |
|
Tanzania |
DARSDEI |
0.7 |
0.9 |
0.9 |
23.4% |
(0.8%) |
|
Rwanda |
RSEASI |
0.1 |
0.1 |
0.1 |
(4.7%) |
(1.3%) |
|
*The index values are dollarized for ease of comparison |
||||||
Source: Cytonn Research, Kwayisi, Yahoo Finance
The chart below shows the YTD Performance of the sub-Saharan Equities Market;
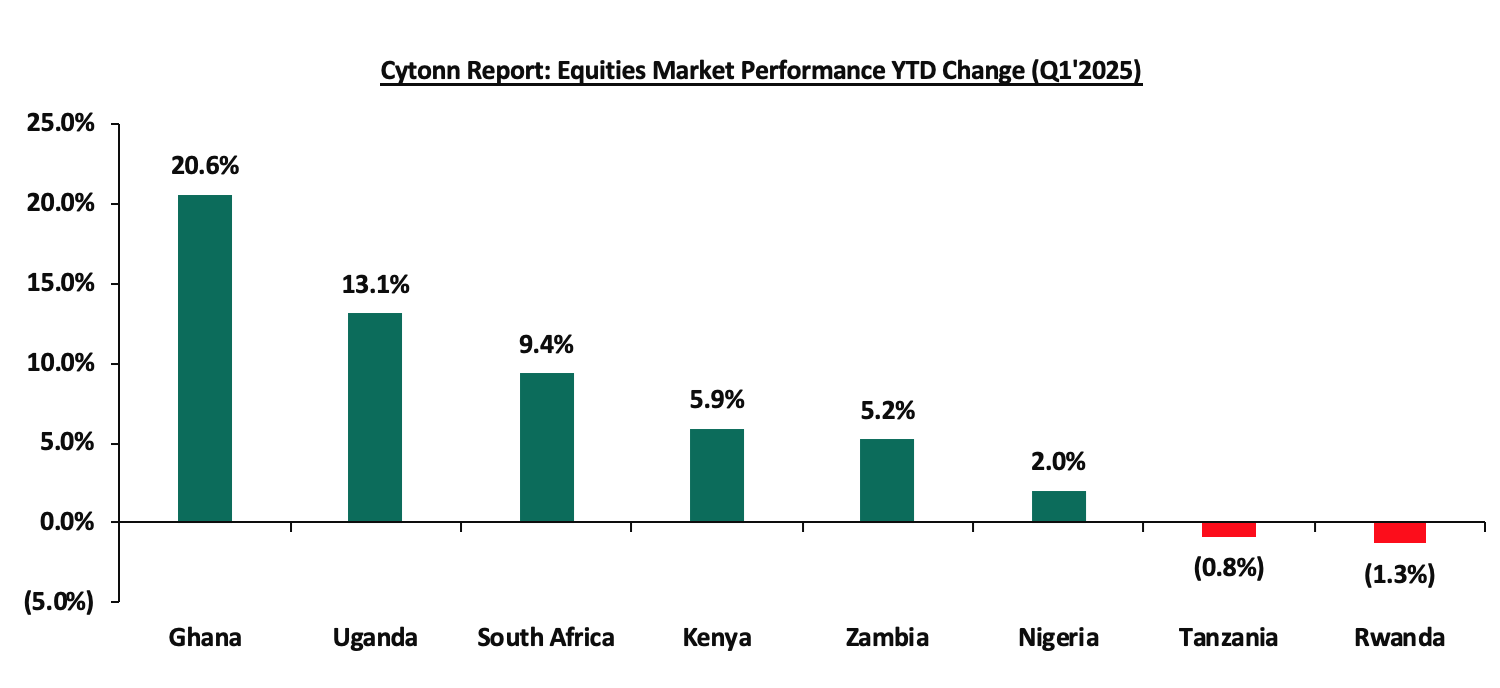
Dollarized performance
GDP growth in the Sub-Saharan Africa region is expected to slow down, in line with the rest of the global economy. Additionally, public debt continues to be a major headwind, with high debt levels experienced in the region on the back of continued weakening of local currencies, which will make debt servicing costlier, making the region less attractive to foreign capital.

- Talk to us
- Kenya
- P.O Box 20695 - 00200, Nairobi, Kenya
- Cell +254709101200
- Tel +254709101200
- WhatsApp +254741676635
- United States
- +254709101200
- DOWNLOAD OUR APP
-


- Kenya
- 8th Floor, Pinetree Plaza, Kaburu Drive, Ngong Road, Nairobi, Kenya
- USA
- Suite 1150, 1775 Eye Street NW, USA, Washington DC 20006, USA
- Investments
- High Yield
- Private Equity
- Real Estate
- Real Estate
- RiverRun Estates
- Cytonn Towers
- The Ridge
- Taraji Heights
- The Alma