Sep 22, 2019
Unit Trust Funds, “UTFs”, are collective investment schemes that pool money together from many investors and are managed by professional Fund Managers, who invest the pooled funds in a portfolio of securities to achieve objectives of the trust. Following the release of Unit Trust Fund Managers’ results for H1'2019, we examine the performance of Unit Trust Funds, as they are among the most popular investment options in the Kenyan market. Further, we narrow down to analyze the performance of Money Market Funds, a product under Unit Trust Funds, currently the most popular in terms of Assets Under Management, with 85.2% of the UTF market. In our previous focus on Unit Trust Funds, we looked at the FY’2018 Performance by Unit Trust Fund Managers. In this week’s focus, we continue our analysis on the H1’2019 performance by Unit Trust Fund Managers, and we shall analyze the following:
- Performance of the Unit Trust Funds Industry,
- Performance of Money Market Funds, and,
- Conclusion
Section I: Performance of the Unit Trust Funds Industry
As defined above, Unit Trust Funds are essentially investment schemes that pool money from investors, which are managed by a professional Fund Manager who invests the pooled funds in a portfolio of securities to achieve objectives of the trust. The funds in the unit trust earn returns in the form of dividends, interest income and/or capital gains depending on the asset class the funds are invested in. The main types of Unit Trust Funds include;
- Money Market Fund – This fund mainly invests in short-term debt securities with high credit quality such as bank deposits, treasury bills, and commercial paper. An example is the Cytonn Money Market Fund (CMMF);
- Equity Fund – This fund aims to offer superior returns over the medium to longer-term by maximizing capital gains and dividend income through investing in listed equity securities;
- Fixed Income Fund – This fund invests in interest-bearing securities, which include treasury bills, treasury bonds, preference shares, corporate bonds, loan stock, approved securities, notes and liquid assets consistent with the portfolio’s investment objective; and;
- Balanced Fund – This fund invests in a diversified spread of equities and fixed income securities with the objective to offer investors a reasonable level of current income and long-term capital growth.
In line with Capital Market Regulations (2002) Part IV (32), Unit Trust Funds Managers released their H1’2019 results, which showed that the overall Assets Under Management (AUM) of the industry grew at an annualized rate of 17.3% to Kshs 66.3 bn in H1’2019, from Kshs 61.0 bn as at FY’2018. In the last two-years, Assets Under Management of the Unit Trust Funds have grown at a CAGR of 6.1%. This growth can be largely attributable to:
- Affordability to Retail Investors: Unit Trust Funds are accessible to retail investors, with several Collective Investment Schemes’ (CIS) initial investment contributions and additional investments being affordable; majority of unit trusts requiring an initial investment ranging between Kshs 1,000.0 - Kshs 10,000.0, and additional monthly investments ranging between Kshs 1,000.0 and Kshs 5,000.0,
- Diversification: Unit Trust Funds are also advantageous in terms of diversification as investors can access a wider range of instruments, than if they invested on their own, and,
- Liquidity: Compared to other investment options such as equities, unit trusts are liquid, as it is easy to sell and buy units without depending on supply and demand at the time of investment or exit.
According to the Capital Markets Authority, there are 25 approved collective investment schemes made up of 88 funds in Kenya as of Q2’2019. The table below outlines the performance of Fund Managers of Unit Trust Funds in terms of Assets Under Management:
|
No. |
Fund Managers |
FY'2018 AUM (Kshs Mns) |
H1'2019 AUM (Kshs Mns) |
AUM H1'2019 Annualized Growth |
|
1 |
CIC Asset Management |
20,270.8 |
24,048.1 |
37.3% |
|
2 |
British American Asset Managers |
8,841.6 |
8,857.1 |
0.4% |
|
3 |
ICEA Lion |
6,951.9 |
7,566.7 |
17.7% |
|
4 |
Old Mutual |
6,578.8 |
6,403.3 |
(5.3%) |
|
5 |
Commercial Bank of Africa |
5,189.7 |
6,328.2 |
43.9% |
|
6 |
African Alliance Kenya |
2,160.2 |
2,237.3 |
7.1% |
|
7 |
Stanlib Kenya |
2,141.0 |
1,983.3 |
(14.7%) |
|
8 |
Sanlam Investments |
1,751.0 |
1,673.6 |
(8.8%) |
|
9 |
Madison Asset Managers |
1,225.4 |
1,463.0 |
38.8% |
|
10 |
Dry Associates |
1,014.5 |
1,452.8 |
86.4% |
|
11 |
Zimele Asset Managers |
874.6 |
1,009.7 |
30.9% |
|
12 |
Nabo Capital (Centum) |
880.8 |
927.1 |
10.5% |
|
13 |
Amana Capital |
787.0 |
642.1 |
(36.8%) |
|
14 |
Equity Investment Bank |
690.7 |
512.7 |
(51.5%) |
|
15 |
Genghis Capital |
468.5 |
472.0 |
1.5% |
|
16 |
Cytonn Asset Managers |
62.8 |
302.6 |
764.2% |
|
17 |
Apollo Asset Managers |
276.0 |
283.9 |
5.7% |
|
18 |
Alpha Africa Asset Managers |
0.0 |
154.3 |
- |
|
19 |
Co-op Trust Investment Services Limited |
0.0 |
12.3 |
- |
|
|
Total |
61,038.8 |
66,330.1 |
|
From the above table, we note the following observations:
- Market Share: CIC Asset Managers remains the largest overall Unit Trust Fund Manager with an AUM of Kshs 24.0 bn in H1’2019, from an AUM of Kshs 20.3 bn as at FY’2018, occupying a market share of 36.3%.
- Growth: In terms of growth, however, Cytonn Asset Managers recorded the strongest annualized growth of 764.2%.
Among unit trust products, Money Market Funds continue to be the most popular product in terms of market share, with 85.2% of the market as shown in the table below;
(all values in Kshs Mns unless stated otherwise)
|
Assets Under Management by Type of Collective Investment Scheme |
|||||
|
No. |
Product |
FY'2018 AUM |
H1'2019 AUM |
FY'2018 Market Share |
H1'2019 Market Share |
|
1 |
Money Market Funds |
50,642.3 |
56,521.5 |
83.0% |
85.2% |
|
2 |
Equity Fund |
4,624.4 |
4,523.0 |
7.6% |
6.8% |
|
3 |
Balanced Fund |
1,771.6 |
2,003.7 |
2.9% |
3.0% |
|
4 |
Others |
4,000.4 |
3,281.9 |
6.6% |
4.9% |
|
Total |
61,038.8 |
66,330.1 |
100.0% |
100.0% |
|
During the period under review, Equity Funds recorded a decline in Asset Under Management, and thus market share, on account of poor performance in the equities markets and high stock volatility in 2018. With the stock market as measured by the index NASI declining by 18.0% in 2018, a number of local individual and institutional investors would have experienced losses on their portfolios, which may not go well with their risk appetites and would likely have led to the decline in Equity Funds AUM in H1’2019 as investors pulled funds out. While Equity Funds have the potential to outperform stock market indices and deliver better yields than Money Market Funds over the medium to long-term, preservation of capital in Money Market Funds might be the main contributory factor for its popularity in Kenya. Balanced Funds, on the other hand, rank third in comparison to other products. Balanced Funds offer investors a reasonable level of current income and long-term capital growth, achieved by investing in a diversified spread of equities and fixed income securities. Having a medium risk profile, Balanced Funds carry a high potential for growth in the near future as they are suitable for pension schemes, treasury portfolios of institutional clients, co-operatives and high-net-worth individuals amongst others. The Other Funds include Income Funds, Growth Funds, Wealth Funds, Diversified Funds and Bond Funds.
Section II: Performance of Money Market Funds
Money Market Funds (MMFs) in the recent past have gained popularity in Kenya with growth rates outperforming that of bank deposits. This much faster growth of MMFs relative to bank deposits may be attributable to the removal of the deposit rate cap floor in August 2018 by the National Assembly that initially required banks to pay at least 70.0% of the Central Bank Rate (CBR) base rate on deposits. The removal of the savings rate control meant that banks were free to price the rate at which they would pay depositors for the use of their funds and thus, investors could no longer enjoy attractive returns from their deposits. With Money Market Funds, in contrast, investors are able to get attractive yields from their investments owing to MMFs having a diversified asset allocation and being actively managed to ensure asset classes with the highest returns are invested in. Under this type of fund, funds are invested in liquid interest-bearing securities that have a weighted average maturity of less than 12-months. These securities include bank deposits and other short-term money market instruments including short-dated treasury bills and commercial papers. The Fund is best suited for investors who require a low-risk investment that offers capital stability, liquidity and a high-income yield. The Fund is also a good safe haven for investors who wish to switch from a higher risk portfolio to a low risk, high-interest portfolio, especially during times of high stock market volatility.
Summarized performance of Money Market Funds in H1’2019;
- The Total Assets Under Management (“AUM”) held by Money Market Fund Managers grew at an annualized rate of 23.2% to Kshs 56.5 bn in H1’2019, from Kshs 50.6 bn recorded in FY’2018,
- CIC Asset Management remains the largest overall Money Market Fund Manager with a market share of 41.4% in H1’2019, up from 39.0% in FY’2018,
- Cytonn Money Market Fund recorded the strongest annualized growth in AUM of 764.2% to Kshs 302.6 mn as of H1’2019, from an AUM of Kshs 62.8 mn in FY’2018, and,
- During the period under review, Equity Investment Bank’s Money Market Fund recorded the highest decline of 51.0% (annualized) to Kshs 480.3 mn in H1’2019 from Kshs 644.5 mn in FY’2018.
- Top five Money Market Funds by Assets Under Management
The total AUM in Money Market Funds grew by an annualized rate of 23.2% to Kshs 56.5 bn in H1’2019, from Kshs 50.6 bn in FY’2018. The top five Money Market Funds control AUM of Kshs 46.7 bn, which translates to 82.6% of the total AUM in Money Market Funds. The table below shows the top five Money Market Funds as at H1’2019:
|
Top 5 Money Market Funds by Assets Under Management |
||||
|
No. |
Fund Managers |
FY'2018 Money Market Fund (Kshs Mns) |
H1'2019 Money Market Fund (Kshs Mns) |
2019 Market Share |
|
1 |
CIC Money Market Fund |
19,756.68 |
23,391.36 |
41.4% |
|
2 |
ICEA Lion Money Market Fund |
5,916.26 |
6,458.79 |
11.4% |
|
3 |
Britam Money Market Fund |
5,871.10 |
6,290.10 |
11.1% |
|
4 |
CBA Money Market Fund |
4,946.90 |
5,819.75 |
10.3% |
|
5 |
Old Mutual Money Market Fund |
4,877.60 |
4,734.62 |
8.4% |
|
|
Total |
41,368.53 |
46,694.62 |
82.6% |
- Top Five (5) Money Market Funds by Growth Rate
As at the end of H1’2019, the fastest growing money market fund, Cytonn Money Market Fund recorded an annualized growth rate of 764.2% to an AUM of Kshs 302.6 mn, from an AUM of Kshs 62.8 mn in FY’2018. The top five Money Market Funds in terms of growth rate recorded in H1’2019 are as below:
|
Top 5 Money Market Funds By Growth Rate |
||||
|
No. |
Fund Managers |
FY'2018 AUM (Kshs Mns) |
H1'2019 AUM (Kshs Mns) |
H1'2019 Annualized Growth Rate |
|
1 |
Cytonn Money Market Fund |
62.8 |
302.6 |
764.2% |
|
2 |
Dry Associates Money Market Fund |
894.3 |
1,318.3 |
94.8% |
|
3 |
GenCap Hela Imara Fund |
305.5 |
439.0 |
87.4% |
|
4 |
Nabo Money Market Fund |
237.7 |
296.1 |
49.2% |
|
5 |
Madison Money Market Fund |
1,205.0 |
1,439.8 |
39.0% |
- Top Five (5) Money Market Funds by Yield
During the period under review, the following Money Market Funds had the highest average effective annual yield declared, with the Cytonn Money Market Fund having the highest yield:
|
Top 5 Money Market Funds by Yield |
||
|
Rank |
Money Market Funds |
Effective Annual Rate |
|
1 |
Cytonn Money Market Fund |
10.9% |
|
2 |
Alphafrica Kaisha Money Market Fund |
10.9% |
|
3 |
Nabo Africa Money Market Fund |
10.2% |
|
4 |
Zimele Money Market Fund |
9.9% |
|
5 |
CIC Money Market Fund |
9.8% |
- Comparing Annualized Unit Trust Funds AUM Growth with Bank Deposits Growth
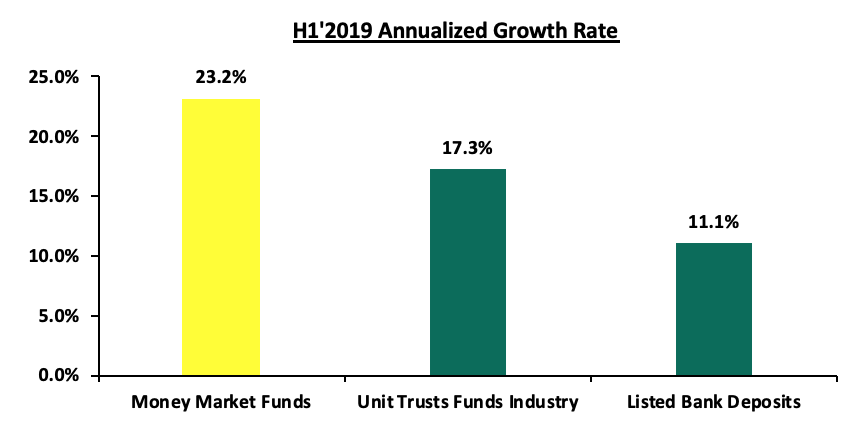
Unit Trust Funds assets recorded improved growth of 17.3% in H1’2019, compared to a growth of 4.0% in H1’2018, while the listed bank deposits grew by 11.1% in H1’2019 compared to a growth of 8.3% recorded in H1’2018. Money Market Funds recorded an impressive growth of 23.2% in H1’2019, compared to a growth of 3.8% in H1’2018. This could be attributable to Money Market Funds offering more attractive yields as compared to bank deposits, more so since the scrapping of the rate cap floor in August 2018.
The reason for the popularity of Money Market Funds in Kenya is attributable to affordable initial and additional investment requirements, high liquidity and daily compounding of interest. While initial deposit and additional investments may vary depending on the fund, Money Market Funds present a low risk, affordable and high-yielding investment opportunity for investors and guarantees capital preservation, a key feature of MMFs. In terms of liquidity, MMFs allow investors to access their funds within a maximum of 3-5 days, with the first transaction in a month being free of charge. Apart from the ease of investments, Money Market Funds provide individual investors with economies of scale through pooling their funds together and make investments that would otherwise be out of reach for individual investors. Thus, they benefit from the economies of scale created in the form of cost savings and attractive returns on investments.
Section III: Conclusion
In conclusion, as Money Market Funds continue to lead among unit trust products, there is need to leverage more on innovation and digitization in order to further propel the growth of MMFs in Kenya. Take for instance China’s first online money market fund known as Yu’eBao that has explosively grown into the world’s largest MMF with an AUM of USD 250.0 bn as at December 2018, despite being launched in 2013. Yu’eBao of Tianhong Asset Management was launched as a spare cash management platform, allowing users to transfer idle cash as low as USD 0.15 (Kshs 15.6) into the money market fund, with the use of the Alipay e-wallet. The use of technology as a distribution channel for mutual fund products opened up the fund manager to the retail segment, which is characterized by strong demand among retail clients for convenient and innovative products.
Disclaimer: The views expressed in this publication are those of the writers where particulars are not warranted. This publication, which is in compliance with Section 2 of the Capital Markets Authority Act Cap 485A, is meant for general information only and is not a warranty, representation, advice or solicitation of any nature. Readers are advised in all circumstances to seek the advice of a registered investment advisor.

- Talk to us
- Kenya
- P.O Box 20695 - 00200, Nairobi, Kenya
- Cell +254709101200
- Tel +254709101200
- WhatsApp +254741676635
- United States
- +254709101200
- DOWNLOAD OUR APP
-


- Kenya
- 8th Floor, Pinetree Plaza, Kaburu Drive, Ngong Road, Nairobi, Kenya
- USA
- Suite 1150, 1775 Eye Street NW, USA, Washington DC 20006, USA
- Investments
- High Yield
- Private Equity
- Real Estate
- Real Estate
- RiverRun Estates
- Cytonn Towers
- The Ridge
- Taraji Heights
- The Alma