May 9, 2021
Unit Trust Funds (UTFs) are collective investment schemes that pool funds from different investors and are managed by professional fund managers. The fund managers invest the pooled funds in a portfolio of securities with the aim of generating returns in line with the specific objectives of the fund. Following the release of the Capital Markets Authority (CMA) Quarterly Statistical Bulletin – Q1’2021, we examine the performance of Unit Trust Funds in Kenya with a key focus on the Money Market Fund as it has the largest market share of 89.6% as at December 2020. We shall analyze the following:
- Performance of the Unit Trust Funds Industry,
- Performance of Money Market Funds,
- Comparing Unit Trust Funds AUM Growth with Bank Deposits Growth, and,
- Conclusion
Section I: Performance of the Unit Trust Funds Industry
Unit Trust Funds are investment schemes that pool funds from investors and are managed by professional Fund Managers. The fund manager invests the pooled funds with the aim of generating returns in line with the specific objectives of the fund. The Unit Trust Funds earn returns in the form of dividends, interest income, rent and capital gains depending on the underlying security. The main types of Unit Trust Funds include:
- Money Market Fund – These are funds that invests in fixed income securities with high credit quality such as fixed deposits, treasury bills and bonds, commercial papers, etc. They are very liquid and have stable returns. They are suitable for risk averse investors,
- Equity Fund – These are funds which largely invests in listed securities and seek to offer superior returns over the medium to long-term by maximizing capital gains and dividend income. The funds invest in various sectors to reduce concentration of risk and maintain some portion of the fund’s cash in liquid fixed income investments to maintain liquidity,
- Balanced Fund – These are funds whose investments are diversified across the Equities and the Fixed Income market. The Balanced Fund offers investors long-term growth as well as reasonable levels of stability of income,
- Fixed Income Fund – This fund invests in interest-bearing securities, which include treasury bills, treasury bonds, preference shares, corporate bonds, loan stock, approved securities, notes and liquid assets consistent with the portfolio’s investment objective, and,
- Sector Specific Funds – These are funds that invest primarily in a particular sector or industry. The funds provide a greater measure of diversification within a given sector than may be otherwise possible for the other funds. They are specifically approved by the capital Markets Authority as they are not invested as per the set rules and regulations.
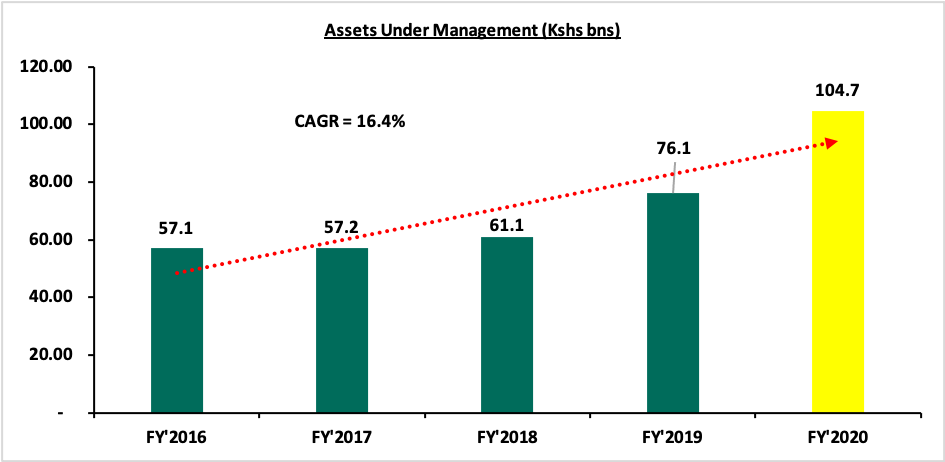
As per the Capital Markets Authority (CMA) Quarterly Statistical Bulletin – Q1’2021, the industry’s overall Assets Under Management (AUM) grew by 37.6% to Kshs 104.7 bn as at the end of FY’2020, from Kshs 76.1 bn as at the end of FY’2019. Assets Under Management of the Unit Trust Funds have grown at a 4-year CAGR of 16.4% to Kshs 104.7 bn in FY’2020, from Kshs 57.1 bn recorded in FY’2016.
This growth can be largely attributable to:
- Low Investments minimums: Unit Trust Funds have become more affordable to retail investors, with a majority of the Collective Investment Schemes’ (CIS) in the market requiring an initial investment ranging between Kshs 100.0 - Kshs 10,000.0,
- Investor Knowledge: There has been a drive towards investor education which has meant that people are more aware and are taking advantage of this,
- Diversified product offering: Unit Trust Funds are also advantageous in terms of offering investors the opportunity of diversifying their portfolios by providing them with access to a wider range of investment securities through pooling of funds, which would have not been accessible if they invested on their own,
- Efficiency and ease of access to cash/High Liquidity: Since they are invested as portfolios with different assets and the fund managers always maintain a cash buffer, they are relatively liquid and investors can get their cash on demand. Unit trusts are liquid, as it is easy to sell and buy units without depending on demand and supply at the time of investment or exit, and,
- Emergence of Fintech: the advent of digitization and automation within the industry has enhanced liquidity, enabling investors to receive their funds within 3 to 5 working days if they are withdrawing to their bank accounts, and immediate access to funds when withdrawing via M-PESA. This increases reliability making it possible for people to experiment on the investments.
According to the Capital Markets Authority, as at the end of FY’2020, there were 23 approved Collective Investment Schemes made up of 93 funds in Kenya. Out of the 23, however, only 19 were active while 4 were inactive. During the period under review, total Assets Under Management grew by 37.6% to Kshs 104.7 bn in FY’2020, from Kshs 76.1 bn as at FY’2019. The table below outlines the performance of the 23 Fund Managers of Unit Trust Funds in addition to Stanlib Kenya, which exited the market in June 2020, in terms of Assets under Management:
|
Assets Under Management (AUM) for the Approved and Active Collective Investment Schemes |
||||||
|
No. |
Fund Managers |
FY'2019 AUM (Kshs mns) |
FY'2019 Market Share |
FY'2020 AUM (Kshs mns) |
FY'2020 Market Share |
AUM Growth FY'2019 - FY'2020 |
|
1 |
CIC Asset Managers |
29,717.3 |
39.1% |
42,988.1 |
41.1% |
44.7% |
|
2 |
NCBA Unit Trust Scheme |
7,194.8 |
9.5% |
12,543.2 |
12.0% |
74.3% |
|
3 |
Britam |
9,780.4 |
12.9% |
12,304.8 |
11.8% |
25.8% |
|
4 |
ICEA Lion |
8,020.4 |
10.5% |
11,521.0 |
11.0% |
43.6% |
|
5 |
Sanlam Investments |
2,735.4 |
3.6% |
6,279.8 |
6.0% |
129.6% |
|
6 |
Old Mutual |
6,245.9 |
8.2% |
6,131.3 |
5.9% |
(1.8%) |
|
7 |
Dry Associates |
1,662.4 |
2.2% |
2,360.9 |
2.3% |
42.0% |
|
8 |
Madison Asset Managers |
1,594.6 |
2.1% |
1,928.6 |
1.8% |
20.9% |
|
9 |
African Alliance Kenya |
2,082.5 |
2.7% |
1,813.3 |
1.7% |
(12.9%) |
|
10 |
Nabo Capital (Centum) |
1,157.9 |
1.5% |
1,654.8 |
1.6% |
42.9% |
|
11 |
Zimele Asset Managers |
1,099.4 |
1.4% |
1,420.4 |
1.4% |
29.2% |
|
12 |
Co-op Trust Investment Services Limited |
5.3 |
0.0% |
1,007.1 |
1.0% |
19,051.8% |
|
13 |
Cytonn Asset Managers |
717.3 |
0.9% |
819.5 |
0.8% |
14.2% |
|
14 |
Genghis Capital |
466.0 |
0.6% |
700.0 |
0.7% |
50.2% |
|
15 |
Apollo Asset Managers |
523.1 |
0.7% |
587.3 |
0.6% |
12.3% |
|
16 |
Equity Investment Bank |
424.3 |
0.6% |
310.8 |
0.3% |
(26.8%) |
|
17 |
Alphafrica Asset Managers |
164.3 |
0.2% |
208.1 |
0.2% |
26.6% |
|
18 |
Amana Capital |
590.1 |
0.8% |
135.4 |
0.1% |
(77.1%) |
|
19 |
Wanafunzi Investments |
- |
0.0% |
0.5 |
0.0% |
- |
|
20 |
Stanlib Kenya |
1,917.1 |
2.5% |
- |
0.0% |
- |
|
21 |
Standard Investment Trust |
- |
- |
- |
- |
- |
|
22 |
Dyer and Blair Unit Trust Scheme |
- |
- |
- |
- |
- |
|
23 |
Diaspora Unit Trust Scheme |
- |
- |
- |
- |
- |
|
24 |
First Ethical Opportunities Fund |
- |
- |
- |
- |
- |
|
Total |
76,098.4 |
100.0% |
104,714.9 |
100.0% |
37.6% |
|
Source: Capital Markets Authority: Collective Investments Scheme Quarterly Report
Key to note from the above table:
- Assets Under Management: CIC Asset Managers remained the largest overall Unit Trust Fund Manager with an AUM of Kshs 43.0 bn in FY’2020, from an AUM of Kshs 29.7 bn as at FY’2019 translating to a 44.7% AUM growth,
- Market Share: CIC Asset Managers remained the largest overall Unit Trust with a market share of 41.1%, an increase from 39.1% in FY’2019. Key to note, NCBA Unit Trust Scheme recorded the highest increase in its market share with the market share increasing by 2.5% points to 12.0%, from 9.5% in FY’2019, and,
- Growth: In terms of AUM growth, Co-op Trust Investment Services Limited recorded the strongest growth of 19,051.8%, with its AUM increasing to Kshs 1,007.1 mn, from Kshs 5.3 mn in FY’2019 due to the low base effect. Cytonn Asset Managers recorded a growth of 14.2%, with its AUM increasing to Kshs 819.5 mn, from Kshs 717.3 mn in FY’2019. Amana Capital recorded the largest decline, with its AUM declining by 77.1% to Kshs 135.4 mn in FY’2020 from Kshs 590.1 mn in FY’2019.
Key to note, the decline in Stanlib’s AUM is mainly due to the Asset Manager’s exit in Kenya, which was effective June 2020. The fund manager attributed the exit to the significant operating losses incurred in both Kenya and Uganda. Standard Investment Trust, Dyer and Blair Unit Trust Scheme, Diaspora Unit Trust Scheme and First Ethical Opportunities Fund remained inactive as at the end of FY’2020.
Among unit trust products, Money Market Funds continued to be the most popular product in terms of market share, accounting for Kshs 93.9 bn, equivalent to 89.6% of all funds under management, an increase from 87.0% recorded in FY’2019 as shown in the table below;
|
Assets Under Management (AUM) by Type of Collective Investment Scheme (All values in Kshs mns unless stated otherwise) |
||||||
|
No. |
Product |
FY’2019 AUM |
FY’2020 AUM |
FY’2019 Market Share |
FY'2020 Market Share |
Variance (% Points) |
|
1 |
Money Market Funds |
66,193.0 |
93,858.9 |
87.0% |
89.6% |
2.6% |
|
2 |
Equity Fund |
4,485.2 |
3,560.3 |
5.9% |
3.4% |
(2.5%) |
|
3 |
Balanced Fund |
1,312.0 |
1,341.0 |
1.7% |
1.3% |
(0.4%) |
|
4 |
Others |
4,108.1 |
5,954.6 |
5.4% |
5.7% |
0.3% |
|
|
Total |
76,098.4 |
104,714.9 |
100.0% |
100.0% |
|
Source: Capital Markets Authority: Collective Investments Scheme Quarterly Report
Key take outs from the above table include:
- During the period under review, Money Market Funds recorded a 41.8% growth in the Assets Under Management, and consequently, their market share rose to 89.6% from 87.0% recorded in FY’2019, driven by local investors’ preference for capital preservation during the period of review,
- Equity funds recorded a 2.5% points market share decline to 3.4% from 5.9% in FY’2019, attributable to increased capital flight by investors from the fund as they sought for safe havens as well as the downward trend recorded in the equities market since the onset of the COVID-19 pandemic, which saw the Nairobi All Share Index (NASI) shed by 8.6% in FY’2020,
- Balanced Funds, on the other hand, ranked third in comparison to other products, with a market share of 1.3% in FY’2020 from 1.7% recorded in FY’2019, and,
- The Other Funds include Income Funds, Growth Funds, Wealth Funds, Diversified Funds, and Bond Funds.
Section II: Performance of Money Market Funds
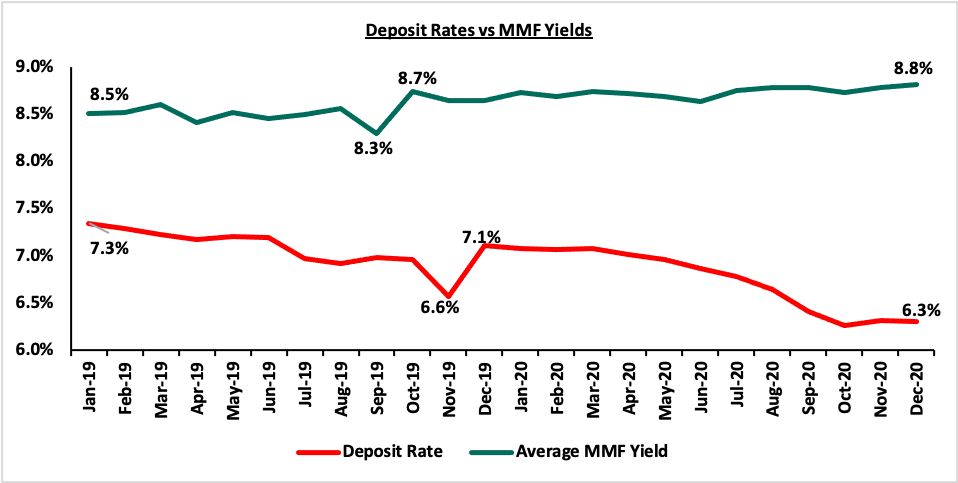
Money Market Funds (MMFs) in the recent past have gained popularity in Kenya, with one of the main reasons being the higher returns money market funds offer compared to the returns on bank deposits. This has been evidenced by Unit Trust Funds’ growth of 37.6% outpacing the listed banking sector’s deposit growth of 18.4% in FY’2020. According to the Central Bank of Kenya data, the average deposit rate during the year declined to 6.7%, from an average of 7.8% when the legislation on the deposit rate cap floor was in place.
As per regulations, funds in MMFs should be invested in liquid interest-bearing securities that have a weighted average maturity of less than 13 months. The asset allocation changes during the year is as shown below:
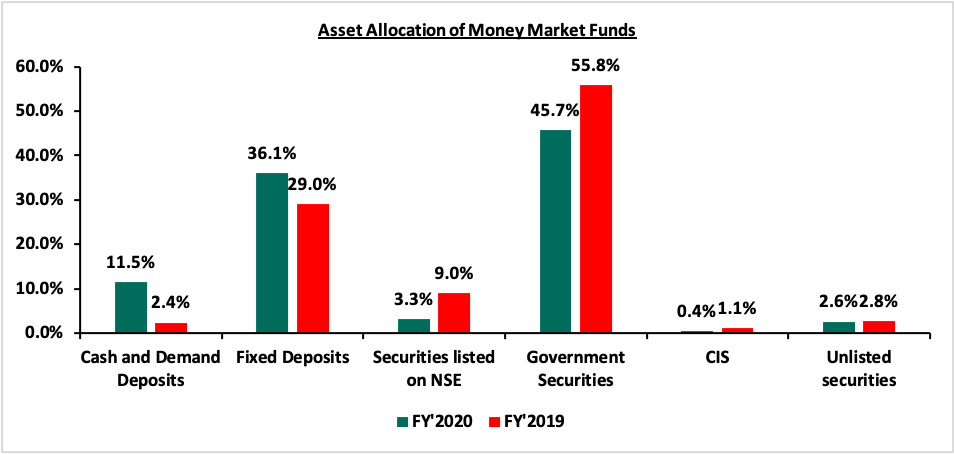
The allocation to cash and demand deposits and fixed deposits increased by 9.1% points and 7.1% points to 11.5% and 36.5% from 2.4% and 29.0% respectively while allocation to Securities listed on the NSE, Government Securities, Collective Investment Schemes (CIS) and unlisted securities declined by 5.7% points, 10.1% points, 0.7% points, and 0.2% points to 3.3%, 45.7%, 0.4% and 2.6% from 9.0%, 55.8%, 1.1% and 2.8%, respectively in FY’2020.
- Top Five (5) Money Market Funds by Assets Under Management
The total Assets Under Management in Money Market Funds grew by 41.8% to Kshs 93.9 bn in FY’2020, from Kshs 66.2 bn in FY’2019. The top five Money Market Funds control an AUM of Kshs 79.5 bn, which translates to 84.7% of the total AUM in Money Market Funds. The table below shows the top five Money Market Funds as at FY’2020:
|
Top 5 Money Market Funds by Assets Under Management |
||||||
|
No. |
Fund Managers |
FY’2019 Money Market Fund (Kshs Mns) |
FY’2020 Money Market Fund (Kshs Mns) |
FY’2019 Market Share |
FY’2020 Market Share |
Variance (% Points) |
|
1. |
CIC Money Market Fund |
29,016.0 |
42,435.6 |
44.0% |
45.2% |
1.2% |
|
2. |
NCBA Money Market Fund |
6,446.1 |
10,948.7 |
9.8% |
11.7% |
1.9% |
|
3. |
British-American Money Market Fund |
7,334.1 |
10,587.5 |
11.1% |
11.3% |
0.2% |
|
4. |
ICEA Lion Money Market Fund |
6,800.2 |
9,283.2 |
10.3% |
9.9% |
(0.4%) |
|
5. |
Sanlam Money Market Fund |
2,700.2 |
6,222.0 |
4.1% |
6.6% |
2.5% |
|
|
Total |
52,296.6 |
79,477.0 |
79.3% |
84.7% |
5.4% |
Source: Capital Markets Authority: Collective Investments Scheme Quarterly Report
- Top Five (5) Money Market Funds by Growth Rate
As at the end of FY’2020, Co-op Money Market Fund recorded the fastest growth in Assets under Management (AUM) coming in at 19,051.8% to Kshs 1,007.1 mn, from Kshs 5.3 mn recorded in FY’2019. The top five Money Market Funds in terms of growth rate recorded in FY’2020 is highlighted below:
|
Top 5 Money Market Funds by Growth Rate |
||||
|
No. |
Fund Manager |
FY'2019 AUM (Kshs Mns) |
FY'2020 (Kshs Mns) |
FY'2020 Growth Rate |
|
1 |
Co-op Money Market Fund |
5,258.5 |
1,007.1 |
19,051.8% |
|
2 |
Sanlam Money Market Fund |
2,700.2 |
6,222.0 |
130.4% |
|
3 |
NCBA Money Market Fund |
6,446.2 |
10,948.7 |
69.8% |
|
4 |
GenCapHela Imara Money Market Fund |
434.0 |
668.1 |
54.0% |
|
5 |
Alphafrica Kaisha Money Market Fund |
57.3 |
85.0 |
48.3% |
Source: Capital Markets Authority: Collective Investments Scheme Quarterly Report
- Top Five (5) Money Market Funds by Yields
During the period under review, the following Money Market Funds had the highest average effective annual yield declared, with the Cytonn Money Market Fund having the highest effective annual yield at 10.8% against the industrial average of 8.8%.
|
Top 5 Money Market Fund Yield in FY'2020 |
||
|
Rank |
Money Market Fund |
Effective Annual Rate (Average FY'2020) |
|
1 |
Cytonn Money Market Fund |
10.77% |
|
2 |
Zimele Money Market Fund |
9.91% |
|
3 |
Alphafrica Kaisha Money Market Fund |
9.81% |
|
4 |
Nabo Africa Money Market Fund |
9.73% |
|
5 |
CIC Money Market Fund |
9.47% |
|
|
Industrial Average |
8.80% |
Section III: Comparing Unit Trust Funds AUM Growth with Bank Deposits Growth
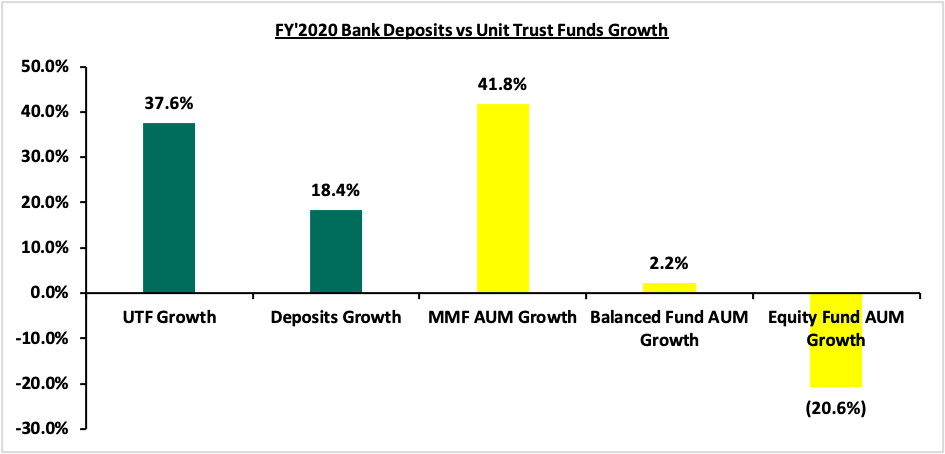
Unit Trust Funds assets recorded a y/y growth of 37.6% in FY’2020, while the listed bank deposits recorded a weighted y/y growth of 18.4% in FY’2020. The chart below highlights the Unit Trust Funds AUM growth vs bank deposits growth in 2020;
Key take outs from the graph above include:
- The Unit Trust Funds’ growth of 37.6% outpaced the listed banking sector’s deposit growth of 18.4% in FY’2020, an indication that there is increasing investor confidence in our capital markets, and,
- Money Market Funds grew at a rate of 41.8%, faster than the other UTFs, attributable to the fund’s affordability in its initial and additional investment requirements, its high liquidity ease of understanding by investors and lower volatility of return. While initial deposit and additional investments may vary depending on the fund, Money Market Funds present a low risk, affordable and high-yielding investment opportunity for investors and capital preservation.
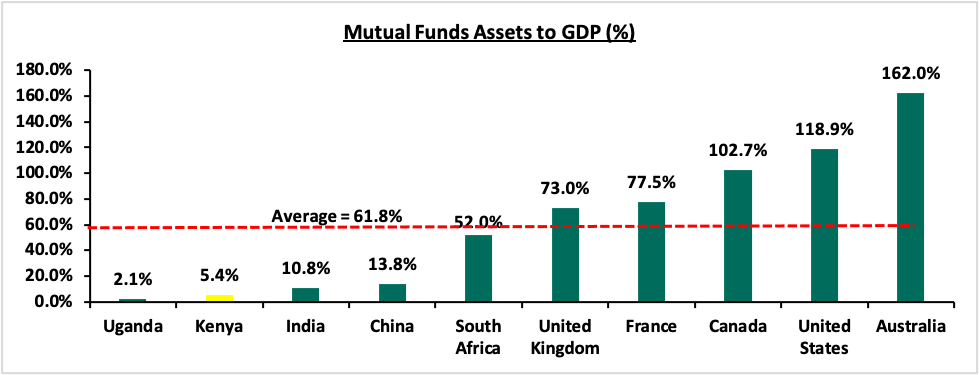
Despite Unit Trust Funds’ AUM growth outpacing that of listed banks, their AUM as at FY’2020 stood at 2.8% of the listed banking sector’s deposits. Kenya’s Mutual Funds/UTFs to GDP ratio at 5.4% is still very low compared to global average of 61.8%, showing that we still have room to improve and enhance our capital markets. The table below shows some countries’ mutual funds as a percentage of GDP:
Source: World Bank Data
In order to improve our Capital Markets and stimulate its growth, we recommend the following actions:
- Allow for sector funds: The current capital markets regulations require that funds must diversify. Consequently, one has to seek special dispensation in the form of sector funds such as a financial services fund, a technology fund or a real estate UTF fund. Regulations allowing unit holders to invest in sector funds would expand the scope of unit holders interested in investing,
- Reduce the minimum investments to reasonable amounts: Currently, the minimum investment for sector specific funds is Kshs 1.0 mn, while that for Development REITS is currently at Kshs 5.0 mn. With the national median income for employed people estimated at around Kshs 50,000, the high minimum initial and top up investments amounts are unreasonably high and therefore lock out a lot of potential investors. Additionally, as compared to the Yu’eBao investment fund in China where the minimum investment is Kshs 17.5 (USD 0.16), these high amounts discriminate against most retail investors giving them fewer investment choices,
- Eliminate conflicts of interest in the governance of capital markets: The capital markets regulations should enable a governance structure that is more responsive to market participants and market growth,
- Improve fund transparency to provide investors with more information: Each Unit Trust Fund should be required to publish their portfolio holdings on a quarterly basis to enhance transparency for investors. Given that this measure is among the new CIS guidelines which took effect on January 1st 2021, it is commendable that the CMA is enhancing transparency and uniformity in terms of reporting of results for UTFs, which will provide investors with more information and subsequently improve investor confidence, and,
- Create increased competition in the market by encouraging different players to set shop and offer different services such as the opening up of Trustees to non-financial institutions: Competition in capital markets will not only push Unit Trust Fund managers to provide higher returns for investors but will also eliminate conflicts of interest in markets and enhance the provision of innovative products and services.
Section IV: Conclusion
For continued growth of the capital markets, there is a need to leverage more on innovation and digitization in order to further propel the growth of UTFs in Kenya. For instance, China’s first online money market fund known as Yu’eBao had explosively grown into one of the world’s largest MMF, despite being launched in 2013. The use of technology as a distribution channel for mutual fund products opened up the fund manager to the retail segment, which is characterized by strong demand among retail clients for convenient and innovative products. Yu’eBao is however facing regulatory intervention, with the Chinese authorities setting a requirement for Yu’eBao to reduce its size citing the fund’s dominance and liquidity risk. This has seen the fund’s AUM decline by 18.6% to USD 148.4 bn as at March 2021 from USD 182.4 bn in December 2020. In our view, regulators should promote and facilitate growth of UTFs instead of impeding their expansion, which will enhance growth of capital markets and encourage entry of new players into the market.
Cytonn Asset Managers, which also leverages on technology such as USSD and digital platforms, experienced a growth of 14.2% to Kshs 819.5 mn in FY’2020, from Kshs 717.3 mn in FY’2019. The advent of digitization and automation within the industry has also enhanced liquidity. Cytonn Money Market Fund clients can issue withdrawal instructions and have funds remitted to their bank accounts within 2–4 working days while funds withdrawn through the USSD or digital platforms are remitted to their M-Pesa and Bank accounts within 5 minutes and 2 working days respectively; the Cytonn Money Market Fund is accessible through dialing *809#. As highlighted in our topical Potential Effects of COVID-19 on Money Market Funds, we believe that amidst the Coronavirus pandemic, returns for Money Market Funds will remain stable with a bias to a slight increase upwards should rates on government securities increase. They will also remain the most liquid of all mutual funds providing a short-term parking bay that earns higher income yields compared to deposits and savings accounts. UTFs provide a more convenient platform in terms of accessibility and liquidity with the additional benefit of higher returns for investors.

- Talk to us
- Kenya
- P.O Box 20695 - 00200, Nairobi, Kenya
- Cell +254709101200
- Tel +254709101200
- WhatsApp +254741676635
- United States
- +254709101200
- DOWNLOAD OUR APP
-


- Kenya
- 8th Floor, Pinetree Plaza, Kaburu Drive, Ngong Road, Nairobi, Kenya
- USA
- Suite 1150, 1775 Eye Street NW, USA, Washington DC 20006, USA
- Investments
- High Yield
- Private Equity
- Real Estate
- Real Estate
- RiverRun Estates
- Cytonn Towers
- The Ridge
- Taraji Heights
- The Alma