Dec 24, 2017
We first wrote about the commonly discussed topic of a Kenyan real estate bubble in our Focus dated March 2017, and titled ‘Is there a Real Estate Bubble in Kenya?’ It touched on characteristics and conditions precedent for a bubble, and also reviewed the United States and Ireland as case studies, concluding that the Kenyan market is not experiencing a bubble but the normal real estate cycles of rising demand, peaking market, falling market then bottoming out, and the rapid price increments witnessed were a result of low supply and high demand. We revisit the matter this week as we come close to the end of 2017, to evaluate the metrics, consider additional case studies, and review if our previously arrived at conclusion still holds.
We start by defining a bubble and look at previous examples of major real estate bubbles globally, in the Baltic States, United States and Spain, focusing on the causes and how they burst, we then look at the key growth drivers of the Kenyan real estate market, and conclude with an outlook for the sector.
A bubble refers to a periodic phenomenon characterized by an astonishing rise in prices of a commodity or service to levels that are not supported by any fundamentals. For property, it results due to property being too expensive for the general population to afford, which results into lower demand hence prices declining tremendously (what is known as a “bubble bursting”). The main features of a property bubble are:
- Increase in demand for property leading to overvaluation relative to fundamentals that support the pricing. This is due to increasing demand that supersedes supply, which eventually leads to a property bubble as the prices rise to levels that are unaffordable by the public;
- Speculation in the real estate market, which increases demand and hence rapid rise in prices. Most investors become irrational believing that the high prices being witnessed will continue to prevail in the future. This environment thus creates need of acquiring property immediately for speculation hence increased demand of property;
- Easy access to credit: Most economies that have experienced property bubbles are characterized by ease of access to credit. Access to credit also leads to excessive credit growth in the market which increases the demand for property leading to prices increasing to unsustainable levels;
- Disruption in the credit market, which leads to an increase in interest rates leading to an increase defaults levels and non-performing loans, which exposes the banking system. This results into reduced credit supply, and hence demand suddenly falls leading to a sharp fall in prices, and hence loss of value for homeowners, speculators and lenders, and the bubble is said to have burst.
There have been a couple of property bubbles that burst in the world the worst of them being the global financial crisis of 2008, which we analysed in Cytonn Weekly #10. Today, we look at the Baltic States, Spain, and the United States:
- Baltic States Real Estate Bubble
The Baltic States housing bubble was an economic crisis involving major cities in Estonia, Latvia and Lithuania. Between 2005 and 2007, the official house price index for Estonia, Latvia and Lithuania recorded a sharp jump of 104.6%, 134.3% and 106.7%, respectively, against the Euro Area’s 11.8%. The bubble eventually burst in 2007 due to the financial crisis of 2007-2008, which led to weak Baltic economies.
In 2005, property markets rose drastically between 2004 and 2007, with average price per SQM increasing to €1,159 in 2007 from an average of €642 in 2004, an 80.5% hike. Credit was also highly available and at low interest rates. In a bid to obtain the highest market share, Nordic banks relaxed their financial regulations by making credit more readily available leading to historically low rates on the mortgage loans. The low housing taxation rates, coupled with overly optimistic sentiment on the integration with the European Union, led to investors’ risk appetite on property to increase tremendously, which contributed in the ballooning of the real estate bubble.
As of 2007, most properties in the three states were unaffordable by the citizens resulting in a devastating real estate meltdown as no more properties were being sold for the period 2007/2008. However, the price correction began in Estonia by mid-2007, followed by Latvia and Lithuania in mid-2008. The situation worsened after the September 2008 global credit crunch, sending the entire region into a full-blown recession. In 2007, the Baltic States economy began to decelerate due to a slowdown in real estate related activities, with average interest rates for mortgage loans increasing to 10.3% in 2007 from 6.8% in 2006. In 2008, Estonia recorded a decline in GDP growth rates of -9.7% from 11.2% in 2006, Latvia recorded -10.3% from 11.9%, while Lithuania had 3.0% from 7.7% over the same period. This was attributed to lack of domestic demand with the house price index going down by 19.6% in Estonia, 17.8% in Latvia and 15.5% in Lithuania. In 2009, the Baltic States went into a full-blown recession with GDP growth rates recording -14.3%, -17.7% and -14.8% in Estonia, Latvia and Lithuania, respectively
- Spanish Property Bubble
Experts divide the Spanish property bubble in three periods:
- 1985–1991, in which prices nearly tripled;
- 1992–1996, in which prices remained somewhat stable; and
- 1996–2008, in which prices grew exceptionally high. However, with the financial crisis of 2007–08, prices began to fall,
In 1999, a poorly performing Spain joined the European single currency, which enabled it to borrow credit in Euros promoting a credit and property boom. At the same time, Spain received many immigrants from Latin America, Eastern Europe and Northern Africa who sparked demand for property. According to statistics, Spain had more new houses in 2007 than France, Germany, Britain and Italy combined with 13% of its national workforce being in the real estate construction industry. The indebtedness of the Spanish Government tripled in less than 10-years. In 1986, debt represented 34% of disposable income, in 1997 it rose to 52%, and in 2005 it came to 105%. Banks provided cheap mortgages to the masses, covering house, furniture and car costs. In 2006, a quarter of the population was indebted with maturities of more than 15-years. From 1990 to 2004, the average length of mortgages increased from 12 to 25-years. Average property prices rose by at least 155% from 1997 to 2007, which was beyond affordability for majority of the population, resulting in at least 400,000 foreclosures and an eventual bust.
In 2008, new constructions reduced significantly, and the real estate market started to drop fast, with house prices decreasing dramatically by 8.0% in that year. In the period of 2007-2013, Spanish house prices had fallen by 37.0%.
- United States Property Bubble
The US property bubble began with the 2000 dotcom bubble, which led to a recession in the American economy. In a bid to revive it, the Federal Reserve lowered the fed rate and hence low interest rates in the economy that made mortgages cheaper, which led to increased demand for housing. Rapid increase in demand led to house prices increasing from a median of USD 169,000 in 2000 to USD 246,500 at the peak of the bubble in 2006, translating to a CAGR of 7.8%. The market then developed irrational exuberance believing that the prices would continue on an upward trend and hence increased demand. In 2006, with the recovery of the stock market, the Federal Reserve raised the interest rates from the average of 1%-4% to a high of 5.25%. At these high rates, the mortgage subscribers were unable to service the mortgages and hence there were massive defaults in the financial sector.
This led to the prices and value of such mortgage backed securities plunging, leading to huge losses for banks and other financial institutions that had securitized the mortgages, which then led to investors panic and sell-off and hence the bubble burst.
Therefore, as is evident from the three case studies, real estate bubbles are always characterized by overheated economies followed by laxity in lending requirements and low interest rates, which drive house prices higher. This is often followed by massive defaults with foreclosures flooding the market as demand stalls, and soon house prices collapse resulting to more supply than is demanded.
Overview of Kenyan Real Estate
The Kenyan real estate market has grown tremendously, experiencing a boom that is in line with the country’s economic growth, which thus far has been characterized by (i) an expanding middle class, (ii) stable GDP growth which has averaged at 5.2% for the past 5 years with GDP per capita increasing by 260.3% to USD 1,455 in 2016 from USD 403.98 in 2000 following the GDP rebasing in 2014, and (iii) infrastructural development which has opened up new areas for development, especially in the Nairobi Metropolitan Area.
Real estate as a sector has grown over the past two decades to become the fifth largest contributor to the nation’s GDP, and while other sectors’ contribution such as agriculture and manufacturing continue to dwindle, real estate’s contribution has grown from 4.8% in 2010 to 8.4% in 2016, compared to other market such as the US and China where the sector contributed 6.0% and 6.5%, respectively in 2016.
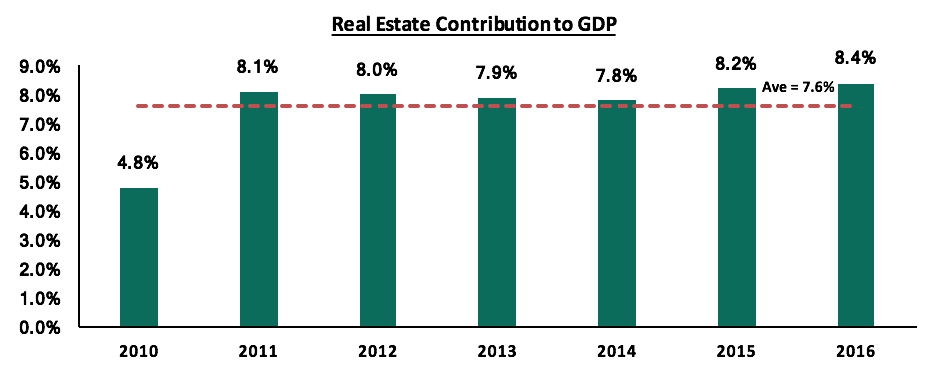
Source: KNBS
The growth of the sector has been characterized by a rise in selling prices with housing in the Nairobi metropolitan area for instance rising to an average of Kshs 31.4 mn in 2016 from Kshs 7.1 mn in 2000, according to the Hass Consult, resulting in many speculating about a real estate bubble.
Real Estate Sector Overview in Kenya – Why some investors confuse this for a bubble
The real estate sector’s growth can be demonstrated by the rise in building approvals, which increased by 128.2% to 308.4 bn in 2016 from 135.1 bn in 2012, as per The Kenya National Bureau of Statistics, Economic Survey 2017. Additionally, the average price for a house has increased to Kshs 31.4 mn in 2016 compared to Kshs 7.1 mn in 2000, a CAGR of 9.7%. This is a clear indication that real estate has become the ideal investment diversification portfolio for investors.
As a result of the sector’s resilient performance despite the long electioneering period, the property prices have held with the low increases in both rents and asking prices, investors have ascribed this to a possible property bubble. This is due to:
- High Returns: The growth of the sector has been mainly characterized by soaring house and land prices, as well as rental rates, resulting in high returns to investors. Over the last half decade, real estate returns have offered returns at an average of 25.0%, higher than the traditional investment classes, which offer an average return of 12.4%. This growth in prices has left some investors apprehensive,
- Oversupply in some themes such as commercial office: As of 2016, the office sector recorded an oversupply of 3.2 mn SQFT, leading to investors speculating a similar outcome for the housing market,
- Peaks and troughs in price growth: As per the Kenya Banker’s Association – Housing Price Index, house prices grew by an average of 0.8% year to date, compared to a 1.8% growth the same period last year leaving investors wondering whether this is a bubble burst. Additionally, some attribute the increase in prices to a boom that is headed for a bust. However, the average price- to-rent ratio in Kenya is 3, compared to bubble periods in places like the US where the price-to-rent ratio was as high as 20 times.
We still see value in the Kenya Real Estate sector since the sector has a couple of supporting fundamentals:
- Demographics: Kenya’s population continues to grow rapidly at double the global rate at an average of 2.6% p.a. and the urbanization rates are high at 4.4%. Additionally, the middle-class population segment has continued to expand thereby increasing disposable income and hence creating real demand for property unlike in a bubble where demand is fuelled by investors interested solely in capital growth, hold it for a short period before reselling it at a higher price,
- Stable economy: In a bubble economy, the burst is most often than not followed by an economic recession. However, the Kenyan real estate growth has been supported mainly by a stable and growing economy as evidenced by the country’s growing GDP, which has averaged at 5.1% for the last five years with 2017’s expected to come in at 4.7% - 5.2%, against Sub-Saharan Africa’s 2.7%. The country’s GDP has grown to 5.8% in 2016 from 4.6% in 2012 with GDP Per Capita growing by 26.0% to USD 1,455 from USD 1,155 in the same period,
- Low Credit supply: Property bubbles are mainly characterized by ‘cheap’ mortgages and access to credit, available to a majority of the population and at low interest rates thus making house buying possible for a majority of the population. With the introduction of the Banking (Amendment) Act, 2015 in Kenya, we have witnessed a steep decline in credit advancement to the private sector with record lows of 1.6% in August 2017, down from 5.4% in August 2016, before the bill was amended into law. This is a clear indication that home buyers rely on cash buys and thus, mortgage rates remain at record lows - and could fall further as lending institutions become more unwilling to extend credit to individuals. As per the CBK, the number of mortgages fell by 1.5% at the end of 2016, to 24,085 from 24,458 in 2015,
- High genuine demand: A real estate bubble bursts when supply exceeds demand. However, according to the World Bank, the country has a deficit of 2.0 mn units, with the National Housing Corporation estimating an annual demand of 200,000 units. This is supported by the rapid population growth, which means the demand for properties is real and is expected to continue to be so as the country is only able to provide 35,000 homes annually. Additionally, entry of long term foreign investors has added onto the demand, especially for high end properties,
- Increase in house prices is in tandem with an increase in earnings: A real estate bubble more often than not results from a credit-driven market resulting in a bust where households are overridden with debt beyond their property’s value. According to Kenya National Bureau of Statistics Economic Survey 2017, wage earnings increased to Kshs 1.6 tn in 2016 from Kshs 1.5 tn in 2015, a 9.1% increase against a 7.4% increase in property prices. This indicates that there is still room for property prices to grow in order to match the population’s income,
- Availability of land and government incentives: Land prices in Kenya have been driven by a justified demand and infrastructural development that has opened up more areas for development. States that have experienced a property bubble are characterized by limited land supply, against a high population growth coupled by government’s negative restrictions against densification; as seen in the United States bubble as well as a raise in stamp duty in the Spanish bubble. Recently, the government has been keen on streamlining the land ministries to make it easier for developers to acquire land and introduced a new law that will enable densification of exclusive low-rise residential areas.
Conclusion
The key indicators of a bubble are:
- More people taking on more debt. However, in Kenya today, the key constraint is access to credit as the government is crowding out the private sector given the 2016 interests rate cap law. For instance, mortgage accounts were reported to have decreased by 1.5% by December 2016 to 24,085 from 24,458 the same period in 2015,
- Relaxed lending standards. Despite the Kenyan government lowering interests rates, institutions have tightened their credit supply to the private sector, especially for long-term loans such as mortgages, as evidenced by the slowdown in private sector credit growth, at 2.0% in October 2017 compared to 4.6% in October 2016 and 19.5% in October 2015,
- Historically low interest rates. From our case studies, interest rates declined to below 7%. In Kenya, The Bank Amendment Act of 2015 capped bank lending rates to a maximum of 14.0%, which is 4% above the Central Bank Rate that has remained at 10% throughout 2017,
- High demand from high levels of speculation. Unlike in a bubble where most of the demand is driven by speculators, in Kenyan the demand is driven by real demand which is estimated to be at least 200,000 units p.a.
- Incredible rise in house prices. As is evidenced in our case studies, a housing bubble is characterized by most often than not, a triple digit growth in prices and as per the IMF standards, the decline in a bust must be at least 14% over a period of 16 quarters. In Kenya however, the prices are growing, albeit softening, with 2016 recording an average appreciation rate of 7.4%, which slowed to 3.8% in 2017, as per the Cytonn Residential Report 2017.
From the above it is clear that the real estate sector in Kenya is not in a bubble based on the five indicators. The sector is experiencing the normal real estate cycles, and the rapid price increments being witnessed are a result of low supply and high demand. Thus, it still presents attractive opportunities for investors. Additionally, there are ways to invest either directly or indirectly and ensure that you continue to get the best returns.
- For direct long-term investors, there’s opportunity in land banking (buying land for capital appreciation) while despite the reported office sector glut, there continues to be a high demand for Grade A office stock to support the multinational firms and growing local firms.
- For indirect investment, Real Estate Investment Trusts (REITs), where investors buy shares in a company that operates rental property and passes the rental income to its investors in form of dividends, is gaining traction in the country.
- Modern firms also offer other ‘sharp’ ways in the form of client-based structured products such as:
- Real Estate Backed Medium-Term Notes (MTN), a debt note that usually matures in 5–10 years and is backed by cash flows from Real Estate projects, and
- A short to medium-term debt obligation issued to finance a project or multiple projects such as Cytonn Project Notes (CPN)
Disclaimer: The views expressed in this publication are those of the writers where particulars are not warranted. This publication, which is in compliance with Section 2 of the Capital Markets Authority Act Cap 485A, is meant for general information only, and is not a warranty, representation, advice or solicitation of any nature. Readers are advised in all circumstances to seek the advice of a registered investment advisor.

- Talk to us
- Kenya
- P.O Box 20695 - 00200, Nairobi, Kenya
- Cell +254709101200
- Tel +254709101200
- WhatsApp +254741676635
- United States
- +254709101200
- DOWNLOAD OUR APP
-


- Kenya
- 8th Floor, Pinetree Plaza, Kaburu Drive, Ngong Road, Nairobi, Kenya
- USA
- Suite 1150, 1775 Eye Street NW, USA, Washington DC 20006, USA
- Investments
- High Yield
- Private Equity
- Real Estate
- Real Estate
- RiverRun Estates
- Cytonn Towers
- The Ridge
- Taraji Heights
- The Alma