A Review of Kenya’s Proposed Sovereign Wealth Fund & Cytonn Weekly #45/2025
By research team, Nov 9, 2025
Executive Summary
Fixed Income
During the week, T-bills were oversubscribed for the fifth consecutive week, with the overall subscription rate coming in at 166.1%, higher than the subscription rate of 101.1% recorded the previous week. Investors’ preference for the shorter 91-day paper persisted, with the paper receiving bids worth Kshs 15.3 bn against the offered Kshs 4.0 bn, translating to a subscription rate of 383.1%, significantly higher than the subscription rate of 46.7%, recorded the previous week. The subscription rates for the 182-day paper and 364-day paper increased to 26.0% and 219.3% respectively from the 15.6% and 208.2% recorded the previous week. The government accepted a total of Kshs 39.8 bn worth of bids out of Kshs 39.8 bn bids received, translating to an acceptance rate of 99.98%. The yields on the government papers recorded a mixed performance with the yields on the 182-day paper decreasing the most by 10.7 bps to 7.8% from the 7.9% recorded the previous week, while the 91-day paper decreased by 1.8 bps to 7.79% from the 7.81% recorded the previous week. The yield on the 364-day paper increased by 0.5 bps to 9.4% from the 9.3% recorded the previous week;
During the week, the Central Bank of Kenya released the auction results for the re-opened treasury bonds FXD1/2012/020 and FXD1/2022/015 with tenors to maturities of 7.0 years and 11.4 years respectively and fixed coupon rates of 12.0% and 13.9% respectively. The bonds were oversubscribed, with the overall subscription rate coming in at 232.3%, receiving bids worth Kshs 92.9 bn against the offered Kshs 40.0 bn. The government accepted bids worth Kshs 52.8 bn, translating to an acceptance rate of 56.9%. The weighted average yields for the accepted bids for the FXD1/2012/020 and FXD1/2022/015 came in at 12.5% and 13.3% respectively. Notably, the 12.5% and 13.3% on the FXD1/2012/020 and FXD1/2022/015 is lower than the 13.6% and 13.9% respectively recorded the last time they were reopened in May 2025. With the Inflation rate at 4.6% as of October 2025, the real returns of the FXD1/2012/020 and FXD1/2022/015 are 7.9% and 8.7%. Given the 10.0% withholding tax on the bonds, the tax equivalent yields for shorter term bonds with 15.0% withholding tax are 13.2% and 14.1% for the FXD1/2012/020 and FXD1/2022/015 respectively;
During the week, Stanbic Bank released its monthly Purchasing Managers’ Index (PMI) highlighting that the index for October 2025 rose further into expansion territory, coming in at 52.5, up from 51.9 in September 2025. This marked the second consecutive month of improvement and the strongest reading since February 2022, signaling a solid upturn in business conditions across Kenya’s private sector. The improvement was mainly driven by stronger demand, higher new orders and increased output levels, supported by easing inflationary pressures and improved supply chain efficiency;
Equities
During the week, the equities market was on an upward trajectory, with NSE 10, NSE 20, NSE 25 and NASI gaining by 5.3%, 4.4%, 4.2% and 2.0% respectively, taking the YTD performance to gains of 58.1%, 53.2%, 51.6% and 50.6% of NSE 20, NASI, NSE 10 and NSE 25 respectively. The equities market performance was mainly driven by gains recorded by large-cap stocks such as KCB, ABSA and DTB-K, of 13.8%, 12.4% and 9.8%, respectively. The performance was, however, weighed down by losses by large cap stocks such as NCBA, Safaricom and Stanbic of 3.4%, 2.5% and 0.6%;
Also, during the week, the banking sector index increased by 38.3% to close at 210.3 from the 152.1 recorded the previous week. This was attributable to gains recorded by stocks such as KCB, ABSA and DTB-K of 13.8%, 12.4% and 9.8% respectively. The performance was, however, held down by losses recorded by stocks such as NCBA and Stanbic of 3.4% and 0.6% respectively;
During the week, Safaricom Plc released its H1’2026 financial results for the period ending 30th September 2025, highlighting that the profit after tax (PAT) for the Group increased by 191.5% to Kshs 29.2 bn, from Kshs 10.0 bn recorded in H1’2025. The strong performance was largely attributable to a 9.6% decrease in operating expenses to Kshs 103.4 bn from Kshs 114.4 bn recorded in H1’2025, an 8.1% growth in total revenue to Kshs 204.7 bn from Kshs 189.4 bn, a 9.4% reduction in net finance costs to Kshs 9.9 bn from Kshs 10.9 bn, and a 23.2% points decrease in the effective tax rate to 47.2% in H1’2026 from 70.4% in H1’2025;
During the week, KCB Group Plc revealed its acquisition of an undisclosed minority stake in Pesapal Limited which in 2021 was granted a Payment Service Provider (PSP) License by the Central Bank of Kenya which allowed Pesapal to carry out Payment Gateway Services in compliance with the National Payment System Act, 2011. This move proves to be strategic as KCB strives to capture the biggest market share of the fast-growing fintech market. This also comes after their recent 75.0% majority stake acquisition of Riverbank Solutions, which was valued at Kshs 2.0 bn;
Real Estate
During the week, Hass Consult, a Kenyan consulting and Real Estate development firm, released its Property Index Q3’2025 Report , focusing on the residential Real Estate sector's performance in the Nairobi Metropolitan Area (NMA).
During the week, Hass Consult also released Land Price Index Q3’2025 Report which highlighted the performance of the Real Estate land sector in the Nairobi Metropolitan Area (NMA).
On the Unquoted Securities Platform, Acorn D-REIT and I-REIT traded at Kshs 27.4 and Kshs 23.2 per unit, respectively, as per the last updated data on 7th October 2025. The performance represented a 33.4% and 14.5% gain for the D-REIT and I-REIT, respectively, from the Kshs 20.0 inception price. The volumes traded for the D-REIT and I-REIT came in at Kshs 12.8 mn and Kshs 40.6 mn shares, respectively, with a turnover of Kshs 323.5 mn and Kshs 791.5 mn, respectively, since inception in February 2021.Additionally,ILAM Fahari I-REIT traded at Kshs 11.0 per share as of 7th October 2025, representing a45.0% loss from the Kshs 20.0 inception price. The volume traded to date came in at 1.2 mn shares for the I-REIT, with a turnover of Kshs 1.5 mn since inception in November 2015.
Focus of the Week
Kenya’s 2012 discovery of oil reserves in Northern Kenya and the subsequent establishment of a Sovereign Wealth Fund (SWF) mark a pivotal moment in the country’s fiscal and economic trajectory. As global commodity markets remain volatile and debt servicing pressures intensify, the need for structured, transparent, and forward-looking management of oil revenues has never been more urgent. Sovereign wealth funds are used globally to stabilize economies and finance strategic development. Sovereign funds offer countries like Kenya a unique opportunity to transform finite natural resources into long-term prosperity. Yet, despite its significance, Kenya’s SWF remains under-explored in public discourse.
Investment Updates:
- Weekly Rates: Cytonn Money Market Fund closed the week at a yield of 12.0% p.a. To invest, dial *809# or download the Cytonn App from Google Play store here or from the Appstore here;
- We continue to offer Wealth Management Training every Monday, from 10:00 am to 12:00 pm. The training aims to grow financial literacy among the general public. To register for any of our Wealth Management Trainings, click here;
- If interested in our Private Wealth Management Training for your employees or investment group, please get in touch with us through wmt@cytonn.com;
- Cytonn Insurance Agency acts as an intermediary for those looking to secure their assets and loved ones’ future through insurance namely; Motor, Medical, Life, Property, WIBA, Credit and Fire and Burglary insurance covers. For assistance, get in touch with us through insuranceagency@cytonn.com;
- Cytonn Asset Managers Limited (CAML) continues to offer pension products to meet the needs of both individual clients who want to save for their retirement during their working years and Institutional clients that want to contribute on behalf of their employees to help them build their retirement pot. To more about our pension schemes, kindly get in touch with us through pensions@cytonn.com;
Money Markets, T-Bills Primary Auction:
This week, T-bills were oversubscribed for the fifth consecutive week, with the overall subscription rate coming in at 166.1%, higher than the subscription rate of 101.1% recorded the previous week. Investors’ preference for the shorter 91-day paper persisted, with the paper receiving bids worth Kshs 15.3 bn against the offered Kshs 4.0 bn, translating to a subscription rate of 383.1%, significantly higher than the subscription rate of 46.7%, recorded the previous week. The subscription rates for the 182-day paper and 364-day paper increased to 26.0% and 219.3% respectively from the 15.6% and 208.2% recorded the previous week. The government accepted a total of Kshs 39.8 bn worth of bids out of Kshs 39.8 bn bids received, translating to an acceptance rate of 99.98%. The yields on the government papers recorded a mixed performance with the yields on the 182-day paper decreasing the most by 10.7 bps to 7.8% from the 7.9% recorded the previous week, while the 91-day paper decreased by 1.8 bps to 7.79% from the 7.81% recorded the previous week. The yield on the 364-day paper increased by 0.5 bps to 9.4% from the 9.3% recorded the previous week.
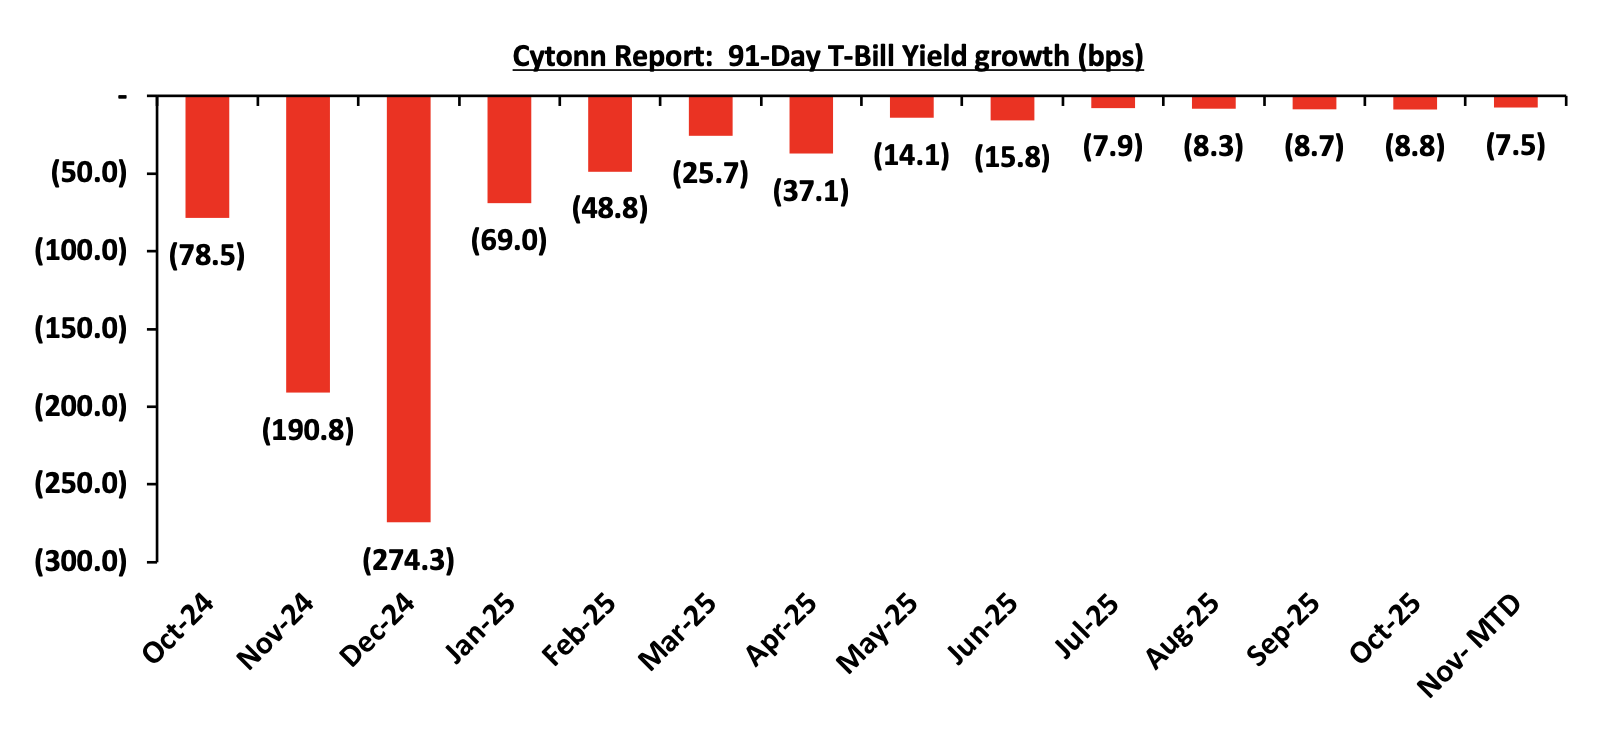
The chart below shows the yield growth rate for the 91-day paper in the year to October 2025 and November month-to-date:
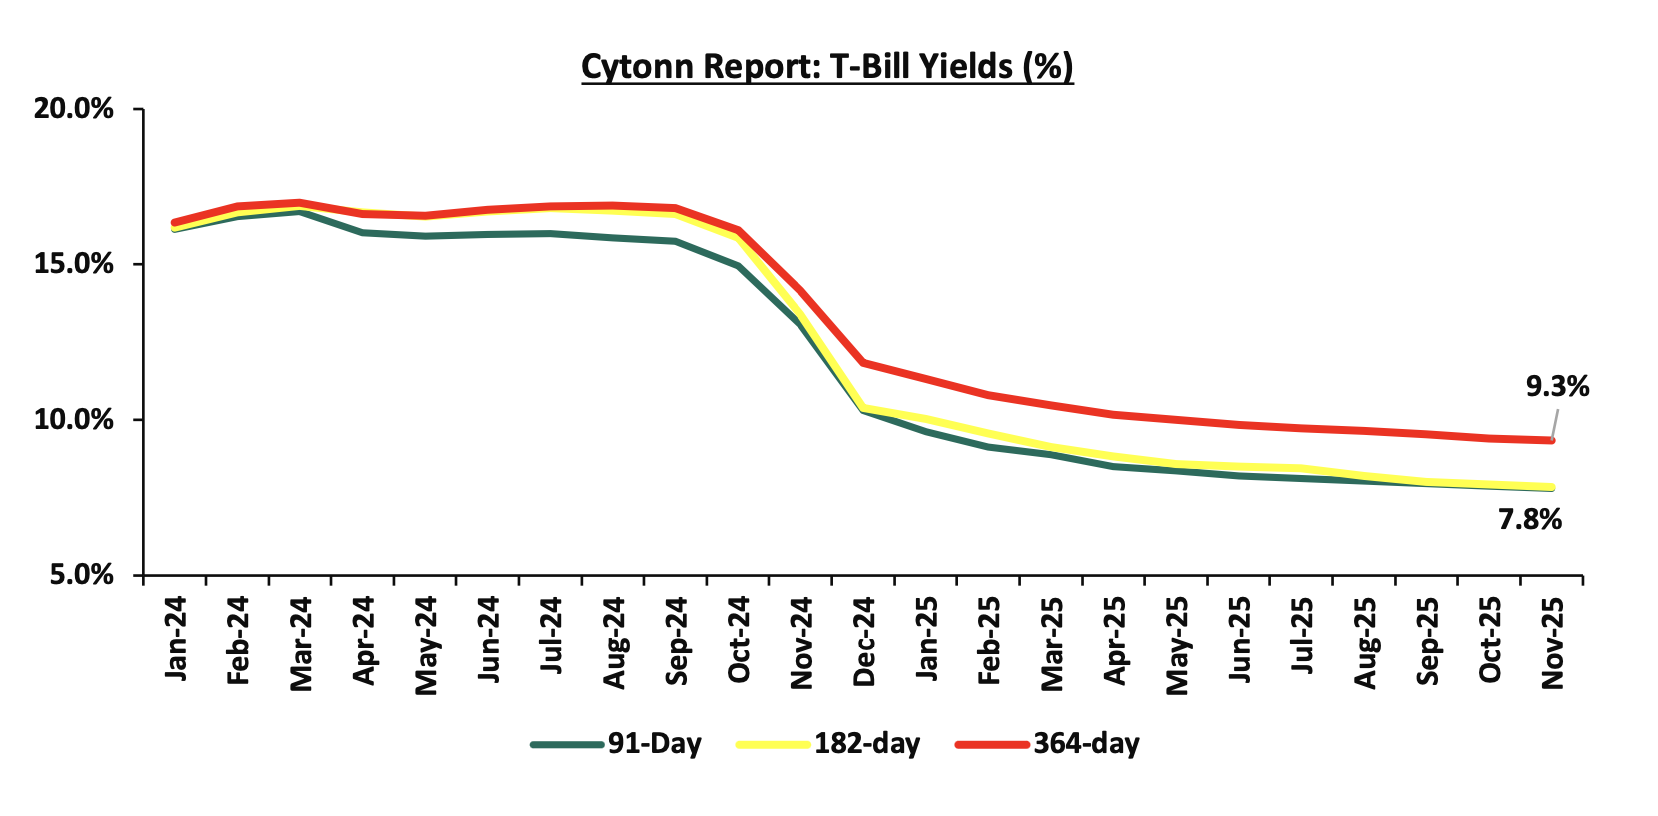
The charts below show the performance of the 91-day, 182-day and 364-day papers from January 2024 to November 2025:
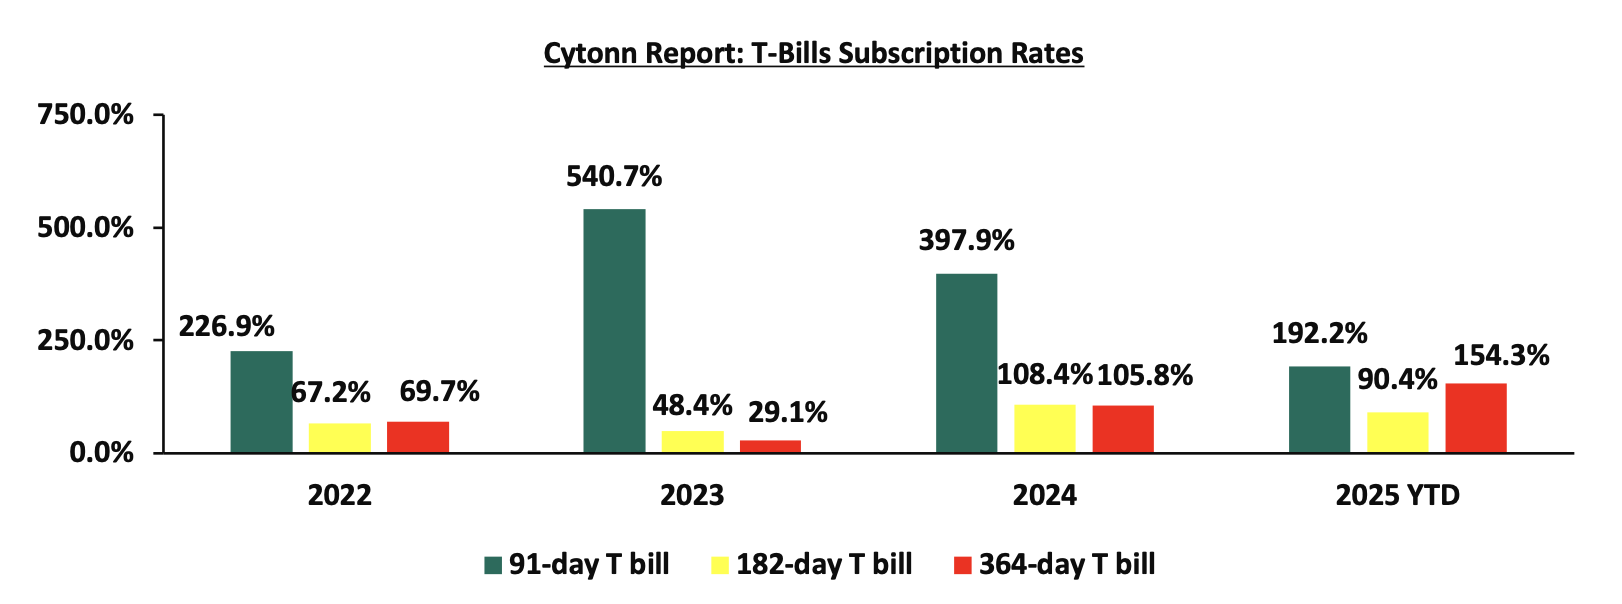
The chart below compares the overall average T-bill subscription rates obtained in 2022,2023, 2024 and 2025 Year-to-date (YTD):
The Central Bank of Kenya released the auction results for the re-opened treasury bonds FXD1/2012/020 and FXD1/2022/015 with tenors to maturities of 7.0 years and 11.4 years respectively and fixed coupon rates of 12.0% and 13.9% respectively. The bonds were oversubscribed, with the overall subscription rate coming in at 232.3%, receiving bids worth Kshs 92.9 bn against the offered Kshs 40.0 bn. The government accepted bids worth Kshs 52.8 bn, translating to an acceptance rate of 56.9%. The weighted average yields for the accepted bids for the FXD1/2012/020 and FXD1/2022/015 came in at 12.5% and 13.3% respectively. Notably, the 12.5% and 13.3% on the FXD1/2012/020 and FXD1/2022/015 is lower than the 13.6% and 13.9% respectively recorded the last time they were reopened in May 2025. With the Inflation rate at 4.6% as of October 2025, the real returns of the FXD1/2012/020 and FXD1/2022/015 are 7.9% and 8.7%. Given the 10.0% withholding tax on the bonds, the tax equivalent yields for shorter term bonds with 15.0% withholding tax are 13.2% and 14.1% for the FXD1/2012/020 and FXD1/2022/015 respectively.
Money Market Performance:
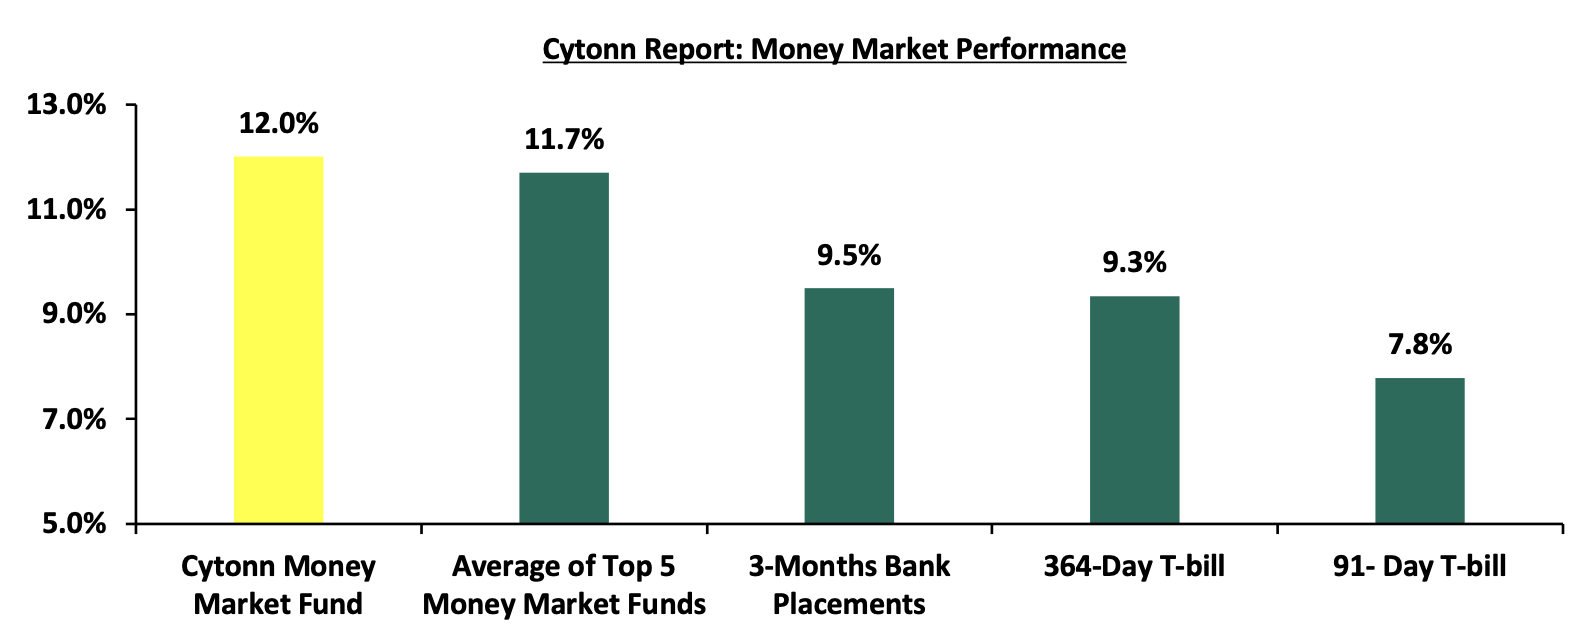
In the money markets, 3-month bank placements ended the week at 9.5% (based on what we have been offered by various banks). The yields on the 91-day paper decreased by 1.8 bps to 7.79% from 7.81% recorded the previous week while the yields on the 364-day paper increased by 0.5 bps to remain relatively unchanged from the 9.3% recorded the previous week and the yield on the Cytonn Money Market Fund decreased by 14.0 bps to 12.0% from 12.2% recorded in the previous week, while the average yields on the Top 5 Money Market Funds decreased by 2.6 bps to remain relatively unchanged from the 11.7% recorded the previous week.
The table below shows the Money Market Fund Yields for Kenyan Fund Managers as published on 7th November 2025:
|
Money Market Fund Yield for Fund Managers as published on 7th November 2025 |
||
|
Rank |
Fund Manager |
Effective Annual Rate |
|
1 |
Nabo Africa Money Market Fund |
12.0% |
|
2 |
Cytonn Money Market Fund (Dial *809# or download Cytonn App) |
12.0% |
|
3 |
Etica Money Market Fund |
11.7% |
|
4 |
Lofty-Corban Money Market Fund |
11.6% |
|
5 |
Orient Kasha Money Market Fund |
11.2% |
|
6 |
Enwealth Money Market Fund |
11.2% |
|
7 |
Ndovu Money Market Fund |
11.1% |
|
8 |
Kuza Money Market fund |
10.9% |
|
9 |
Gulfcap Money Market Fund |
10.9% |
|
10 |
Arvocap Money Market Fund |
10.8% |
|
11 |
Old Mutual Money Market Fund |
10.8% |
|
12 |
British-American Money Market Fund |
10.5% |
|
13 |
Jubilee Money Market Fund |
10.3% |
|
14 |
Faulu Money Market Fund |
10.2% |
|
15 |
Madison Money Market Fund |
10.1% |
|
16 |
GenAfrica Money Market Fund |
10.0% |
|
17 |
Dry Associates Money Market Fund |
9.8% |
|
18 |
Apollo Money Market Fund |
9.6% |
|
19 |
CPF Money Market Fund |
9.4% |
|
20 |
KCB Money Market Fund |
9.4% |
|
21 |
Sanlam Money Market Fund |
9.2% |
|
22 |
Mali Money Market Fund |
8.9% |
|
23 |
ICEA Lion Money Market Fund |
8.7% |
|
24 |
CIC Money Market Fund |
8.5% |
|
25 |
Mayfair Money Market Fund |
8.3% |
|
26 |
Genghis Money Market Fund |
8.3% |
|
27 |
Co-op Money Market Fund |
8.3% |
|
28 |
Absa Shilling Money Market Fund |
7.9% |
|
29 |
AA Kenya Shillings Fund |
7.0% |
|
30 |
Ziidi Money Market Fund |
6.4% |
|
31 |
Stanbic Money Market Fund |
6.4% |
|
32 |
Equity Money Market Fund |
5.0% |
Source: Business Daily
Liquidity:
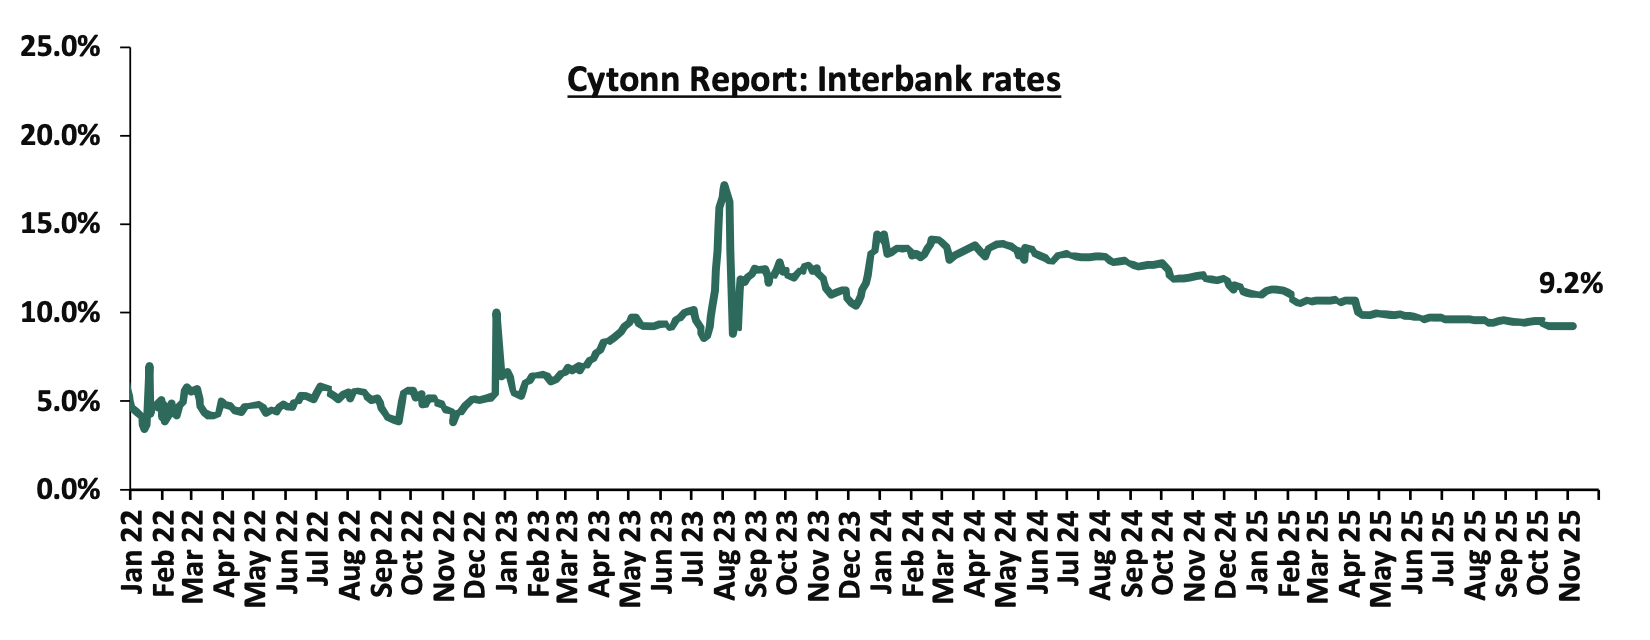
During the week, liquidity in the money markets eased with the average interbank rate decreasing by 1.1 bps to 9.2% from 9.3% recorded the previous week, partly attributable to government payments that offset tax remittances. The average interbank volumes traded decreased by 38.9% to Kshs 6.9 bn from Kshs 11.3 bn recorded the previous week. The chart below shows the interbank rates in the market over the years:
Kenya Eurobonds:
During the week, the yields on the Eurobonds were on an upward trajectory with the yield on the 13-year Eurobond issued in 2021 increasing the most by 19.9 bps to 8.6% from 8.4% recorded the previous week. The table below shows the summary performance of the Kenyan Eurobonds as of 6th November 2025;
|
Cytonn Report: Kenya Eurobond Performance |
|||||||
|
|
2018 |
2019 |
2021 |
2024 |
2025 |
||
|
Tenor |
10-year issue |
30-year issue |
7-year issue |
12-year issue |
13-year issue |
7-year issue |
11-year issue |
|
Amount Issued (USD) |
1.0 bn |
1.0 bn |
0.9 bn |
1.2 bn |
1.0 bn |
1.5 bn |
1.5 bn |
|
Years to Maturity |
2.5 |
22.5 |
1.7 |
6.7 |
8.8 |
5.5 |
10.5 |
|
Yields at Issue |
7.3% |
8.3% |
7.0% |
7.9% |
6.2% |
10.4% |
9.9% |
|
2-Jan-25 |
9.1% |
10.3% |
8.5% |
10.1% |
10.1% |
10.1% |
|
|
3-Nov-25 |
6.0% |
9.2% |
- |
8.1% |
8.4% |
7.8% |
|
|
30-Oct-25 |
6.0% |
9.2% |
- |
8.1% |
8.4% |
7.8% |
|
|
31-Oct-25 |
5.9% |
9.1% |
- |
8.1% |
8.4% |
7.7% |
|
|
3-Nov-25 |
6.0% |
9.2% |
- |
8.1% |
8.4% |
7.8% |
|
|
4-Nov-25 |
6.1% |
9.3% |
- |
8.2% |
8.5% |
7.9% |
|
|
5-Nov-25 |
6.1% |
9.3% |
- |
8.2% |
8.5% |
7.9% |
|
|
6-Nov-25 |
6.1% |
9.3% |
- |
8.2% |
8.6% |
7.9% |
|
|
Weekly Change |
0.1% |
0.1% |
- |
0.2% |
0.2% |
0.2% |
- |
|
MTD Change |
0.1% |
0.1% |
- |
0.1% |
0.2% |
0.1% |
- |
|
YTD Change |
(3.0%) |
(1.0%) |
- |
(1.8%) |
(1.5%) |
(2.2%) |
- |
Source: Central Bank of Kenya (CBK) and National Treasury
Kenya Shilling:
During the week, the Kenya Shilling depreciated marginally against the US Dollar by 0.02 bps, to close the week at Kshs 129.2, remaining relatively unchanged from the previous week. On a year-to-date basis, the shilling has appreciated by 5.1 bps against the dollar, lower than the 17.6% appreciation recorded in 2024.
We expect the shilling to be supported by:
- Diaspora remittances standing at a cumulative USD 5,080.0 mn in the twelve months to September 2025, 7.6% higher than the USD 4,722.6 mn recorded over the same period in 2024.These has continued to cushion the shilling against further depreciation. In the September 2025 diaspora remittances figures, North America remained the largest source of remittances to Kenya accounting for 58.6% in the period,
- The tourism inflow receipts which are projected to reach KSh 560.0 bn in 2025 up from KSh 452.2 bn in 2024 a 23.9% increase, and owing to tourist arrivals that improved by 9.9% to 2,424,382 in the 12 months to June 2025 from 2,206,469 in the 12 months to June 2024, and,
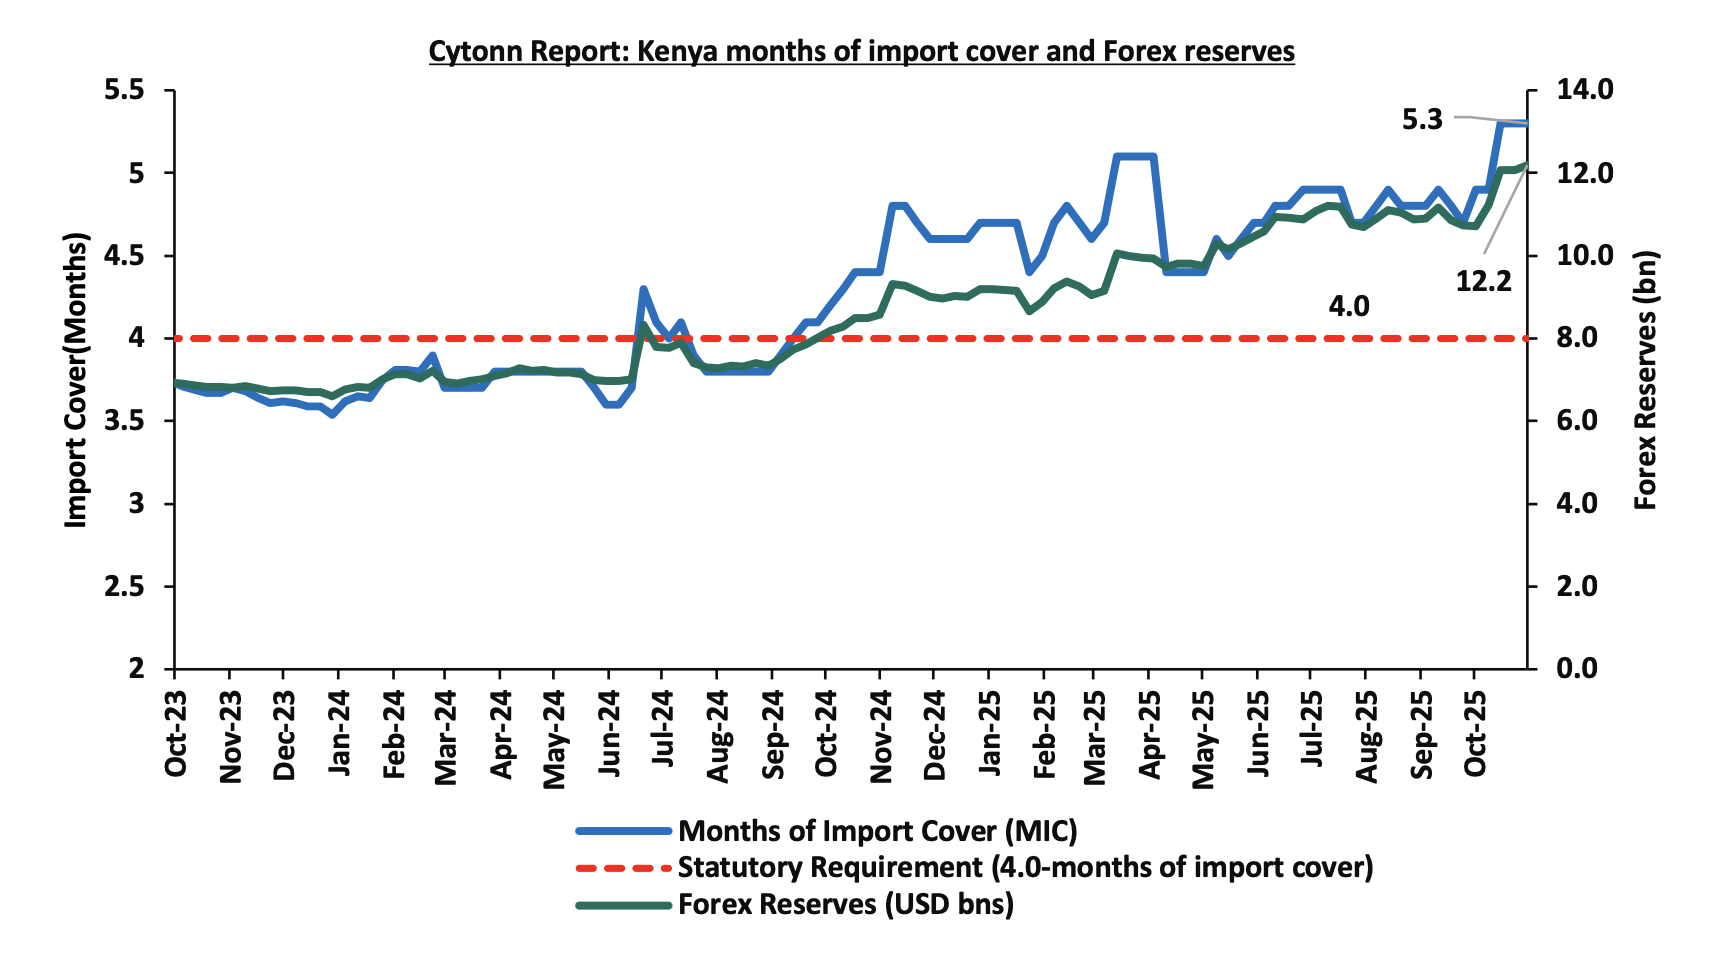
- Improved forex reserves currently at USD 12.2 bn (equivalent to 5.3-months of import cover), which is above the statutory requirement of maintaining at least 4.0-months of import cover and above the EAC region’s convergence criteria of 4.5-months of import cover.
The shilling is however expected to remain under pressure in 2025 as a result of:
- An ever-present current account deficit which came at 2.1% of GDP in the twelve months to August 2025, and,
- The need for government debt servicing, continues to put pressure on forex reserves given that 59.7% of Kenya’s external debt is US Dollar-denominated as of June 2025.
Kenya’s forex reserves decreased by 0.3% during the week to remain relatively unchanged from the USD 12.2 bn recorded the previous week, equivalent to 5.3 months of import cover, and above the statutory requirement of maintaining at least 4.0-months of import cover.
The chart below summarizes the evolution of Kenya's months of import cover over the years:
Weekly Highlights
- Stanbic Bank’s October 2025 Purchasing Manager’s Index (PMI)
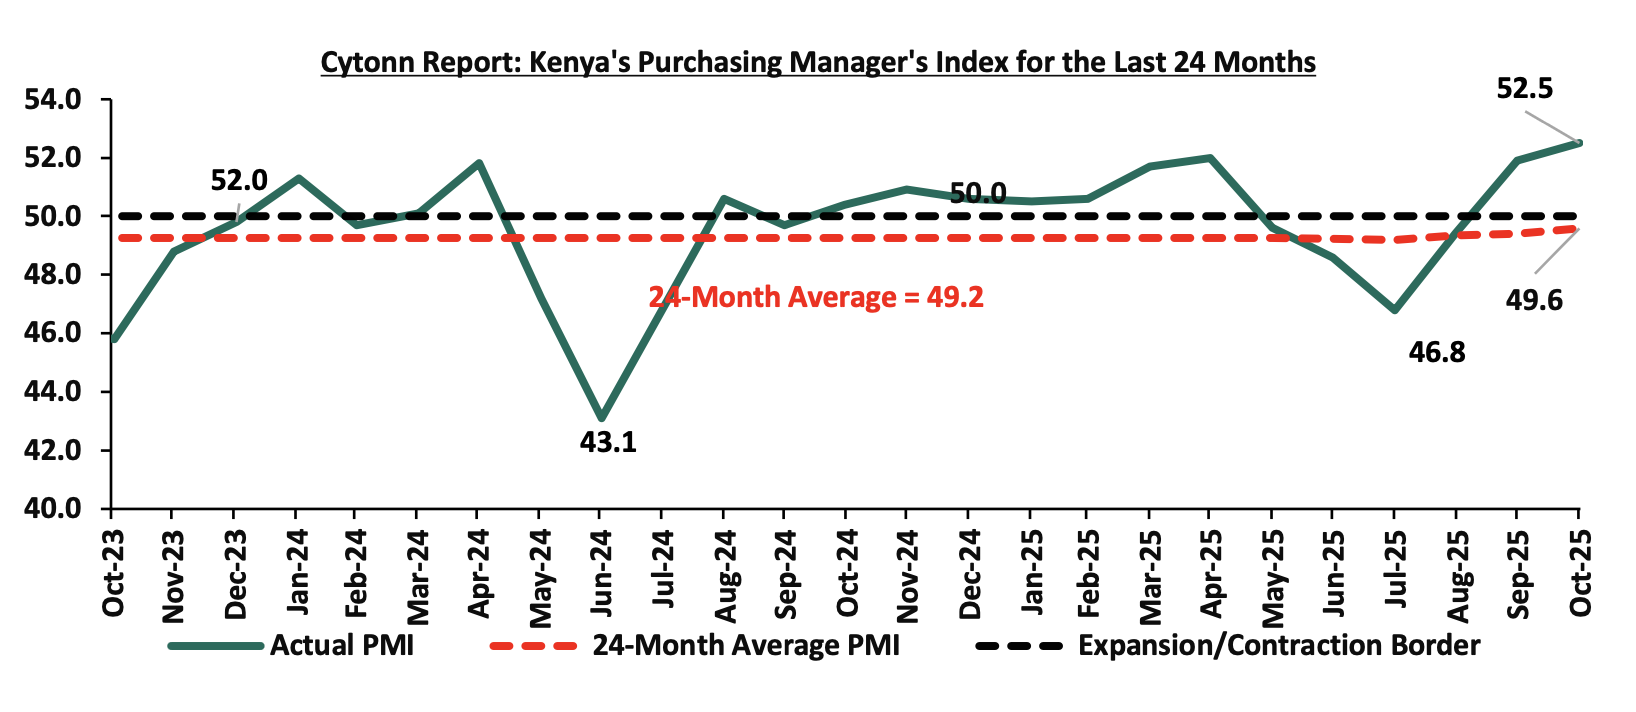
Stanbic Bank released its monthly Purchasing Manager's Index (PMI) highlighting that the index for the month of October 2025 improved further into expansion territory, coming in at 52.5, up from 51.9 in September 2025, marking the second consecutive month the index remained above the 50.0 neutral mark, signaling an improvement in business conditions, mainly attributable to increased output and new orders. On a year-to-year basis, the index recorded 2.1% points increase from the 50.4 recorded in October 2024, indicating an improvement in business conditions compared to the same period last year. The improvement was largely driven by a faster pace of growth in output and new orders, as firms benefited from robust demand, promotional pricing and new product launches. Input prices rose marginally but at the slowest rate in 13 months, with inflation rate stabilizing at 4.6% as of October 2025 and improved supply chain efficiency, while output charges increased modestly as firms sought to maintain competitiveness and support sales.
In October, business output continued to expand, marking the second consecutive month of growth. Firms reported stronger demand conditions, with all main sectors monitored by the survey including manufacturing, services, wholesale & retail, and agriculture recording an upturn in activity. New business intakes increased for the second consecutive month, attributed to higher customer demand, favorable economic conditions, and successful promotional campaigns, while some businesses also reported gains from new client acquisitions. Inventory restocking and broad-based sectoral expansion helped reinforce the overall upturn.
Employment levels remained stable in October, with most firms maintaining their workforce to sustain operations and clear outstanding orders. This followed September’s strengthened hiring activity, when job creation had reached its fastest pace since May 2023. Backlogs of work shrank, indicating that firms were able to reduce unfinished orders amid improved operational efficiency and quicker deliveries.
Purchasing activity increased in October, marking the first rise since April 2025, as firms boosted input procurement to meet rising demand and replenish stocks. Consequently, inventories expanded as businesses prepared for anticipated future orders. Supplier delivery times continued to shorten for the ninth consecutive month, as vendors remained highly responsive, reflecting increased competition and improved efficiency in the supply chain.
Input prices rose only marginally, marking the slowest pace of inflation in over a year. The moderation was driven by lower purchase and staff cost inflation, amid subdued input demand in previous months. Businesses mainly attributed the modest increases to rising import prices and higher taxes, including fuel duties and VAT adjustments. Output prices increased slightly as well, led by the wholesale and retail sector, though several firms continued to offer discounts to attract customers, keeping pricing pressures mild.
Going forward, we anticipate that the business environment will remain supportive in the short to medium term as a result of the strengthening economic environment, driven by lower inflationary pressures, improving political stability, and a more accommodative monetary policy stance by the Central Bank of Kenya (CBK) following the Monetary Policy Committee’s decision to ease the Central Bank Rate (CBR) to 9.25% in October 2025 from 9.50% in August 2025. However, we expect businesses to be weighed down by high fuel prices, elevated taxation, and subdued consumer purchasing power, which are set to constrain profit margins and overall growth. Overall, the private sector is expected to continue its recovery, albeit with potential headwinds in the coming months.
Rates in the Fixed Income market have been on a downward trend due to high liquidity in the money market which allowed the government to front load most of its borrowing. The government is 59.4% ahead of its prorated net domestic borrowing target of Kshs 230.2 bn, having a net borrowing position of Kshs 366.8 bn (inclusive of T-bills). However, we expect a stabilization of the yield curve in the short and medium term, with the government looking to increase its external borrowing to maintain the fiscal surplus, hence alleviating pressure in the domestic market. As such, we expect the yield curve to stabilize in the short to medium-term and hence investors are expected to shift towards the long-term papers to lock in the high returns
Market Performance:
During the week, the equities market was on an upward trajectory, with NSE 10, NSE 20, NSE 25 and NASI gaining by 5.3%, 4.4%, 4.2% and 2.0% respectively, taking the YTD performance to gains of 58.1%, 53.2%, 51.6% and 50.6% of NSE 20, NASI, NSE 10 and NSE 25 respectively. The equities market performance was mainly driven by gains recorded by large-cap stocks such as KCB, ABSA and DTB-K, of 13.8%, 12.4% and 9.8%, respectively. The performance was, however, weighed down by losses by large cap stocks such as NCBA, Safaricom and Stanbic of 3.4%, 2.5% and 0.6%.
During the week, the banking sector index increased by 38.3% to close at 210.3 from the 152.1 recorded the previous week. This was attributable to gains recorded by stocks such as KCB, ABSA and DTB-K of 13.8%, 12.4% and 9.8% respectively. The performance was, however, held down by losses recorded by stocks such as NCBA and Stanbic of 3.4% and 0.6% respectively.
During the week, equities turnover increased by 39.4% to USD 27.9 mn from USD 20.0 mn recorded the previous week, taking the YTD turnover to USD 900.0 mn. Foreign investors remained net sellers for the fifth consecutive week, with a net selling position of USD 9.2 mn, from a net selling position of USD 1.3 mn recorded the previous week, taking the YTD net selling position to USD 78.8 mn.
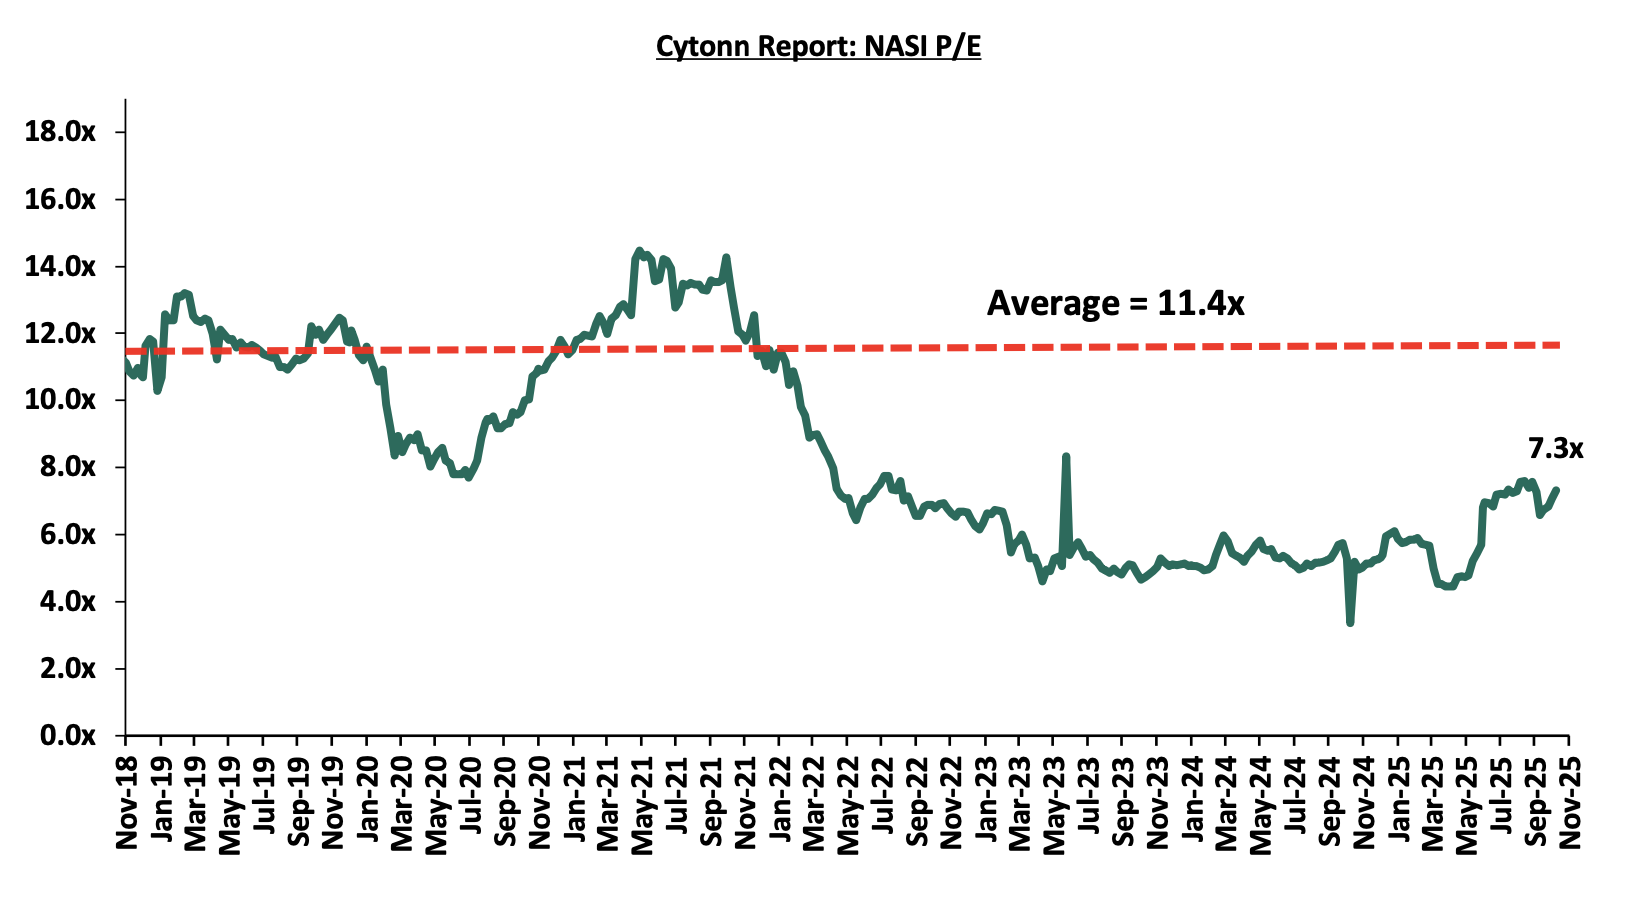
The market is currently trading at a price to earnings ratio (P/E) of 7.3x, 35.7% below the historical average of 11.4x, and a dividend yield of 5.2%, 0.5% points above the historical average of 4.7%. Key to note, NASI’s PEG ratio currently stands at 0.9x, an indication that the market is slightly undervalued relative to its future growth. A PEG ratio greater than 1.0x indicates the market may be overvalued while a PEG ratio less than 1.0x indicates that the market is undervalued.
The charts below indicate the historical P/E and dividend yields of the market;

Universe of Coverage:
|
Cytonn Report: Equities Universe of Coverage |
||||||||||
|
Company |
Price as at 31/10/2025 |
Price as at 7/11/2026 |
w/w change |
YTD Change |
Year Open 2025 |
Target Price* |
Dividend Yield |
Upside/ Downside** |
P/TBv Multiple |
Recommendation |
|
Diamond Trust Bank |
105.00 |
115.25 |
9.8% |
72.7% |
66.8 |
128.3 |
6.1% |
17.4% |
0.4x |
Accumulate |
|
Standard Chartered Bank |
303.00 |
311.50 |
2.8% |
9.2% |
285.3 |
314.1 |
14.4% |
15.3% |
1.8x |
Accumulate |
|
I&M Group |
43.90 |
45.95 |
4.7% |
27.6% |
36.0 |
48.2 |
6.5% |
11.4% |
0.8x |
Accumulate |
|
Stanbic Holdings |
196.00 |
194.75 |
(0.6%) |
39.4% |
139.8 |
194.8 |
10.6% |
10.7% |
1.2x |
Accumulate |
|
Britam |
8.66 |
8.80 |
1.6% |
51.2% |
5.8 |
9.5 |
0.0% |
8.2% |
0.8x |
Hold |
|
Jubilee Holdings |
320.00 |
323.75 |
1.2% |
85.3% |
174.8 |
312.9 |
4.2% |
0.8% |
0.5x |
Lighten |
|
ABSA Bank |
23.00 |
25.85 |
12.4% |
37.1% |
18.9 |
24.1 |
6.8% |
(0.1%) |
1.7x |
Sell |
|
NCBA |
88.00 |
85.00 |
(3.4%) |
66.7% |
51.0 |
79.0 |
6.5% |
(0.6%) |
1.4x |
Sell |
|
Co-op Bank |
21.10 |
22.90 |
8.5% |
31.2% |
17.5 |
21.1 |
6.6% |
(1.1%) |
0.8x |
Sell |
|
KCB Group |
61.50 |
70.00 |
13.8% |
65.1% |
42.4 |
63.6 |
4.3% |
(4.9%) |
0.9x |
Sell |
|
Equity Group |
66.25 |
69.75 |
5.3% |
45.3% |
48.0 |
61.2 |
6.1% |
(6.2%) |
1.2x |
Sell |
|
CIC Group |
4.64 |
4.79 |
3.2% |
123.8% |
2.1 |
4.0 |
2.7% |
(13.2%) |
1.3x |
Sell |
Weekly Highlights
- Safaricom H1’2026 Financial Performance
During the week, Safaricom Plc released its H1’2026 financial results for the period ending 30th September 2025, highlighting that the profit after tax (PAT) for the Group increased by 191.5% to Kshs 29.2 bn, from Kshs 10.0 bn recorded in H1’2025. The strong performance was largely attributable to a 9.6% decrease in operating expenses to Kshs 103.4 bn from Kshs 114.4 bn recorded in H1’2025, an 8.1% growth in total revenue to Kshs 204.7 bn from Kshs 189.4 bn, a 9.4% reduction in net finance costs to Kshs 9.9 bn from Kshs 10.9 bn, and a 23.2% points decrease in the effective tax rate to 47.2% in H1’2026 from 70.4% in H1’2025.
The tables below show the breakdown of the group’s financial statements from the report;
|
Cytonn Report: Safaricom PLC Income Statement |
|||
|
Item (All figures in Bns) |
HY'2025 |
HY'2026 |
y/y change |
|
Total Revenue |
189.4 |
204.7 |
8.1% |
|
Operating costs |
(114.4) |
(103.4) |
(9.6%) |
|
EBITDA |
75.1 |
101.3 |
34.9% |
|
EBITDA Margin |
39.6% |
49.5% |
9.8% |
|
Depreciation & Amortization |
(32.9) |
(36.1) |
9.8% |
|
Operating Profit |
42.2 |
65.2 |
54.5% |
|
Net Finance Costs |
(10.9) |
(9.9) |
(9.4%) |
|
Profit Before Tax |
33.9 |
55.2 |
63.1% |
|
Profit After Tax |
10.0 |
29.2 |
191.5% |
|
Earnings Per Share |
0.70 |
1.07 |
52.9% |
|
Cytonn Report: Safaricom PLC Balance Sheet |
|||
|
Item (All figures in Bns) |
HY'2025 |
HY'2026 |
y/y change |
|
Current Assets |
74.3 |
89.6 |
20.5% |
|
Non-Current Assets |
408.8 |
419.0 |
2.5% |
|
Total Assets |
483.1 |
508.6 |
5.3% |
|
Current Liabililities |
158.4 |
162.8 |
2.8% |
|
Non-Current Liabilities |
135.1 |
130.1 |
(3.6%) |
|
Total liabilities |
293.5 |
293.0 |
(0.2%) |
|
Shareholder funds |
155.3 |
184.4 |
18.7% |
|
Minority Interest |
34.3 |
31.2 |
(9.0%) |
|
Total Equity |
189.7 |
215.6 |
13.7% |
Key take outs from the report include;
- Total revenue increased by 8.1% to Kshs 204.7 bn in H1’2026, from Kshs 189.4 bn in H1’2025, mainly attributable to the 11.1% increase in service revenue to Kshs 199.9 bn in H1’2026, from Kshs 179.9 bn in H1’2025. Notably, MPESA revenue increased by 14.0% to Kshs 88.1 bn, from Kshs 77.2 bn in H1’2025,
- Voice revenue for the group increased by 0.5% to Kshs 41.1 bn, from Kshs 40.9 bn in H1’2025, while mobile data revenue increased by 18.2% to Kshs 44.4 bn, from Kshs 37.6 bn in H1’2025.
- Earnings before interest, taxes, depreciation and amortization (EBITDA) increased by 34.9% to 101.3 bn in HY’2026 from 75.1 bn in HY’2025, owing to a 9.6% decrease in operating costs to Kshs 103.4 bn in HY’2026, from Kshs 114.4 bn in HY’2025, coupled with the 8.1% increase in total revenue. As such, EBITDA margin recorded 9.8% points increase to 49.5% in HY’2026 from 39.6% in HY’2025,
- Ethiopian subsidiary recorded a 22.7% decrease in net losses after tax to Kshs 29.0 bn from a net loss of Kshs 37.5 bn in H1’2025, while the Kenyan business recorded a 22.6% increase in net profits to Kshs 58.2 bn, from 47.5 bn in H1’2025. As such, the Group recorded a 191.5% increase in net profit to Kshs 29.2 bn in H1’2026, from Kshs 10.0 bn in H1’2025,
- The balance sheet recorded an expansion as total assets increased by 5.3% to Kshs 508.6 bn, from Kshs 483.1 bn in H1’2025, mainly driven by a 20.5% increase in current assets to Kshs 89.6 bn, from Kshs 74.3 bn in H1’2025,
- The Group’s customers grew by 19.7% to 62.3 mn from 52.0 mn in H1’2025, while Safaricom’s market share in Kenya declined to 65.1% as of June 2025, from 65.4% recorded same period last year.
Additionally, its Ethiopian subsidiary recorded a total revenue of Kshs 6.4 bn, with service revenue coming at Kshs 6.2 bn and operating cost at Kshs 18.9 bn leading to a loss after tax of Kshs 29.0 bn which weighed down on the group’s overall performance.
Safaricom’s core earnings per share increased by 52.9% to Kshs 1.1 in H1’2026, from Kshs 0.7 in H1’2025, Safaricom continues to remain a strong long-term proposition, owing to its 65.1% of market share in Kenya and over 97.0% market share in mobile money subscribers through M-Pesa, with M-Pesa recording a 13.3% year on year growth in one-month active customers to 37.9 mn in H1’2026. Additionally, the Ethiopian subsidiary is expected to gain further traction with the firm expecting to tap into Ethiopian market with a population of more than 133.2 mn people. However, while the adverse macroeconomic environment and continued depreciation of the Ethiopian Birr against the US dollar are expected to weigh on the Group’s overall performance during this period of aggressive network expansion in Ethiopia, it is notable that Ethiopia is no longer classified as a hyperinflationary economy under IAS 29 as of 30 June 2025. This follows a sustained decline in inflation indicators, marking a significant step toward macroeconomic stability and the conclusion of hyperinflationary accounting for Safaricom’s Ethiopian operations, be it with some residual effects that will unwind over time.
- KCB Group Plc Proposed Acquisition of Pesapal Limited
During the week, KCB Group Plc revealed it entered into an agreement for a proposed acquisition of an undisclosed minority stake in Pesapal Limited which in 2021 was granted a Payment Service Provider (PSP) Licence by the Central Bank of Kenya which allowed Pesapal to carry out Payment Gateway Services in compliance with the National Payment System Act, 2011. This move proves to be strategic as KCB strives to capture the biggest market share of the fast-growing fintech market. This also comes after their recent 75.0% majority stake acquisition of Riverbank Solutions, which was valued at Kshs 2.0 bn. The table below shows past acquisitions by KCB Group;
|
Cytonn Report: Past Acquisitions by KCB Group |
|||||
|
Bank Acquired |
Book Value at Acquisition (Kshs bn) |
Transaction stake |
Transaction value (Kshs bn) |
P/Bv Multiple |
Date |
|
Trust Merchant Bank |
12.4 |
85.0% |
15.7 |
1.5x |
Dec-22 |
|
Banque Populaire du Rwanda |
5.3 |
100.0% |
5.6 |
1.1x |
Aug-21 |
|
ABC Tanzania** |
Unknown |
100.0% |
0.8 |
0.4x |
Nov-20 |
|
National Bank of Kenya |
7.0 |
100.0% |
6.6 |
0.9x |
Sep-19 |
|
Imperial Bank |
Unknown |
Undisclosed |
Undisclosed |
N/A |
Dec-18 |
**Deals that were dropped
The graph below shows revenue in 2024 from KCB Group subsidiaries:
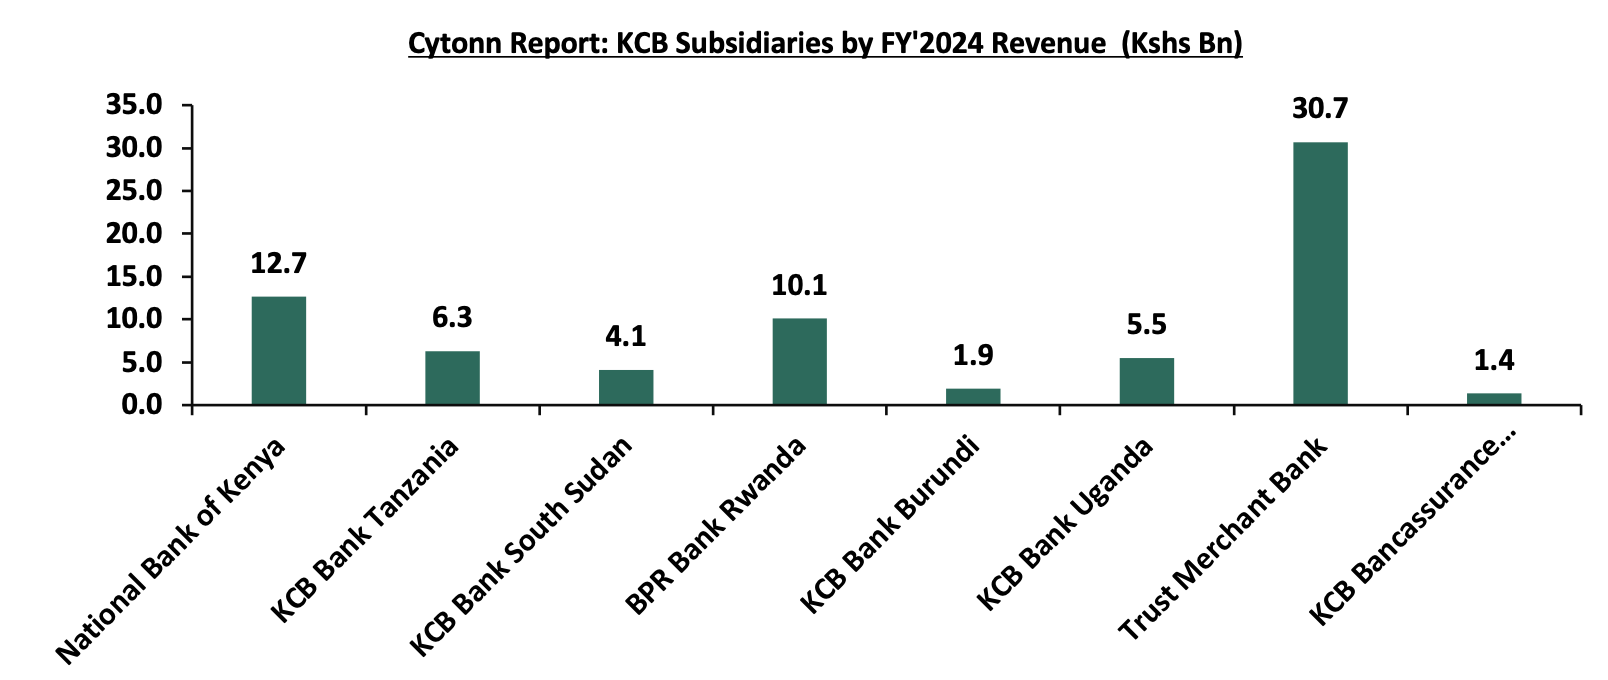
Source: KCB Group 2024 Annual Report
The graph below shows from KCB Group’s total assets over the last five years:
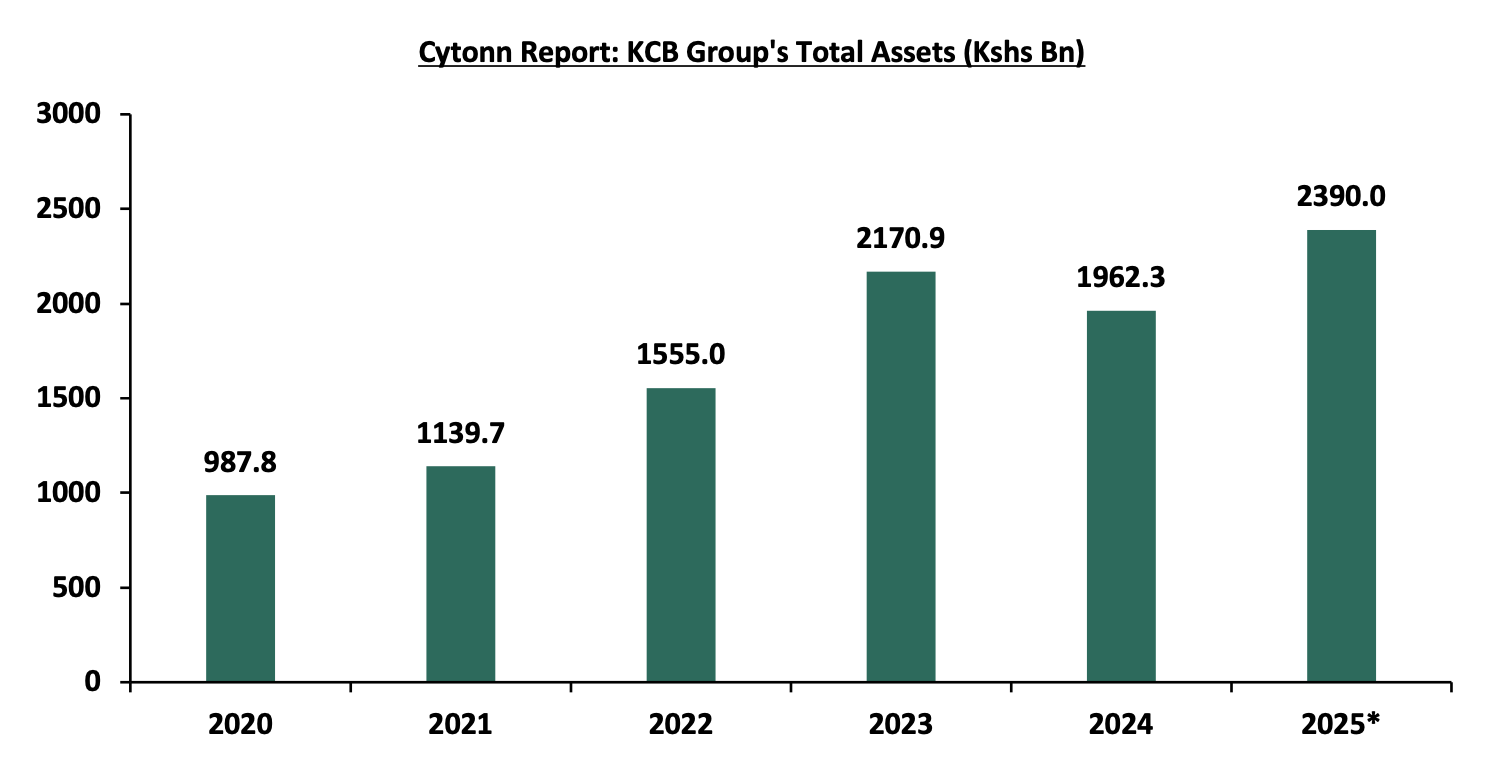
Source: KCB Group Financials, *2025 data as of H1’2025
The deal awaits regulatory clearance from the Central Bank of Kenya, after which KCB Group will become a minority shareholder in PesaPal Limited. Moreover, this acquisition proves to be a good fit for KCB Bank, given that 99.0% of their transactions by number have been conducted through non-branch channels. Financially, KCB demonstrated robust growth, posting a 64.9% year-on-year increase in profit to Kshs. 61.8 bn for the FY’2024 underpinned by business expansion, with its balance sheet reaching Kshs. 2.0 tn despite industry headwinds. This acquisition is poised to solidify KCB’s competitive standing and elevate customer value through advanced financial technology solutions.
We are “Bullish” on the Equities markets in the short term due to current cheap valuations, lower yields on short-term government papers and expected global and local economic recovery, and, “Neutral” in the long term due to persistent foreign investor outflows. With the market currently trading at a discount to its future growth (PEG Ratio at 0.9x), we believe that investors should reposition towards value stocks with strong earnings growth and that are trading at discounts to their intrinsic value. We expect the current high foreign investors sell-offs to continue weighing down the economic outlook in the short term.
- Industry Report
- Hass Consult Land and property price index
During the week, Hass Consult, a Kenyan consulting and Real Estate development firm, released its Property Index Q3’2025 Report , focusing on the residential Real Estate sector's performance in the Nairobi Metropolitan Area (NMA). The following are the key take outs from the report;
- The average selling prices for all properties posted a 1.1% increase on a quarter-on-quarter (q/q) basis in Q3’2025,2.7% points decrease from 3.8% recorded in Q2’2025. The performance was largely driven by increased activity in detached housing, for example, in Runda, where house prices rose 4.0% in 12 weeks, up 15.3% on the year, and in Athi River, where the rise accelerated to 4.3% in the third quarter, achieving 4.9% for the year.
- On a year-on-year (y/y) basis, property prices recorded a robust 8.2% growth, 0.1% points decrease from 8.3% in Q3’2024, reflecting growing confidence and improved demand across key market segments. Detached houses posted the highest quarterly growth at 1.2%, followed by apartments at 0.8%, and semi-detached houses at 0.7%. This trend underscores a continued buyer preference for more spacious and independent housing, especially in satellite towns that offer greater affordability, enhanced living standards and infrastructure upgrades. The rise in property prices further increased the cost of financing home purchases, exerting pressure on buyers amid elevated interest rates. While market volatility in Q3’2024 driven by inflationary uncertainty had previously dampened pricing momentum, Q3’2025 points to a broad-based recovery. Developers are facing elevated construction costs driven by persistent global supply challenges and high material prices, particularly for cement and steel. These increased expenses are being passed on to homebuyers, reinforcing the 1.2% q/q price surge in detached units.
- The average asking rents of housing units in the Nairobi Metropolitan Area during Q3’2025 contracted by 1.6% quarter‑on‑quarter basis, a further decline from the 0.2% decrease seen in Q2’2025. Rents for detached houses fell by 4.1%, and semi‑detached units increased by 1.6%, while apartment rents rose by about 0.3%, driven by strong demand in high‑occupancy areas such as Kiambu, which recorded a 5.5% increase. Overall, landlords deferred rent hikes to maintain occupancy in a more price‑sensitive environment.
- On an annual basis, houses in Kiambu had the highest rental price increase at 17.1%, followed by Ruiru at 16.7% and Limuru at 13.1%, reflecting strong demand in satellite towns. However, Muthaiga registered the steepest annual rental price drop at 8.1%. The overall rental trends reflect shifting demand, with increased tenant preference for apartments in affordable, high-density areas, while detached and semi-detached units face pressure from pricing sensitivity and changing renter priorities.
- In Nairobi’s suburbs, property in Ridgeways posted the highest quarterly sales price increase at 4.2%, driven by continued demand supported by high-end developments and robust infrastructure. In contrast, apartments in Langata recorded a quarterly price decline of 1.2%, and an annual decrease of 2.1%, making them the weakest-performing segment. Likewise, Gigiri saw an annual apartment rent drop of 6.1%, while Kitisuru and Westlands recorded significant rental declines of 3.1% and 1.7%, respectively. These trends underscore a shift in tenant and buyer preferences toward satellite towns offering greater value and similar amenities at more competitive prices.
- In the satellite towns, Juja posted the highest year-on-year price appreciation at 13.4% in Q3’2025, down from 13.8% in Q2’2025, marking a continued strong upward trend. This surge is attributed to: (i) excellent connectivity via the Thika Superhighway, (ii) a growing preference among the middle class to settle and raise families in the area, (iii) proximity to major retail hubs such as Unicity Mall and Juja City Mall, and (iv) access to key amenities including Jomo Kenyatta University of Agriculture and Technology (JKUAT) and nearby hospitals. On the other hand, Athi River recorded the only year-on-year price decline at 1.0% in Q3’2025, a reversal from 4.2% increase in Q2’2025, largely due to increased competition from similarly priced neighboring areas like Kitengela and Ongata Rongai, which are gaining favor due to improved infrastructure and a better residential environment. This divergence highlights how infrastructure, accessibility, and local amenities continue to shape real estate demand and pricing trends across Nairobi’s satellite towns.
- Among apartments in satellite towns, Kiambu registered the steepest decline, with a 1.9% quarter-on-quarter drop and a 4.4% year-on-year depreciation in Q3’2025, making it the worst-performing apartment node during the period. This subdued performance reflects elevated land prices, market saturation, and increasing competition from neighboring areas such as Ruaka and Gigiri, which offer superior amenities and better infrastructure access. In contrast, Mlolongo apartments posted a 4.3% q/q price increase and a 5.7% y/y gain, supported by its affordability, continued infrastructure upgrades including expanded access via the Nairobi Expressway, Mombasa road and proximity to key social amenities such as schools, shopping malls, and hospitals. These trends highlight shifting buyer and tenant preferences toward affordable, accessible, and well-serviced nodes in Nairobi’s metropolitan periphery.
The findings of the report are in line with our Cytonn Q3’2025 Markets Review, which highlighted that residential property prices in the Nairobi Metropolitan Area (NMA) appreciated by 1.1% year-on-year in the Q3’2025. This improvement reflects growing market activity and increased transaction volumes compared to Q3’2024, when price appreciation stood at just 0.7%. The uptick in pricing has been supported by stronger investor confidence, improved infrastructure in key nodes, and a shift in buyer preference towards more affordable and spacious developments, particularly in Nairobi’s satellite towns.
Hass Consult released Land Price Index Q3’2025 Report which highlighted the performance of the Real Estate land sector in the Nairobi Metropolitan Area (NMA). The following were the key take outs from the report;
- In Q3’2025, the average quarter-on-quarter selling prices for land in Nairobi suburbs increased by 1.2%, down from the 1.7% recorded in Q2’2025. On a year-on-year basis, land prices in the suburbs appreciated by 6.3%, a marginal decline from 6.9% recorded previously. Meanwhile, in Nairobi’s satellite towns, land prices grew by 0.8% q/q, down from 1.3% in Q2’2025 and posted a 6.7% y/y increase, lower than the 9.9% recorded in the previous quarter. This softening in satellite town growth suggests cooling momentum after the strong run in 2024. Despite this, the overall land market continues to demonstrate resilience, buoyed by improved infrastructure, expanding road networks, and steady demand from developers eyeing opportunities in residential, logistics, and mixed-use projects. Strategic corridors such as the Thika Superhighway, Eastern Bypass, and Nairobi Expressway remain key focal points for land acquisition as urban growth extends further into the Nairobi Metropolitan Area.
- In the Nairobi suburbs, Spring Valley recorded the highest quarter-on-quarter price gain at 3.6%, followed closely by Loresho at 2.9%. Apart from Muthaiga, all the other 17 suburbs tracked in the report recorded positive land price movement, albeit at varied rates. Growth in other suburbs remained more modest as buyers shifted focus to areas with better returns or lower entry prices. The performance of Spring Valley and Loresho reflects a broader market preference for low-density, amenity-rich neighborhoods where long-term capital appreciation is more likely.
- In the satellite towns, land markets reflected cooling momentum compared to the previous quarters. Nodes such as Kiserian, Kitengela, Ngong, Ongata Rongai, Juja, and Thika recorded slower price gains, mainly due to weakening demand from middle-income buyers and the after-effects of a strong rally in 2024, where satellite town prices had hit a seven-year high annual growth of 12.5%. In Q3’2025, none of the satellite towns exceeded a 5.0% q/q growth rate. The general market trend pointed to softened growth amid economic constraints and shifting buyer sentiment.
These findings align with broader market trends observed in the Cytonn Q3’2025 Markets Review, which reported that the overall average selling prices for land in the Nairobi Metropolitan Area (NMA) appreciated by 2.7% in Q3’2025, reaching Kshs 130.9 mn, up from Kshs 128.9 mn in Q3’2024. This growth was supported by: i) sustained housing demand driven by favorable demographics, with Kenya’s population and urbanization rates at 3.7% and 2.0% respectively, both higher than global averages; ii) constrained land supply in key urban nodes, particularly for residential and commercial development; iii) rising land investment interest from a growing middle class with access to more structured financing and investment tools; iv) continued rollout of key infrastructure projects such as the Nairobi Expressway, Eastern Bypass, and water and sewerage extensions, which are opening up new development frontiers; v) land’s entrenched role as a preferred wealth preservation vehicle for Kenyan households; and vi) the Affordable Housing Program under BETA, which remains a critical driver of construction activity and has continued to support upward pressure on land prices in and around key housing project zones.
- Real Estate Investment Trusts
- Real Estate Investment Trusts (REITs)
On the Unquoted Securities Platform, Acorn D-REIT and I-REIT traded at Kshs 27.4 and Kshs 23.2 per unit, respectively, as per the last updated data on 7th October 2025. The performance represented a 33.4% and 14.5% gain for the D-REIT and I-REIT, respectively, from the Kshs 20.0 inception price. The volumes traded for the D-REIT and I-REIT came in at Kshs 12.8 mn and Kshs 40.6 mn shares, respectively, with a turnover of Kshs 323.5 mn and Kshs 791.5 mn, respectively, since inception in February 2021. Additionally, ILAM Fahari I-REIT traded at Kshs 11.0 per share as of 7th October 2025, representing a 45.0% loss from the Kshs 20.0 inception price. The volume traded to date came in at 1.2 mn shares for the I-REIT, with a turnover of Kshs 1.5 mn since inception in November 2015.
REITs offer various benefits, such as tax exemptions, diversified portfolios, and stable long-term profits. However, the ongoing decline in the performance of Kenyan REITs and the restructuring of their business portfolios are hindering significant previous investments. Additional general challenges include:
- Insufficient understanding of the investment instrument among investors leading to a slower uptake of REIT products,
- Lengthy approval processes for REIT creation,
- High minimum capital requirements of Kshs 100.0 mn for REIT trustees compared to Kshs 10.0 mn for pension funds Trustees, essentially limiting the licensed REIT Trustee to banks only
- The rigidity of choice between either a D-REIT or and I-REIT forces managers to form two REITs, rather than having one Hybrid REIT that can allocate between development and income earning properties
- Limiting the type of legal entity that can form a REIT to only a trust company, as opposed to allowing other entities such as partnerships, and companies,
- We need to give time before REITS are required to list – they would be allowed to stay private for a few years before the requirement to list given that not all companies maybe comfortable with listing on day one, and,
- Minimum subscription amounts or offer parcels set at Kshs 0.1 mn for D-REITs and Kshs 5.0 mn for restricted I-REITs. The significant capital requirements still make REITs relatively inaccessible to smaller retail investors compared to other investment vehicles like unit trusts or government bonds, all of which continue to limit the performance of Kenyan REITs.
We expect Kenya’s Real Estate sector to maintain a positive growth trajectory, driven by key developments across infrastructure, residential, and industrial segments. On the residential front, performance continues to be shaped by shifting preferences captured in the Hass Consult Property Index, while the REITs marketpresents growing potential to attract institutional and retail investment into housing and rental portfolios. The industrial sector remains supported by demand for development-ready land, as indicated in the Hass Consult Land Price Index, especially in strategic urban peripheries. Despite these positives, challenges such as elevated construction costs, infrastructure pressure in urban centers, and capital constraints within the REITs space may continue to hinder optimal sector performance.
Kenya’s 2012 discovery of oil reserves in Northern Kenya and the subsequent establishment of a Sovereign Wealth Fund (SWF) mark a pivotal moment in the country’s fiscal and economic trajectory. As global commodity markets remain volatile and debt servicing pressures intensify, the need for structured, transparent, and forward-looking management of oil revenues has never been more urgent. Sovereign wealth funds are used globally to stabilize economies and finance strategic development. Sovereign funds offer countries like Kenya a unique opportunity to transform finite natural resources into long-term prosperity. Yet, despite its significance, Kenya’s SWF remains under-explored in public discourse. This topical aims to demystify the fund’s structure, legal framework, and macroeconomic rationale, while benchmarking it against global and Sub-Saharan African peers. With rising public interest in fiscal accountability and intergenerational equity, understanding how Kenya’s oil wealth is managed is essential for investors, policymakers, and citizens alike.
We will focus on unpacking the legal and institutional architecture of Kenya’s SWF, its revenue allocation mechanisms, and its potential role in stabilizing the economy and financing development. We aim to equip stakeholders with the insights needed to evaluate the fund’s effectiveness, especially considering Kenya’s debt dynamics, infrastructure needs, and Vision 2030 ambitions. As such, we shall cover;
- Introduction to Sovereign Wealth Funds,
- Kenya’s Proposed Sovereign Oil- Backed Wealth Fund,
- Comparative Analysis of Sovereign Wealth Funds,
- Threats and Opportunities for Kenya, and,
- Recommendations for Kenya and Conclusion.
Section I: Introduction to Sovereign Wealth Funds
A Sovereign Wealth Fund (SWF) is an investment fund that is owned by the state. Sovereign Wealth Funds invest in stocks, bonds, real estate, commodities and alternative investments such as private equity and hedge funds. Sovereign Wealth Funds are often funded by a country’s surplus revenue and financial reserves. Additionally, they can be capitalized through natural resource revenues such as minerals, oil and gas, proceeds from privatization of state-owned entities, pension contributions and revenue from other state assets.
Sovereign Wealth Funds are classified into:
- Stabilization Funds – These are state-owned investment funds that are structured to buffer a country’s economy and budget from fiscal and macroeconomic shocks. A stabilization fund helps governments maintain steady public spending by saving excess revenue during commodity booms and using it to cover budget shortfalls during downturns. It also counters the "Dutch disease" by investing surplus foreign currency abroad, preventing exchange rate distortions that harm non-commodity exports, while simultaneously building foreign reserves to guard against liquidity crises. Dutch disease is a situation where resource boom of a commodity such as oil results to the decline of other sectors such as manufacturing and agriculture. By enforcing strict withdrawal rules, the fund promotes fiscal discipline and protects against politically driven overspending during periods of high resource income. A key example is Chile’s Economic and Social Stabilization Fund (ESSF), that was established in 2007 to maintain steady public finances over time by cushioning against sudden economic downturns or unexpected shocks.
- Savings Funds – These are funds that are established by countries to save a proportion of their resource wealth for future. Part of the rationale for these funds is that commodities like petroleum and minerals are likely to be depleted over time, thus by converting the current resources into renewable financial resources that can be used in future. The Future Generations Fund is also a form of a savings fund, designed to save and grow wealth from current revenues, usually from natural resources or budget surpluses for the benefit of future citizens. It acts as a savings fund by setting aside money today, investing it, and preserving its value so that future generations can use the returns without depleting the original capital. Since these funds are designed as national savings for future generations, they prioritize long-term investments such as infrastructure, real estate, and private equity to preserve and grow wealth over time.
- Pension Reserve Funds – Sovereign Pension Reserve Funds are established by governments or social security institutions to meet future public pension obligations. The funding source for these funds is surpluses of pension contributions over current payouts or government fiscal transfers. By investing these reserves in diversified portfolios, often including fixed income, equities, and alternative assets, Pension Reserve Funds help mitigate future fiscal pressures, reduce intergenerational inequities, and enhance the credibility of national pension commitments.
- Strategic Development Fund – This is a Sovereign Wealth Fund that can be utilized to promote national socio-economic or infrastructure development goals. Development funds are usually established to strengthen local industries and attract investment from foreign institutional investors. By deploying capital into high-impact ventures, Strategic Development Funds aim to strengthen domestic value chains, create jobs, stimulate inclusive growth, and reduce dependency on external borrowing.
Countries set up Sovereign Wealth Funds (SWFs) for various reasons, including:
- Investing excess reserves, diversifying income sources, and secure long-term financial stability, particularly for countries with budget surplus and have little debt.
- Generating long-term wealth by investing surplus revenues from non-renewable resources to create sustainable income for future generations.
- Insulating the economy from market volatility, especially for commodity-dependent nations, by saving during boom cycles and spending during downturns.
- Promoting macroeconomic stability through offshore investments that help prevent inflation and currency appreciation caused by large foreign inflows such as Dutch disease.
- Diversifying national revenue streams by investing in global assets such as equities, bonds, real estate, and private equity.
- Funding long-term strategic projects, including infrastructure and key industries that support economic development.
- Reducing the cost of holding reserves by shifting excess foreign exchange reserves from low-yield assets to higher-return investments.
- Strengthening global financial influence through strategic international investments.
Section II: Kenya’s Proposed Sovereign Oil- Backed Wealth Fund
- Structure and Components of Kenya’s proposed oil- backed Sovereign Wealth Fund
In October 2025, the National Treasury of Kenya published the Draft Kenya Sovereign Wealth Fund (SWF) Bill, 2025. The 2025 bill marks the second time Kenya proposed an investment fund, ten years after The National Sovereign Wealth Fund Bill, 2014. The proposed 2014 SWF included mixed Commodity and Non-commodity fund consisting of the Stabilization Fund, the Infrastructure and Development Fund and the Future Generations Fund. The 2014 Bill however did not go through because the bill intended to use revenue from discovered oil fields in Northern Kenya and coal deposits in the Coast that did not materialize. The table below shows the difference and similarities in features of the 2014 and 2025 proposed SWF Bills:
|
Cytonn Report: A Comparison of Kenya’s 2014 and 2025 Proposed Sovereign Wealth Funds |
||
|
|
The 2014 Proposed SWF |
The 2025 Proposed SWF |
|
Sources of Funds |
Capital from privatization proceeds, dividends from state corporations, oil, gas, and mineral revenues due to the national government, and other natural resource income |
Revenue from upstream petroleum production and revenue from mining, licenses and mining leases. |
|
Components of the Fund |
Stabilization Fund, the Infrastructure and Development Fund and the Future Generations Fund |
Stabilization Fund, the Strategic Infrastructure Investment Fund and the Future Generation (Urithi) Fund |
|
Purpose of the Fund |
Build national savings, stabilize the economy from excess volatility in revenues or exports, diversify from non-renewable exports, support development, manage liquidity, and promote long-term growth |
Cushion the national government from revenue shocks, finance strategic infrastructure, and build savings for future generations beyond resource depletion |
|
Board Composition |
The President, Cabinet Secretaries responsible for National Treasury, Mining, Energy and Petroleum, the Attorney General, the chairperson and secretary to the Board |
Chairperson appointed by the President, the Principal Secretary to the National Treasury, the Governor of the Central Bank, four other independent persons and the Chief Executive Officer |
Source: National Treasury
The Kenya Sovereign Wealth Fund (SWF) Bill, 2025 will be funded through revenue from mining and petroleum. The Sovereign Wealth Fund will receive petroleum-related income including the national government’s share of profit from upstream petroleum operations, excluding the share entitled to specific government entities as detailed in the Petroleum Act, 2019, all royalties, bonus payments triggered by production or price thresholds, earnings from government participation in petroleum ventures, and proceeds from the sale or transfer of petroleum interests held by the government. Key to note, Upstream Petroleum Operations involve all or any of the operations related to the exploration, development, production, separation and treatment, storage and transportation of petroleum up to the agreed delivery point. Mining-related contributions to the Sovereign Wealth Fund include royalties payable to the national government, fees from the granting or assignment of mining rights, earnings from the government’s direct or indirect stake in mineral operations and proceeds from the divestment of government-held mining interests.
The Kenya Sovereign Wealth Fund Board shall provide guidance and oversight of the fund. The fund will have investment managers appointed by the Board. Alternatively, the Central Bank of Kenya (CBK), may also be appointed as the investment fund manager. The CBK will act as custodian of the fund and therefore will be responsible for holding and safeguarding the fund's assets, monitoring its performance, and ensuring compliance with regulations. The Fund is prohibited from investing in high-risk financial instruments such as speculative derivatives, non-listed real estate, private equity ventures, artwork, and commodity markets. The 2025 Sovereign Wealth Fund will be divided into three components comprising:
- The Stabilization Component – This component protects a country’s economy and budget from macroeconomic shocks from price volatility in commodities such as minerals and petroleum. Typically, stabilization funds are short-term, providing liquidity. The stabilization component in the Kenya Sovereign Wealth Fund Bill 2025, will be financed using transfers from the Holding Account and 50.0% of the investment income earned from the component. The Stabilization Component is prohibited from investing its assets in any securities listed on the Nairobi Securities Exchange or in covered bonds that are secured by those same securities, ensuring the fund avoids exposure to domestic market risks. Key to note, the Holding Account is the fund’s bank account maintained at the CBK in both domestic and foreign currencies used for receiving, holding and disbursing all the proceeds to the Fund. Withdrawals from this component of the fund shall be approved by the Board, only if the contingencies fund budgetary provision has been depleted.
- The Strategic Infrastructure Investment Component – This component supports financing of key investment projects that align with the county and national development goals and priorities. Some of the strategic infrastructure investments include investments in agriculture, transport, housing, energy, water, education and health, including Public Private Partnerships (PPPs). This component will be funded by transfers received from the Holding Account and 50.0% of investment income earned on the Strategic Infrastructure Investment Component. Withdrawals from this fund shall only be made for purposes of the strategic infrastructure projects subject to approval of the budget by the National Assembly. Additionally, withdrawals from the fund can only be made based on the actual funds available at the start or most recent point in the financial year, not future or expected income.
- The Future Generation (Urithi) Component – This fund will serve as a national savings pool, establishing a durable endowment to finance strategic infrastructure for future generations, provide a sustainable income stream for capital development when mineral and petroleum revenues diminish, and promote intergenerational equity in the distribution of Kenya’s natural resource wealth. The Urithi Component is prohibited from investing its assets in any securities issued by Kenyan entities, real estate located within Kenya, or investment vehicles primarily focused on the Kenyan market, including covered bonds backed by such assets.
- Relevant Laws and Regulations
In Kenya, the framework for Sovereign Wealth Funds is anchored by the Public Finance Management Act. The Act provides a legal framework for fiscal discipline, transparency, and accountability. It outlines how funds must be administered, reported, and integrated into the national budget process, including requirements for financial statements, cash flow planning, and withdrawal ceilings aligned with fiscal responsibility principles. By integrating the Sovereign Wealth Fund (SWF) into the national budget process and enforcing adherence to fiscal responsibility principles, the Act provides essential governance that safeguards public resources and ensures surplus revenues, especially from non-renewable sources are managed prudently, invested strategically, and used to promote long-term economic stability, development, and intergenerational equity.
The proposed oil -backed SWF will also be regulated by the Petroleum Act, 2019, because the fund will be backed by oil revenues. This Act guides how petroleum (oil and gas) is handled in Kenya from finding it, making contracts, and extracting it, to stopping operations when needed. It also makes sure these activities follow the Constitution. The law covers every stage of petroleum operations: the early stage (exploration and drilling), the middle stage (transport and storage), and the final stage (refining and selling). It also includes rules for anything else related to petroleum that helps these processes run smoothly. The Act will ensure that revenues from upstream petroleum operations such as profit shares, royalties, and fees are legally defined, collected by the Kenya Revenue Authority, and directed into the Sovereign Wealth Fund. This guarantees transparent management of oil and gas income to support long-term development, economic stability, and intergenerational equity.
Revenues from minerals will also fund the SWF. Accordingly, the Mining Act, 2016 will also serve to regulate the fund. The Mining Act is being used in the establishment of the Sovereign Wealth Fund (SWF) to ensure that revenues from mineral resources are legally directed into the Fund. The amended Section 186 mandates that all fees, charges, and specific royalties from mining operations be collected by the KRA and remitted to the SWF. This legal provision guarantees that income from mining especially from royalties under Section 183(5)(a) is systematically captured and channeled into the Fund, where it can be transparently managed to support long-term national development, economic stability, and intergenerational equity.
- Rationale for Kenya’s Proposed Sovereign Wealth Fund, 2025
The Sovereign Wealth Fund (SWF), as proposed in the Draft Sovereign Wealth Fund Bill 2025, will be structured to address three primary objectives: macroeconomic stabilization, strategic investment, and intergenerational savings. These components will collectively enhance Kenya’s fiscal resilience, accelerate infrastructure-led growth, and safeguard national wealth for future generations.
- Economic Stabilization
The fund will act as a financial cushion for the national government, helping to absorb the impact of volatile resource revenues or unexpected macroeconomic shocks such as global recessions or commodity price crashes. The Stabilization Component of the SWF will serve as a counter-cyclical buffer, enabling the government to manage revenue volatility arising from fluctuations in global commodity prices and external macroeconomic shocks. By accumulating surplus revenues during commodity booms, the Fund will allow the government to maintain fiscal continuity during downturns, thereby reducing the need for abrupt expenditure cuts or emergency borrowing. This will support exchange rate stability, preserve investor confidence, and enhance the country’s ability to absorb external shocks without compromising development priorities.
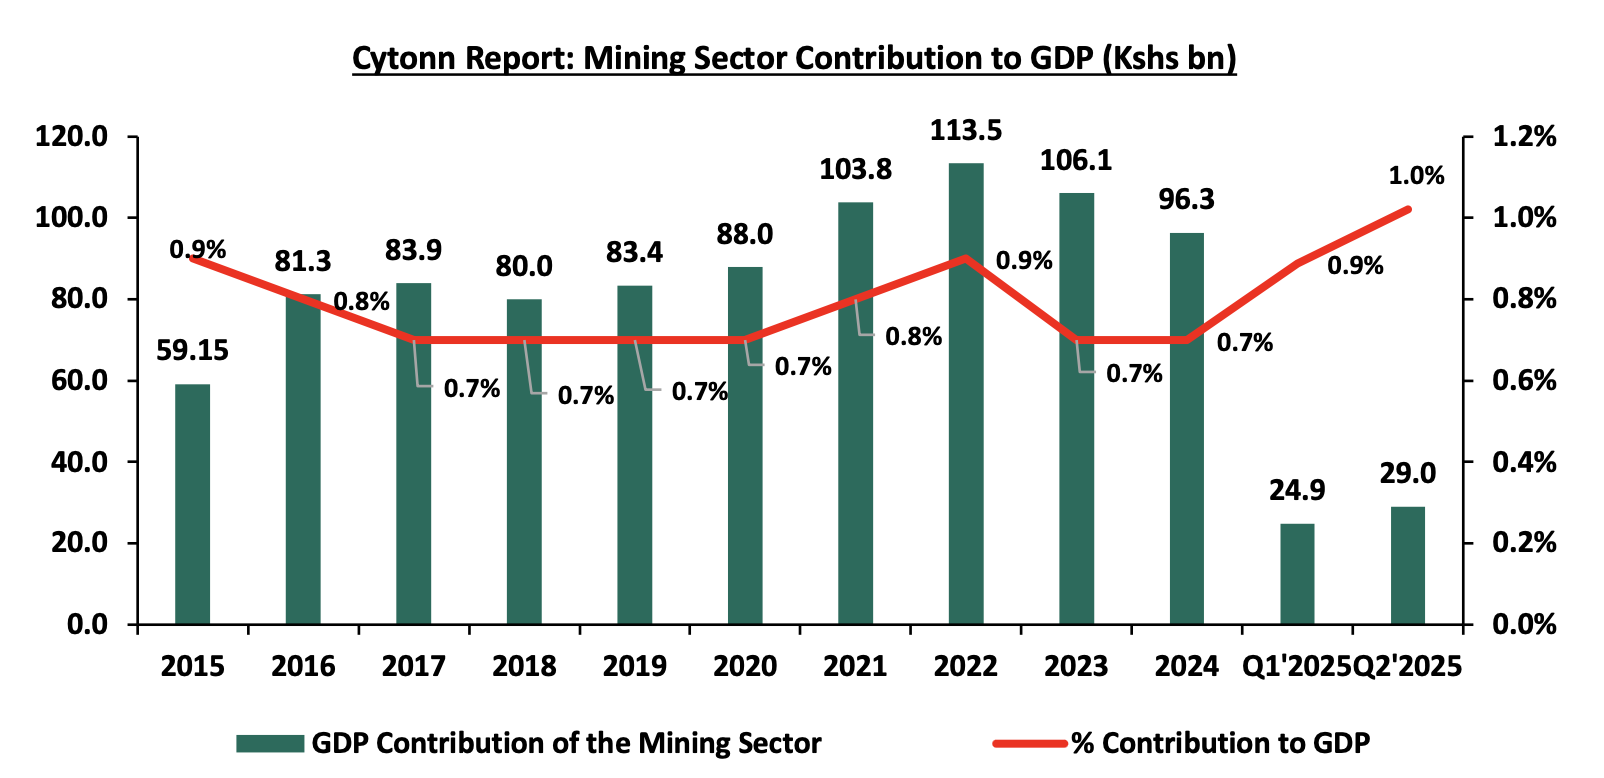
Kenya’s extractive sector, particularly petroleum and mineral resources, will continue to play a growing role in GDP contribution. In FY’2024, the mining sector contributed Kshs 96.3 bn to Kenya’s GDP, marking a 9.2% decline from the Kshs 106.1 bn recorded in FY’2023. The sector accounted for 0.7% of the country’s GDP in FY’2024, consistent with its contribution in the previous year. Additionally, the revenue generated from the mining sector in FY’2024 amounted to Kshs 223.6 bn, with the mining licenses contributing the most by Kshs 154.2 bn. In Q2’2025, the mining sector’s contribution to GDP rose by 16.5% to Kshs 29.0 bn, accounting for 1.0% of the total GDP, up from Kshs 24.9 bn in Q1’2025 and an 8.1% increase from Kshs 26.8 bn in Q2’2024. The annual declining contribution of the mining sector to GDP raises concerns about the reliability and sufficiency of mineral revenues as a primary funding source for Kenya’s Sovereign Wealth Fund. If this trend continues, the fund may face challenges in meeting its capitalization targets, especially for the Stabilization and Future Generations components. However, the trend in 2025 is promising, with Q2’2025 showing an 8.1% year-on-year increase in mining output, indicating early signs of recovery and renewed sector momentum. Nonetheless, the sector’s overall contribution to GDP remains modest at just 1.0%, highlighting ongoing concerns about the adequacy of mineral revenues as a reliable funding source for Kenya’s Sovereign Wealth Fund. This underscores the need for diversified revenue streams and robust fiscal planning to ensure the fund’s sustainability. It also highlights the importance of improving mining sector productivity and governance to maximize its potential as a strategic asset.The graph below shows the mining sector’s contribution to GDP over the last 10 years:
Historical trends indicate that petroleum exports have consistently lagged behind imports, contributing to structural trade deficits and exposing the economy to foreign exchange pressures. Over the past ten years, petroleum imports have consistently exceeded the combined value of petroleum exports and re-exports, with the trade gap reaching Kshs 433.3 bn in 2024 and Kshs 119.4 bn in Q2’2025. Kenya’s petroleum exports rose significantly by 185.9% to Kshs 142.3 bn in FY’2024 from Kshs 49.8 bn in FY’2023, while the value of petroleum imports declined by 8.1% to Kshs 575.5 bn from Kshs 626.4 bn over the same period. Notably, the value of petroleum exports rose by 8.4% in Q2’2025 to Kshs 3.4 bn, up from Kshs 3.1 bn in Q1’2025. However, this still reflects a 4.4% year-on-year decline compared to the Kshs 3.6 bn recorded in Q2’2024, signalling persistent volatility in export performance despite the quarterly improvement. Despite the quarter-on-quarter and the 2024 year-on-year improvement, the sector remains a net deficit on foreign exchange.
Kenya’s reliance on petroleum revenues in a sector where Kenya remains a net importer highlights a key vulnerability for the proposed SWF. While the 2024 and Q2’2025 surge in exports is promising, the persistent trade deficit underscores the volatility and uncertainty of depending on oil as a stable funding source. This risk is amplified by the precedent of the 2014 proposed SWF, which aimed to channel revenues from Turkana’s oil discoveries into national development but ultimately stalled due to political, logistical, and commercial setbacks. For the SWF to be viable and resilient, Kenya must diversify its revenue base and ensure that petroleum sector reforms are fully implemented and commercially sustainable. The graph below shows the value of Kenya’s petroleum imports and exports over the last 10 years:
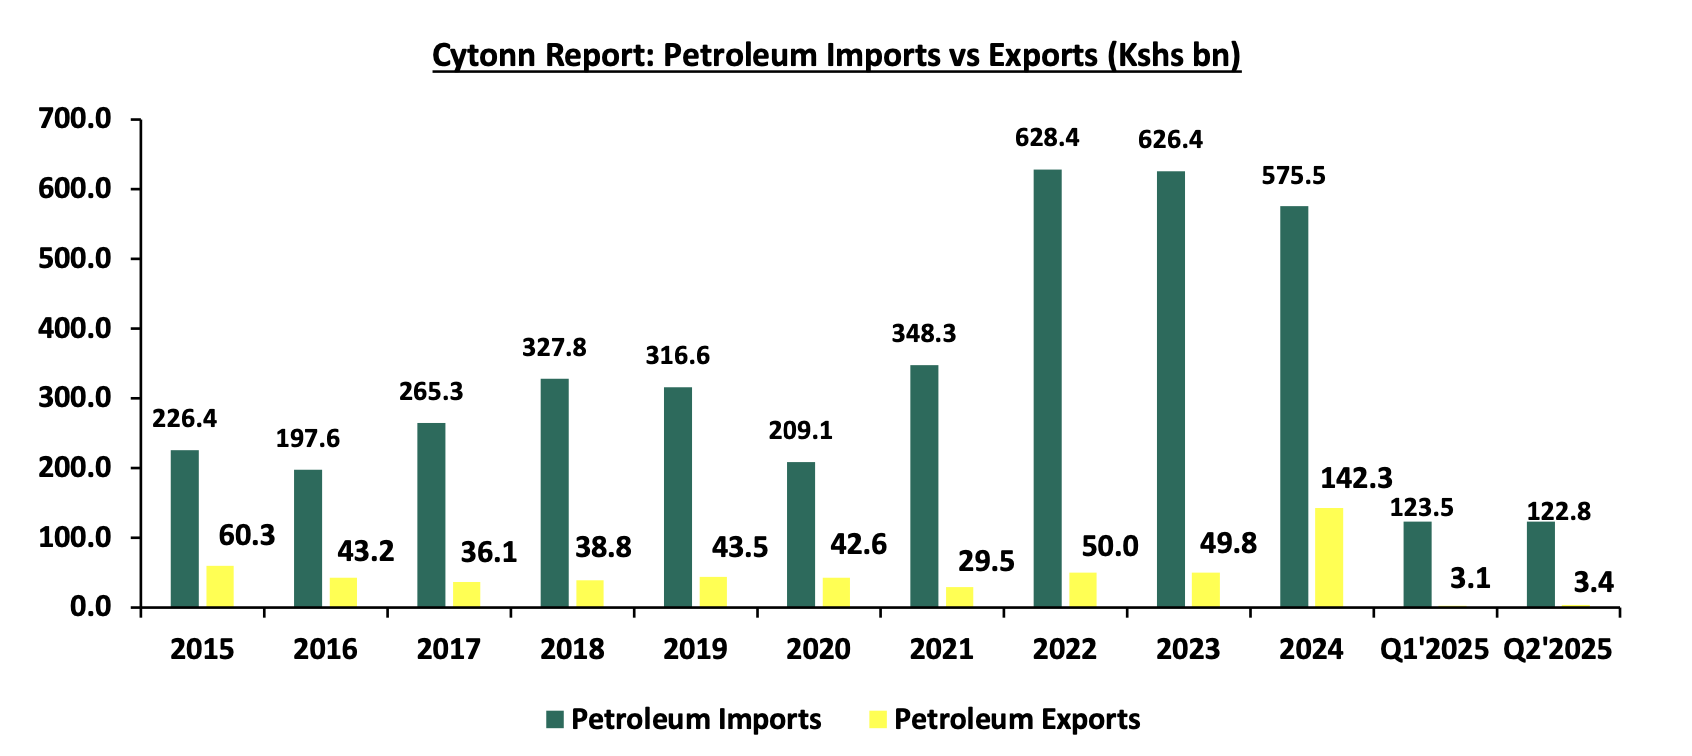
Source: KNBS Economic Survey, Quarterly BoP
- Strategic Investment
The fund will provide financing for high-priority infrastructure projects that drive inclusive and sustainable economic growth across the country. The Strategic Investment Component of the SWF will be structured to reduce Kenya’s dependence on debt-financed development by allocating resource revenues toward transformative public investments. Over the past decade, Kenya’s infrastructure pipeline, including roads, energy, ports, and ICT, has expanded significantly, but largely through external debt. While these projects have supported GDP growth, they have also contributed to rising debt service obligations and fiscal strain. For instance, in FY’2023/2024 the total domestic came in at Kshs 801.2 bn, increasing by 0.5% from Kshs 797.1 bn in FY’2022/2023 while the external debt servicing cost increased by 87.9% to Kshs 756.0 bn from Kshs 402.4 bn in FY’2024/2025. The cumulative debt servicing cost remains elevated at Kshs 1,559.9 bn in FY’2024/2025, a 0.2% increase from Kshs 1,557.1 bn in FY’2023/2024. The SWF is expected to mitigate this by offering a domestic capital pool for catalytic investments aligned with Vision 2030 and the Bottom-Up Economic Transformation Agenda (BETA). The graph below shows the debt servicing costs over the last ten fiscal years:
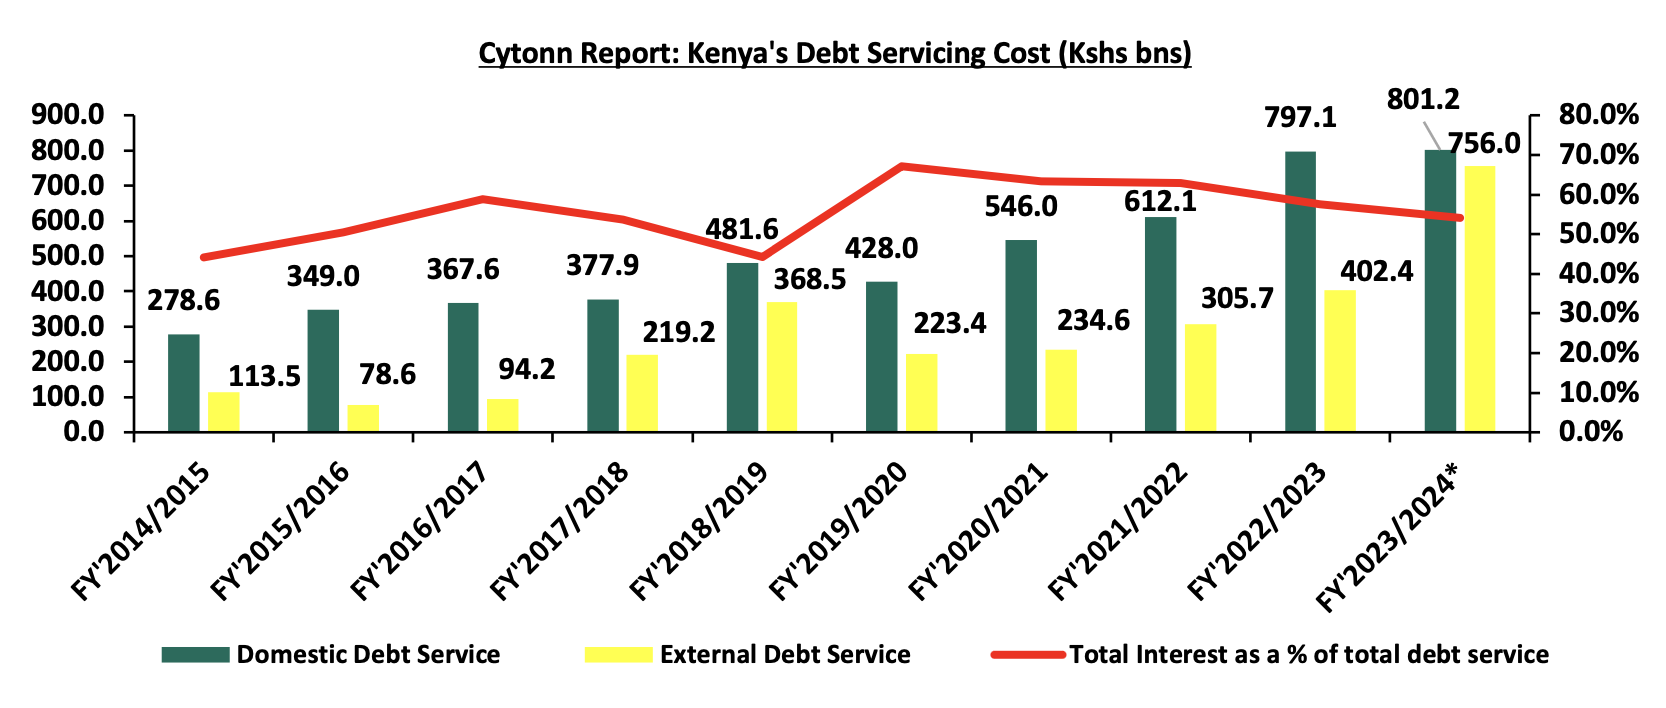
Source: The National Treasury, *Provisional
The Fund will prioritize sectors such as in agriculture, transport, housing, energy, water, education and health. These investments will unlock productivity, enhance county-level development, and stimulate job creation. The Fund will also serve as a platform for blended finance and public-private partnerships. However, the viability of this component will depend on the consistency of resource inflows, especially with the mining sector’s declining GDP contribution and the petroleum sector’s persistent trade deficit.
- Intergenerational Savings
The fund will build a long-term savings base to secure national wealth for future generations, especially after Kenya’s mineral and petroleum resources are depleted. The Future Generations (Urithi) Component of the SWF will be designed to preserve a portion of extractive revenues to last over a long period of time, converting urning short-term resource income into long-term financial savings. This savings mechanism will reflect Kenya’s commitment to intergenerational equity, ensuring that revenue surplus is not consumed but invested for future fiscal stability. The assets accumulated under this component will generate returns that can be deployed to support future budgetary needs. The Urithi Component will serve as both a financial reserve and a strategic hedge against demographic pressures, environmental shocks, and future fiscal demands.
Section III: Comparative Analysis of Sovereign Wealth Funds
- Global Case Studies
Kuwait was the first sovereign state in the world to set up a Sovereign Wealth Fund in 1953 through the Kuwait Investment Authority (KIA). KIA is a commodity- based SWF and ranks fifth largest in the world, with Assets Under Management worth USD 1,002.0 bn. The fund was established following the discovery of oil in the country. The fund’s components include Kuwait General Reserve Fund and the Kuwait Future Generations Fund. The General Reserve Fund acts as Kuwait’s Public Treasury and investment arm, consolidating state revenues to finance government expenditures while enhancing fiscal flexibility and resilience against economic shocks. Beyond stabilization, it strategically invests across key sectors to generate sustainable returns, promote private sector growth, and advance national development and diversification goals. The Future Generations Fund is an intergenerational savings fund that was established in 1976 with 50.0% of its initial funding coming from the General Reserve Fund. The Fund has invested in the global equities markets with holdings in international corporations such as Agricultural Bank of China and Industrial and Commercial Bank of China, bonds and alternatives such as private equity, real estate and infrastructure.
Norway’s Government Pension Fund is the largest SWF in the world with an AUM of USD 2,048.0 bn. The fund was established in 1990 to invest the revenue from the Norwegian Petroleum Sector, leveraging the country's economic surpluses and aiming to reduce volatility caused by fluctuating oil prices. The fund is comprised of two separate funds; the Government Pension Fund Global and the Government Pension Fund Norway. The Government Pension Fund Global invests revenue from petroleum in international financial markets, meaning its exposure to risk is largely detached from fluctuations within the Norwegian economy. The fund invests in equities, fixed income, real estate and infrastructure. This global diversification helps shield the fund from domestic economic shocks and enhances long-term financial stability. Conversely, the Government Pension Fund Norway is restricted to domestic investments, with its portfolio limited to assets within Norway, including a cap of 15.0% in any single Norwegian company.
China operates multiple Sovereign Wealth Funds, with the two most prominent being the China Investment Corporation (CIC),with an AUM of USD 1,332.0, and the State Administration of Foreign Exchange (SAFE), with an AUM of USD 1,582.0. CIC was capitalized through a process in which the Ministry of Finance issues bonds. The proceeds are used to purchase foreign exchange reserves from the People's Bank of China which are now then allocated those reserves to fund CIC. It was established with the goal of deploying foreign exchange reserves to benefit the state by investing in international assets that offer higher risk and potentially higher returns than traditional government bonds. CIC invests in natural resources, real estate ventures, international listed equities such as Morgan Stanley and private equity. SAFE manages foreign exchange for the People's Bank of China. It oversees several SWFs that channel portions of China's foreign exchange reserves into investment vehicles such as infrastructure, real estate, private equity, and strategic resources.
The United Arab Emirates has several SWFs including the Abu Dhabi Investment Authority (ADIA) and The Investment Corporation of Dubai (ICD). Both are primarily funded by revenues from oil and gas exports. ADIA focuses on long-term global investments across a wide range of asset classes, including stocks, government bonds, real estate, private equity, and infrastructure, aiming to preserve and grow the nation’s wealth for future generations. ICD, on the other hand, plays a more strategic role in supporting Dubai’s economic development by investing in key sectors such as finance, transport, energy, and hospitality, aligning closely with the emirate’s growth agenda.
Kenya’s proposed 2025 Sovereign Wealth Fund aligns with global SWFs in its objectives of economic stabilization and long-term savings, but differs in scale, domestic investment orientation, and governance structure. The following analysis compares Kenya’s fund with select leading international counterparts across four key dimensions:
- Source of Funds
Kenya’s SWF will be funded primarily through revenues from petroleum and mineral resources, supplemented by other government allocations. China’s CIC was capitalized via Ministry of Finance bond issuance, which purchased foreign exchange reserves from the central bank. Kuwait and the UAE fund their SWFs through surplus oil revenues, with Kuwait’s KIA and Abu Dhabi’s ADIA benefiting from decades of resource-based accumulation. Norway’s GPFG is financed by petroleum taxes, dividends from state-owned enterprises, and licensing fees, channeling oil wealth into long-term savings.
- Purpose of the SWF
Kenya’s fund is designed to stabilize the economy against resource revenue volatility, finance strategic infrastructure, and save for future generations. China’s SWFs aim to diversify foreign exchange reserves and pursue higher-risk, higher-return investments abroad. Kuwait and Norway emphasize fiscal stabilization and intergenerational savings, with Kuwait also supporting national development goals. The UAE’s ADIA focuses on preserving wealth and ensuring long-term financial sustainability for future generations.
- Investment Scope and Restrictions
Kenya’s SWF will invest primarily in high-rated foreign sovereign bonds, foreign currency deposits with other central and settlement banks, multilateral-backed securities, and foreign currency instruments. The fund also prohibits investments in securities listed on the Nairobi Securities Exchange. China’s CIC and SAFE invest globally across equities, private equity, real estate, and strategic sectors, with no strict domestic restrictions. Kuwait and the UAE also maintain globally diversified portfolios, though Kuwait’s GRF supports domestic development as well. Norway’s GPFG is restricted to international investments only, avoiding domestic markets to prevent economic distortion and applying strict ethical guidelines. Additionally, Norway’s GPFG has ethical restrictions on investments.
- Investment Management Structure
Kenya’s fund will be managed under a legal framework overseen by the National Treasury, with investments managed by either independent fund managers or the Central Bank of Kenya. China’s CIC operates independently as a state-owned entity, while SAFE functions as a subsidiary of the People’s Bank of China. Kuwait’s KIA and the UAE’s ADIA are autonomous institutions, with KIA reporting to the Ministry of Finance and ADIA maintaining its own investment teams. Norway’s GPFG is managed by Norges Bank Investment Management, a specialized arm of the central bank, combining professional oversight with operational independence.
The graph below shows the top 10 countries’ Sovereign Wealth Funds ranked by Assets Under Management (AUM):
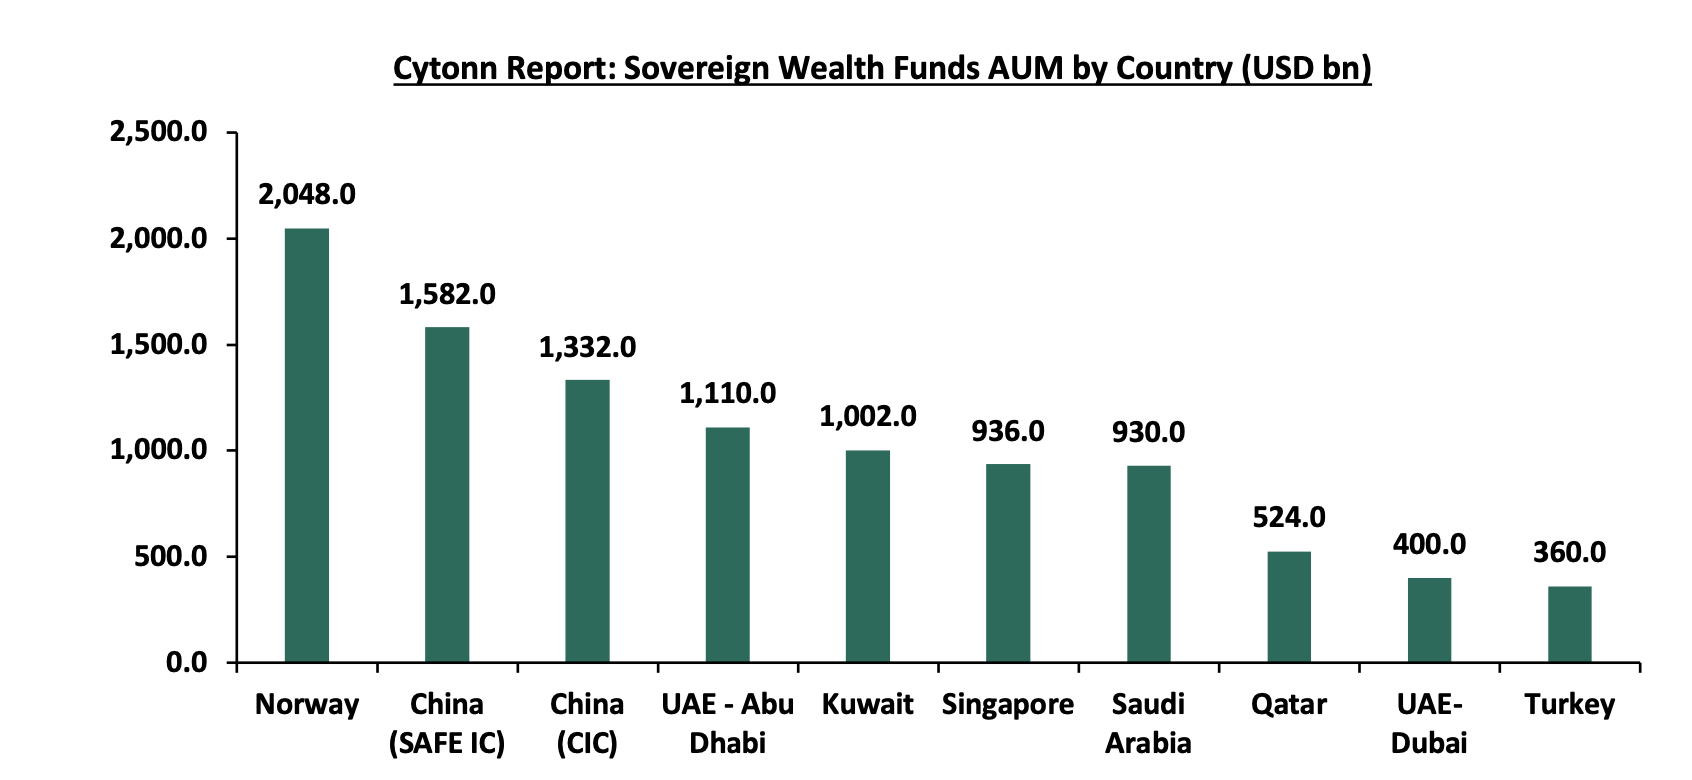
Source: Global SWF
- Sub – Saharan Africa Case Studies
Sovereign Wealth Funds (SWFs) have emerged as vital instruments for economic stabilization, long-term savings, and strategic investment across Sub-Saharan Africa. Countries such as Nigeria, Gabon, Rwanda, and Angola have established SWFs with distinct structures, funding sources, and mandates tailored to their national priorities. These funds reflect diverse approaches from resource-backed stabilization and infrastructure financing to citizen-driven savings models, offering valuable insights into how African economies are leveraging sovereign assets to build resilience, foster development, and secure intergenerational prosperity.
The Nigeria Sovereign Investment Authority (NSIA) manages the Nigeria Sovereign Wealth Fund, funded by surplus oil revenues, with the goal of generating long-term returns and supporting national development. As of December 2024, the fund holds USD 2.4 bn in assets and is structured into three components: the Stabilisation Fund, the Future Generation Fund, and the Nigeria Infrastructure Fund. The Stabilisation Fund is invested in short-term, high-quality fixed income assets to ensure liquidity and meet unexpected government budgetary needs, especially during oil price shocks. Meanwhile, the Future Generation Fund focuses on long-term savings, and the Infrastructure Fund supports development in sectors like agriculture and public projects.
The Angola Sovereign Wealth Fund was established in 2011 to support the country’s economic growth and social development. Angola being one of the largest oil producers in Sub-Saharan Africa, oil revenues finance the fund. Half of its assets are directed toward alternative investments like agriculture, mining, infrastructure, and hospitality within Angola and across Africa. The other half is allocated to global investments in fixed income instruments, equities, and additional alternatives. Up to 7.5% of the fund may be used for social projects in education, healthcare, clean water, energy, and income generation.
Established in 2012, the Agaciro Development Fund (AGDF) is Rwanda’s sovereign wealth fund aimed at promoting self-reliance, economic stability, and long-term development. It invests both locally and internationally, with a portfolio comprising government securities, term deposits and equities. Uniquely, AGDF is funded through voluntary contributions from Rwandans and friends of Rwanda. Recent government transfers of shares in state-owned companies have expanded and diversified the Fund’s holdings. AGDF plays a vital role in shielding Rwanda from external economic shocks and securing prosperity for future generations.
Established in 1998, the Sovereign Wealth Fund of the Gabonese Republic (FSRG) was created to invest oil revenues for the long-term benefit of Gabonese citizens. Managed by the Gabonese Fund for Strategic Investments (FGIS) since 2012, the Fund now operates as a development vehicle aligned with Gabon’s structural economic transformation. FGIS channels investments into renewable energy, water infrastructure, SMEs, urban planning, and key social sectors such as health and education. Its mandate supports the government’s Plan d’Accélération de la Transformation, which seeks to reduce oil dependence, promote local value creation, generate sustainable jobs, and ensure intergenerational prosperity while preserving Gabon’s natural ecosystems.
The following analysis compares Kenya’s fund with select leading Sub-Saharan counterparts across four key dimensions:
- Source of Funds
Kenya’s SWF will be funded primarily through revenues from petroleum and mineral resources, supplemented by government allocations. This model aligns closely with Nigeria, Angola, and Gabon, whose SWFs are financed by surplus oil revenues. Nigeria’s fund draws from excess crude income, Angola’s from its large oil exports, and Gabon’s from petroleum taxes and royalties. In contrast, Rwanda’s Agaciro Development Fund is uniquely funded through voluntary contributions from citizens, the diaspora, and friends of Rwanda demonstrating a grassroots approach to sovereign savings.
- Purpose of the SWF
Kenya’s SWF is designed to stabilize the economy against resource revenue volatility, finance strategic infrastructure, and save for future generations. This mirrors the threefold purpose of Nigeria’s SWF, which includes a Stabilisation Fund, Infrastructure Fund, and Future Generation Fund. Angola and Gabon also emphasize economic transformation and social development, with Gabon aligning its fund with national priorities like renewable energy and job creation. Rwanda’s fund, while smaller in scale, focuses on self-reliance, economic resilience, and shielding the country from external shocks, offering a model for public-driven legitimacy.
- Investment Scope and Restrictions
Kenya’s SWF will invest in high-rated foreign sovereign bonds, foreign currency deposits, and multilateral-backed securities, while prohibiting investments in domestic securities listed on the Nairobi Securities Exchange. This cautious approach is similar to Nigeria’s Stabilization Fund, which prioritizes liquidity and safety. Angola, however, pursue more diversified portfolio where it splits its assets between domestic alternatives and global investments. Rwanda’s fund maintains a balanced portfolio of government securities, term deposits, and equities, both locally and internationally.
Kenya’s proposed Sovereign Wealth Fund (SWF) can draw critical lessons from global and Sub-Saharan African peers by prioritizing strong governance, diversified funding, and strategic investment mandates. Leading funds like Norway’s and Kuwait’s demonstrate the importance of clear legal frameworks, offshore investment strategies, and intergenerational savings mechanisms that shield economies from commodity volatility. China’s CIC and UAE’s ADIA highlight the value of leveraging foreign exchange reserves and aligning investments with national development goals. Regionally, Nigeria’s NSIA and Botswana’s Pula Fund underscore the need for transparency, fiscal discipline, and performance-based asset allocation. For Kenya, the key takeaway is that success hinges not just on resource endowment, but on institutional credibility, consistent revenue flows, and a long-term vision that integrates stabilization, infrastructure finance, and wealth preservation.
Section IV: Opportunities and Threats for Kenya
The proposed Sovereign Wealth Fund will mark a key shift in Kenya’s fiscal strategy, transforming volatile extractive revenues into a structured, multi-purpose national asset. Anchored on three components; Stabilization, Strategic Investment, and Future Generations, the Fund will seek to enhance macroeconomic resilience, accelerate infrastructure-led growth, and preserve wealth across generations. However, its success will depend on how effectively Kenya navigates structural risks and capitalizes on emerging fiscal and favourable global conditions.
Opportunities for Kenya Through the Sovereign Wealth Fund
- Fiscal Resilience and Counter-Cyclical Stability - The Stabilization Component will allow Kenya to smoothen public expenditure during economic shocks such as global recessions and commodity price crashes, without resorting to emergency borrowing or abrupt expenditure cuts. By accumulating surplus revenues during boom cycles, the Fund will allow for smoother public spending during downturns. This will enhance macroeconomic stability, support exchange rate management, and preserve investor confidence, especially during global recessions or commodity price crashes. This will be particularly critical in shielding Kenya’s fiscal framework from the volatility of petroleum and mineral markets,
- Infrastructure-Led Growth Without Debt - The Strategic Investment Component will provide a sustainable financing mechanism for high-impact infrastructure projects, reducing reliance on debt-financed development. Kenya will be positioned to invest in transformative sectors such as renewable energy and agriculture without deepening its debt burden. These investments will unlock productivity, catalyze county-level development, and stimulate job creation. Through Private Public Partnerships, the Fund will serve as a platform for blended finance and inclusive growth,
- Intergenerational Wealth Preservation - The Urithi Component will institutionalize long-term savings, ensuring future generations benefit from today’s extractive revenues. These savings will be invested in diversified financial assets that generate sustainable returns, which can be deployed to support future fiscal obligations, stabilize pension systems, and finance strategic sectors such as education, healthcare, and climate resilience,
- Capital Market Deepening and Sovereign Credibility - The Fund will act as a domestic anchor investor, crowding in capital into national development projects. This will deepen Kenya’s capital markets, enhance liquidity, and create new instruments for infrastructure finance and ESG-aligned investments. A well-managed SWF will also boost Kenya’s sovereign credit profile, reduce country risk premiums, and attract concessional finance from multilateral institutions,
- Regional Leadership and Policy Innovation - Kenya will have the opportunity to o establish itself as a regional leader in sovereign asset management especially in East Africa. A transparent, well-governed SWF will serve as a model for other resource-rich economies seeking to balance short-term fiscal needs with long-term wealth creation. This will enhance Kenya’s geopolitical influence and attract technical partnerships and global recognitionand position the country as a hub for policy innovation in East Africa, and,
- Enhanced Sovereign Bargaining Power and Global Partnerships - A well-capitalized SWF will strengthen Kenya’s position in global financial negotiations, whether in securing concessional loans, attracting FDI, or participating in climate finance platforms. It will signal fiscal prudence and long-term planning, making Kenya a more attractive destination for strategic partnerships, sovereign co-investments, and technical assistance.
Threats to Kenya’s Sovereign Wealth Fund
- Fragile Revenue Streams and Sectoral Volatility - The Fund will be heavily reliant on petroleum and mineral revenues, yet both sectors remain exposed to global price shocks and domestic inefficiencies. In 2024 and Q2’2025, mining contributed just 0.7% and 1.0% to GDP, with a year-on-year decline of 9.2% and 4.4% respectively. Petroleum exports surged, but still fell short of offsetting imports, leaving a trade deficit of Kshs 433.3 bn and Kshs 119.4 bn in FY’2024 and Q2’2025 respectively. This volatility will pose a risk to consistent Fund inflows, especially during commodity downturns or geopolitical disruptions. Without diversified revenue sources such as carbon credits, privatization proceeds, or diaspora bonds the Fund may struggle to meet its capitalization targets,
- Political Economy and Governance Risk - The viability of the SWF will hinge on its governance architecture. Past attempts, including the 2014 Turkana-linked SWF proposal, collapsed under political interference and weak institutional coordination. If the Fund lacks independent oversight, transparent reporting, and enforceable withdrawal rules, it risks becoming a fiscal slush fund rather than a strategic asset. The temptation to divert SWF inflows for short-term political gain will remain a persistent threat,
- Debt Overhang and Fiscal Crowding - Kenya’s elevated public debt levels may pressure policymakers to tap the Fund for budget support, undermining its long-term savings and investment mandate. Without strict fiscal discipline and legal safeguards, the SWF could end up being used to cover regular government expenses instead of its intended long-term purpose, eroding its credibility and sustainability,
- Institutional Capacity and Investment Expertise - Managing a multi-component SWF will require specialized capabilities in sovereign asset management, risk modelling, and global portfolio diversification. Kenya will need to build institutional depth, attract technical talent, and align operations with global standards such as the Santiago Principles. Failure to do so could result in suboptimal asset allocation and reputational risk. The Santiago Principles are a set of 24 voluntary guidelines, created by International Forum of Sovereign Wealth Funds (IFSWF), for Sovereign Wealth Funds that promote transparency, good governance, and accountability, and,
- Public Trust and Stakeholder Buy-In - A key challenge for the success of Kenya’s Sovereign Wealth Fund lies in cultivating broad public trust and stakeholder support. Currently, low public awareness of how sovereign wealth mechanisms work may limit engagement, especially among informal sector workers and small and medium-sized enterprises (SMEs), who form the backbone of the economy. If these groups perceive the Fund as opaque, elitist, or disconnected from their needs, it risks being viewed with suspicion or outright resistance.
Section V: Policy Recommendations and Conclusion
- Strengthen Legal and Institutional Governance - Kenya must prioritize the enactment of the Sovereign Wealth Fund Bill, 2025, embedding clear fiscal rules, withdrawal ceilings, and investment mandates that safeguard the fund from political interference and short-termism. The governance structure should be anchored by an independent, professionally vetted Board with expertise in finance, law, and extractives. Annual public reporting, external audits, and parliamentary oversight must be institutionalized to enhance transparency, build public trust, and ensure the fund’s alignment with national development goals,
- Diversify and Stabilize Revenue Streams - To ensure long-term sustainability, Kenya should expand the SWF’s funding base beyond petroleum and mining revenues. This includes channeling surpluses from privatization proceeds, dividends from state corporations, and fiscal windfalls into the Holding Account. Escrow mechanisms and automated transfers from the Kenya Revenue Authority will help ring-fence extractive revenues, minimizing leakage and political diversion. Accelerating reforms in the petroleum and mining sectors, especially around licensing, production-sharing agreements, and infrastructure will be critical to unlocking commercial viability and consistent inflows,
- Optimize Investment Strategy for Impact and Resilience - Kenya’s SWF must adopt a tiered investment mandate that reflects the distinct objectives of each component. The Stabilization Fund should prioritize low-risk, liquid offshore assets to buffer fiscal shocks, while the Strategic Infrastructure Fund should target blended finance and PPPs in agriculture, energy, transport, and housing aligned with Vision 2030 and BETA. The Future Generations Fund must focus on long-term global investments to preserve wealth beyond resource depletion. Domestic market exposure should remain restricted to avoid crowding out private investment and distorting capital flows,
- Enhance Public Participation and Fiscal Accountability - The SWF’s success will depend on inclusive stakeholder engagement and robust fiscal integration. Public consultations, county forums, and civil society engagement should be institutionalized to inform fund design and investment priorities. The SWF must be embedded within Kenya’s Medium-Term Expenditure Framework (MTEF), Vision 2030, and county development plans to ensure strategic alignment. A digital dashboard showing fund inflows, investments, returns, and withdrawals should be launched to promote transparency, citizen oversight, and real-time accountability,
- Build Capacity and Risk Management Systems - Kenya should invest in institutional capacity to manage the SWF effectively. This includes establishing an institution to train fund managers, regulators, and policymakers on global markets and extractive economics. A dedicated Sovereign Risk Unit should be created to monitor commodity price trends, geopolitical risks, and macroeconomic shocks. Technology must be leveraged to digitize fund operations, enhance asset tracking, and support performance analytics, ensuring the SWF remains agile, data-driven, and resilient in a volatile global environment.
Kenya’s proposed Sovereign Wealth Fund (SWF) offers a strategic pathway to fiscal resilience, infrastructure-led growth, and intergenerational wealth preservation. However, its success will depend on disciplined execution, diversified revenue streams, and robust governance. The 2014 SWF Bill stalled due to overreliance on speculative oil and coal revenues that failed to materialize, highlighting the critical risk of anchoring national investment frameworks on uncertain extractive flows. This precedent underscores the need for commercial viability, sector reforms, and ring-fenced revenue mechanisms to avoid political and logistical setbacks. While petroleum exports rose by 185.9% to Kshs 142.3 bn in 2024, the sector remains a net foreign exchange deficit, with imports still at Kshs 575.5 bn. Mining revenues hit Kshs 223.6 bn, yet GDP contribution declined to Kshs 96.3 bn, reinforcing concerns about sustainability. In Q2’2025, the mining sector showed signs of recovery, contributing Kshs 29.0 billion to GDP, an 8.1% year-on-year increase but still accounted for only 1.0% of total output, underscoring the limited fiscal weight of extractives. These trends reveal the fragility of relying solely on extractives to fund the SWF. Kenya must therefore broaden its funding base, incorporating privatization proceeds, state dividends, and fiscal surpluses while institutionalizing transparency, offshore investment discipline, and stakeholder oversight. If these lessons are heeded and reforms sustained, the SWF can evolve into a cornerstone of Kenya’s economic transformation, shielding the budget from shocks, unlocking catalytic investments, and securing prosperity beyond resource depletion.
Disclaimer: The views expressed in this publication are those of the writers where particulars are not warranted. This publication is meant for general information only and is not a warranty, representation, advice or solicitation of any nature. Readers are advised in all circumstances to seek the advice of a registered investment advisor.
Disclaimer: The views expressed in this publication are those of the writers where particulars are not warranted. This publication, which is in compliance with Section 2 of the Capital Markets Authority Act Cap 485A, is meant for general information only and is not a warranty, representation, advice, or solicitation of any nature. Readers are advised in all circumstances to seek the advice of a registered investment advisor

- Talk to us
- Kenya
- P.O Box 20695 - 00200, Nairobi, Kenya
- Cell +254709101200
- Tel +254709101200
- WhatsApp +254741676635
- United States
- +254709101200
- DOWNLOAD OUR APP
-


- Kenya
- 8th Floor, Pinetree Plaza, Kaburu Drive, Ngong Road, Nairobi, Kenya
- USA
- Suite 1150, 1775 Eye Street NW, USA, Washington DC 20006, USA
- Investments
- High Yield
- Private Equity
- Real Estate
- Real Estate
- RiverRun Estates
- Cytonn Towers
- The Ridge
- Taraji Heights
- The Alma