Cytonn Q3’2025 Markets Review
By research team, Oct 5, 2025
Executive Summary
Global Markets Review
According to the World Bank the global economy is projected to grow at 2.3% in 2025, lower than the 2.7% growth recorded in 2024. This forecast marks a significant downward revision from earlier projection in January of 2.7%, reflecting anticipated economic downturn, particularly due to rising international trade disputes and policy uncertainties. The World Bank’s growth projection of 2.3% is 0.5% points lower than the IMF’s 2025 forecast of 3.0%, which was also revised from the April 2025 projection of 2.8%. In their last Global Economic Prospects Report in June 2025, the World Bank revised their global growth forecasts downward due to weakening global trade, largely driven by rising U.S. tariffs and the resulting trade tensions, which disrupted global supply chains and slowed cross-border economic activity. Notably, advanced economies are expected to record a 1.2% growth in 2025, down from the 1.7% expansion recorded in 2024. Additionally, emerging markets and developing economies are projected to expand by 3.8% in 2025, down from the 4.2% expansion recorded in 2024. On the other hand, the IMF revised their projection upwards to 3.0% from the April 2025 projection of 2.8% due to faster-than-expected early activity ahead of anticipated tariffs, lower actual U.S. tariff rates than initially announced, improved financial conditions helped by a weaker dollar, and fiscal expansion spending in key economies
Sub-Saharan Africa Regional Review
According to the World Bank, the Sub-Saharan economy is projected to grow at a moderate rate of 3.7% in 2025, which is 0.2% points higher than the 3.5% growth recorded in 2024, but a downward revision from the January 2025 projection of 4.1%. The downward revision is mainly due to the rising trade barriers coupled with the weakened global investor confidence. The expected recovery from 2024 is primarily driven by global economic stability, and easing of monetary policy rates in the region, which is expected to boost private consumption and investment. However, most countries face the risk of increased inflation due to increased food prices resulting from drought, prompting them to increase or hold off on further easing of the rates. Nevertheless, the risk of debt distress remains high with more than half of countries facing unsustainable debt burdens. Public debt is expected to remain high due to increased debt servicing costs as a result of high interest rates in developed economies and a reduction in donor support;
Kenya Macroeconomic Review
According to the Kenya National Bureau of Statistics (KNBS) Q2'2025 Quarterly GDP Report, the Kenyan economy recorded a 5.0% growth in Q2’2025, 0.4% points higher from the 4.6% growth rate recorded in Q2’2024. The main contributor to Kenyan GDP remains the Agriculture, Fishing and Forestry sector which grew by 4.4% in Q2’2025, lower than the 4.5% expansion recorded in Q2’2024. All sectors in Q2’2025 recorded positive growths, with varying magnitudes across activities. Most sectors recorded contraction in growth rates compared to Q2’2024 with Accommodation & Food Services, Financial Services Indirectly Measured and Other services recording growth rate declines of 27.2%, 8.9% and 3.4% points to 7.8%, 1.4% and 1.4% from 35.0%, 10.3% and 4.8% respectively. Other sectors recorded an expansion in growth rates, from what was recorded in Q2’2024, with Mining and Quarrying, Construction and Electricity and Water Supply recording the highest growths in rates of 20.8%, 9.4% and 4.5% points, to 15.3%, 5.7% and 5.7% from (5.5%), (3.7%) and 1.2% respectively. Notably, the overall economic performance highlighted modest growth despite a slowdown in several key sectors, reflecting the mixed performance across industries amid a challenging operating environment;
During the week, Stanbic Bank released its monthly Purchasing Managers’ Index (PMI) showing that business conditions in the private sector improved in September 2025, marking the first expansion since April. The headline PMI rose to 51.9 in September, up from 49.4 in August, moving above the neutral 50.0 threshold and signaling a renewed upturn in private sector activity. The improvement followed months of protest-related disruptions and subdued sales, reflecting early signs of demand stabilization. On a year-to-year basis the index has recorded a 4.4% increase to 51.9 in September 2025 from the 49.7 posted in September 2024, highlighting relatively stronger conditions compared to the same period last year.
The year-on-year inflation in September 2025 rose slightly to 4.6%, up from 4.5% recorded in August 2025. This was in line with our projection of an increase to within the range of 4.1% - 4.6% where our decision was mainly driven by the easing in the Central Bank Rate (CBR) to 9.50% in August 2025 and a slight depreciation of the Kenya Shilling against the US Dollar. The headline inflation was primarily driven by price increases in the following categories: Food & Non-Alcoholic Beverages at 8.4%, Transport at 4.0%, and Housing, Water, Electricity, Gas and Other Fuels at 1.4%. The month-on-month inflation rate stood at 0.2% in September 2025.
Fixed Income
During Q3’2025, T-bills were oversubscribed, with the overall subscription rate coming in at 110.6%, up from 109.4% in Q3’2024. Investors’ preference for the 91-day paper persisted with the paper receiving bids worth Kshs 90.8 bn against the offered Kshs 52.0 bn, translating to an oversubscription rate of 174.6%, albeit lower than the oversubscription rate of 338.3% recorded in Q3’2024. Overall subscription rates for the 364-day papers came in at 136.1% which was higher than the 49.6% recorded in Q3’ 2024 while that for 182-day papers came in 59.6% which was lower than the 77.6% recorded in Q3’2024. The average yields on the 364-day, 182-day and 91-day papers decreased by 7.2%, 8.5% and 7.8% points to 9.6%, 8.2% and 8.0% in Q3’2025, respectively, from 16.9%, 16.7% and 15.9%, respectively, in Q3’2024. The downward trajectory in yields is primarily driven by improved investor confidence, stemming from reduced credit risk in the country and relatively eased inflationary pressures. This has lowered the risk premium demanded by investors. Despite the government's sustained domestic borrowing, strong demand for government securities has supported the decline in yields. During the period, the acceptance rate stood at 89.5%, down from 88.3% in Q3’2024, with the government accepting Kshs 308.9 billion out of the Kshs 345.1 billion worth of bids received;
This week, T-bills were undersubscribed for the third consecutive week, with the overall subscription rate coming in at 63.1%, slightly higher than the subscription rate of 62.9% recorded the previous week. Investors’ preference for the shorter 91-day paper waned, with the paper receiving bids worth Kshs 1.6 bn against the offered Kshs 4.0 bn, translating to a subscription rate of 40.4%, lower than the subscription rate of 40.5%, recorded the previous week. The subscription rates for the 182-day paper increased to 61.3% from the 19.4% recorded the previous week, while that of the 364-day paper decreased to 73.8% from the 115.3% recorded the previous week. The government accepted a total of Kshs 15.1 bn worth of bids out of Kshs 15.1 bn bids received, translating to an acceptance rate of 99.9%. The yields on the government papers registered a mixed performance with the yields on the 91-day paper increasing the most by 1.0 bps to 7.92% from the 7.91% recorded the previous week and the 364-day paper increased by 0.8 bps to 9.54% from 9.53% recorded the previous week while the yields on the 182-day papers decreased by 0.02 bps to 7.98% from 7.99% recorded the previous week;
During the week, the Kenya National Bureau of Statistics (KNBS) released the Q2’2025 Quarterly Gross Domestic Product Report, highlighting that the Kenyan economy recorded a 5.0% growth in Q2’2025, higher than the 4.6% growth recorded in Q2’2024;
During the week, KNBS released the Q2’2025 Kenya Quarterly Balance of Payment Report, where Kenya’s balance of payments position deteriorated significantly by 86.6% in Q2’2025, with a deficit of Kshs 157.0 bn, from a deficit of Kshs 84.1 bn in Q2’2024;
During the week, Kenya announced its plan to invite eligible holders of its outstanding USD 1.0 bn notes, at a purchase price of USD 1,037.50 per USD 1,000.0 in principal amount of notes accepted for purchase. The maturity date for the notes is 28thFebruary 2028. The offer began on 2nd October 2025 and will expire on 9th October 2025, unless extended, re-opened, amended or terminated by the Republic of Kenya;
Equities
During Q3’2025, the equities market was on an upward trajectory, with NSE 20, NSE 10, NSE 25, and NASI gaining by 21.8%, 17.6%, 17.4%, and 15.2%, respectively. The equities market performance during the quarter was driven by gains recorded by large caps such as DTB, KCB, and Cooperative Bank of 35.3%, 21.8%, and 19.6% respectively. The gains were however weighed down by losses recorded by large cap stocks such as SCBK of 5.3%;
During Q3’2025, in the regional equities market, the East African Exchanges 20 (EAE 20) share index declined by 0.1% , attributable to losses recorded by large cap stocks such as Tanzania Breweries, Tanzania Cigarette Company and MTN Rwandacell of 24.7%, 13.4% and 3.9% respectively. The performance was however supported by gains recorded by large cap stocks such as CRDB Bank, Tanga Cement and Quality Chemicals Industry Limited of 53.5%, 37.2% and 36.3%
During the week, the equities market was on an upward trajectory, with NSE 20, NSE 25, NASI and NSE 10 gaining by 1.8%, 0.7%, 0.3%, and 0.1%, respectively, taking the YTD performance to gains of 47.2%, 42.4%, 35.0% and 34.9% for NSE 20, NASI, NSE 25, and NSE 10 respectively. The equities market performance was mainly driven by gains recorded by large-cap stocks such as Stanbic Bank, Absa, and NCBA of 7.8%, 7.0%, and 2.5%, respectively. The gains were however weighed down by losses recorded by large cap stocks such as Cooperative Bank, Safaricom and EABL of 2.1%, 1.7% and 0.9% respectively;
Additionally, in the regional equities market, the East African Exchanges 20 (EAE 20) share index declined by 0.2%, attributable to losses recorded by large cap stocks such as Tanga Cement, MTN Rwandacell and Safaricom Plc of 4.2%, 1.7% and 1.5% respectively. The performance was however supported by gains recorded by large cap stocks such as Absa Bank Kenya, Co-operative Bank and Bank of Baroda Uganda of 5.6%, 5.1% and 5.0% respective
During the week, the Nairobi Securities Exchange (NSE) launched the NSE Banking Sector Share Index (NSE BSI) on 1stOctober 2025 to track the performance of all listed commercial banks in Kenya. This index provides investors with a transparent benchmark to measure the performance of banking stocks and serves as a basis for structured products and investment strategies.
Real Estate
In Q3’2025, the general Real Estate sector continued to witness considerable growth in activity in terms of property transactionsand development activities. Consequently, the sector’s activity contribution to Gross Domestic Product (GDP) grew by 5.5% toKshs 364.6 bn in Q2’2025, from Kshs 339.2 bn recorded during the same period in 2024. In addition, the sector contributed 8.1% to the country’s GDP, to remain relatively unchanged from the 8.1% recorded in Q1’2025. Cumulatively, the Real Estateand construction sectors contributed 15.3% to GDP, 3.8% points decrease from 19.1% in Q2’2024, attributable to decline in construction contribution to GDP by 3.7% points, to 5.0% in Q2’2025, from 8.7% recorded in Q2’2024;
During the week, the Kenya National Bureau of Statistics (KNBS) released the Quarterly Gross Domestic Product Report that outlined the performance of various sectors to the GDP;
During the week, the Kenya National Bureau of Statistics (KNBS) released the Leading Economic Indicators (LEI) July 2025Reports, which highlighted the performance of major economic indicators;
During the week, the Court of Appeal delivered a landmark ruling on the long-running zoning dispute concerning Rhapta Road. The judgment provided much-needed clarity by confirming that the area falls under Zone 3C, which allows development of up to 20 storeys. This decision has positive far-reaching implications for property developers, residents, and the Nairobi City County government in terms of providing clarity and predictability.
On the Unquoted Securities Platform, Acorn D-REIT and I-REIT traded at Kshs 26.7 and Kshs 22.9 per unit, respectively, as per the last updated data on 26th September 2025. The performance represented a 33.4% and 14.5% gain for the D-REIT and I-REIT, respectively, from the Kshs 20.0 inception price. Additionally, ILAM Fahari I-REIT traded at Kshs 11.0 per share as of 26th September 2025, representing a 45.0% loss from the Kshs 20.0 inception price. The volume traded to date came in at 1.2 mn shares for the I-REIT, with a turnover of Kshs 1.5 mn since inception in November 2015;
Investment Updates:
- Weekly Rates: Cytonn Money Market Fund closed the week at a yield of 12.7% p.a. To invest, dial *809# or download the Cytonn App from Google Play store here or from the Appstore here;
- We continue to offer Wealth Management Training every Tuesday, from 7:00 pm to 8:00 pm. The training aims to grow financial literacy among the general public. To register for any of our Wealth Management Trainings, click here;
- If interested in our Private Wealth Management Training for your employees or investment group, please get in touch with us through wmt@cytonn.com;
- Cytonn Insurance Agency acts as an intermediary for those looking to secure their assets and loved ones’ future through insurance namely; Motor, Medical, Life, Property, WIBA, Credit and Fire and Burglary insurance covers. For assistance, get in touch with us through insuranceagency@cytonn.com;
- Cytonn Asset Managers Limited (CAML) continues to offer pension products to meet the needs of both individual clients who want to save for their retirement during their working years and Institutional clients that want to contribute on behalf of their employees to help them build their retirement pot. To more about our pension schemes, kindly get in touch with us through pensions@cytonn.com;
Hospitality Updates:
- We currently have promotions for Staycations. Visit cysuites.com/offers for details or email us at sales@cysuites.com;
Global Economic Growth:
According to the World Bank the global economy is projected to grow at 2.3% in 2025, lower than the 2.7% growth recorded in 2024. This forecast marks a significant downward revision from earlier projection in January of 2.7%, reflecting anticipated economic downturn, particularly due to rising international trade disputes and policy uncertainties. The World Bank’s growth projection of 2.3% is 0.5% points lower than the IMF’s 2025 forecast of 3.0%, which was also revised from the April 2025 projection of 2.8%. In their last Global Economic Prospects Report in June 2025, the World Bank revised their global growth forecasts downward due to weakening global trade, largely driven by rising U.S. tariffs and the resulting trade tensions, which disrupted global supply chains and slowed cross-border economic activity. Notably, advanced economies are expected to record a 1.2% growth in 2025, down from the 1.7% expansion recorded in 2024. Additionally, emerging markets and developing economies are projected to expand by 3.8% in 2025, down from the 4.2% expansion recorded in 2024. On the other hand, the IMF revised their projection upwards to 3.0% from the April 2025 projection of 2.8% due to faster-than-expected early activity ahead of anticipated tariffs, lower actual U.S. tariff rates than initially announced, improved financial conditions helped by a weaker dollar, and fiscal expansion spending in key economies.
The downturn in global economic growth in 2025 as compared to 2024 is majorly attributable to;
- Heightened trade tensions and rising U.S. tariffs. Escalating U.S. tariffs, particularly on imports from China and key trading partners have disrupted global supply chains and increased the cost of goods. This has led to the slowdown in international trade volumes and weakened export-driven growth in the emerging markets and developing economies. However, if the major economies settle their trade disputes, it could ease global economic pressures, and,
- Trade policy uncertainty. The global economic landscape in 2025 is clouded by unpredictable trade policies, especially from major economies such as the United States, China and the European Union. Sudden tariff hikes, retaliatory measures and inconsistent enforcement have created a volatile environment for global trade. Developing countries, particularly those reliant on exports are facing reduced trading volumes and lower commodity prices.
The global economy is expected to remain subdued in 2025, mainly as a result of rising global trade tensions as well as volatile and unclear trade policies, which are expected to slow down economic growth.
Global Commodities Market Performance:
Global commodity prices registered mixed performance in Q3’2025, with prices of energy declining by 13.5%, compared to the 14.0% decrease recorded in Q3’2024, mainly as a result of due to a surge in oil and gas supply outpacing slowing demand growth, with renewable energy expansion further intensifying the oversupply and downward pressure. Additionally, prices of agriculture declined by 0.5% compared to the 2.6% increase recorded in Q3’2024 due to reduced demand and purchase orders. On the other hand, prices of precious metals increased by 38.7% in Q3’2025, compared to the 28.4% growth recorded in Q3’2024, mainly due to ongoing geopolitical tensions, a weakening U.S. dollar, and strong demand from both retail investors and central banks. Prices of Fertilizers, Metals and Minerals, and Non-Energy increased by 24.9%, 7.5% and 2.8% respectively, on the back of geopolitical tensions (especially in the Middle East), extreme weather impacting crop yields, rising input costs for fertilizers, and strong demand from clean-energy sectors. Tariffs and supply disruptions have further fueled these increases. Below is a summary performance of various commodities;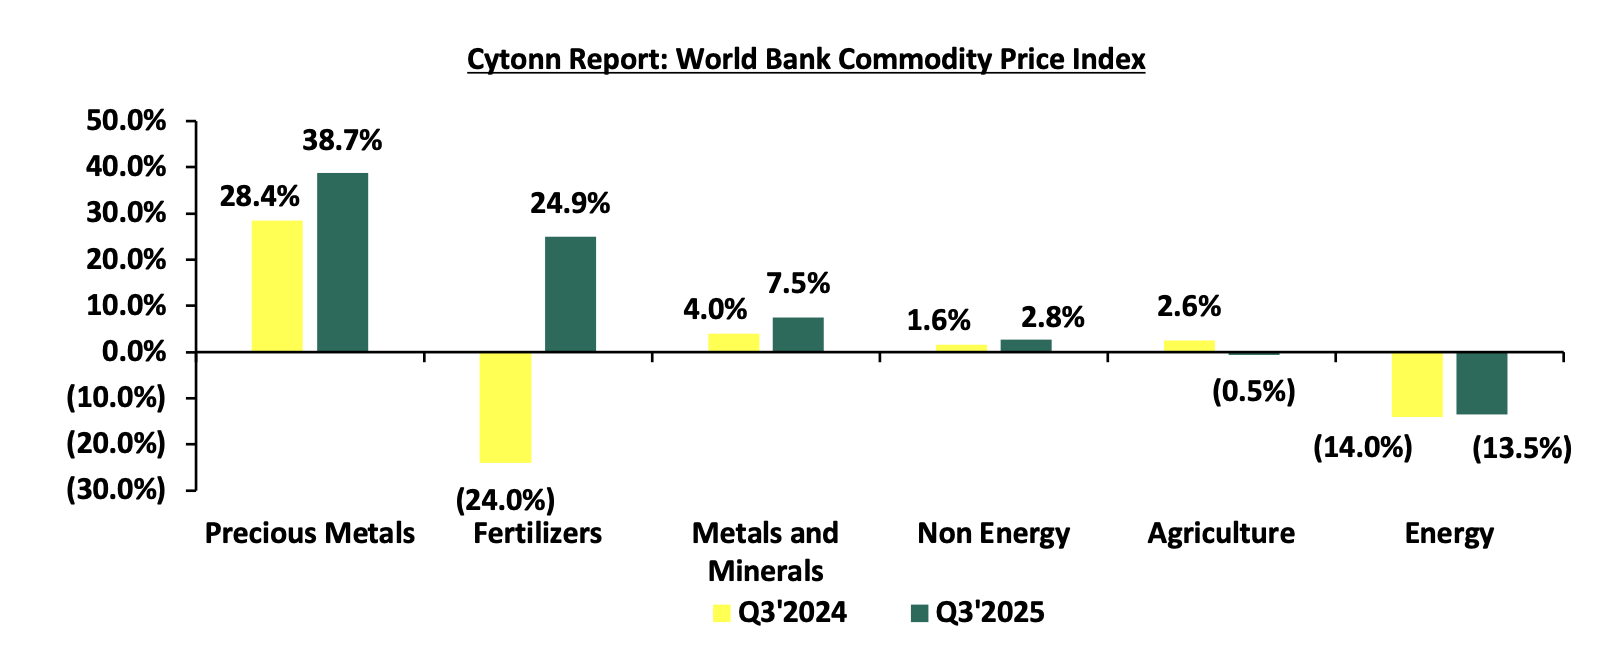
Source: World Bank
Global Equities Market Performance:
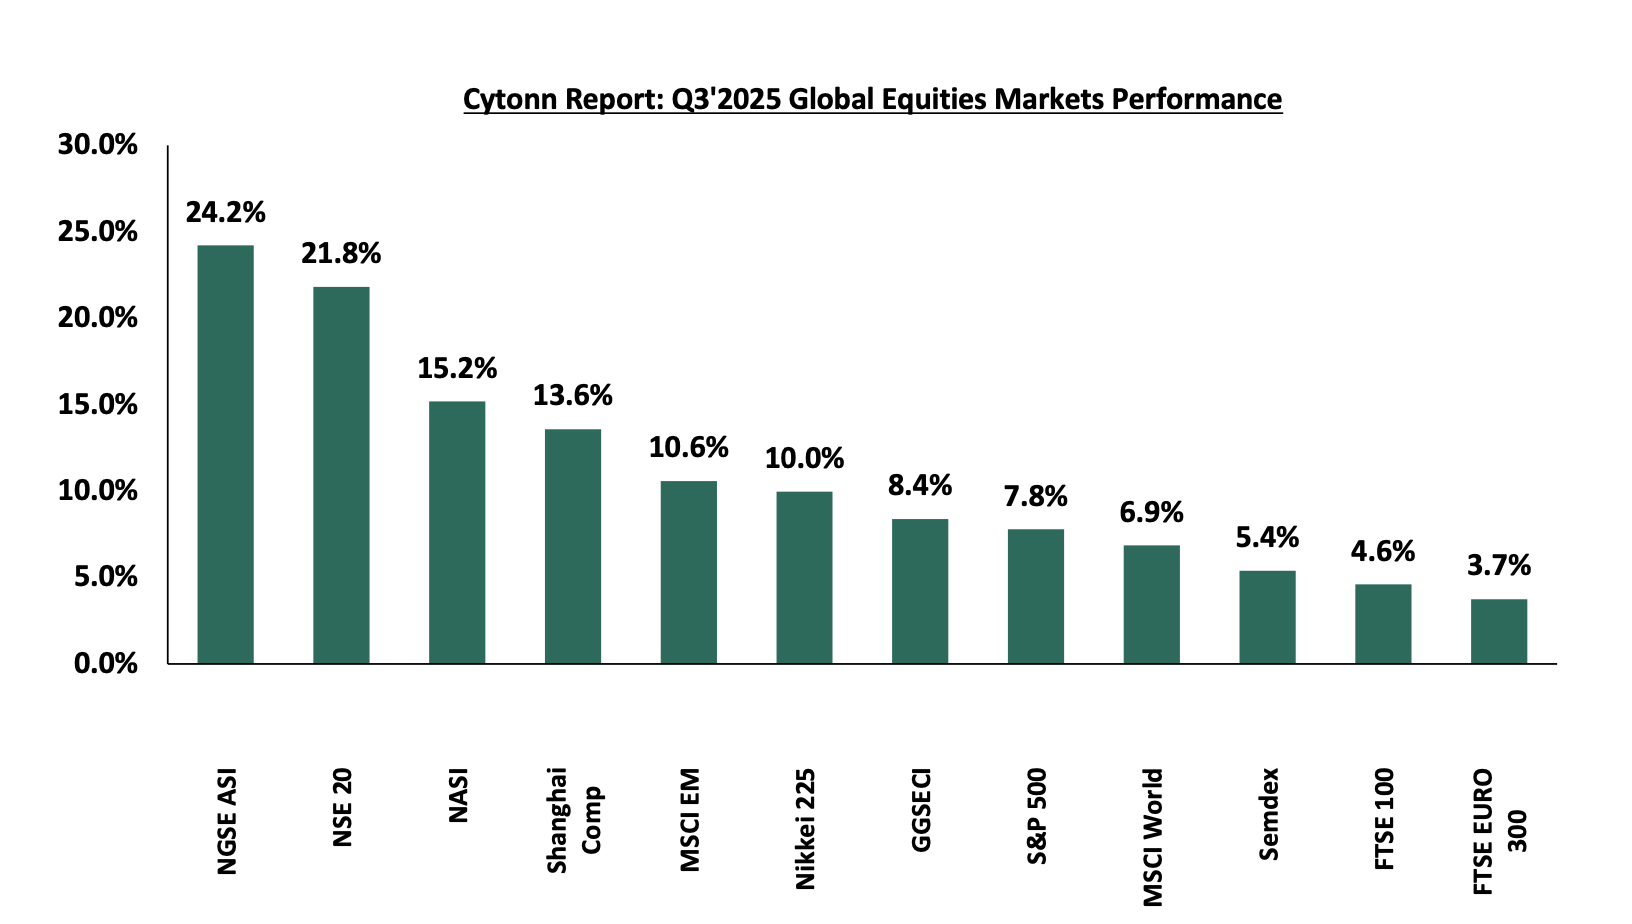
The global stock market was on an upward trajectory in Q3’2025, with most indices recording gains during the period, largely attributable to strong dividend growth, a weaker U.S. dollar boosting multinational earnings, resilient consumer spending, and rising investor confidence. Additionally, geopolitical tensions like tariff threats temporarily subsided and investors rotated into undervalued European and emerging markets. Notably, NGSEASI was the best performer during the period, recording a gain at 24.2% in Q3’2025 largely driven by gains in the large-cap stocks such as BUA Foods, Dangote Cement and MTN Nigeria gaining by 37.2%, 19.3% and 18.3% respectively, following improved earnings during the period, supported by easing inflation. Below is a summary of the performance of key indices as at the end of Q3’2025:
*Dollarized performance
According to the World Bank, the Sub-Saharan economy is projected to grow at a moderate rate of 3.7% in 2025, which is 0.2% points higher than the 3.5% growth recorded in 2024, and a downward revision from the January 2025 projection of 4.1%. The downward revision is mainly due to the rising trade barriers coupled with the weakened global investor confidence. The expected recovery from 2024 is primarily driven by global economic stability, and easing of monetary policy rates in the region, which is expected to boost private consumption and investment. However, most countries face the risk of increased inflation due to increased food prices resulting from drought, prompting them to increase or hold off on further easing of the rates. Nevertheless, the risk of debt distress remains high with more than half of countries facing unsustainable debt burdens. The public debt is expected to remain high due to increased debt servicing costs as a result of high interest rates in developed economies and a reduction in donor support.
Currency Performance:
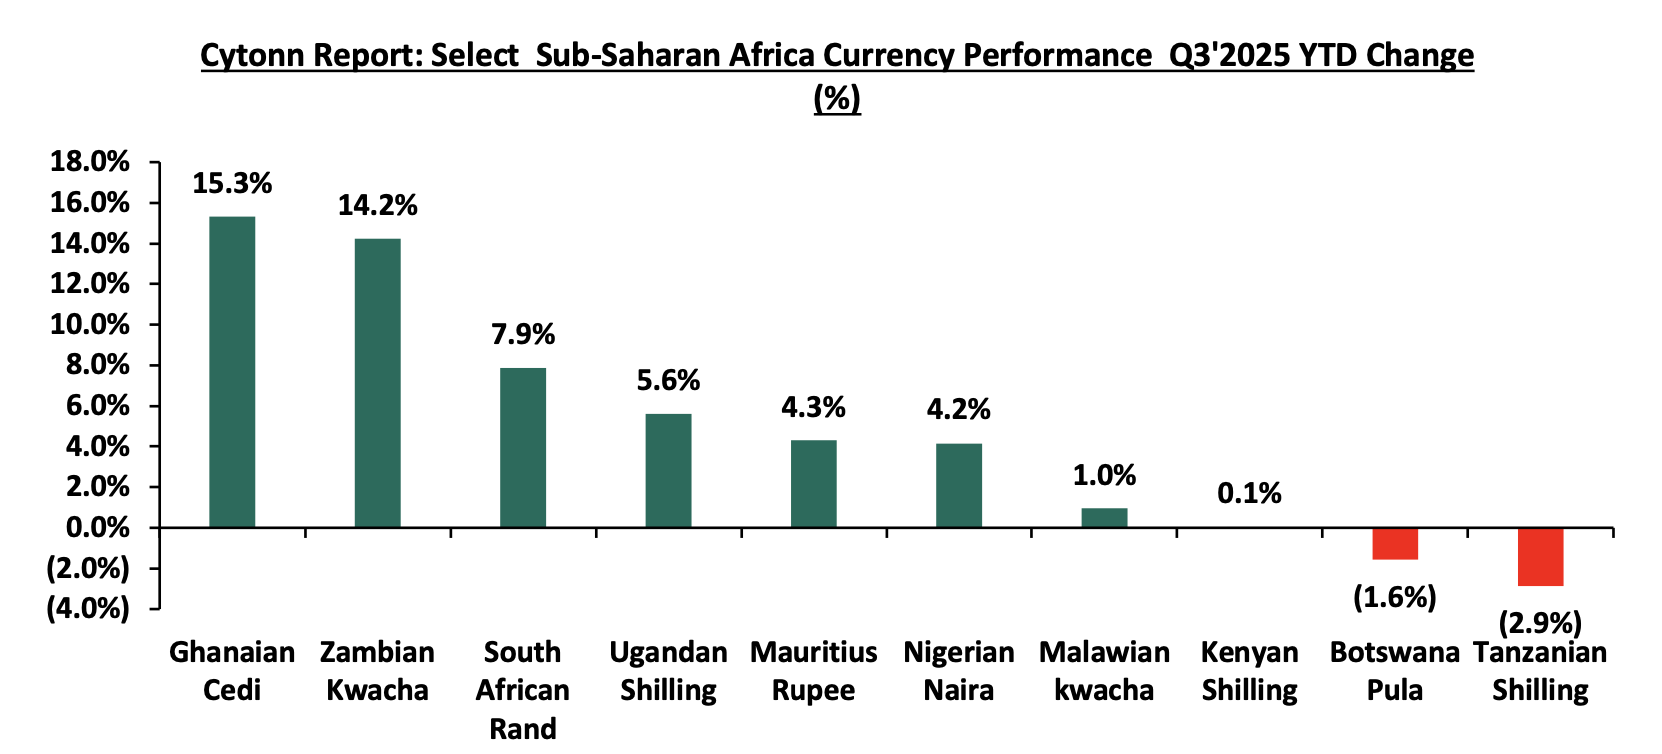
In Q3’2025, most of the select Sub-Saharan currencies appreciated against the US Dollar, primarily due to the respective central bank efforts, increased foreign currency inflows and debt-restructuring and policy reforms which have improved forex reserves. Notably, the Ghanaian Cedi emerged as the best performer among the selected currencies, appreciating by 15.3% against the USD on a year-to-date basis, closing Q3'2025 at GHS 12.5, from GHS 14.7 at the beginning of the year. The Ghanaian Cedi’s performance is majorly attributable to improved monetary policies, reduced inflation, and strong export earnings from gold and cocoa. Below is a table showing the performance of select African currencies against the US Dollar:
|
Cytonn Report: Select Sub-Saharan Africa Currency Performance vs USD |
|||||
|
Currency |
Sep-24 |
Jan-25 |
Sep-25 |
Last 12 months |
YTD change (%) |
|
Ghanaian Cedi |
15.8 |
14.7 |
12.5 |
21.2% |
15.3% |
|
Zambian Kwacha |
26.4 |
27.9 |
23.9 |
9.3% |
14.2% |
|
South African Rand |
17.3 |
18.8 |
17.3 |
(0.1%) |
7.9% |
|
Ugandan Shilling |
3768.0 |
3,697.6 |
3490.2 |
7.4% |
5.6% |
|
Mauritius Rupee |
45.9 |
47.7 |
45.66 |
0.5% |
4.3% |
|
Nigerian Naira |
1,669.0 |
1,540.7 |
1,476.62 |
11.5% |
4.2% |
|
Malawian kwacha |
1,733.7 |
1,750.3 |
1,733.7 |
0.0% |
1.0% |
|
Kenyan Shilling |
129.2 |
129.3 |
129.2404 |
(0.0%) |
0.1% |
|
Botswana Pula |
13.0 |
14.0 |
14.2 |
(8.7%) |
(1.6%) |
|
Tanzanian Shilling |
2,730.0 |
2,374.7 |
2,442.8 |
10.5% |
(2.9%) |
Source: Yahoo Finance, Central Banks
The chart below shows the year-to-date performance of different sub-Saharan African countries in Q3’2025;
Source: Yahoo Finance
Key take outs from the above table and chart include:
- The Ghanaian Cedi was the largest gainer against the USD Dollar, gaining by 15.3% year to date to close at GHS 12.5 as at the end of September from the GHS 15.8 recorded at the beginning of the year. The Cedi’s strength has been supported by several factors, including improved monetary policies, lower inflation, robust export revenues from gold and cocoa, and economic recovery that attracted global investors. and,
- The Tanzanian Shilling was the worst performing currency in Q3’2025, depreciating by 2.9%, mainly as a result of the country’s heavy dependence on imports, underperforming export sectors, and limited foreign exchange inflows to support the currency.
African Eurobonds:
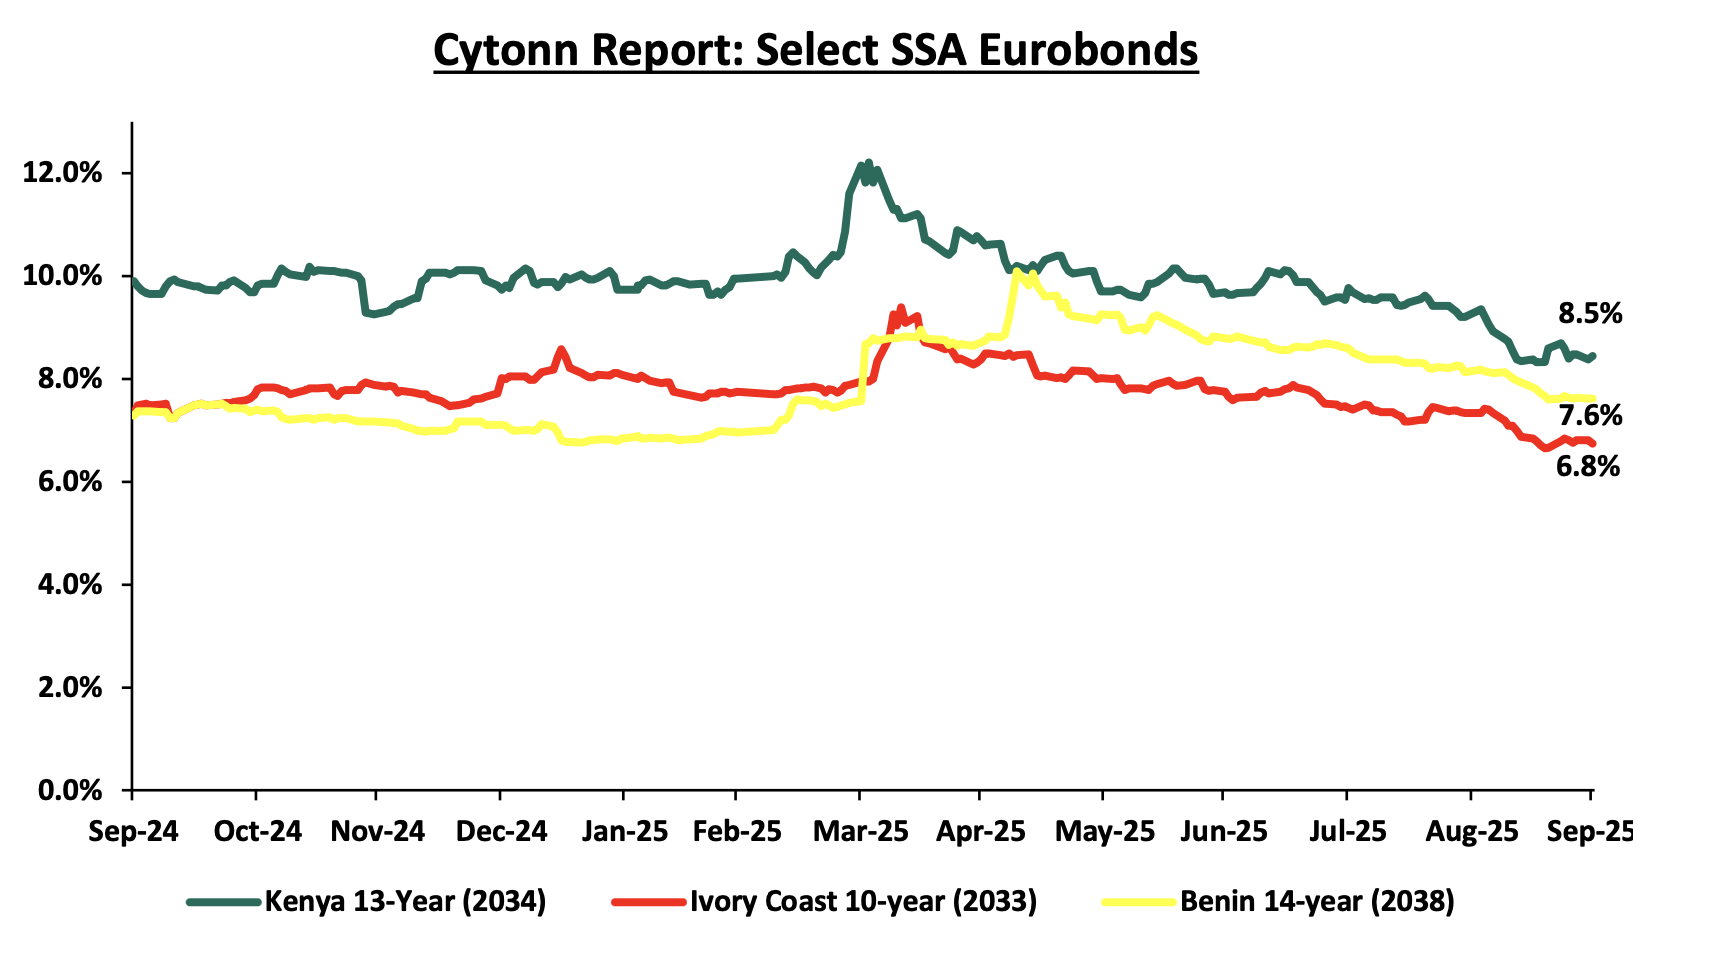
Africa’s appetite for foreign-denominated debt has increased in recent times with the latest issuers during the nine months to end of Q3’2025 being being Ivory Coast and Benin raising a total of USD 1.8 bn and USD 0.5 bn respectively in March 2025 and January 2025 respectively. Additionally, 2024 issuers were Ivory Coast, Benin, Kenya, Senegal and Cameroon raising a total of USD 2.6 bn, USD 0.8 bn, USD 1.5 bn, USD 0.8 bn and USD 0.6 bn respectively. Notably, all the bonds were oversubscribed with the high support being driven by the yield hungry investors and also the outlook of positive recovery in the regional economies. It is good to note that there was a general decline in the yields of the various bonds from most countries due to general improvement in investor sentiment as the economy recovers and the easing inflationary pressures in the region. The Yields of the Kenya’s 13-year Eurobond maturing in 2034 decreased by 1.4% points to 8.5% as at the end of September 2025 from 9.9% in September 2024. Similarly, the yields for Benin’s 14-year and Ivory Coast’s 10-year Eurobonds maturing in 2038 and 2033 respectively decreased by 0.3% points and 0.6% points to 7.6% and 6.7% respectively at the end of September 2025, down from 7.3% each in September 2024. Below is a graph showing the Eurobond secondary market performance of select Eurobonds issued by the respective countries:
Source: Bloomberg, CBK
Equities Market Performance:
Sub-Saharan Africa (SSA) stock markets were on an upward trajectory in Q3’2025, with Ghana’s stock market (GSECI) being the best performing market gaining by 96.5% YTD attributable to gains in the large-cap stocks such as MTN Ghana, Ecobank and Total Energies gaining by 48.5%, 37.9% and 34.5% respectively following improved earnings and growing investor interest in telecom stocks offering attractive dividend payouts. Below is a summary of the performance of key indices:
|
Cytonn Report: Equities Market Performance Q3'2025(Dollarized*) |
||||||
|
Country |
Index |
Sep-24 |
Jan-25 |
Sep-25 |
Last 12 months |
YTD Change |
|
Ghana |
GSECI |
277.6 |
333.8 |
656.1 |
136.3% |
96.5% |
|
Zambia |
LASILZ |
626.5 |
578.8 |
844.4 |
34.8% |
45.9% |
|
Kenya |
NASI |
0.8 |
1.0 |
1.4 |
65.0% |
43.2% |
|
South Africa |
JALSH |
5,015.1 |
4,502.1 |
6,246.1 |
24.5% |
38.7% |
|
Nigeria |
NGEASI |
59.1 |
67.5 |
96.6 |
63.7% |
43.2% |
|
Uganda |
USEASI |
0.3 |
0.3 |
0.4 |
44.9% |
33.5% |
|
Tanzania |
DARSDEI |
0.8 |
0.9 |
1.0 |
31.6% |
17.3% |
|
Rwanda |
RSEASI |
0.1 |
0.1 |
0.1 |
13.7% |
15.0% |
|
*The index values are dollarized for ease of comparison |
||||||
Source: Cytonn Research, Kwayisi, Yahoo Finance
The chart below shows the YTD Performance of the sub-Saharan Equities Market;
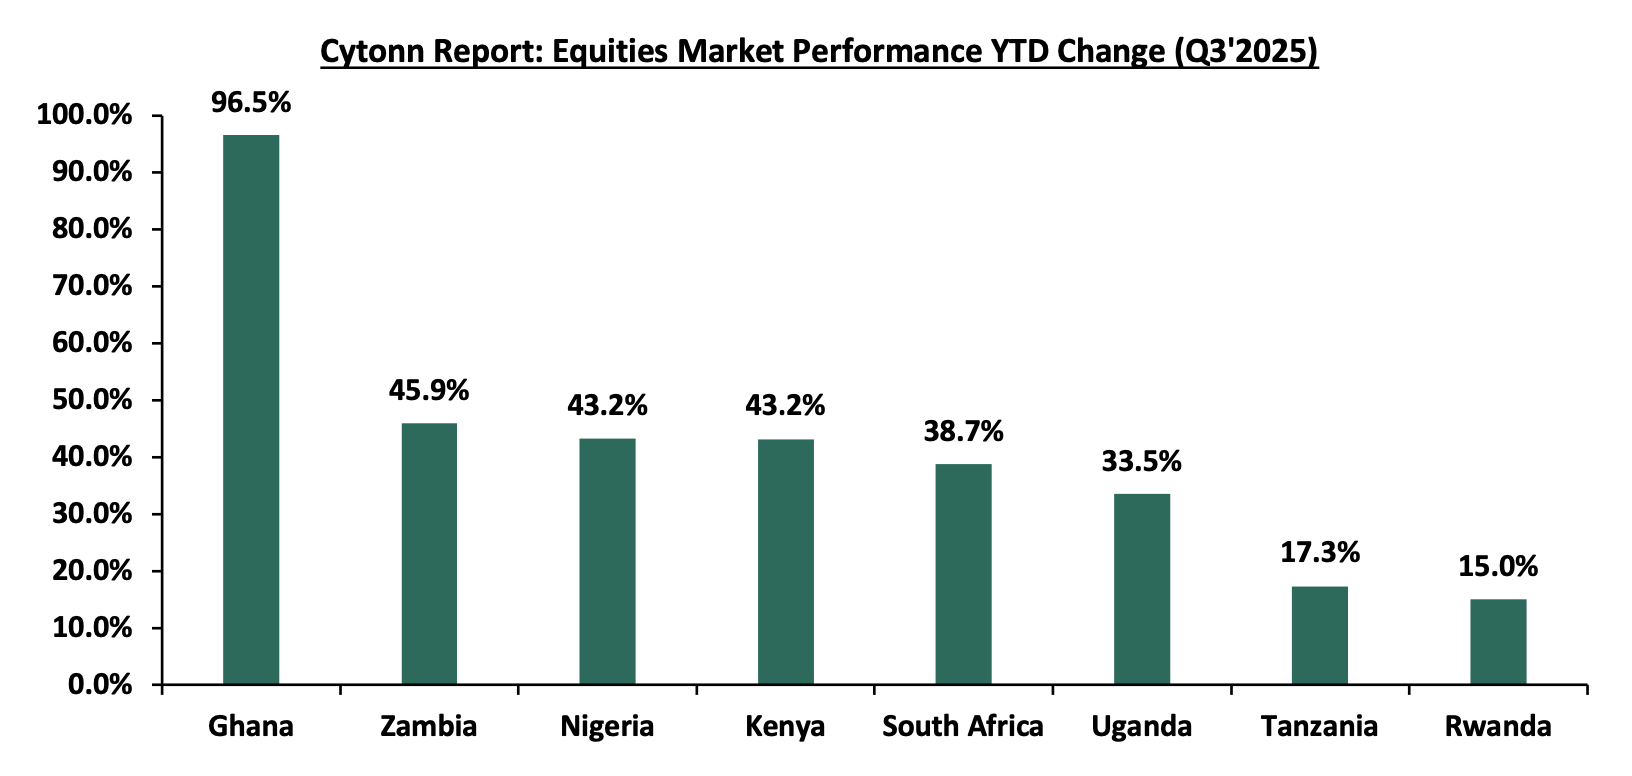
Dollarized performance
GDP growth in the Sub-Saharan Africa region is expected to improve, in contrast with the rest of the global economy. Additionally, public debt continues to be a major headwind, with high debt levels experienced in the region on the back of continued weakening of local currencies, which will make debt servicing costlier, making the region less attractive to foreign capital.
According to the Kenya National Bureau of Statistics (KNBS) Q2'2025 Quarterly GDP Report, the Kenyan economy recorded a 5.0% growth in Q2’2025, 0.4% points higher from the 4.6% growth rate recorded in Q2’2024. The main contributor to Kenyan GDP remains to be the Agriculture, Fishing and Forestry sector which grew by 4.4% in Q2’2025, lower than the 4.5% expansion recorded in Q2’2024. All sectors in Q2’2025 recorded positive growths, with varying magnitudes across activities. Most sectors recorded contraction in growth rates compared to Q2’2024 with Accommodation & Food Services, Financial Services Indirectly Measured and Other services recording growth rate declines of 27.2%, 8.9% and 3.4% points to 7.8%, 1.4% and 1.4% from 35.0%, 10.3% and 4.8% respectively. Other sectors recorded an expansion in growth rates, from what was recorded in Q2’2024, with Mining and Quarrying, Construction and Electricity and water supply recording the highest growths in rates of 20.8%, 9.4% and 4.5% points, to 15.3%, 5.7% and 5.7% from (5.5%), (3.7%) and 1.2% respectively. Notably, the overall economic performance highlighted modest growth despite a slowdown in several key sectors, reflecting the mixed performance across industries amid a challenging operating environment. In 2025, the Kenyan economy is expected to rebound, returning to its growth path, with the average projected growth estimated at 5.0% by various organizations as outlined below:
|
Cytonn Report: Kenya 2025 Growth Projections |
||
|
No. |
Organization |
2025 GDP Projections |
|
1 |
International Monetary Fund |
4.8% |
|
2 |
National Treasury |
5.2% |
|
3 |
World Bank |
4.5% |
|
4 |
Fitch Solutions |
5.1% |
|
5 |
Cytonn Investments Management PLC |
5.4% |
|
Average |
5.0% |
|
Source: Cytonn Research
Key to note, Kenya’s general business environment improved slightly in Q3’2025, with the average Purchasing Manager’s Index for the quarter coming at 49.4, compared to 46.9 recorded in a similar period in 2024. The improvement was mainly on the back of a stronger and stable Shilling, despite the slight increase in inflation averaging at 4.4% in Q3’2025, 0.3% points higher than the 4.1% average rate for Q3’2024. Additionally, the easing monetary policy stance is expected to continue to reduce the cost of borrowing and increase spending therefore supporting business activity. The chart below summarizes the evolution of PMI over the last 24 months. (A reading above 50.0 signals an improvement in business conditions, while readings below 50.0 indicate a deterioration):
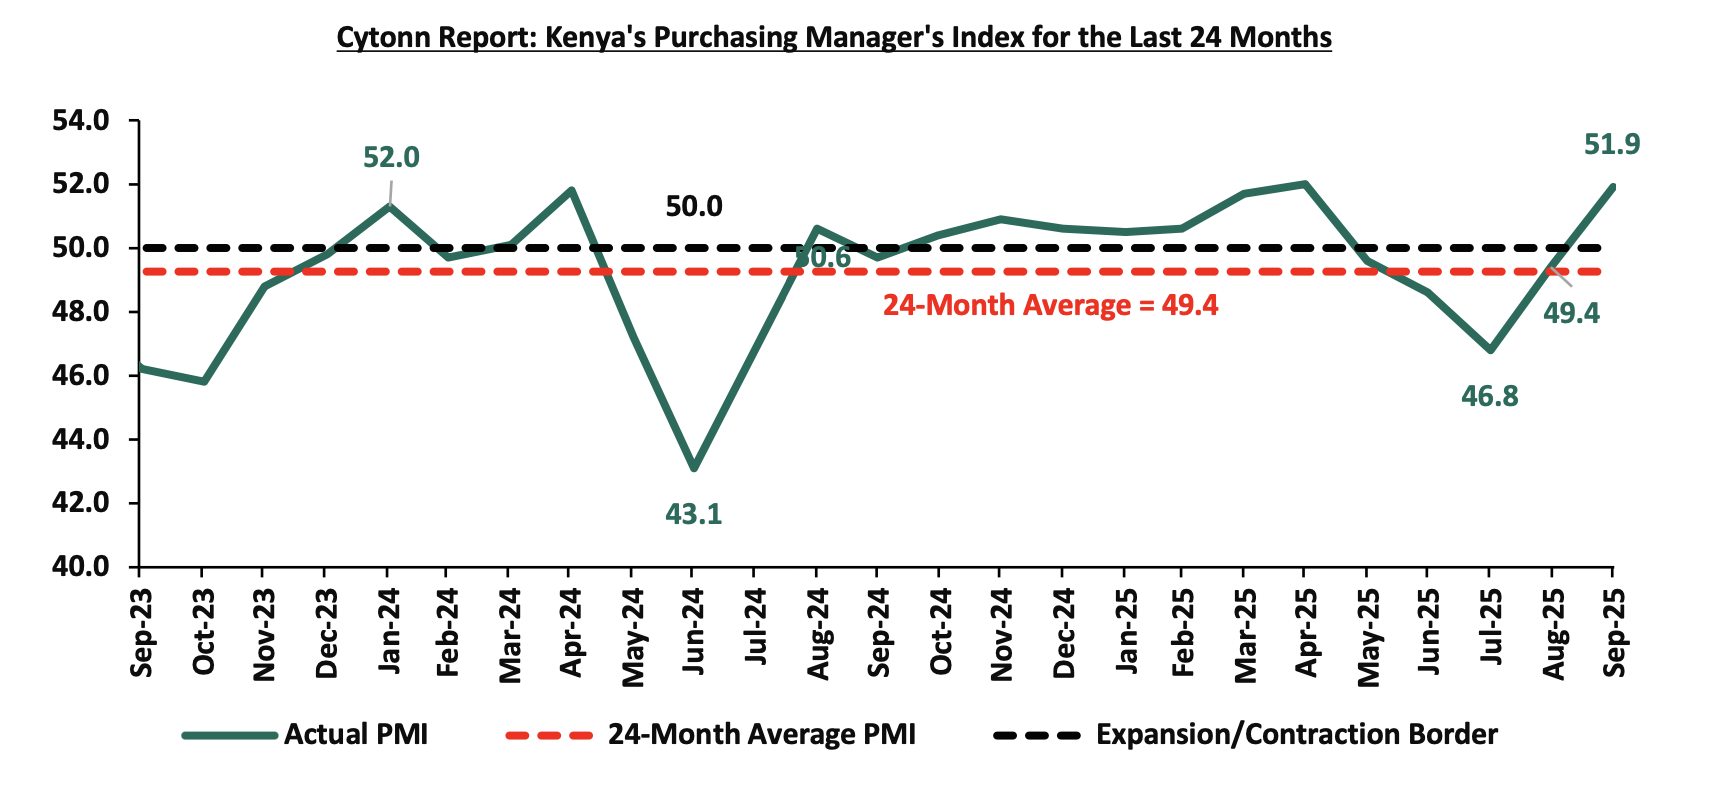
Stanbic Bank’s September 2025 Purchasing Manager’s Index (PMI)
During the week, Stanbic Bank released its monthly Purchasing Managers’ Index (PMI) showing that business conditions in the private sector improved in September 2025, marking the first expansion since April. The headline PMI rose to 51.9 in September, up from 49.4 in August, moving above the neutral 50.0 threshold and signaling a renewed upturn in private sector activity. The improvement followed months of protest-related disruptions and subdued sales, reflecting early signs of demand stabilization. On a year-to-year basis, additionally, the index has recorded a 4.4% increase to 51.9 in September 2025 from the 49.7 posted in September 2024, highlighting relatively stronger conditions compared to the same period last year.
Business output returned to growth, ending a four-month sequence of contraction. The rebound was supported by expansions in manufacturing, wholesale & retail, and services, which outweighed persistent weakness in construction. Similarly, new orders registered solid growth, snapping four consecutive months of decline as improved political stability and marketing efforts boosted demand. Roughly a third of surveyed firms reported higher output, while only 23.0% recorded a decline.
On the employment front, hiring activity strengthened further, with job creation reaching its fastest pace since May 2023. The rise in staffing helped firms reduce backlogs for the fourth consecutive month, pointing to improved capacity. Nevertheless, purchasing activity remained in negative territory, with firms cautious about committing to higher input volumes after months of weak sales. Despite this, inventories increased as some firms resumed procurement in anticipation of stronger demand. Supplier performance also improved markedly, with average delivery times shortening at the fastest pace in four years, reflecting easing supply-side pressures and stronger vendor competition. On prices, Kenyan companies continued to face cost pressures, though the rate of input cost inflation moderated for a second consecutive month. Firms cited higher taxes and commodity prices, especially fuel and food items, as key drivers. Selling prices, meanwhile, rose modestly, partly reflecting cost pass-through but also higher sales volumes.
Overall, while the private sector still faces headwinds from elevated taxes, higher commodity costs, and soft consumer demand, the September PMI reading highlights a tentative recovery in operating conditions. Business confidence remained strong, though below historical averages, as firms pinned hopes on product diversification, marketing strategies, and outlet expansion to sustain growth. The private sector outlook is expected to benefit from easing supply-side pressures, improving political stability, and a more accommodative monetary policy stance, all of which should help anchor a gradual recovery in activity.
Going forward, we expect the private sector to continue experiencing a fragile recovery, supported by easing supply-side bottlenecks, improved political stability, and a more accommodative monetary policy stance by the CBK. However, structural challenges such as elevated fuel prices, rising taxation, and subdued consumer purchasing power will likely constrain the pace of recovery. As such, while short-term improvements are evident, a sustained upturn in business conditions will depend heavily on continued policy support, effective inflation management, and stronger domestic demand.
Inflation:
The average inflation rate increased to 4.4% in Q3’2025, compared to 4.1% in Q3’2024, attributable to a stronger and stable Shilling, leading to reduced fuel prices. Notably, fuel prices of Super petrol, Diesel, and Kerosene decreased by 0.4%, 0.1% and 0.5% in September 2025 to Kshs 184.5 Kshs 171.5 and Kshs 154.8, from Kshs 185.3, Kshs 171.6, and Kshs 155.6 per litre in August 2025 respectively. Inflation for the month of September 2025 rose slightly by 0.1% point to 4.6% up from 4.5% recorded in August 2025, mainly driven by an 8.4% increase in the food and non-alcoholic beverages index, a 4.0% increase in transport costs and a 1.4% rise in housing, water, electricity, gas and other fuels. Below is a chart showing the inflation trend for the last five years:
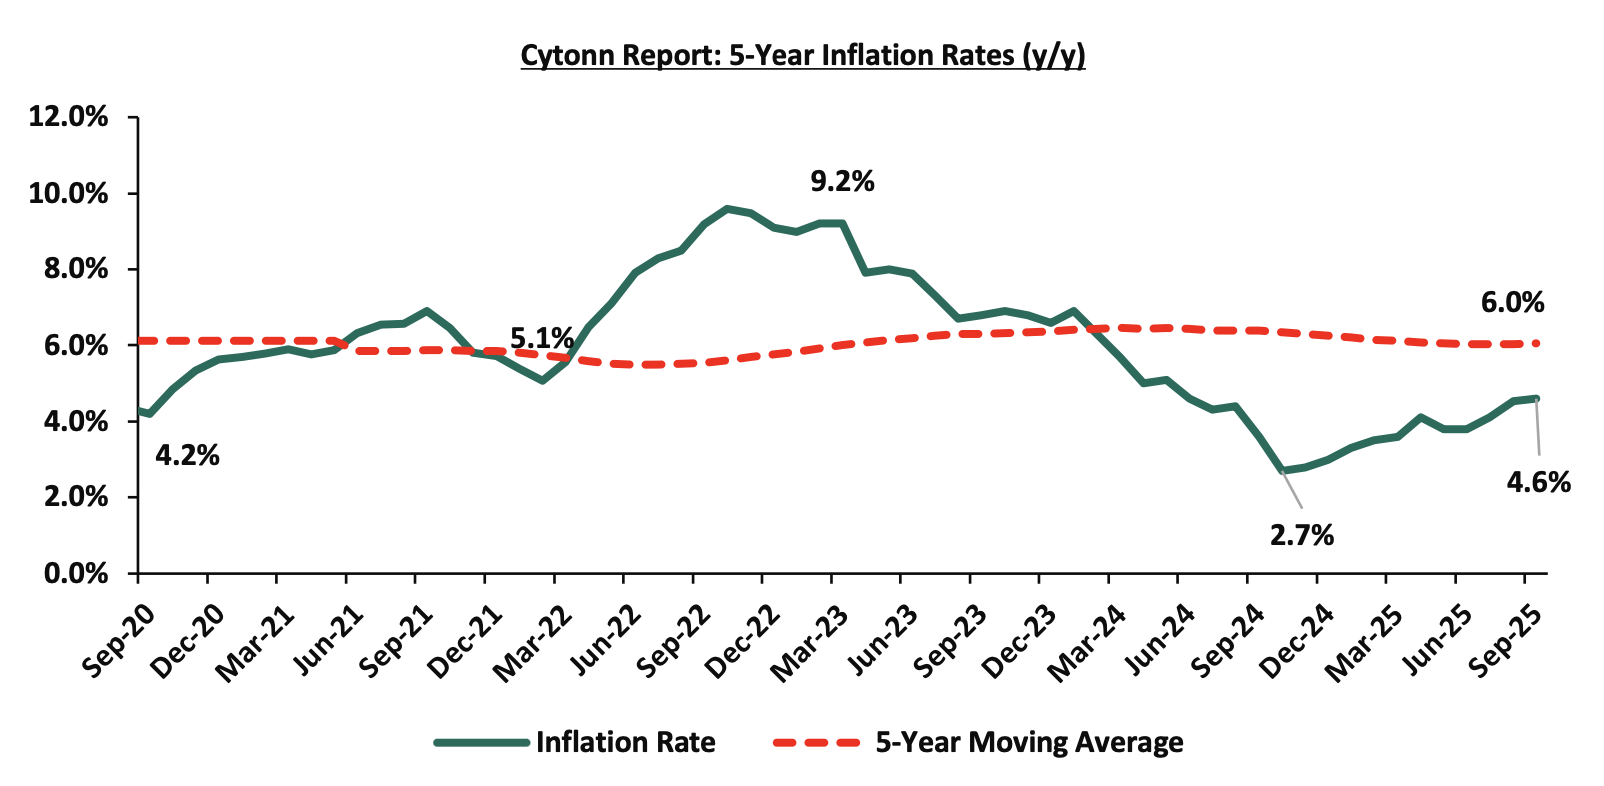
For the last 27 months, Kenya’s inflation has persistently remained within the Central Bank of Kenya (CBK) target range of 2.5% - 7.5%, owing to a stronger Shilling, reduced fuel and electricity prices. With the continued easing of monetary policy following the MPC’s observation that its earlier measures had stabilized the Shilling and anchored inflation, the focus has now shifted to lowering borrowing costs, supporting the private sector, and promoting economic growth. As a result, we expect this to exert upward pressure on inflation. The Monetary Policy Committee (MPC) has lowered the Central Bank Rate (CBR) by cumulative of 350 bps since August 2024, to 9.50% in August 2025 from 13.00%, in 2024. Going forward, we still expect the inflationary pressures to remain within the CBK’s preferred target range of 2.5% - 7.5%.
September 2025 Inflation
The year-on-year inflation in September 2025 rose slightly to 4.6%, up from 4.5% recorded in August 2025. This was in line with our projection of an increase to within the range of 4.1%- 4.6% where our decision was mainly driven by the easing in the Central Bank Rate (CBR) to 9.50% in August 2025 and a slight depreciation of the Kenya Shilling against the US Dollar. The headline inflation was primarily driven by price increases in the following categories: Food & Non-Alcoholic Beverages at 8.4%, Transport at 4.0%, and Housing, Water, Electricity, Gas and Other Fuels at 1.4%. The month-on-month inflation rate stood at 0.2% in September 2025. The table below summarizes the performance of commodity indices both on a year-on-year and month-on-month basis:
|
Cytonn Report: Major Inflation Changes – September 2025 |
|||
|
Broad Commodity Group |
Price change m/m (September-2025/ August -2025) |
Price change y/y (September-2025/September-2024) |
Reason |
|
Food and non- alcoholic beverages |
0.5% |
8.4% |
The m/m increase was mainly driven by the increase in prices of fruits and vegetables such as Oranges, Mangoes, Cabbages, potatoes and tomatoes by 5.6%, 3.0%, 2.7%, 2.6% and 1.2% respectively. However, the increase was weighed down by decrease in prices of Sifted Maize flour, Fortified Maize flour, Spinach and Sukuma Wiki of 3.0%, 2.2%, 1.8% and 1.0% respectively |
|
Transport |
(0.3%) |
4.0% |
The transport index recorded a slight m/m decrease mainly due to a decrease in prices of passenger transport costs with the bus/matatu fare for travel between towns dropped by 0.5%. Prices of Diesel and Petrol declined by 0.1% and 0.4%, to retail at Kshs 172.6 and Kshs 185.6 respectively. |
|
Housing, water, electricity, gas and other fuels |
0.5% |
1.4% |
The m/m increase was mainly driven by an increase in prices of 50kWh electricity and 200kWh electricity by 1.1% and 1.0% respectively. while single room house rent recorded an increase of 0.2%. However, the increase was weighed down by the decrease in prices of Kerosene and gas/LPG by 0.5% and 0.2% respectively. |
|
Overall Inflation |
0.2% |
4.6% |
The m/m increase was mainly attributable to the 0.5% increase in food and non-alcoholic beverages. |
In September 2025, overall inflation rose slightly to 4.6% on a y/y basis, up from 4.5% in August 2025, signaling mild upward price pressure in key sectors. Despite this, the inflation rate remained within the Central Bank of Kenya’s preferred range of 2.5%–7.5% for the twenty-seventh consecutive month, underscoring ongoing macroeconomic stability. The increase was primarily driven by an 8.4% y/y rise in food and non-alcoholic beverage prices, a 4.0% increase in transport costs and a 1.4% rise in housing, water, electricity, gas and other fuels. On a month-to-month basis, inflation was marginal at 0.2%, indicating relative price stability. Prices for Super Petrol, Diesel and Kerosene decreased by 0.4%, 0.1% and 0.5% respectively. Despite diesel, super petrol and kerosene prices decreasing, prices are still high, resulting in high production costs and high costs of goods and services. Additionally, the recent reduction in the Central Bank Rate to 9.50% from 9.75% is expected to stimulate credit uptake and increase money supply, which could gradually exert upward pressure on inflation in the coming months as monetary easing transmits through the broader economy. Meanwhile, the Kenya Shilling maintained stability, recording a 0.2 bps month-to-date appreciation as of 30th September 2025 to remain relatively unchanged from the Kshs 129.2 recorded at the end of August and a 5.1 bps year-to-date gain to Kshs 129.2 as of 3rd October, 2025, from the Kshs 129.3 recorded at the beginning of the year. This stabilization in the exchange rate, combined with manageable fuel price increases, continues to anchor inflation expectations within the CBK’s target range.
Going forward, we expect inflation to remain within the CBK’s preferred range of 2.5%-7.5%, mainly on the back of a stable currency and stable fuel prices. Additionally, favourable weather conditions will also contribute to stabilizing food prices, further supporting stable inflation rates. The risk, however, lies in the fuel prices which despite their stability, still remain elevated compared to historical levels. Additionally, the Monetary Policy Committee cut the Central Bank Rate by 25.0 bps to 9.50% from 9.75% in its August 2025 meeting, with the aim of easing the monetary policy, while maintaining exchange rate stability, and will meet again in October 2025. This cut in the Central Bank Rate is likely to elevate inflationary pressures gradually as consumer spending rises from increased money supply. The committee is expected to adopt a more cautious approach to rate adjustments in the coming meetings in a bid to continue supporting the private sector, while also keeping an eye on the effect on the inflation and exchange rate.
The Kenyan Shilling:
The Kenyan Shilling remained stable against the US Dollar, appreciating slightly by 0.2 bps in Q3’2025, to remain relatively unchanged from the Kshs 129.2 recorded at the beginning of the quarter, mainly attributable to the improved forex reserves during the period which increased by 33.7% to USD 10.7 bn as of 25th September 2025 from USD 8.0 bn recorded in September 2024. Additionally, the Eurobond buyback program of the USD 900.0mn tranche maturing in 2027 in February 2025 alleviated the credit risk on the country, increasing dollar supply in the market. Additionally, during the week, the Kenya Shilling appreciated slightly against the US Dollar by 1.7 bps to close at 129.2 from 129.3 recorded the previous week.
We expect the shilling to be supported by:
- Diaspora remittances standing at a cumulative USD 5,078.8 mn in the twelve months to August 2025, 9.4% higher than the USD 4,644.5 mn recorded over the same period in 2024. These has continued to cushion the shilling against further depreciation. In the August 2025 diaspora remittances figures, North America remained the largest source of remittances to Kenya accounting for 60.6% in the period,
- The tourism inflow receipts which came in at Kshs 452.2 bn in 2024, a 19.8% increase from Kshs 377.5 bn inflow receipts recorded in 2023, and owing to tourist arrivals that improved by 9.9% to 2,424,382 in the 12 months to June 2025 from 2,206,469 in the 12 months to June 2024, and,
- Improved forex reserves currently at USD 10.7 bn (equivalent to 4.7-months of import cover), which is above the statutory requirement of maintaining at least 4.0-months of import cover and above the EAC region’s convergence criteria of 4.0-months of import cover.
The shilling is however expected to remain under pressure in 2025 as a result of:
- An ever-present current account deficit which came at 1.6% of GDP in the twelve months to June 2025, and,
- The need for government debt servicing, continues to put pressure on forex reserves given that 61.4% of Kenya’s external debt is US Dollar-denominated as of March 2025.
Monetary Policy:
The Monetary Policy Committee (MPC) met once in Q3’2025 and lowered the CBR rate by 25.0 bps to 9.50%, from 9.75% in August 2025 against a backdrop of elevated uncertainties to the global outlook for growth, lower but sticky inflation in advanced economies heightened trade tensions as well as persistent geopolitical tensions. Below are some of the key highlights from the August 2025 meeting:
- The overall inflation increased by 0.3% points to 4.1% in July 2025, from 3.8% in June 2025, remaining below the mid-point of the preferred CBK range of 2.5%-7.5%. Core inflation increased to 3.1% in July 2025, from 3.0% in June, reflecting increasing demand pressures in the economy. This increase was largely attributed to higher prices of processed foods, particularly sugar and maize flour. Additionally, non-core inflation rose to 7.2% in July 2025, from 6.2 % in June, driven by higher energy prices. Lower energy and utilities costs, including reduced electricity and fuel prices, continued to help moderate non-core inflation. Overall inflation is expected to stay below the mid-point of the target range in the near term, supported by low food prices, stable energy prices, and a stable exchange rate.
- The recently released Quarterly Gross Domestic Product Report, for Q1’2025 showed a resilience in the performance of the Kenyan economy, with real GDP growing by 4.9%, compared to the similar growth recorded in Q1’2024. This was attributable to expansion in growth in agriculture and industrial sectors of the economy. The economy is expected to continue to strengthen in 2025 with real GDP growth projected at 5.2%, from the 4.7% growth recorded in 2024 supported by resilient services sector and agriculture, expected recovery in the industrial sector. However, this positive outlook is tempered by geopolitical tensions and trade policy uncertainties.
- The Kenya National Bureau of Statistics (KNBS) updated the balance of payments data to better capture cross-border transactions, especially those involving petroleum imports and re-exports under government-to-government deals. The revisions also include the use of alternative data sources to enhance accuracy in reporting international trade in services, notably travel and financial services. These adjustments refine the recording of regional oil product re-exports and international travel earnings.
- Based on the revised balance of payments data goods exports increased by 7.7% in the 12 months to June 2025, compared to 2024, reflecting a rise in exports of agricultural commodities, especially horticulture, coffee, vegetable oil and clothing accessories. Goods imports rose by 9.9% reflecting increases in intermediate and capital goods imports. Additionally, services receipts increased by 12.5%, driven by increased receipts from transport and travel services, while diaspora remittances increased by 12.1%. The current account deficit in 12 months to June 2025 is estimated at 1.6% of GDP, down from 1.8% in similar period in 2024. For 2025, the current account deficit is projected at 1.5% of GDP, up from 1.3% in 2024 and is expected to be fully financed by capital and financial inflows, yielding a balance of payments surplus of USD 673.0 mn.
- The CBK foreign exchange reserves, which currently stand at USD 10,966.0 representing 4.8 months of import cover, which is above the statutory requirement of maintaining at least 4.0-months of import cover, continue to provide adequate cover and a buffer against any short-term shocks in the foreign exchange market,
- The banking sector remains stable and resilient, with strong liquidity and capital adequacy ratios. The ratio of gross non-performing loans (NPLs) to gross loans remained unchanged in June 2025 from the 17.6% recorded in April 2025. Decreases in NPLs were noted in the building and construction, personal and household, and manufacturing sectors while increases were recorded in trade and tourism, restaurant and hotel sectors. Banks have continued to make adequate provisions for the NPLs,
- The CEOs Survey and Market Perceptions Survey conducted ahead of the MPC meeting in July 2025 revealed sustained optimism about business activity and economic growth prospects for the next 12 months. The optimism was attributed to the stable macroeconomic environment reflected in the low inflation rate and stability in the exchange rate, decline in interest rates, expansion in the digital economy and favorable weather conditions supporting agriculture. Nevertheless, respondents expressed concerns about high cost of doing business, subdued consumer demand and increased global uncertainties due to increased tariffs and geopolitical tensions,
- The Survey of the Agriculture Sector for July 2025 revealed an expectation for decline in food prices, on account of favourable weather conditions and the beginning of the harvest season for key crops, especially maize,
- Global economic growth showed steady recovery in 2024 coming in at 3.3%. However, the outlook for 2025 is projected to decline to 3.0%, an upward revision from 2.8% particularly from revisions in the growth in United States and China, due to lower tariffs on trade and global financial conditions. However, uncertainties from trade policies and tariffs as well as escalating geopolitical risks, particularly ongoing conflicts in the Middle East and the Russia-Ukraine war, continue to threaten global growth prospects,
- Global headline inflation is expected to decline, due to decreased energy prices and reduced global demand. Central banks in advanced economies have continued to cut interest rates, albeit cautiously. International oil prices have declined amid higher production and weak demand, yet volatility risks remain elevated due to trade tensions and ongoing geopolitical conflicts. Food inflation has tightened, largely due to high prices of edible oil prices, although inflation in cereals and sugar remain low.
- The Committee was informed on the proposed revised banking sector Risk-Based Credit Pricing (RBCP) model. The model aims to facilitate monetary policy decisions such as setting interest rates, which will effectively influence the lending rates by commercial banks.
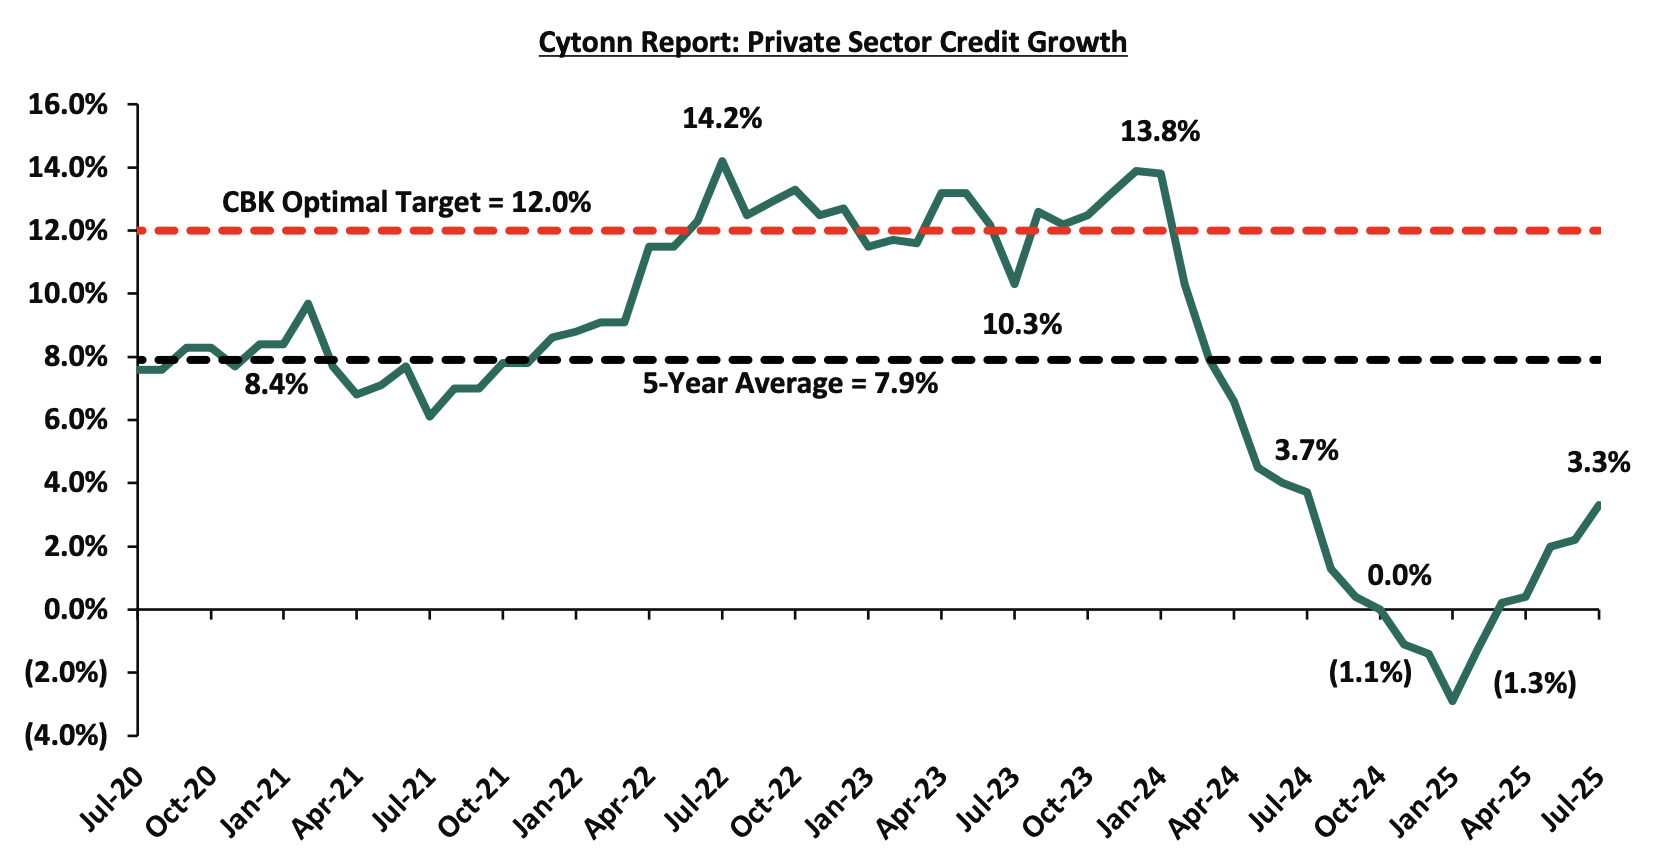
- Growth in private sector credit grew by 3.3% in July 2025 from 2.2% in June and a contraction of 2.9% in January 2025, mainly attributed increased demand attributable to declining lending interest rates. Notably, the growth in credit was recorded in key sectors such as manufacturing, trade, building and construction, and consumer durables since the last MPC meeting in June. Average commercial banks’ lending rates declined to 15.2% in July from 15.3% in June 2025 and 17.2% in November 2024. The chart below shows growth in private sector growth over the last five years:
- The Committee acknowledged the outcome of the implementation of the FY’2024/25 Budget and the Budget for FY’2025/26. These measures are anticipated to further support fiscal consolidation, which should reduce debt vulnerabilities in the medium-term.
The MPC noted that overall inflation is expected to remain below the midpoint of the 2.5%-5.0% target range in the near term, supported by low food prices, stable energy prices, and exchange rate stability. Additionally, central banks in major economies have continued to lower interest rates at a cautious pace. The Committee also noted that the recent economic developments, created room for further easing of monetary policy to support economic activity while maintaining exchange rate stability. The MPC noted that it will continue to monitor the effects of these policy measures, as well as global and domestic economic developments, and will remain ready to take additional action if necessary. Going forward, we expect the MPC to adopt a more cautious approach to rate adjustments in the coming meetings in a bid to continue supporting the private sector, while also keeping an eye on the effect on the inflation and exchange rate. The next MPC meeting is scheduled for 7th October 2025.
Fiscal Policy:
The total Kenyan budget for the FY’2025/2026 National Budget increased by 7.1% to Kshs 4.3 tn from the Kshs 4.0 tn in FY’2024/2025 while the total revenue inclusive of grants increased by 8.0% to Kshs 3.4 tn from the Kshs 3.1 tn in FY’2024/2025. The expenditure will be funded by revenue collections of Kshs 3.4 tn and borrowings amounting to Kshs 923.2 bn. Of the Kshs 923.2 bn total borrowing, Kshs 635.5 bn is estimated to be domestic while Kshs 287.7 bn is estimated to be net foreign borrowing.
The increase in revenues is mainly due to an 6.7% increase in ordinary revenue to Kshs 2.8 tn for FY’2025/2026, from the Kshs 2.6 tn in FY’2024/2025 with the increase largely dependent on the effectiveness of the Kenya Revenue Authority in collecting taxes as well as an increase in some of the existing taxes to meet its revenue target. The government’s efforts have seemingly resulted in improved revenue collection as evidenced by 97.4% of the revenue targets in FY’2024/25, and having attained 97.4% of the prorated revenue numbers for FY’2024/25 as of end June 2025. However, there are still concerns about the government's ability to meet its revenue collection targets in FY’2025/2026 mainly on the back of the current operating environment with the high cost of living and heightened political climate.
The table below summarizes the key buckets and the projected changes:
|
Amounts in Kshs billions unless stated otherwise |
|||
|
Cytonn Report: Comparison between FY’2024/2025 and FY’2025/2026 Budgets Estimates |
|||
|
Item |
FY'2024/25 Supplementary Budget II |
FY'2025/26 Estimates |
Change y/y (%) |
|
Ordinary Revenue |
2,580.9 |
2,754.7 |
6.7% |
|
Ministerial Appropriation-in-Aid |
486.8 |
567.0 |
16.5% |
|
Total grants |
52.6 |
46.9 |
(10.8%) |
|
Total Revenue & Grants |
3,120.3 |
3,368.6 |
8.0% |
|
Recurrent expenditure |
1,705.7 |
1,805.0 |
5.8% |
|
Recurrent Consolidated Funds Services (CFS) |
1,242.7 |
1,337.3 |
7.6% |
|
Development expenditure |
624.7 |
693.2 |
13.0% |
|
County Transfer & Contingencies |
445.6 |
474.9 |
6.6% |
|
Total expenditure |
4,007.5 |
4,291.9 |
7.1% |
|
Fiscal deficit inclusive of grants |
(887.2) |
(923.3) |
4.1% |
|
Projected Deficit as % of GDP |
(5.1%) |
(4.8%) |
(0.3%) pts |
|
Net foreign borrowing |
281.5 |
287.4 |
2.2% |
|
Net domestic borrowing |
605.7 |
634.8 |
4.9% |
|
Total borrowing |
887.2 |
923.2 |
4.1% |
Source: National Treasury of Kenya, www.parliament.go.ke
For the FY’2024/2025, the government was not able to meet the revenue collection targets having collected Kshs 2,430.1 bn, equivalent to 97.4% of the revised estimates III of Kshs 2,496.2 bn for FY’2024/2025 and 97.4% of the prorated estimates of Kshs 2,496.2 bn in the twelve months of FY’2024/2025. Notably, the total expenditure amounted to Kshs 3,519.2 bn, equivalent to 78.6% of the revised estimates of Kshs 4,474.9 bn, and 85.8% of the prorated expenditure estimates of Kshs 4,102.0 bn, an indication of modest spending by the government. The total borrowings as at the end of June 2025 amounted to Kshs 1,558.6 bn, equivalent to 91.6% of the revised estimates of Kshs 1,702.2 bn and 91.6% of the prorated estimates of Kshs 1,702.2 bn.
Going forward, we believe that the persistent fiscal deficit owing to lower revenues relative to expenditure will force the government to borrow more. We therefore expect the government to cut on its expenditure, mostly the development expenditure, in order to finance the growing debt maturities and the ballooning recurrent expenditure.
Money Markets, T-Bills Primary Auction:
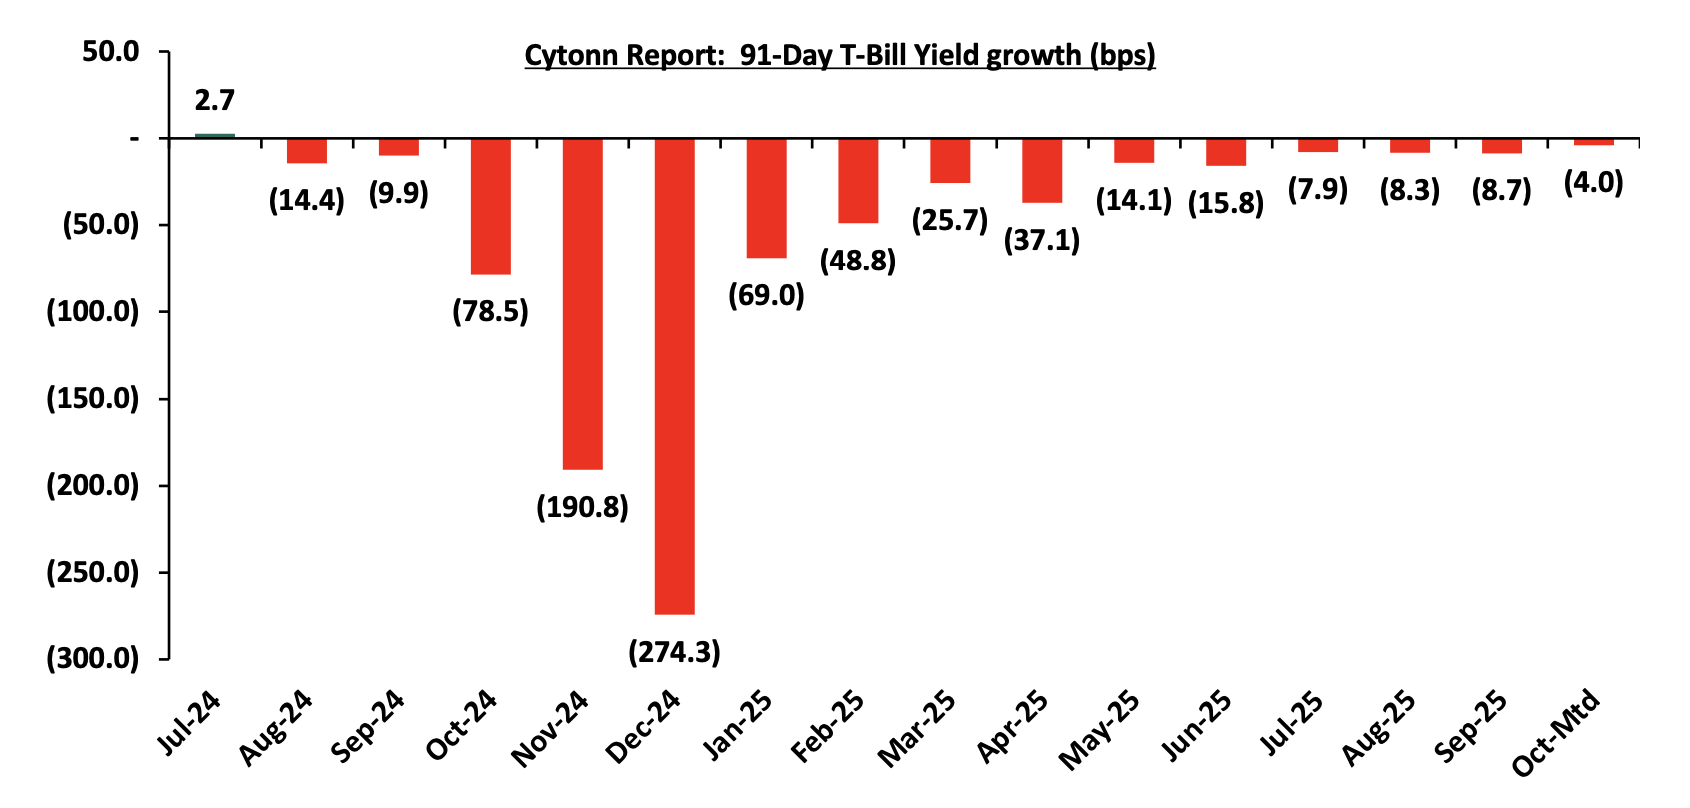
During Q3’2025, T-bills were oversubscribed, with the overall subscription rate coming in at 110.6%, up from 109.4% in Q3’2024. Investors’ preference for the 91-day paper persisted with the paper receiving bids worth Kshs 90.8 bn against the offered Kshs 52.0 bn, translating to an oversubscription rate of 174.6%, albeit lower than the oversubscription rate of 338.3% recorded in Q3’2024. Overall subscription rates for the 364-day papers came in at 136.1% which was higher than the 49.6% recorded in Q3’ 2024 while that for 182-day papers came in 59.6% which was lower than the 77.6% recorded in Q3’2024. The average yields on the 364-day, 182-day and 91-day papers decreased by 7.2%, 8.5% and 7.8% points to 9.6%, 8.2% and 8.0% in Q3’2025, respectively, from 16.9%, 16.7% and 15.9%, respectively, in Q3’2024. The downward trajectory in yields is primarily driven by improved investor confidence, stemming from reduced credit risk in the country and relatively eased inflationary pressures. This has lowered the risk premium demanded by investors. Despite the government's sustained domestic borrowing, strong demand for government securities has supported the decline in yields. During the period, the acceptance rate stood at 89.5%, down from 88.3% in Q3’2024, with the government accepting Kshs 308.9 billion out of the Kshs 345.1 billion worth of bids received. The chart below shows the yield growth rate for the 91-day paper during the year:
During the week, T-bills were undersubscribed for the third consecutive week, with the overall subscription rate coming in at 63.1%, slightly higher than the subscription rate of 62.9% recorded the previous week. Investors’ preference for the shorter 91-day paper waned, with the paper receiving bids worth Kshs 1.6 bn against the offered Kshs 4.0 bn, translating to a subscription rate of 40.4%, lower than the subscription rate of 40.5%, recorded the previous week. The subscription rates for the 182-day paper increased to 61.3% from the 19.4% recorded the previous week, while that of the 364-day paper decreased to 73.8% from the 115.3% recorded the previous week. The government accepted a total of Kshs 15.1 bn worth of bids out of Kshs 15.1 bn bids received, translating to an acceptance rate of 99.9%. The yields on the government papers registered a mixed performance with the yields on the 91-day paper increasing the most by 1.0 bps to 7.92% from the 7.91% recorded the previous week and the 364-day paper increased by 0.8 bps to 9.54% from 9.53% recorded the previous week while the yields on the 182-day papers decreased by 0.02 bps to 7.98% from 7.99% recorded the previous week.
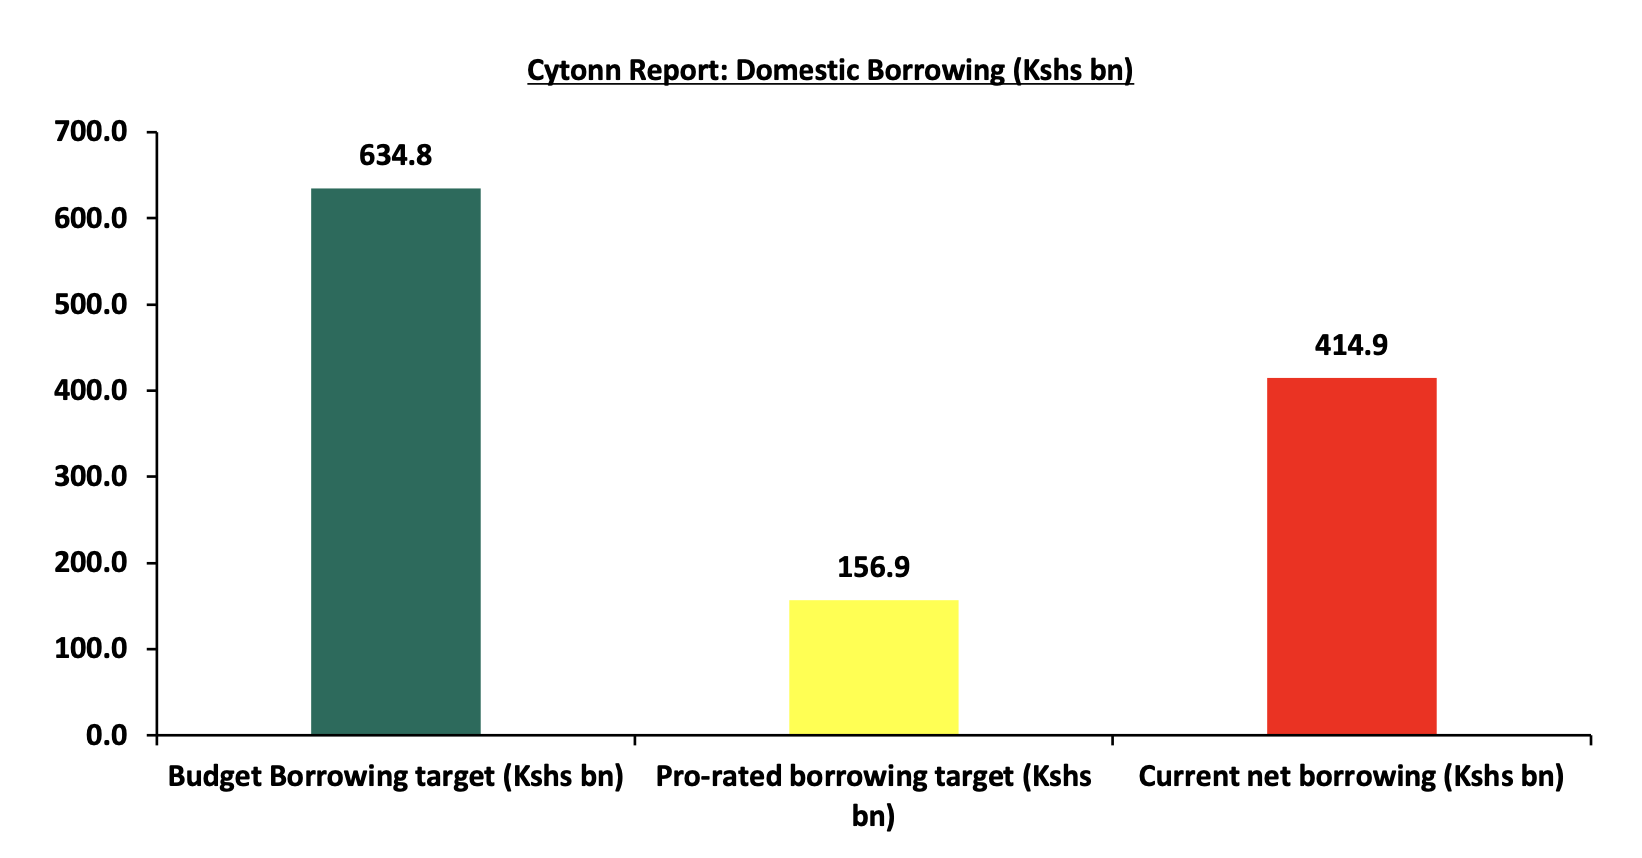
So far in the FY’2025/26, having advertised government securities totalling Kshs 586.0 bn. The government accepted bids worth Kshs 729.3 bn, of which Kshs 324.0 bn treasury bills and Kshs 405.3 bn were bonds. Total redemptions in FY’2025/26 amounted to Kshs 314.4 bn, with treasury bills accounting for Kshs 314.4 bn. As a result, currently, the government has a domestic borrowing surplus of Kshs 414.9 bn, which is 65.4% of the total net domestic borrowing target of Kshs 634.8 bn. The chart below shows the government’s current domestic borrowing:
The chart below compares the overall average T-bills subscription rates obtained in 2022, 2023, 2024 and 2025 Year to Date (YTD):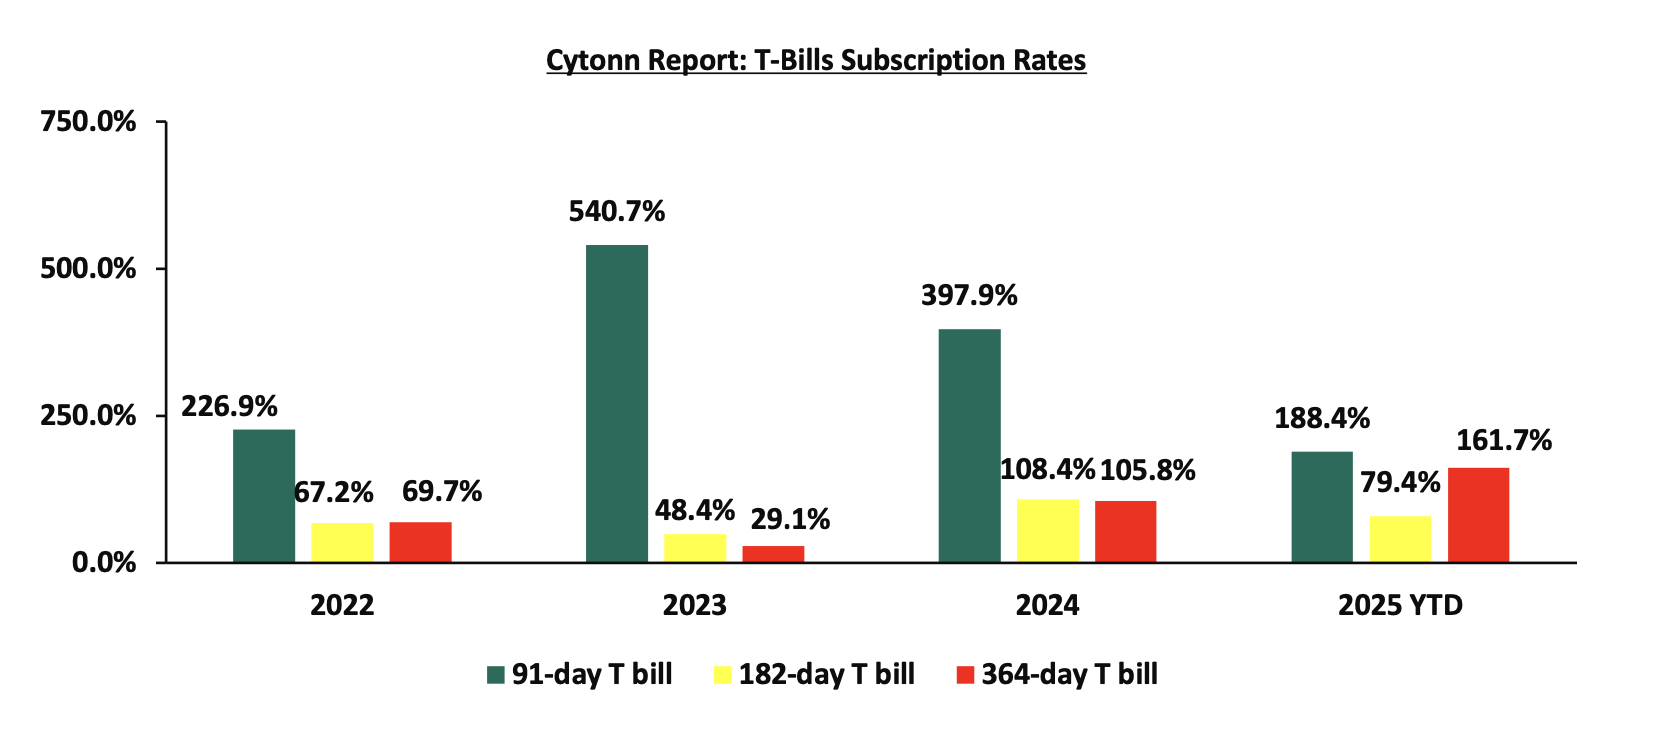
Primary T-Bond Auctions in Q3’2025
During Q3’2025, the Government reopened six, and issued two bonds on tap-sale, seeking to raise Kshs 250.0 bn. The bonds were generally oversubscribed, receiving total bids worth Kshs 713.1 bn translating to an overall subscription rate of 285.3%.Importantly, there was a notable shift towards offering longer-dated bonds, aligning with the government’s objective of lengthening the maturity profile of public debt and reducing refinancing risk. The government rejected expensive bids and only accepted bids worth Kshs 405.3 bn, out of the Kshs 713.1 bn of bids received, translating to an acceptance rate of 56.8%. The table below provides more details on the bonds issued during the period:
|
Cytonn Report: Bond Issuances in Q3’ 2025 |
|
||||||||||
|
Issue Date |
Bond Auctioned |
Effective Tenor to Maturity (Years) |
Coupon |
Amount offered (Kshs bn) |
Actual Amount Raised/Accepted (Kshs bn) |
Total bids received (Subscription) |
Average Accepted Yield |
Subscription Rate |
Acceptance Rate |
|
|
|
9/22/2025 |
FXD1/2018/020-Reopened |
12.5 |
13.2% |
40.0 |
23.5 |
33.4 |
13.6% |
243.2% |
70.4% |
|
|
|
FXD1/2022/025-Reopened |
22.2 |
14.2% |
37.9 |
63.9 |
14.1% |
59.4% |
|
||||
|
9/8/2025 |
SDB1/2011/030-Reopened |
15.5 |
12.0% |
20.0 |
2.4 |
8.1 |
14.0% |
40.3% |
59.4% |
|
|
|
8/25/2025 |
IFB1/2018/015-Tapsale |
7.6 |
12.5% |
50.0 |
128.0 |
130.3 |
13.0% |
414.9% |
98.2% |
||
|
IFB1/2022/019-Tapsale |
15.6 |
13.0% |
51.8 |
77.1 |
14.0% |
67.2% |
|||||
|
8/18/2025 |
IFB1/2018/015-Reopened |
7.6 |
12.5% |
90.0 |
50.7 |
215.9 |
13.0% |
359.4% |
23.5% |
||
|
IFB1/2022/019-Reopened |
15.6 |
13.0% |
44.4 |
107.5 |
14.0% |
41.3% |
|||||
|
7/14/2025 |
FXD1/2018/020-Reopened |
12.8 |
13.2% |
50.0 |
30.6 |
33.1 |
13.9% |
153.8% |
92.4% |
||
|
FXD1/2018/025-Reopened |
18.0 |
13.4% |
36.1 |
43.8 |
14.3% |
82.3% |
|||||
|
Q3’2025 Total |
|
|
250.0 |
405.3 |
713.1 |
|
|
|
|
||
|
Q3’2024 Total |
|
|
145.0 |
150.3 |
199.3 |
|
|
|
|
||
|
Q3’2025 Average |
14.6 |
13.1% |
|
|
|
13.8% |
285.3% |
56.8% |
|
||
|
Q3’2024 Average |
9.4 |
15.5% |
|
|
|
17.5% |
144.5% |
80.5% |
|
||
In the primary bond market, the government is looking to raise Kshs 50.0 bn through the reopened bonds; FXD1/2018/015 and FXD1/2021/020 with fixed coupon rates of 12.7% and 13.4% respectively and tenors to maturity of 7.7 years, and 15.9 years respectively. The period of sale for the two bonds opened on Friday, 26th September 2025 will close on 15th October 2025. Our recommended bidding ranges for FXD1/2018/015 and FXD1/2021/020 are 12.75%-13.50% and 13.50%-14.50% respectively.
Secondary Bond Market Activity:
- Bond Turnover:
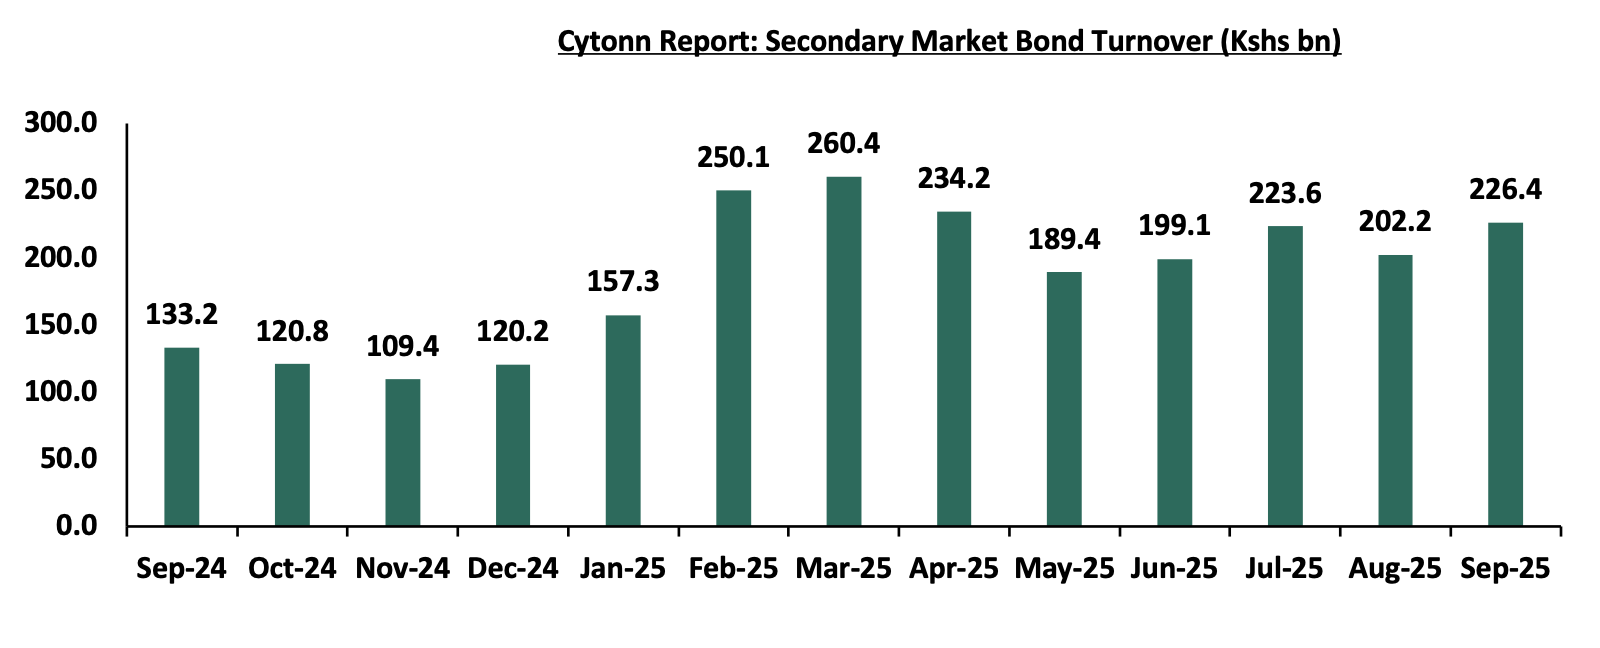
The secondary bond market recorded increased activity, with the total bond turnover increasing by 68.4% to Kshs 652.2 bn from Kshs 387.4 bn in Q3’2024, pointing towards increased activities by commercial banks in the secondary bond market. Similarly, on a year-on-year basis, the bond turnover increased significantly by 70.0% to Kshs 226.4 in September 2025, from Kshs 133.2 bn worth of treasury bonds transacted over a similar period last year. The chart below shows the bond turnover over the past 12 months;
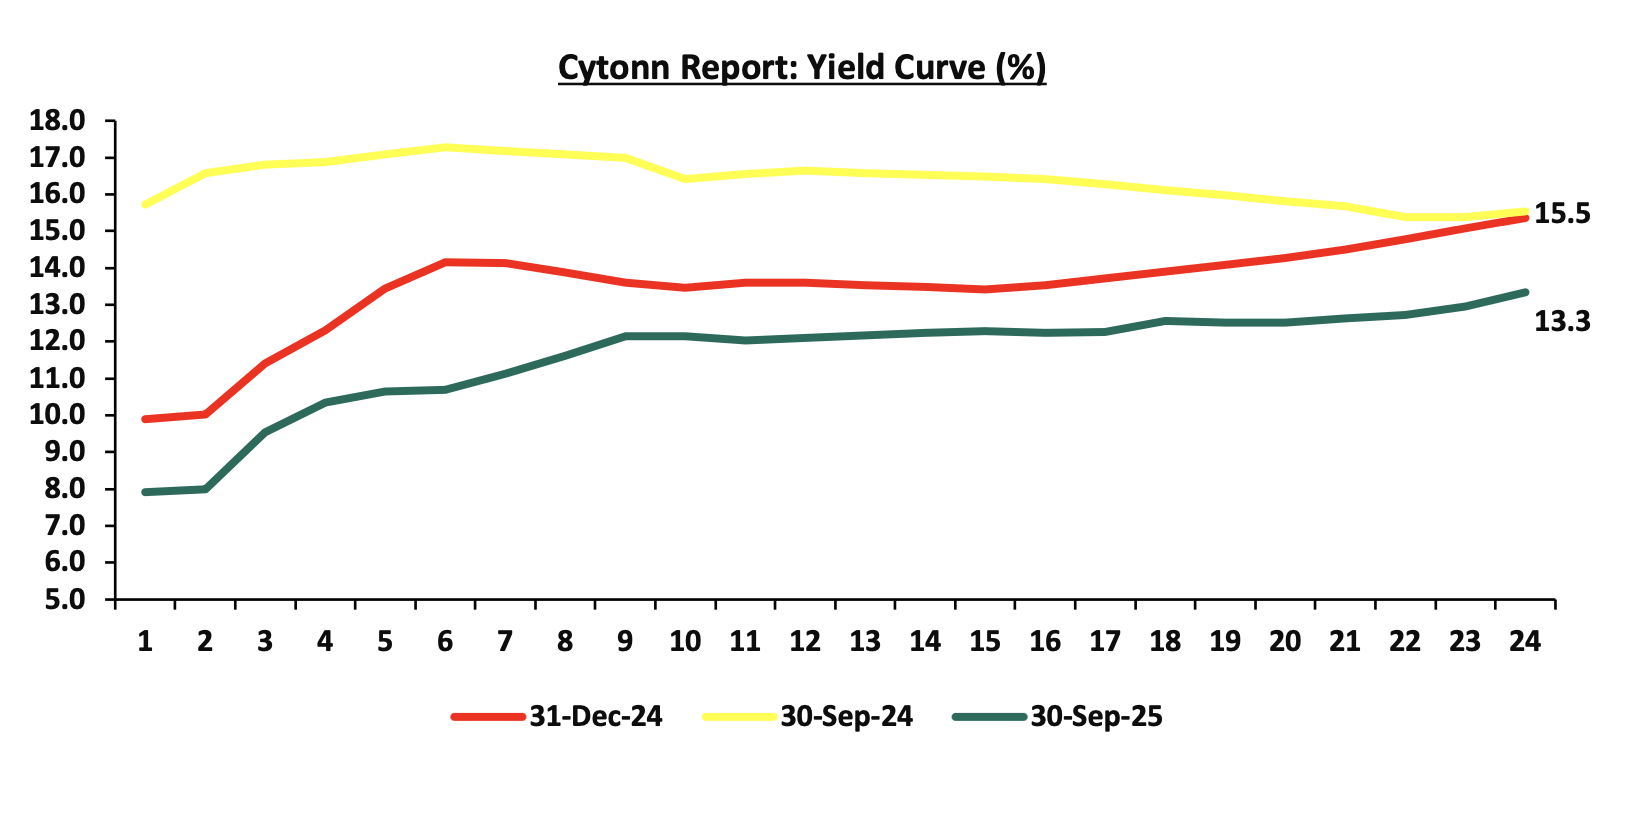
- Yield Curve:
During Q3’2025, yields on the government securities were on a downward trajectory compared to the same period in 2024. This was primarily driven by continued effort by the government to reject highly priced bids, local currency stabilization, and relatively eased inflation. These factors reduced the need for investors to demand higher yields as compensation for inflation and currency depreciation risks, resulting in an overall decline across the yield curve. Notably, the yield curve has adjusted from a humped yield curve observed in 2023 and most part of 2024, towards a normal upward sloping curve, with long-term bonds registering highest yields. The shift in sentiment indicates increased confidence in the economic landscape. The chart below shows the yield curve movement during the period:
Money Market Performance
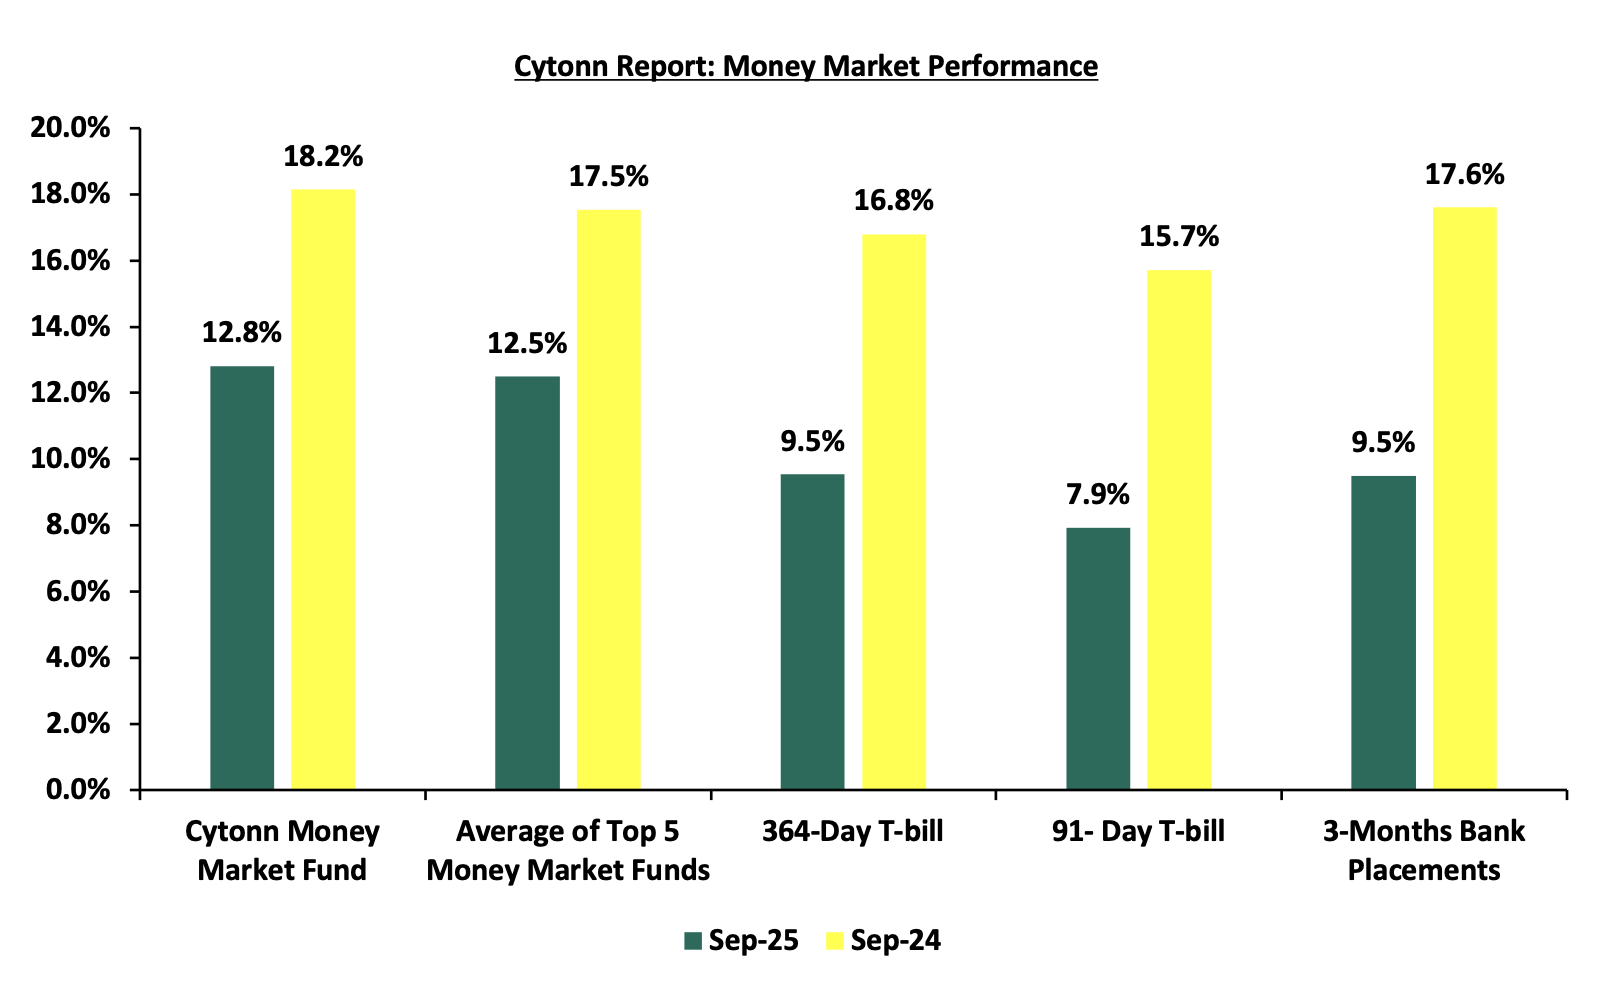
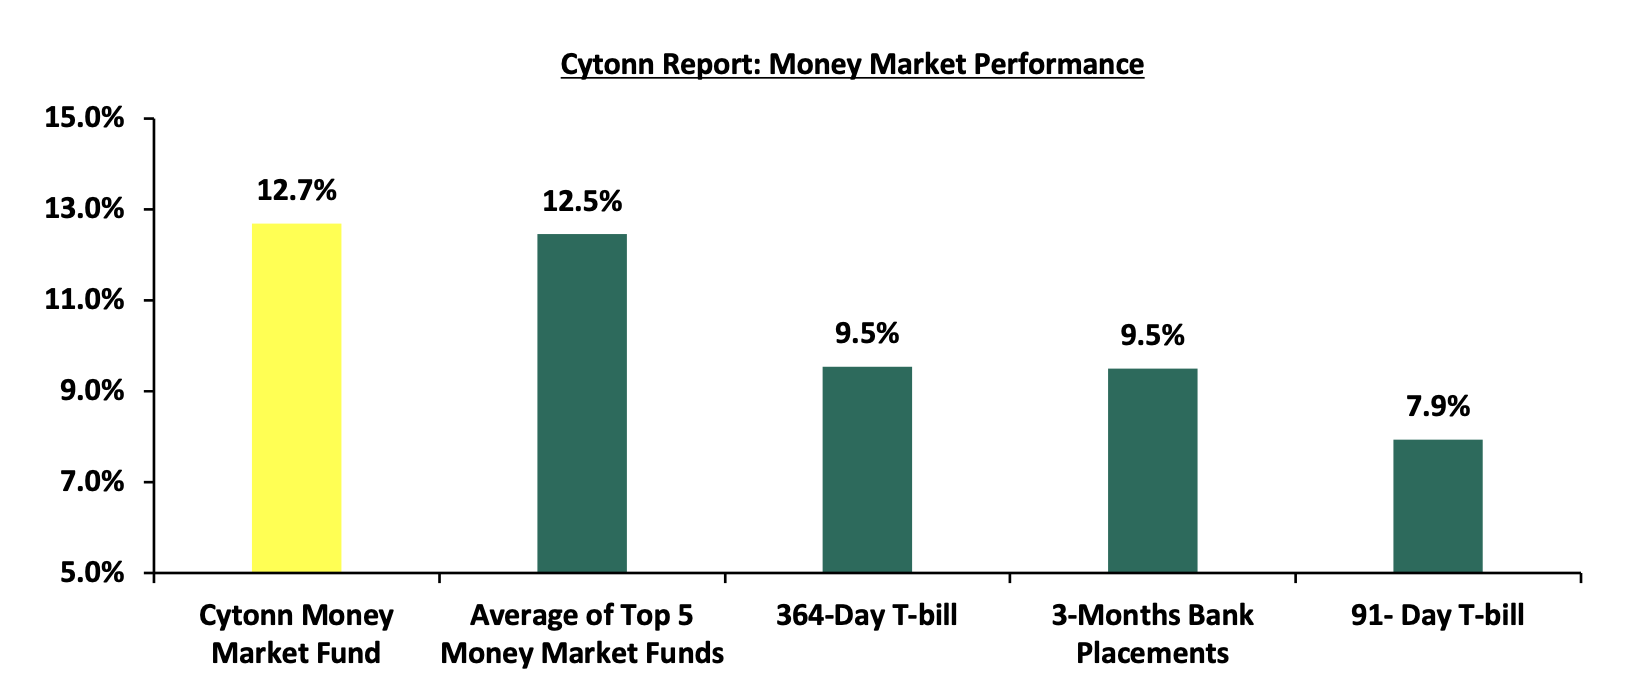
The 3-month bank placements recorded 9.5% at the end of Q3’2025, 8.1% points lower than the 17.6% recorded at the end of Q3’2024 (based on what we have been offered by various banks). The 364-day and 91-day T-bill rate decreased by 7.3% and 7.8% points to 9.5% and 7.9% at the end of Q3’2025 from 16.8% and 15.7% at the end of Q3’2024 respectively, and the average Top 5 Money Market Funds decreased by 5.0% points to 12.5%, from 17.5% at the end of Q3’2024. The yield on the Cytonn Money Market (CMMF) decreased by 5.4% points to 12.8% at the end of Q3’2025, from 18.2% recorded at the end of Q3’2024.
During the week, in the money markets, 3-month bank placements ended the week at 9.5% (based on what we have been offered by various banks), and the yields on the government papers registered a mixed performance with the yields on the 91-day paper increasing the most by 1.0 bps to 7.92% from the 7.91% recorded the previous week and the 364-day paper increased by 0.8 bps to 9.54% from 9.53% recorded the previous week while the yields on the 182-day papers decreased by 0.02 bps to 7.98% from 7.99% recorded the previous week.
The table below shows the Money Market Fund Yields for Kenyan Fund Managers as published on 3rd October 2025:
|
Cytonn Report: Money Market Fund Yield for Fund Managers as published on 3rd October 2025 |
||
|
Rank |
Fund Manager |
Effective Annual Rate |
|
1. |
Ndovu Money Market Fund |
13.1% |
|
2. |
Cytonn Money Market Fund ( Dial *809# or download Cytonn App) |
12.7% |
|
3. |
Nabo Africa Money Market Fund |
12.3% |
|
4. |
Gulfcap Money Market Fund |
12.2% |
|
5. |
Etica Money Market Fund |
12.1% |
|
6. |
Lofty-Corban Money Market Fund |
12.0% |
|
7. |
Kuza Money Market fund |
11.2% |
|
8. |
Enwealth Money Market Fund |
11.1% |
|
9 |
Arvocap Money Market Fund |
11.1% |
|
10. |
British-American Money Market Fund |
10.9% |
|
11. |
Orient Kasha Money Market Fund |
10.8% |
|
12. |
Jubilee Money Market Fund |
10.8% |
|
13. |
GenAfrica Money Market Fund |
10.8% |
|
14. |
Madison Money Market Fund |
10.6% |
|
15. |
Old Mutual Money Market Fund |
10.6% |
|
16. |
Apollo Money Market Fund |
10.0% |
|
17. |
Faulu Money Market Fund |
10.0% |
|
18. |
Dry Associates Money Market Fund |
9.9% |
|
19. |
Sanlam Money Market Fund |
9.5% |
|
20. |
Mali Money Market Fund |
9.4% |
|
21. |
CPF Money Market Fund |
9.1% |
|
22. |
KCB Money Market Fund |
9.0% |
|
23. |
ICEA Lion Money Market Fund |
8.9% |
|
24. |
Co-op Money Market Fund |
8.9% |
|
25. |
CIC Money Market Fund |
8.5% |
|
26. |
Genghis Money Market Fund |
8.5% |
|
27. |
Mayfair Money Market Fund |
8.4% |
|
28. |
Absa Shilling Money Market Fund |
8.1% |
|
29. |
AA Kenya Shillings Fund |
7.5% |
|
30. |
Stanbic Money Market Fund |
6.4% |
|
31. |
Ziidi Money Market Fund |
6.2% |
|
32. |
Equity Money Market Fund |
5.0% |
Source: Business Daily
Liquidity:
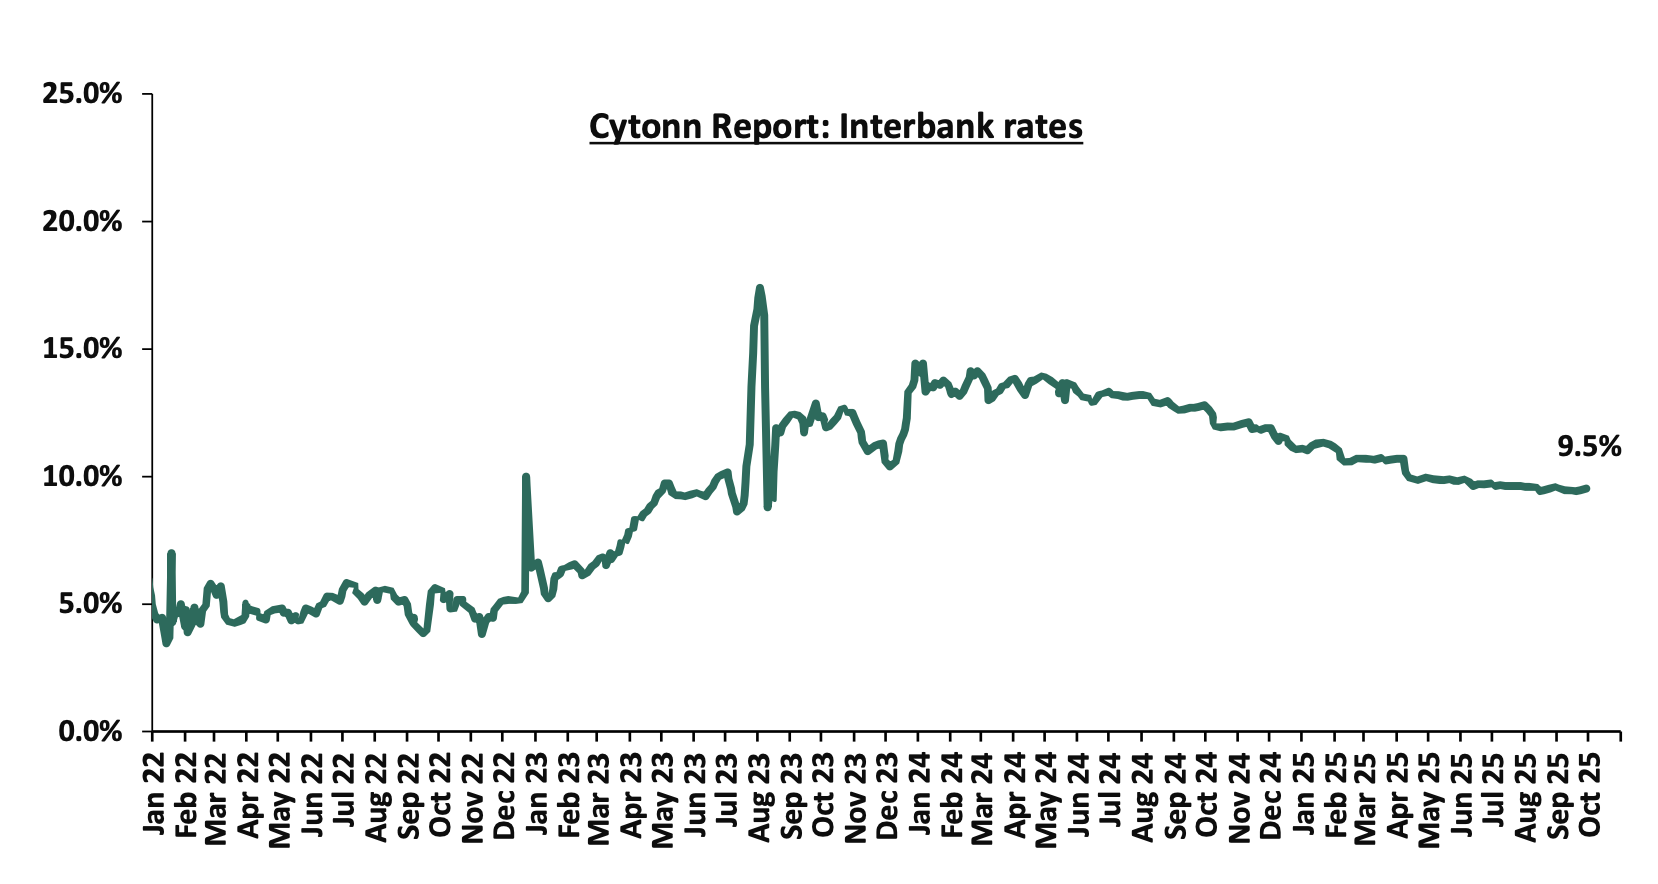
In Q3’2025, liquidity in the money markets eased, as evidenced by the decrease in the interbank rate to 9.6%, from 13.0% in Q3’2024, partly attributable to government payments that offset tax remittances. Additionally, the average volumes traded in the interbank market decreased by 52.2% to Kshs 12.4 bn, from Kshs 26.0 bn recorded in Q3’2024.
During the week, liquidity in the money markets marginally tightened, with the average interbank rate increasing by 3.9 bps to remain relatively unchanged from the 9.5% recorded the previous week, partly attributable to tax remittances that offset government payments. The average interbank volumes traded decreased by 12.6% to Kshs 15.1 bn from Kshs 17.2 bn recorded the previous week. The chart below shows the interbank rates in the market over the years
Kenya Eurobonds:
During Q3’2025, the yields on Eurobonds were on a downward trajectory, with the yield on the 10-Year Eurobond issued in 2018 decreasing the most by 2.0% points to 6.0% from 8.0% recorded at the beginning of the quarter. On a year-to-date basis, the yields on all Eurobonds were on a downward trajectory, with the yield on the 10-year Eurobond issued in 2018 declining the most by 3.2% points to 5.8% from 9.1% recorded at the start of the year.
During the week, the yields on Eurobonds were on a downward trajectory, with the yield on the 10-Year Eurobond issued in 2018 decreasing the most by 23.4 bps to 5.8% from 6.1% recorded the previous week. The table below shows the summary of the performance of the Kenyan Eurobonds as of 2nd October 2025;
|
Cytonn Report: Kenya Eurobond Performance |
|||||||
|
|
2018 |
2019 |
2021 |
2024 |
2025 |
||
|
Tenor |
10-year issue |
30-year issue |
7-year issue |
12-year issue |
13-year issue |
7-year issue |
11-year issue |
|
Amount Issued (USD) |
1.0 bn |
1.0 bn |
0.9 bn |
1.2 bn |
1.0 bn |
1.5 bn |
1.5 bn |
|
Years to Maturity |
2.4 |
22.4 |
1.6 |
6.6 |
8.7 |
5.4 |
10.4 |
|
Yields at Issue |
7.3% |
8.3% |
7.0% |
7.9% |
6.2% |
10.4% |
9.9% |
|
2-Jan-25 |
9.1% |
10.3% |
8.5% |
10.1% |
10.1% |
10.1% |
|
|
1-Jul-25 |
8.0% |
10.3% |
- |
9.4% |
9.7% |
9.3% |
|
|
25-Sep-25 |
6.1% |
9.3% |
- |
8.2% |
8.5% |
8.0% |
|
|
26-Sep-25 |
6.0% |
9.2% |
- |
8.1% |
8.4% |
7.8% |
|
|
29-Sep-25 |
6.1% |
9.3% |
- |
8.1% |
8.5% |
7.9% |
|
|
30-Sep-25 |
6.0% |
9.2% |
- |
8.1% |
8.4% |
7.9% |
|
|
1-Oct-25 |
5.8% |
9.3% |
- |
8.1% |
8.4% |
7.9% |
10.5% |
|
2-Oct-25 |
5.8% |
9.3% |
- |
8.1% |
8.4% |
7.9% |
|
|
Weekly Change |
(0.2%) |
0.0% |
- |
0.0% |
0.0% |
0.0% |
|
|
QTD Change |
(2.0%) |
(1.1%) |
- |
(1.3%) |
(1.2%) |
(1.4%) |
|
|
YTD Change |
(3.2%) |
(1.0%) |
- |
(1.9%) |
(1.7%) |
(2.2%) |
|
Source: Central Bank of Kenya (CBK)
Weekly Highlights.
- Kenya Q2’ 2025 GDP Growth Highlight
The Kenya National Bureau of Statistics (KNBS) released the Q2’2025 Quarterly Gross Domestic Product Report, highlighting that the Kenyan economy recorded a 5.0% growth in Q2’2025, higher than the 4.6% growth recorded in Q2’2024. The main contributor to Kenyan GDP remains to be the Agriculture, forestry and fishing sector which grew by 4.4% in Q2’2025, lower than the 4.5% expansion recorded in Q2’2024. All sectors in Q2’2025 recorded positive growths, with varying magnitudes across activities. However, most sectors recorded contraction in growth rates compared to Q2’2024 with Accommodation & Food Services, Financial Services Indirectly Measured and Public Administration sectors recording growth rate declines of 27.2%, 8.9% and 3.0% points to 7.8%, 1.4% and 6.0% from 35.0%, 10.3% and 9.0% respectively. Other sectors recorded an expansion in growth rates, from what was recorded in Q2’2024, with Mining and Quarrying, Construction and Electricity & Water Supply recording the highest growths in rates of 20.8%, 9.4% and 4.5% points, to 15.3%, 5.7% and 5.7% from (5.5%), (3.7%) and 1.2% respectively.
The key take-outs from the report include;
- Sectoral Contribution to Growth - The biggest gainer in terms of sectoral contribution to GDP was the Financial and Insurance sector, increasing by 0.1% points to 9.8% in Q2’2025 from 9.7% in Q2’2024, while the Agriculture and Forestry was the biggest loser, declining by 0.2% points to 19.6% in Q2’2025, from 19.8% in Q2’2024. Agriculture and Forestry remains the major contributor to GDP, with the sectoral contribution to GDP marginally decreasing by 0.2% to 19.6% in Q2’2025, from 19.8% recorded in Q2’2024 while Real Estate was the second largest contributor to GDP at 10.3% in Q2’2025, remaining constant from Q2’2024, indicating sustained growth. Mining and quarrying sector recorded the highest growth rate in Q2’2025 growing by 15.3%, a reversal from the 5.5% decline recorded in Q2’2024.
- The chart below shows the top contributors to GDP by sector in Q2’2025:
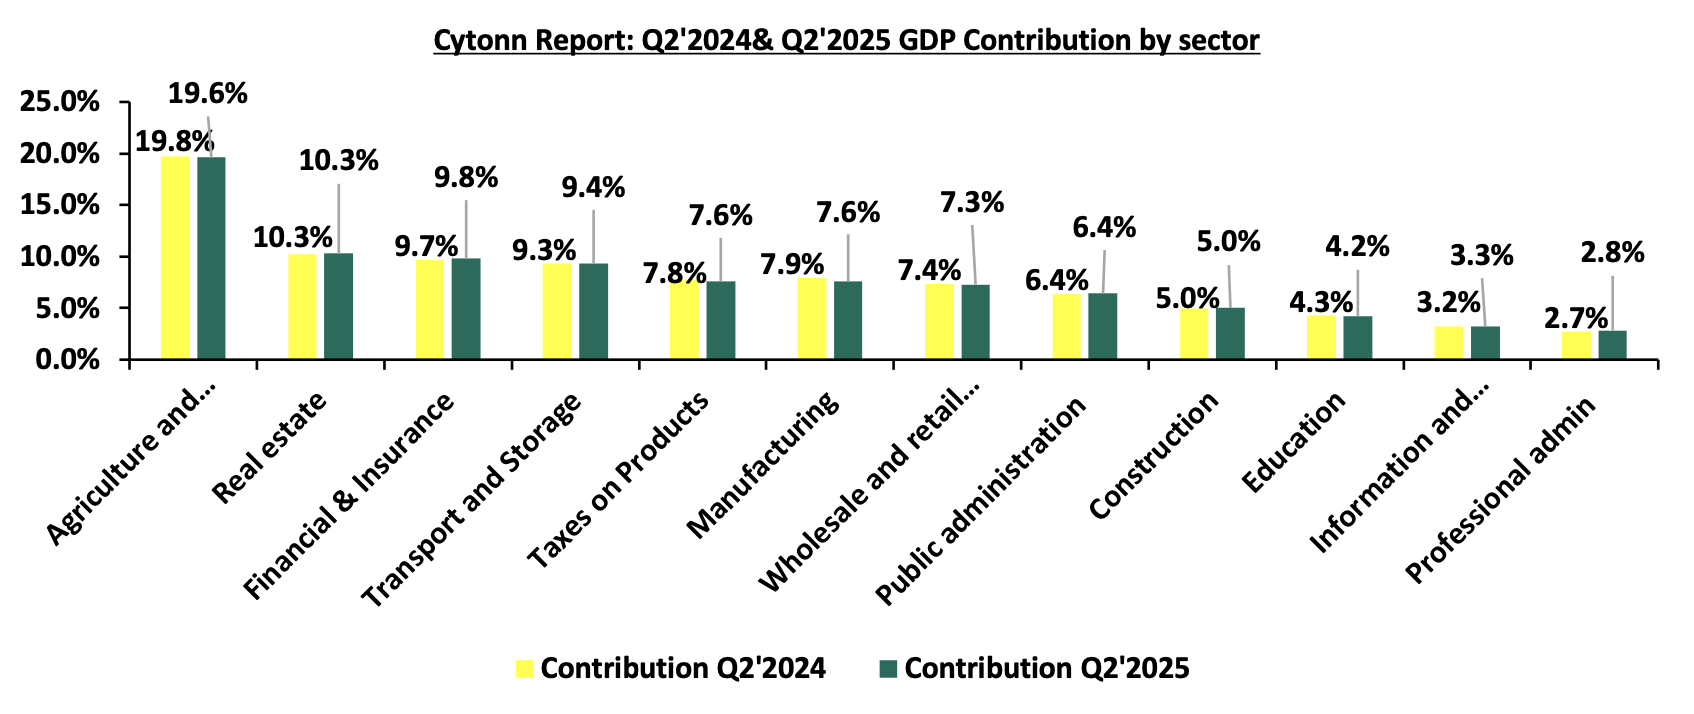 Source: KNBS Q2’2024 and Q2’2025 GDP Report
 - Slowed growth in the Agricultural Sector : Agriculture and Forestry recorded a growth of 4.4% in Q2’2025. The performance was a decrease of 0.1% points, from the expansion of 4.5% recorded in Q2’2024. Additionally, the sector remains the major contributor to GDP, with the sectoral contribution to GDP marginally decreasing by 0.2% to 19.6% in Q2’2025, from 19.8% recorded in Q2’2024.The positive growth recorded during the quarter was mainly attributable to favorable weather conditions. Notably, during the quarter, production of key food crops and cash crops increased with a significant increase in the production of Milk and coffee exports during the period under review. However, the performance was weighed down by decline in tea production.
- Reduced growth in the Financial and Insurance Services Sector: The Financial and Insurance sector growth rate slowed down by 0.3% points to 3.8% in Q1’2025 compared to the 4.1% in Q1’2024, attributable to the rise in cost of credit during the period. Additionally, the contribution to GDP increased by 0.01% points to remain relatively unchanged from the 9.0% recorded in Q1’2024. Some of the notable improvements include:
- The number of shares traded in the Nairobi Securities Exchange increased significantly by 107.9% to 580.0 mn in June 2025 from 279.0 million in June 2024. Similarly, the total value of traded shares increased significantly by 140.0% in June 2025 to 12.0 billion from 5.0 billion in June 2024
- The NSE 20 Share Index rose by 47.3% to 2,440.3 points in June 2025 from 1,656.5 points in June 2024, signaling improved performance in the equity market.
- Acccelerated growth in the electricity supply sector - The Electricity and Water Supply sector recorded an accelerated growth of 5.7% in Q2’2025 compared to a 1.2% growth in a similar period of review in 2024, with the sectoral contribution to GDP increasing by 0.1% to 2.3%, from the 2.2% recorded in Q2’2024. Notably, total electricity generated increased by 15.2% to 3,054.9 million-kilowatt hour (KWh) in Q2’2025, from 2,650.7 million KWh in Q2’2024.
- Reduced growth in the Accommodation and Food Service sector Accommodation and Food Services sector recorded double digit decline in growth Q2’2025, having expanded by 7.8%, significantly slower than the 35.0% recorded in Q2’2024. Additionally, the contribution to GDP remained relatively unchanged from the 1.6% recorded in Q2’2024.
- Continued growth in the Information and Communication sector: The Information and Communication sector recorded an expansion rate of 6.0% in Q2’2025 albeit slower than the 6.7% growth recorded in the same period last year. Similarly, the contribution to GDP increased by 0.1% points, to 3.3% in Q2’2025, from the 3.3% registered in Q2’2024.
The chart below shows the different sectoral GDP growth rates for Q2’2025: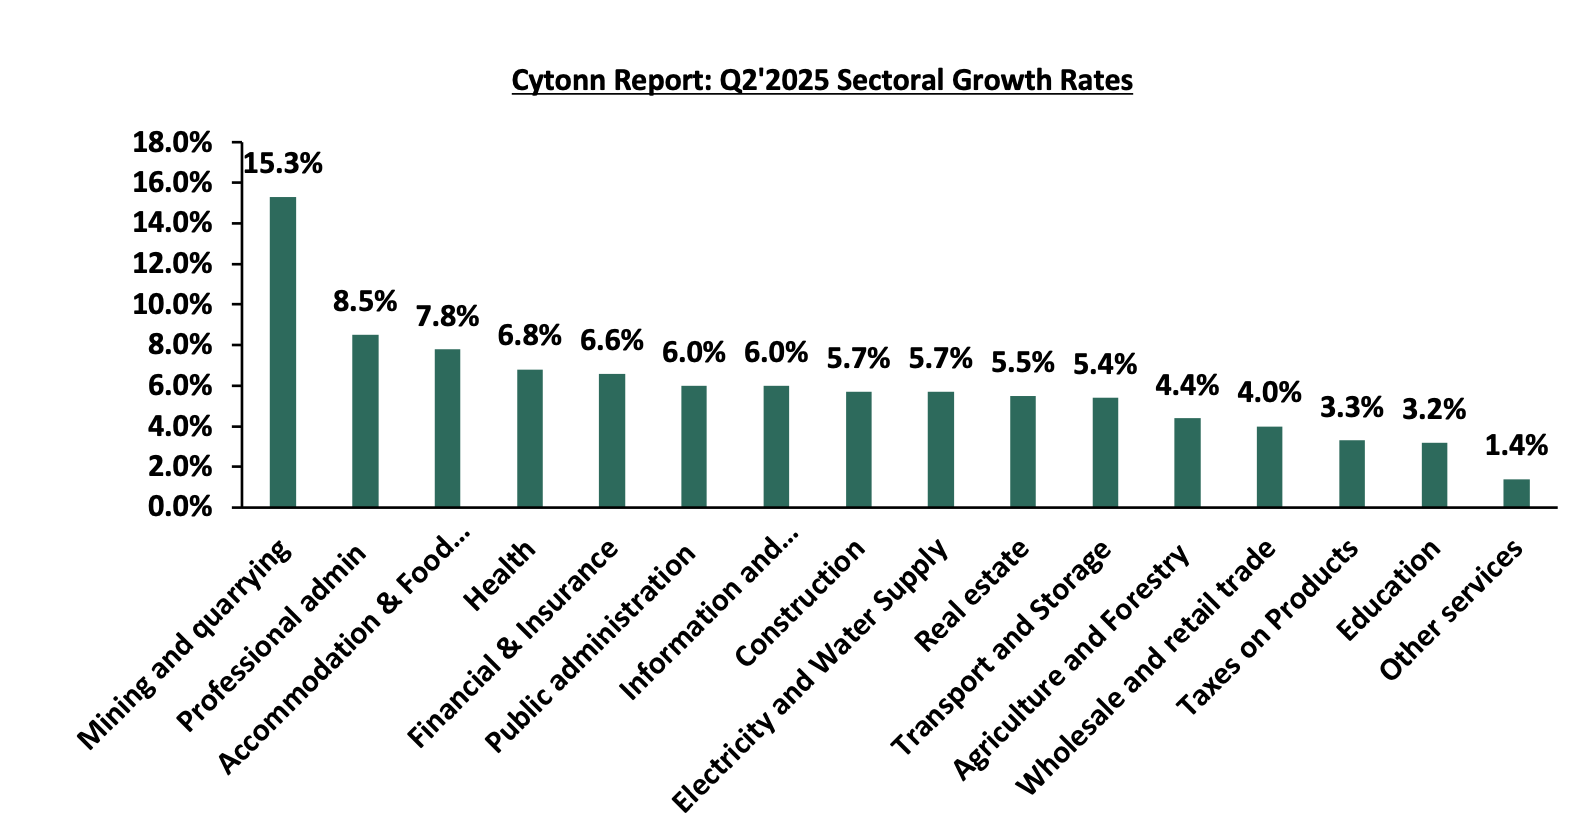
Source: KNBS Q2’2025 GDP Report
In 2025, Kenya's economy is projected to grow at a faster pace, estimated between 5.2%-5.4%. This optimistic outlook is attributed to improved business activity, supported by a stronger and more stable Kenyan Shilling, reduced borrowing costs, and the relatively lower inflation rates. However, the growth trajectory faces challenges from a tough business environment characterized by increasing taxes and a high cost of living. Despite these hurdles, recent economic developments provide a more favorable outlook. The Central Bank of Kenya (CBK) made a significant policy move in August 2025 by lowering the Central Bank Rate (CBR) by 25 basis points to 9.50%, marking the seventh consecutive rate cut, lowering by 350 basis points from 13.0% in February 2024. This accommodative monetary policy stance aims to stimulate private sector lending and boost economic activity. Inflation, while still within the CBK's target range of 2.5% to 7.5%, has been on an upward trend. In September 2025, the year-on-year inflation rate rose slightly to 4.6%, up from 4.5% recorded in August 2025. This rise is primarily driven by higher food prices, particularly in the food and non-alcoholic beverages category. Despite the gradual rise, inflation remains well within the CBK's target range, providing some assurance for economic stability. The CBK's accommodative monetary policy is expected to alleviate some pressure on the cost of credit, thereby improving access to affordable borrowing. This environment is conducive to increased investment spending by both individuals and businesses, contributing positively to economic activity. The agricultural sector, Kenya's largest contributor to GDP, is anticipated to continue supporting growth due to favorable rainfall. While risks of rising fuel prices persist due to global geopolitical tensions, the overall inflation outlook is more favorable, bolstering optimism for the economic outlook.
For a more detailed analysis, please see our Kenya’s Q2’ GDP Growth Note
- Kenya Q2'2025 Balance of Payments Highlight
According to the Q2’2025 Kenya Quarterly Balance of Payment Report released by the Kenya National Bureau of Statistics (KNBS), Kenya’s balance of payments position deteriorated significantly by 86.6% in Q2’2025, with a deficit of Kshs 157.0 bn, from a deficit of Kshs 84.1 bn in Q2’2024.
Balance of Payments
Kenya’s balance of payment (BoP) position deteriorated significantly by 86.6% in Q2’2025, to a deficit of Kshs 157.0 bn, from a deficit of Kshs 84.1 bn in Q2’2024. The y/y negative performance in BoP was mainly driven by a significant 282.8% increase in financial account deficit to Kshs 136.5 bn from a deficit of Kshs 35.7 bn in Q2’2024. The performance was, however, supported by a significant 118.9% improvement in the capital account balance to a surplus of Kshs 17.6 bn from a surplus of Kshs 8.0 bn in Q2’2024. The table below shows the breakdown of the various balance of payments components, comparing Q2’2025 and Q2’2024:
|
Item |
Q2'2024 |
Q2'2025 |
Y/Y % Change |
|
Current Account Balance |
(47.4) |
(83.7) |
76.6% |
|
Capital Account Balance |
8.0 |
17.6 |
118.9% |
|
Financial Account Balance |
(35.7) |
(136.5) |
282.8% |
|
Net Errors and Omissions |
87.8 |
86.6 |
(1.4%) |
|
Balance of Payments |
(84.1) |
(157.0) |
86.6% |
All values in Kshs bns
Key take-outs from the table include;
- The current account deficit (value of goods and services imported exceeds the value of those exported) widened by 76.6% to Kshs 83.7 bn from Kshs 47.4 bn in Q2’2024. The y/y widening of the current account was brought about by the 11.7% widening in the merchandise trade account deficit to Kshs 348.4 bn from Kshs 311.8 bn in Q2’2024, coupled with a 7.4% decrease in services trade balance to Kshs 65.5 bn from Kshs 70.8 bn in Q2’2024,
- The capital account balance (shows capital transfers receivable and payable between residents and non-residents, including the acquisition and disposal of non-produced non-financial items), which includes foreign direct investments (FDIs), increased by 118.9% to a surplus Kshs 17.6 bn in Q2’2025, up from a surplus of Kshs 8.0 bn in Q2’2024,
- The financial account balance (the difference between the foreign assets purchased by domestic buyers and the domestic assets purchased by foreign buyers) recorded a 282.8% increase in net inflow to a deficit Kshs 136.5 billion in Q2’2025, from a deficit of Kshs 35.7 billion in Q2’2024.
- Consequently, the Balance of Payments (BoP) position declined to a deficit of Kshs 157.0 bn in Q2’2025, from a deficit of Kshs 84.1 bn recorded in Q2’2024.
Current Account Balance
Kenya’s current account deficit widened by 76.6% to Kshs 83.7 bn in Q2’2025 from the Kshs 47.4 bn deficit recorded in Q2’2024. The y/y expansion registered was driven by:
- The widening of the merchandise trade account deficit (the value of import goods exceeds the value of export goods, resulting in a negative net foreign investment) by 11.7% to Kshs 348.4 bn in Q2’2024, from Kshs 311.8 bn recorded in Q2’2024, and,
- A 7.5% decline in the services trade balance to a surplus of Kshs 65.5 bn from a surplus of Kshs 70.8 bn in Q2’2024,
The table below shows the breakdown of the various current account components on a year-on-year basis, comparing Q2’2025 and Q2’2024:
|
Item |
Q2'2024 |
Q2’2025 |
Y/Y % Change |
|
Merchandise Trade Balance |
(311.8) |
(348.4) |
11.7% |
|
Services Trade Balance |
70.8 |
65.5 |
(7.5%) |
|
Primary Income Balance |
(45.2) |
(43.8) |
(3.1%) |
|
Secondary Income (transfer) Balance |
238.8 |
243.1 |
1.8% |
|
Current Account Balance |
(47.4) |
(83.7) |
76.6% |
All values in Kshs bns
Kenya's balance of payments deteriorated in Q2’2025, mainly on the back of a significant 282.8% increase in financial account deficit to Kshs 136.5 bn from a deficit of Kshs 35.7 bn in Q2’2024. The current account deficit (value of goods and services imported exceeds the value of those exported) widened by 76.6% to Kshs 83.7 bn in Q2’2025 from the Kshs 47.4 bn deficit recorded in Q2’2024. The y/y widening of the current account was brought about by the 11.7% widening in the merchandise trade account deficit to a Kshs 348.4 bn from a Kshs 311.8 bn in Q2’2024, coupled with a 7.4% decrease in services trade balance to Kshs 65.5 bn from Kshs 70.8 bn in Q2’2024. Looking ahead, the outlook for Kenya's current account is optimistic, as continued growth in key export sectors and sustained diaspora remittances are expected to further improve the current account balance. Efforts to diversify exports and enhance value addition in agricultural products, along with prudent fiscal and monetary policies, will be crucial in sustaining this positive trajectory. Furthermore, the ongoing stability of Kenyan Shilling against most trading currencies is expected to lower the import bill hence narrowing the current account deficit. We expect that the current administration’s focus on fiscal consolidation will improve the balance of payments performance by minimizing the costs of servicing external debts. Additionally, the favorable weather conditions and government intervention through subsidy programs are set to boost agricultural production in the country, thereby increasing the export of agricultural products, and supporting the current account. We anticipate that the balance of payments will continue being stable with the help of multiple trade agreements, such as the one between Kenya and the EU and the one among the EAC, SADC and COMESA, as the agreements will boost the amount and variety of exports that are needed and offer more opportunities to sell them.
For a more detailed analysis, please see our Kenya’s Q2’ 2025 Balance of Payments Note
- Kenya’s Eurobond Invitation
During the week, Kenya announced its plan to invite eligible holders of its outstanding USD 1.0 bn notes, at a purchase price of USD 1,037.50 per USD 1,000.0 in principal amount of notes accepted for purchase. The maturity date for the notes is 28thFebruary 2028. The offer began on 2nd October 2025 and will expire on 9th October 2025, unless extended, re-opened, amended or terminated by the Republic of Kenya.
The Government of Kenya intends to issue new US dollar- denominated notes and will consider whether noteholders have tendered their existing notes when allocating the new notes, giving preference to those who have indicated a firm intention to tender. The purchase of the notes is contingent upon the successful completion of the new notes issuance. Kenya’s debt level will remain largely unchanged, rising only slightly due to the buyback premium and issuance costs, while improving the maturity profile and easing future repayment pressures.
Following this announcement, the government was pleased to announce that it had successfully raised USD 1.5 bn from international investors. The money was raised in two parts, that is, a 7-year loan at an interest rate of 7.9% and a 12-year loan at 8.8%, together giving Kenya a better rate of 8.7%, which is 1.0% lower than what the country would have paid at the start of the year. Investor appetite was exceptionally strong, with Kenya seeking USD 1.5 bn but receiving offers exceeding USD 7.5 bn, translating to a subscription rate of 500.0%. The bulk of this interest came from reputable international fund managers based in the United States and the United Kingdom, underscoring renewed global confidence in Kenya’s economic outlook. This achievement not only reduces the country’s debt servicing costs but also eases the burden on taxpayers, supports macroeconomic stability, and frees up resources for critical development priorities such as infrastructure, healthcare, and education.
Following the announcement of the buyback, the 2018 10-Year Eurobond saw a sharp decline of 79.5 bps to 5.8% on 2ndOctober 2025 from the 7.3% recorded on 22nd February 2025. This reaction can be attributed to factors such as,
- Improved Investor Confidence – Oversubscription of the new issue showed strong global demand, boosting market sentiment toward Kenya’s creditworthiness.
- Lower Borrowing Costs – The new notes priced at a blended 8.7%, which is 1% lower than at the start of the year, suggested Kenya could sustain cheaper financing going forward.
- Broader Market Conditions – Easing global interest rates and improved risk appetite for emerging market debt created a supportive environment for yield compression.
The graph below shows the yields for the bond since it was issued in 2018:
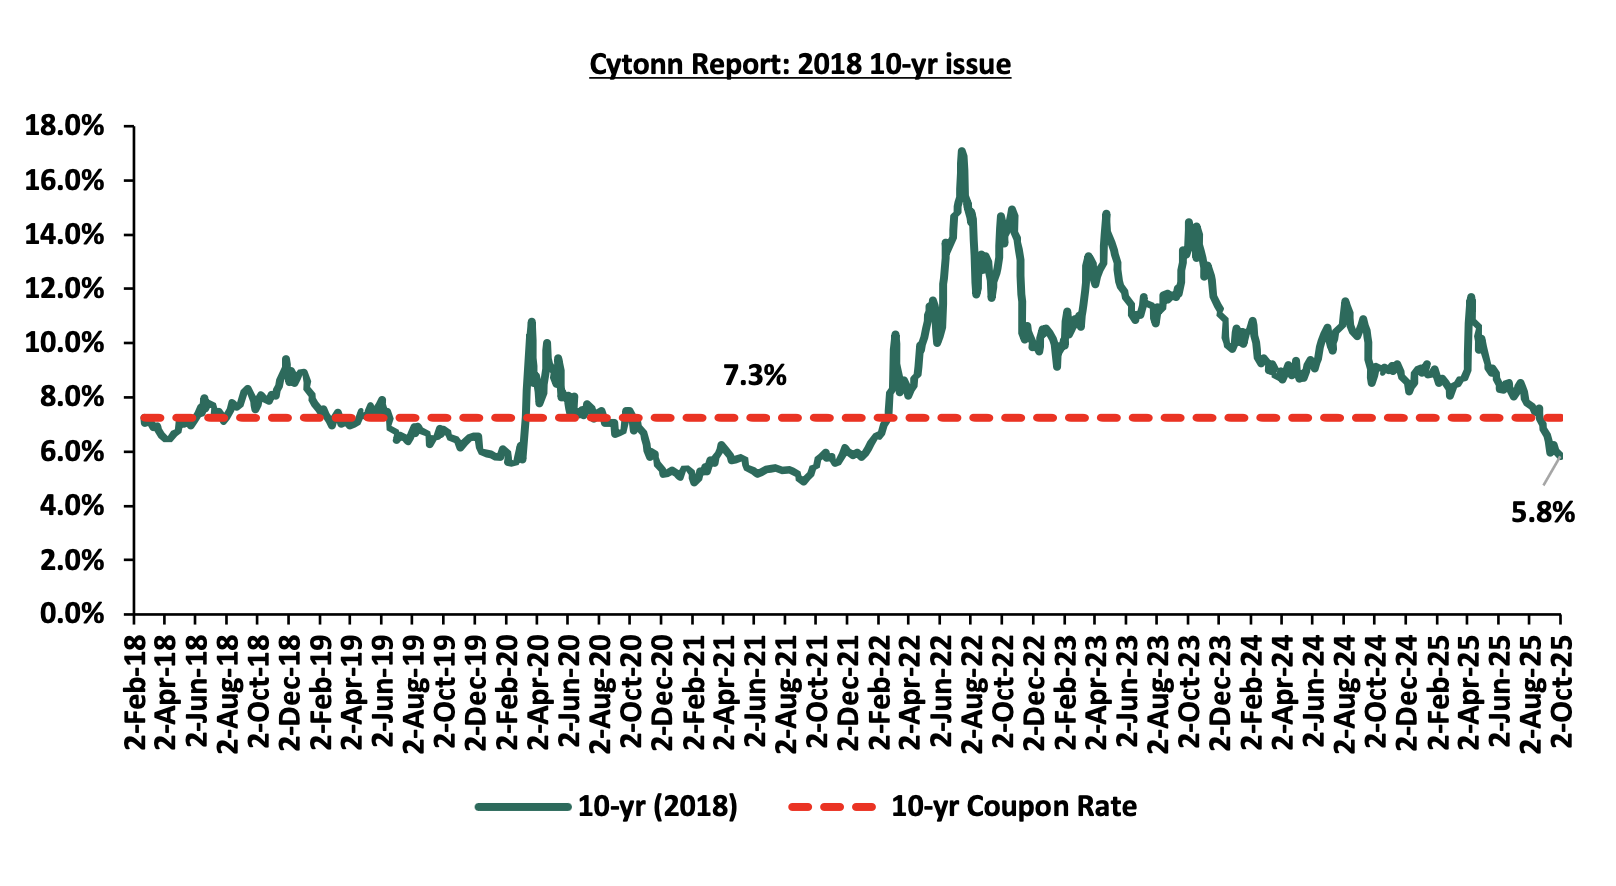
Kenya’s successful Eurobond buyback such as the 2018 10-year bond and the 2019 7-year bond and the oversubscribed issuance set a positive precedent for its future engagement with international capital markets. The government will need to build on this renewed investor confidence by maintaining fiscal discipline, strengthening foreign exchange reserves, and implementing structural reforms under the IMF program. Continued transparency in debt management and prioritization of concessional borrowing will be critical in sustaining debt sustainability. At the same time, channeling the savings from lower interest payments into productive investments in infrastructure, healthcare, and education will ensure that external borrowing translates into tangible economic growth. If managed prudently, this momentum could lower Kenya’s future borrowing costs even further and reinforce its position as one of Africa’s more resilient frontier economies.
Q3’2025 Highlights:
- The Kenya Revenue Authority released the annual performance for FY’ 2024/25, highlighting the revenue collection for the period grew by 6.8% down from 11.1% growth in the previous financial year, after KRA collected Kshs 2.6 tn compared to Kshs 2.4 tn in the previous financial year. This translates to a performance rate of 100.6% against the target of Kshs 2.55 tn. For more information, please see our Cytonn Weekly # 28/2025
- The Energy and Petroleum Regulatory Authority (EPRA) released their monthly statement on the maximum retail fuel prices in Kenya, effective from 15th July 2025 to 14th August 2025. Notably, the maximum allowed price for Super Petrol, Diesel and Kerosene increased by Kshs 9.0, Kshs 8.7 and Kshs 9.7 respectively. Consequently, Super Petrol, Diesel and Kerosene would retail at Kshs 186.3, Kshs 171.6 and Kshs 156.6 per litre respectively, from Kshs 177.3, Kshs 162.9 and Kshs 146.9 per litre respectively, representing increases of 5.1%, 5.3% and 6.6% for Super Petrol, Diesel and Kerosene respectively. For more information, please see our Cytonn Weekly #29/2025
- The National Treasury gazetted the revenue and net expenditures for the year FY’ 2024/2025, ending 30th June 2025, highlighting that the total revenue collected as at the end of June 2025 amounted to Kshs 2,430.1 bn, equivalent to 97.4% of the revised estimates III of Kshs 2,496.2 bn for FY’ 2024/2025. For more information, please see our Cytonn Weekly #30/2025
- The Central Bank of Kenya initiated procurement for a new digital retail bond system. According to the tender document, the system will offer a fully integrated front-end and back-end platform, allowing individual investors to register, purchase, manage, rediscount and receive interest payments on government securities primarily through mobile phones and the web. The CBK explicitly outlines the goal to “provide all services related to retail bonds”, including direct settlement via mobile money and banking systems, automation of interest payments and a real-time, investor-facing dashboard for balances, transaction history, and reporting. For more information, please see our Cytonn Monthly- July 2025
- The global ratings agency, Fitch Ratings affirmed Kenya’s credit rating at B-, maintaining the stable outlook in a review dated 25th July 2025. The affirmation follows a prior downgrade in January 2025 form a credit rating of B in August 2024, with the outlook then revised to stable from negative. The affirmation reflects the agency’s confidence in Kenya’s economic resilience, continued access to concessional funding and ongoing efforts to manage its fiscal position despite persistent debt vulnerabilities and external financing pressures. For more information, please see our Cytonn Monthly- July 2025
- The Kenya National Bureau of Statistics released the year-on-year inflation noting that inflation in July 2025 rose by 0.3% points to 4.1%, up from 3.8% recorded in June 2025. The headline inflation was primarily driven by price increases in the following categories: Food & Non-Alcoholic Beverages at 6.8%, Transport at 4.1% and Housing, Water, Electricity, Gas and Other fuels at 1.3%. The month-on-month inflation rate stood at 0.1% in July 2025. For more information, please see our Cytonn Monthly- July 2025
- Stanbic Bank released its monthly Purchasing Manager’s Index highlighting that the index for the month of July 2025 deteriorated further to remain in the negative territory, coming in at 46.8, down from 48.6 in June 2025, marking a third consecutive month the index fell below the 50.0 neutral mark, signaling a worsening in business conditions, mainly attributable to weaker order inflows, rising price pressure and disruption from protests. For more information, please see our Cytonn Weekly # 32/2025
- The Monetary Policy Committee met on August 12th, 2025, to review the outcome of its previous policy decisions against a backdrop of elevated uncertainties to the global outlook for growth, lower sticky in advanced economies heightened trade tensions as well as persistent geopolitical tensions. The MPC decided to lower the CBR rate by 25.0 bps to 9.50%, from 9.75%. For more information, please see our Cytonn Weekly #33/2025
- The Energy and Petroleum Regulatory Authority (EPRA) releasedtheir monthly statement on the maximum retail fuel prices in Kenya, effective from 15th August 2025 to 14th September 2025. Notably, the maximum allowed price for Super Petrol and Kerosene decreased by Kshs 1.0 each respectively, while the price for Diesel remained unchanged. Consequently, Super Petrol and Kerosene will now retail at Kshs 185.3 and Kshs 155.6 per litre respectively, from Kshs 186.3 and Kshs 156.6 per litre respectively while Diesel will now retail at Kshs 171.6 per litre, representing decreases of 0.5% and 0.6% for Super Petrol and Kerosene respectively. For more information, please see our Cytonn Weekly #33/2025
- During the week, the National Treasury gazettedthe revenue and net expenditures for the first month of FY’2025/2026, ending 31st July 2025, highlighting that the total revenue collected as at the end of July 2025 amounted to Kshs 178.4 bn, equivalent to 6.5% of the original estimates of Kshs 2,754.7 bn for FY’2025/2026 and is 77.7% of the prorated estimates of Kshs 229.6 bn. For more information, please see our Cytonn Weekly #33/2025
- During the week, the global ratings agency, Moody’s announcedits revision of Kenya’s credit outlook to positive from negative, while maintaining the credit rating at Caa1, on the back of a likelihood of an ease in liquidity risks and improved debt affordability. For more information, please see our Cytonn Weekly #34/2025
- Stanbic Bank released its monthly Purchasing Manager’s Index(PMI) highlighting that the index for the month of August 2025 improved substantially but remained in negative territory, coming in at 49.4, up from 46.8 in July 2025. This marked the fourth consecutive month the index fell below the 50.0 neutral mark, signaling a continued deterioration in business conditions, albeit at a softer pace, mainly attributable to weaker order inflows and rising cost pressures, though activity was partly supported by stabilizing demand and easing political disruptions. For more information, please see our Cytonn Weekly #35/2025
- The Energy and Petroleum Regulatory Authority (EPRA) released their monthly statement on the maximum retail fuel prices in Kenya, effective from 15th September 2025 to 14th October 2025. Notably, the maximum allowed price for Super Petrol, Diesel and Kerosene decreased by Kshs 0.8, Kshs 0.1 and Kshs 0.8 per litre respectively. Consequently, Super Petrol, Diesel and Kerosene will now retail at Kshs 184.5, Kshs 171.5 and Kshs 154.8 per litre respectively, from Kshs 185.3, Kshs 171.6 and Kshs 155.6 per litre respectively, representing decreases of 0.4%, 0.1% and 0.5% for Super Petrol, Diesel and Kerosene respectively. For more information, please see our Cytonn Weekly #36/2025.
Rates in the Fixed Income market have been on a downward trend due to high liquidity in the money market which allowed the government to front load most of its borrowing. The government closed the year 164.3% ahead of its prorated net domestic borrowing target of Kshs 156.9 bn, having a net borrowing position of Kshs 414.9 bn (inclusive of T-bills). However, we expect a stabilization of the yield curve in the short and medium term, with the government looking to increase its external borrowing to maintain the fiscal surplus, hence alleviating pressure in the domestic market. As such, we expect the yield curve to stabilize in the short to medium-term and hence investors are expected to shift towards the long-term papers to lock in the high returns
Market Performance:
During Q3’2025, the equities market was on an upward trajectory, with NSE 20, NSE 10, NSE 25, and NASI gaining by 21.8%, 17.6%, 17.4%, and 15.2%, respectively. The equities market performance during the quarter was driven by gains recorded by large caps such as DTB, KCB, and Cooperative Bank of 35.3%, 21.8%, and 19.6% respectively. The gains were however weighed down by losses recorded by large cap stocks such as SCBK of 5.3%.
During Q3’2025, in the regional equities market, the East African Exchanges 20 (EAE 20) share index declined by 0.1%, attributable to losses recorded by large cap stocks such as Tanzania Breweries, Tanzania Cigarette Company and MTN Rwandacell of 24.7%, 13.4% and 3.9% respectively. The performance was however supported by gains recorded by large cap stocks such as CRDB Bank, Tanga Cement and Quality chemicals industry limited of 53.5%, 37.2% and 36.3%
Equities turnover increased by 168.3% in Q3’2025 to USD 361.7 mn, from USD 134.8 mn in Q3’2024. Foreign investors remained net sellers in Q3’2025 with a net selling position of USD 30.8 mn, from a net selling position of USD 4.6 mn recorded in Q3’2024.
During the week, the equities market was on an upward trajectory, with NSE 20, NSE 25, NASI and NSE 10 gaining by 1.8%, 0.7%, 0.3%, and 0.1%, respectively, taking the YTD performance to gains of 47.2%, 42.4%, 35.0% and 34.9% for NSE 20, NASI, NSE 25, and NSE 10 respectively. The equities market performance was mainly driven by gains recorded by large-cap stocks such as Stanbic Bank, Absa, and NCBA of 7.8%, 7.0%, and 2.5%, respectively. The gains were however weighed down by losses recorded by large cap stocks such as Cooperative Bank, Safaricom and EABL of 2.1%, 1.7% and 0.9% respectively;
Additionally, in the regional equities market, the East African Exchanges 20 (EAE 20) share index declined by 0.2%, attributable to losses recorded by large cap stocks such as Tanga Cement, MTN Rwandacell and Safaricom Plc of 4.2%, 1.7% and 1.5% respectively. The performance was however supported by gains recorded by large cap stocks such as Absa Bank Kenya, Co-operative Bank and Bank of Baroda Uganda of 5.6%, 5.1% and 5.0% respective
During the week, equities turnover declined significantly by 62.2% to USD 16.2 mn from USD 43.0 mn recorded the previous week, taking the YTD turnover to USD 795.1 mn. Foreign investors became net buyers for the first time in five weeks, with a net buying position of USD 0.9 mn, from a net selling position of USD 0.3 mn recorded the previous week, taking the YTD net selling position to USD 54.4 mn.
The market is currently trading at a price to earnings ratio (P/E) of 7.3x, 36.2% below the historical average of 11.4x, and a dividend yield of 5.6%, 0.9% points above the historical average of 4.7%. Key to note, NASI’s PEG ratio currently stands at 0.9x, an indication that the market is at par relative to its future growth. A PEG ratio greater than 1.0x indicates the market may be overvalued while a PEG ratio less than 1.0x indicates that the market is undervalued.
The charts below indicate the historical P/E and dividend yields of the market;
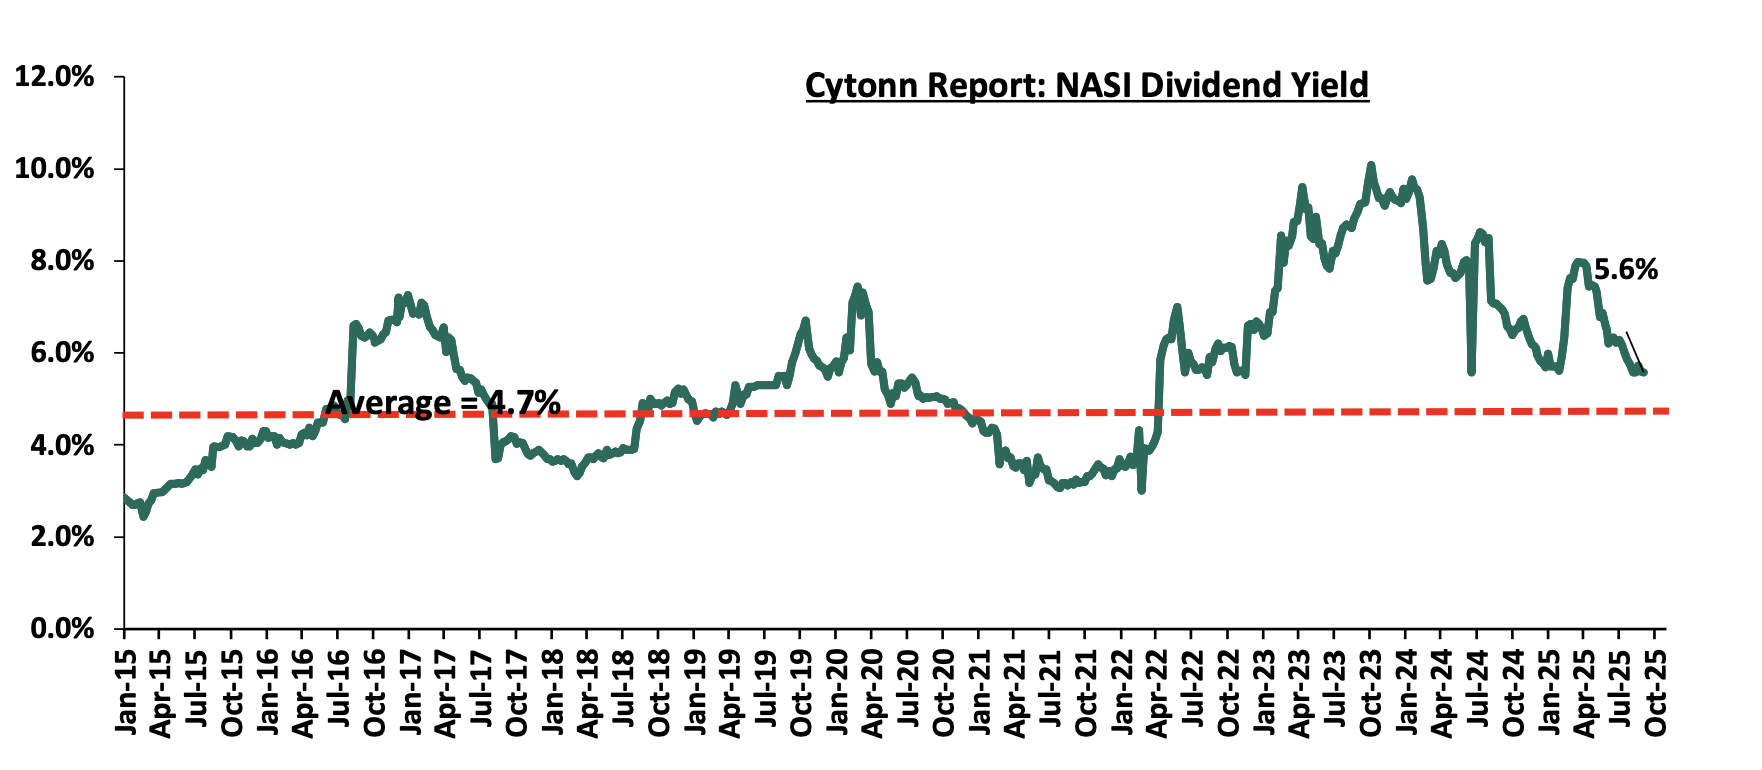
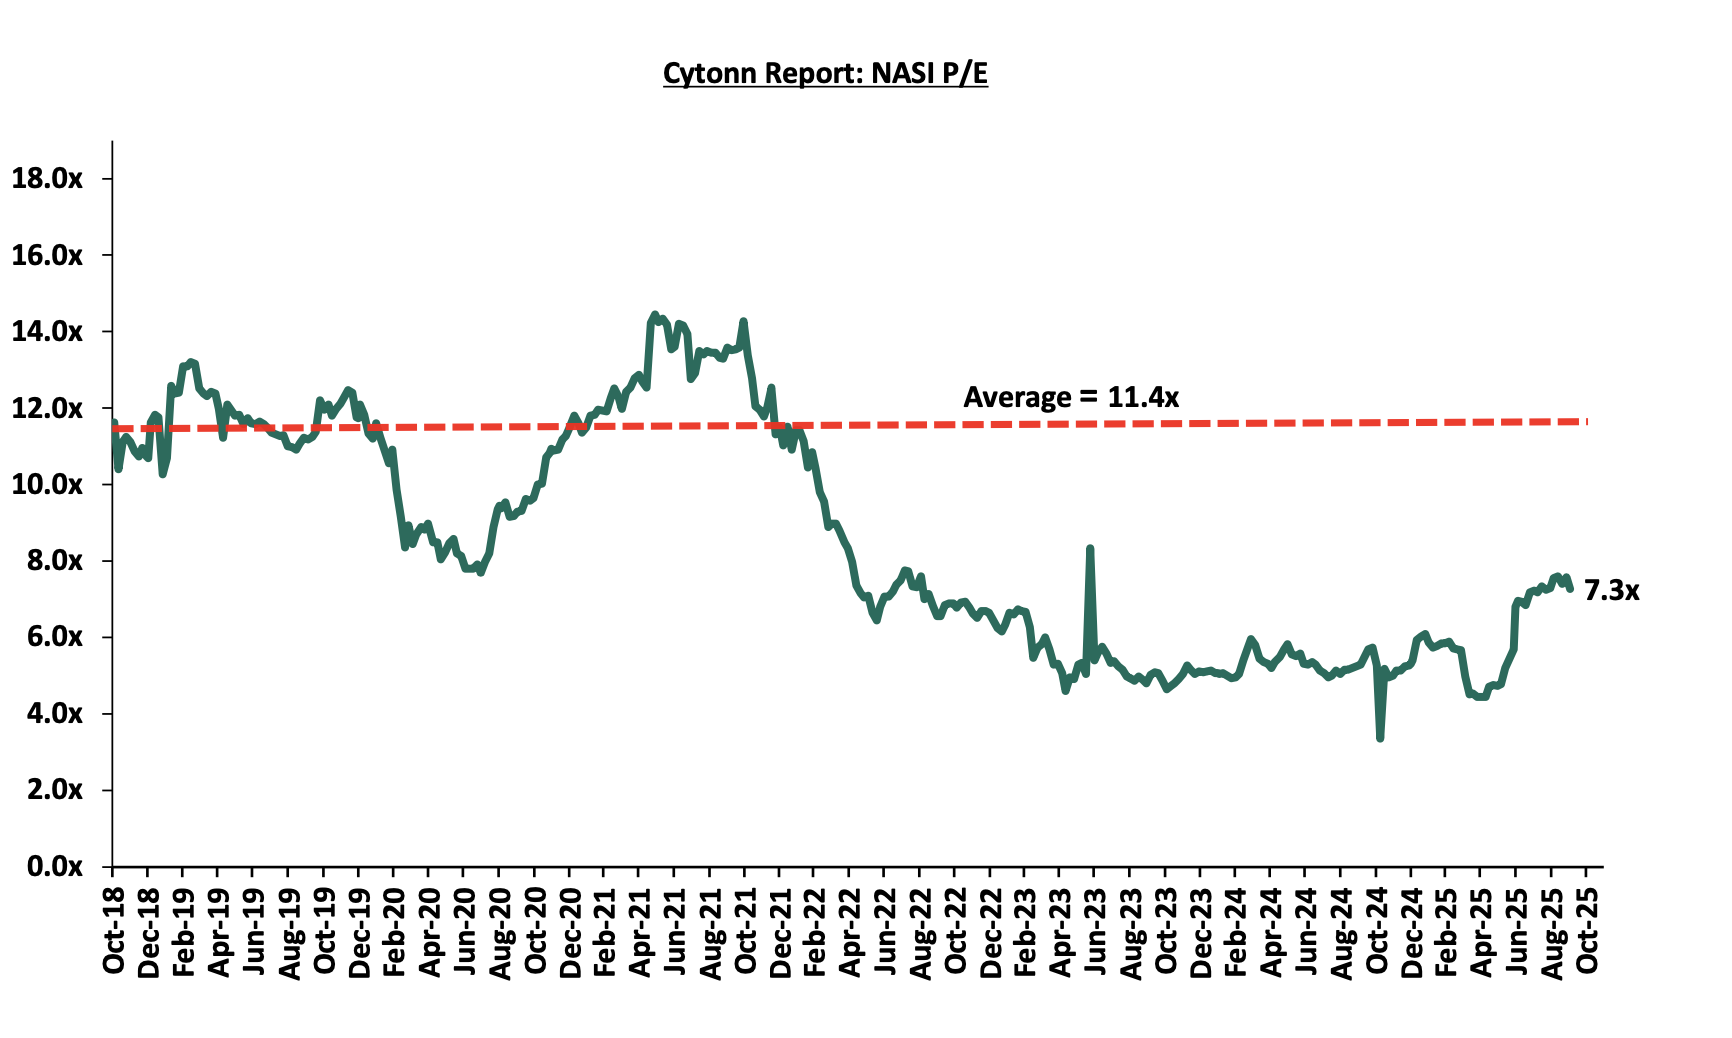
Universe of Coverage:
|
Cytonn Report: Equities Universe of Coverage |
||||||||||||
|
Company |
Price as at 26/09/2025 |
Price as at 03/10/2025 |
w/w change |
q/q change |
YTD Change |
Year Open 2025 |
Target Price* |
Dividend Yield |
Upside/ Downside** |
P/TBv Multiple |
Recommendation |
|
|
Diamond Trust Bank |
104.50 |
105.00 |
0.5% |
35.3% |
57.3% |
66.8 |
128.3 |
6.7% |
28.8% |
0.4x |
Buy |
|
|
Standard Chartered Bank |
285.00 |
284.00 |
(0.4%) |
(5.3%) |
(0.4%) |
285.3 |
314.1 |
15.8% |
26.4% |
1.6x |
Buy |
|
|
NCBA |
69.00 |
70.75 |
2.5% |
16.0% |
38.7% |
51.0 |
79.0 |
7.8% |
19.4% |
1.1x |
Accumulate |
|
|
I&M Group |
42.95 |
42.95 |
0.0% |
20.3% |
19.3% |
36.0 |
48.2 |
7.0% |
19.2% |
0.8x |
Accumulate |
|
|
ABSA Bank |
20.60 |
22.05 |
7.0% |
12.0% |
17.0% |
18.9 |
24.1 |
7.9% |
17.1% |
1.4x |
Accumulate |
|
|
KCB Group |
57.00 |
57.00 |
0.0% |
21.8% |
34.4% |
42.4 |
63.6 |
5.3% |
16.8% |
0.7x |
Accumulate |
|
|
Equity Group |
58.00 |
58.25 |
0.4% |
18.6% |
21.4% |
48.0 |
61.2 |
7.3% |
12.3% |
1.0x |
Accumulate |
|
|
Co-op Bank |
21.15 |
20.70 |
(2.1%) |
19.6% |
18.6% |
17.5 |
21.1 |
7.2% |
9.4% |
0.7x |
Hold |
|
|
Stanbic Holdings |
183.25 |
197.50 |
7.8% |
12.0% |
41.3% |
139.8 |
194.8 |
10.5% |
9.1% |
1.2x |
Hold |
|
|
Britam |
8.94 |
8.92 |
(0.2%) |
10.7% |
53.3% |
5.8 |
9.5 |
0.0% |
6.7% |
0.8x |
Hold |
|
|
Jubilee Holdings |
320.25 |
322.75 |
0.8% |
39.7% |
84.7% |
174.8 |
312.9 |
4.2% |
1.1% |
0.5x |
Lighten |
|
|
CIC Group |
4.91 |
4.87 |
(0.8%) |
62.8% |
127.6% |
2.1 |
4.0 |
2.7% |
(14.6%) |
1.3x |
Sell |
|
|
*Target Price as per Cytonn Analyst estimates **Upside/ (Downside) is adjusted for Dividend Yield ***Dividend Yield is calculated using FY’2024 Dividends |
||||||||||||
Weekly highlights
- Nairobi Securities Exchange Plc Launches Banking Sector Index
During the week, the Nairobi Securities Exchange (NSE) launched the NSE Banking Sector Share Index (NSE BSI) on 1stOctober 2025 to track the performance of all listed commercial banks in Kenya. This index provides investors with a transparent benchmark to measure the performance of banking stocks and serves as a basis for structured products and investment strategies. The ground rules outline its construction, eligibility, maintenance, and governance.
Below are the key ground rules that will manage the NSE BSI :
- To qualify, a company must be a listed commercial bank on the NSE. Both local and cross-listed banks are included, and all ordinary shares are eligible without restrictions on size, liquidity, or free float.
- The index uses a float-adjusted, market capitalization-weighted methodology. The base date is set at a value of 1000, with calculations reflecting the tradable market value of constituent stocks. Adjustments are made using a divisor to ensure index continuity when corporate actions, share changes, or structural adjustments occur.
- The index is reviewed annually to account for share changes in constituent companies. Additions occur when new banks list, while deletions result from delistings, suspensions, or financial failures. The divisor is recalculated to maintain index accuracy.
- If a constituent undergoes mergers, takeovers, or restructuring, adjustments are made accordingly. For instance, in a merger between index members, the surviving entity remains, while new eligible entities may be added. Suspended stocks lasting over 30 days are removed unless relisted.
- Changes in share capital, such as rights issues or employee share schemes, trigger adjustments in constituent weightings. Significant corporate actions like stock splits, dividends, or bonus issues may require divisor changes to ensure index stability. The NSE issues timely notices on adjustments. Divisor changes ensure that corporate actions do not distort index performance.
- The index comprises 11 banks: ABSA Kenya, Stanbic, Diamond Trust, Equity Group, I&M, KCB Group, NCBA, Standard Chartered Kenya, Co-operative Bank, BK Group, and HF Group.
The Banking Sector Index declined by 0.5% to 164.6 on 3rd October 2025 from 165.6 recorded on 1st October 2025(Inception date) attributable to losses recorded by large cap stocks such as Co-op bank of 1.4% . It is expected to deliver wide-ranging benefits to the market by serving as a transparent benchmark to guide portfolio allocation and investment decision-making, enhancing visibility for listed banks while supporting sector-based research and analysis. It will equally provide a foundation for product innovation such as Exchange Traded Funds (ETFs) and other index-linked products, thereby deepening market activity and broadening investor participation.
Listed Banks’ H1’2025 Performance
During the third quarter of 2025 the listed banking sector except BK group released their H1’2025 results, recording a weighted core EPS growth of 8.4% from 28.9% recorded in H1’ 2024. For more information, please see our H1’2025 Banking Sector Report.
Key Q3’2025 Highlights:
During Q3’2025;
- The Nairobi Securities Exchange (NSE) restructured its market segments, consolidating them into two; the Main Investment Market Segment (MIMS) for established issuers and the SME Market Segment for smaller firms, aiming to simplify listings, improve investor clarity, and align with global standards. MIMS now includes 57 equity and 4 bond issuers, while the SME segment remains small with 9 equity and 1 bond issuer; Please see our Cytonn Monthly July 2025 for more info
- Kalahari Cement Ltd announced plans to acquire a 29.2% stake in East African Portland Cement Plc (EAPC) for Kshs 27.30 per share, positioning the deal as a strategic, long-term investment to support EAPC’s recovery, pending regulatory approvals; Please see our Cytonn Monthly July 2025 for more info
- During the month, Sanlam Kenya Holdings released their H1’2025 results, recording an 89.0% decrease in Profit After Tax to Kshs 0.03 bn, from the Kshs 0.3 bn recorded in H1’2024. The performance was mainly driven by a 51.3% increase Net expenses from reinsurance contracts held, to Kshs 0.4 bn from Kshs 0.3 bn in H1’2024 but supported by a 34.0% increase in insurance investment revenue to Kshs 3.1 bn in H1’2025, from Kshs 2.3 bn in H1’2024. Please see our Cytonn Weekly #34/2025 for more info
- During the month, Liberty Kenya Holdings released their H1’ 2025 results, with Profit After Tax decreasing by 29.8% to Kshs 0.4 bn, from the Kshs 0.6 bn recorded in H1’2024. The performance was mainly driven by 61.0% decrease in net insurance service revenue to Kshs 0.2 bn in H1’2025, from Kshs 0.6 bn in H1’2024, coupled with 4.7% decrease in net investment revenue to Kshs 0.8 bn, from Kshs 0.9 bn in H1’2024. Please see our Cytonn Weekly #34/2025 for more info
- Britam Holdings released their H1’ 2025 results. Britam’s Profit After Tax (PAT) decreased by 20.7% to Kshs 1.7 bn, from Kshs 2.2 bn recorded in H1’2024.The performance was mainly driven by the 39.4% decrease in net insurance income to Kshs 1.3 bn from Kshs 2.1 bn recorded in H1’2024 coupled with the 29.7% increase in net insurance and finance expenses to Kshs 16.0 bn from the Kshs 12.3 bn recorded in H1’2024; Please see our Cytonn Monthly August 2025 for more info
- CIC Group released their H1’2025 results. CIC’s Profit After Tax decreased by 10.1% to Kshs 0.6 bn in H1’ 2025, from Kshs 0.7 bn recorded in H1’2024. The performance was mainly driven by a significant 87.7% decrease in net insurance service revenue to Kshs 0.1 bn in H1’2025, from Kshs 1.0 bn in H1’2024, attributable to the 23.4% increase in insurance service expenses to Kshs 12.8 bn in H1’2025, from Kshs 10.4 bn in H1’2024. The performance was, however, supported by a 35.7% increase in net investment income to Kshs 2.7 bn in H1’2025 from Kshs 1.8 bn in H1’2024;Please see our Cytonn Monthly August 2025 for more info
- Jubilee Holdings Limited released their H1’2025 results. Jubilee’s Profit After Tax (PAT) increased by 21.7% to Kshs 3.1 bn, from Kshs 2.5 bn recorded in H1’2025. The performance was mainly driven by a 32.6% increase in Insurance Services Revenues to Kshs 16.7 bn, from Kshs 12.6 bn in H1’2024, but was however weighed down by the 36.6% increase in Insurance Services Expenses to Kshs 15.4 bn in H1’2025, from Kshs 11.3 bn in H1’2024. Please see our Cytonn Monthly August 2025 for more info
- Kenya Re corporation released their H1’2025 results, recording an 49.5% increase in Profit After Tax to Kshs 1.6 bn, from the Kshs 1.1 bn recorded in H1’2024. The performance was mainly driven by a 18.2% decrease in Insurance service expense to Kshs 5.4 bn from Kshs 6.6 bn in H1’2024 which outpaced the 14.8% decrease in Insurance revenue to Kshs 6.3 bn from Kshs 7.4 bn in H1’2024. Please see our Cytonn Monthly August 2025 for more info.
We are “Bullish” on the Equities markets in the short term due to current cheap valuations, lower yields on short-term government papers and expected global and local economic recovery, and, “Neutral” in the long term due to persistent foreign investor outflows. With the market currently trading at a discount to its future growth (PEG Ratio at 0.9x), we believe that investors should reposition towards value stocks with strong earnings growth and that are trading at discounts to their intrinsic value. We expect the current high foreign investors sell-offs to continue weighing down the economic outlook in the short term.
In Q3’2025, the general Real Estate sector continued to witness considerable growth in activity in terms of property transactionsand development activities. Consequently, the sector’s activity contribution to Gross Domestic Product (GDP) grew by 5.5% toKshs 364.6 bn in Q2’2025, from Kshs 339.2 bn recorded during the same period in 2024. In addition, the sector contributed 8.1% to the country’s GDP, to remain relatively unchanged from the 8.1% recorded in Q1’2025. Cumulatively, the Real Estateand construction sectors contributed 15.3% to GDP, 3.8% points decrease from 19.1% in Q2’2024, attributable to decline in construction contribution to GDP by 3.7% points, to 5.0% in Q2’2025, from 8.7% recorded in Q2’2024;
The graph below highlights the Real Estate and Construction sectors’ contribution to GDP from 2020 to Q2’2025;
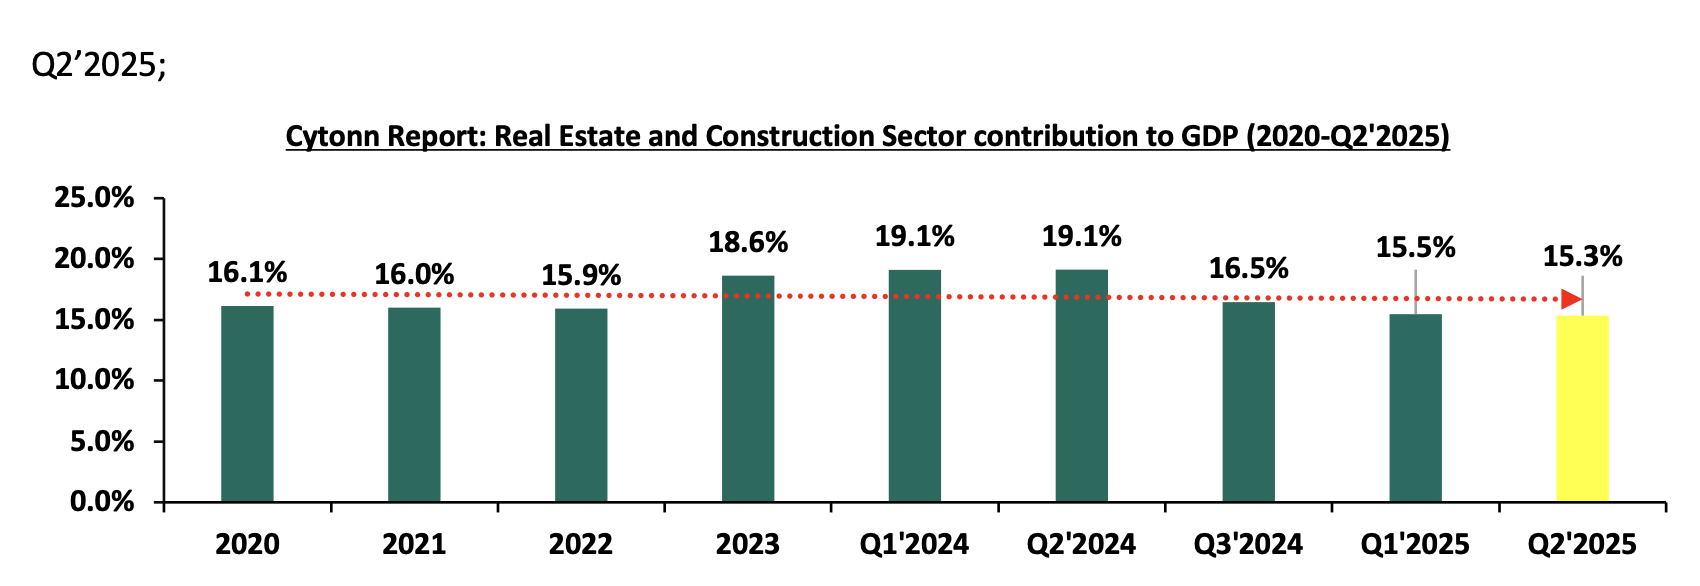
Source: Kenya bureau of statistics (KNBS)
In Q3’2025, Real Estate was promoted by key initiatives as follows:
- Government’s continued Focus on Affordable Housing: the Kenyan government has sustained its strong commitment to the Affordable Housing Program (AHP), a key pillar under the Bottom-Up Economic Transformation Agenda (BETA). According to the Architectural Association of Kenya’s (AAK) Status of the Built Environment Report 2024, the AHP pipeline currently comprises an estimated 730,062 housing units under various stages of construction, delivered through government and public-private partnerships. The program continues to gain momentum following the operationalization of the Affordable Housing Act, 2024, which introduced the Affordable Housing Levy, a dedicated funding mechanism now actively supporting project financing. The government has also expanded collaborations with county governments and private developers to unlock land and fast-track approvals, further accelerating housing delivery across the country,
- Infrastructural development: Kenya sustained momentum in infrastructure development, with focus shifting to ongoing government and public-private partnership (PPP) projects aimed at improving connectivity and supporting Real Estate activity. Key highlights in the quarter included progress on Phase II of the Dongo Kundu Bypass, particularly works on the Mwache and Mteza bridges, and continued upgrades of road networks under the Kenya Urban Roads Authority (KURA) in Nairobi and other urban centres. Additionally, reports pointed to new disbursements under the Roads Annuity Program and ongoing construction under the Affordable Housing supporting infrastructure initiative, which includes feeder roads, water and sewer systems in housing project sites. These developments underline the state’s prioritization of infrastructure as a catalyst for economic growth, even as challenges such as high construction costs and delayed contractor payments remain constraints to faster implementation,
- Provision of affordable mortgage financing: Kenya Mortgage Refinance Company (KMRC) has continued to play a critical role in expanding access to affordable housing finance by offering single-digit fixed-rate, long-term refinancing to Primary Mortgage Lenders (PMLs) such as banks, SACCOs, and microfinance institutions. In Q3’2025, KMRC advanced the implementation of its widened eligibility framework to include non-shareholder SACCOs and microfinance banks, aimed at enabling more institutions to offer low-cost mortgages to underserved segments, particularly low- and middle-income earners. This initiative aligns with the government’s affordable housing agenda by enhancing the availability of sustainable mortgage products. KMRC also sustained its capital-raising efforts through bond issuances to support continued liquidity for mortgage lenders, reinforcing its mandate to deepen Kenya’s mortgage market.
- Aggressive expansion pursued by retailers: the retail landscape has seen a surge in growth, with both domestic and international retailers like Naivas, QuickMart, China Square, Panda Mart, and Carrefour aggressively expanding theirmarket These retailers are capitalizing on the opportunities created by the exit of distressed chains like Choppies, Nakumatt, Tuskys, and Uchumi. Furthermore, the influx of global brands such as Adidas, Puma, Aldo, andMichael Kors is poised to further fuel the sector's growth and development,
- Kenya’s recognition as a regional business hub: Kenya continues to enjoy recognition as a regional business hub. As a result, foreign entities have continued to open business operations in Kenya, boosting the demand for both commercial and residential Real Estate. Increased business activity has driven up demand for office space, apartments, and housing near business hubs, leading to the development of new projects, increased property values, and job creation in the construction sector,
- Positive Demographics: with relatively high urbanization and population growth rates of 7% p.a and 2.0% p.a,respectively, against the global average of 1.7% p.a and 1.0% p.a, respectively, as at 2024, there is a sustained demand for more housing units in the country,
- Increasing Investor Confidence: Increase in investor confidence has greatly influenced hospitality sector and this is evident through mergers, acquisitions and expansions of hotels. Furthermore, the number of international arrivals into the country by the end of July 2025 registered a 50.9% year- to-year (y/y) increase to persons 256,173 from 169,722 in July 2024. Notably, the Hotel Chain Development Pipelines in Africa 2024 Report ranked Nairobi at 7th position by plannednumber of hotels and rooms with 31 hotels and 4,268 rooms in the pipeline,
- Special Built Developments: There has been an increased popularity of purpose-built properties to host Student housing, medical centers, Diplomatic residentials, data centers which offer potential for growth to the Real Estate sector through alternative markets. Due to these assets classes, the industry remains resilient despite the rapidly changing technological and economic environments, and,
- Easing Construction Costs: construction costs in Kenya showed signs of stabilization, largely supported by subdued inflation of 6% y/y as of July 2025 and a relatively stable currency. According to the Kenya National Bureau of Statistics (KNBS) Q2’2025 Construction Input Price Indices Report, the Building Cost Index (BCI) increased slightly to 119.8 in Q2’2025 from 119.1 in Q1’2025, marking a 0.6% quarter-on-quarter increase. This indicates a moderation in construction cost growth, driven by steadier prices for key inputs such as fuel, steel and transport. Despite the easing overally, prices for specific materials continued to rise modestly; cement increased by 2.6%, quarry products by 2.7%, and sand by 1.4%, suggesting that while input inflation is moderate, developers are still facing some upward pressure in select areas.
Despite the above drivers, the sector’s optimal performance is expected to be hampered by the following factors in 2025:
- Existing oversupply of physical space in select sectors: With approximately 5.7 mn SQFT in the NMA commercial office market, approximately 3.0 mn SQFT in the Nairobi Metropolitan Area (NMA) retail market, with the rest of the Kenyan retail market having an oversupply of approximately 1.7 mn This has led to prolonged vacancy rates in the respective Real Estate sectoral themes,
- Subdued REITs Market: The REITs market in Kenya continues to be subdued owing to various challenges such as thelarge capital requirements of Kshs 0 mn for trustees compared to Kshs. 10 mn for pension fund Trustees, which limits the role to banks, prolonged approval process for REITs, only a few legal entities capable of incorporating REITs, highminimum subscription amounts or offer parcels set at Kshs 0.1 mn for D-REITs and 5.0 mn for restricted I-REITs and lack ofadequate knowledge of the financial asset class by investors,
- Constrained financing to developers: Financing for real estate developers remains constrained due to elevated borrowing costs and increased lending caution, with lenders demanding more collateral given the heightened credit risk in the sector. Recent data points to a worsening of overall bank asset quality: the gross non-performing loans (NPL) ratio in the banking sector worsened to 17.6% by June 2025, up from 17.4% in March 2025. Among listed banks, the weighted average NPL ratio also deteriorated, rising to 14.0% in Q1’2025 from 13.5% a in 2024. Elevated non-performing loans squeeze banks’ capacity to extend credit, tighten lending standards and heighten risk perceptions, all of which exacerbate financing constraints for real estate developers.
- Underdeveloped capital markets: It is difficult to develop pools of capital focused on projects, particularly in the privatemarkets, to supplement government efforts in providing Banks in Kenya are the primary source of funding for real estate developers, providing nearly 95.0% of funding as opposed to 40.0% in developed countries. This means that capital markets contribute only 5.0% of Real Estate development funding, compared to 60.0% in developed countries as shown below;
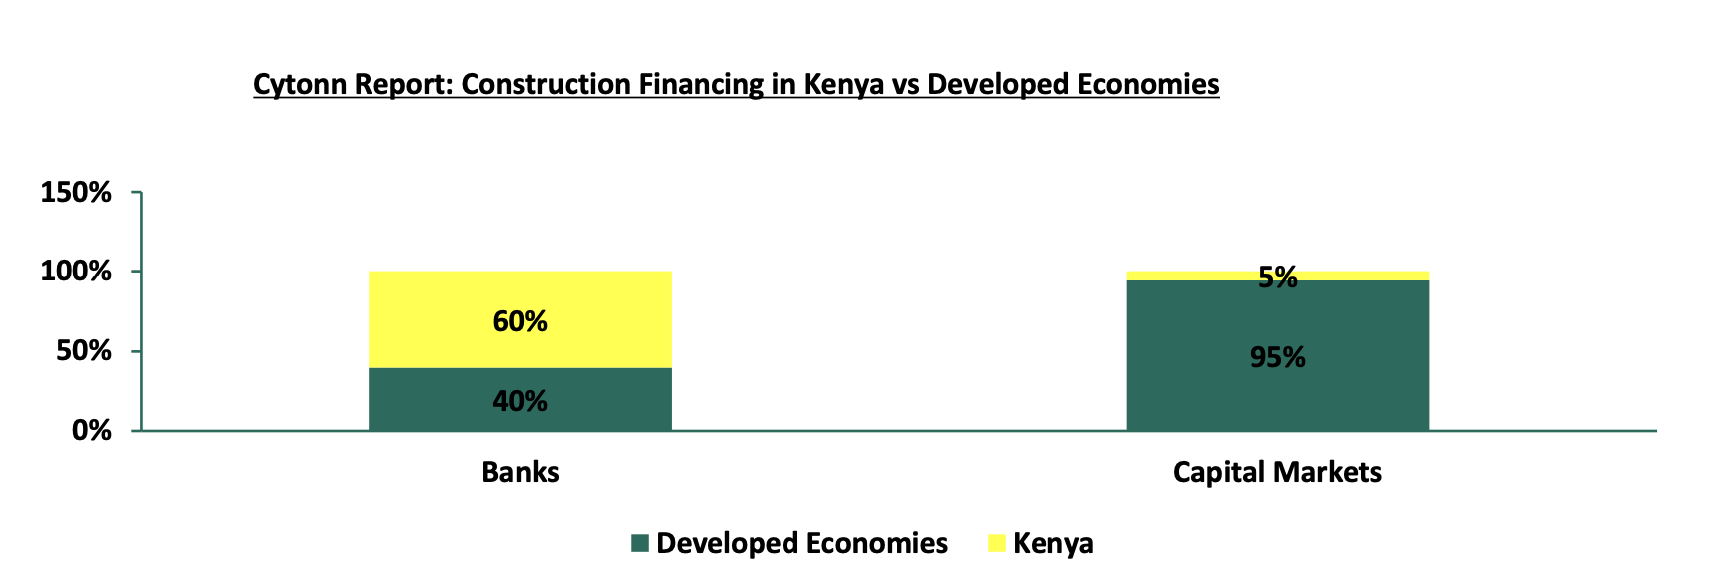
Source: World Bank, Capital Markets Authority
Sectoral Market Performance
- Industry Report
During the quarter, the following industry reports were released, and the key take-outs were as follows;
- GDP report Q2’2025
During the week, the Kenya National Bureau of Statistics (KNBS) released the Quarterly Gross Domestic Product Report that outlined the performance of various sectors to the GDP and below are the key take-outs related to the Real Estate sector:
- Steady growth in the Real Estate Sector - The Real Estate sector posted steady growth of 5.5% in Q2’2025, which is 0.4% points slower than the 5.9% growth registered in Q2’2024. The steady growth can be attributable to an increasing demand for housing in the country. However, the slowed growth compared to Q2’2024 can be attributable to the sustained increase in the construction costs which remained a significant challenge to developers and investors during the period under review. For instance, the construction costs of a standard high-rise apartment block have increased by 13.0% to Kshs. 68,290 per square metre in 2025 from Kshs. 60,435 per square metre in 2024. On a quarter-on-quarter basis, this represented a 0.2%-points increase from the 5.3% growth recorded in Q1’2025. The increase in performance can be attributable to; i) Eased interest rates, following CBK’S decision to lower the CBR by 1.0% point to 9.75% from 10.00%. This has enabled increased access to credit and lower rates which has spurred demand in the property market, ii) Improved strength in the Kenyan Shilling, which has improved against major currencies such as the Euro, Pound Sterling and US Dollar by 16.3%, 14.2% and 13.6%. This will help in reducing the expected importation costs for construction costs for materials such as furniture, fixtures and fittings, iii) Favourable government and policy interventions. Continued rollout of affordable housing projects under the Kenya Kwanza administration (BETA) has fostered increased demand for residential units and construction related services.
The graphs below show the Real Estate sector contribution to GDP from Q1’2021 to Q2’2025.
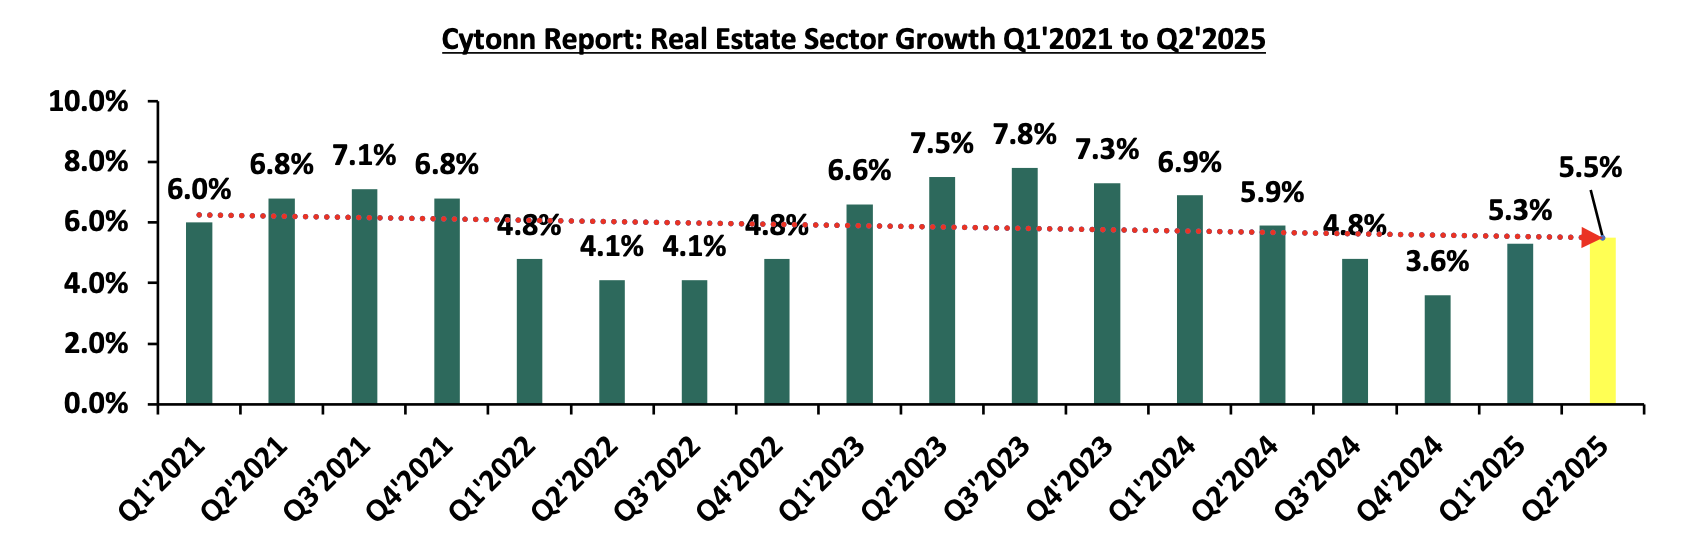
Source: Kenya bureau of statistics (KNBS)
- Subdued growth in the construction sector - The construction sector grew by 5.7% in Q2’2025, which is 9.4% points higher than the (3.7%) growth in Q2’2024. On a quarter-on-quarter basis, this performance represented a 2.7%-point increase from the 3.0% increase recorded in Q1’2025. The graph below shows the Construction sector growth rates from Q1’2021 to Q2’2025;
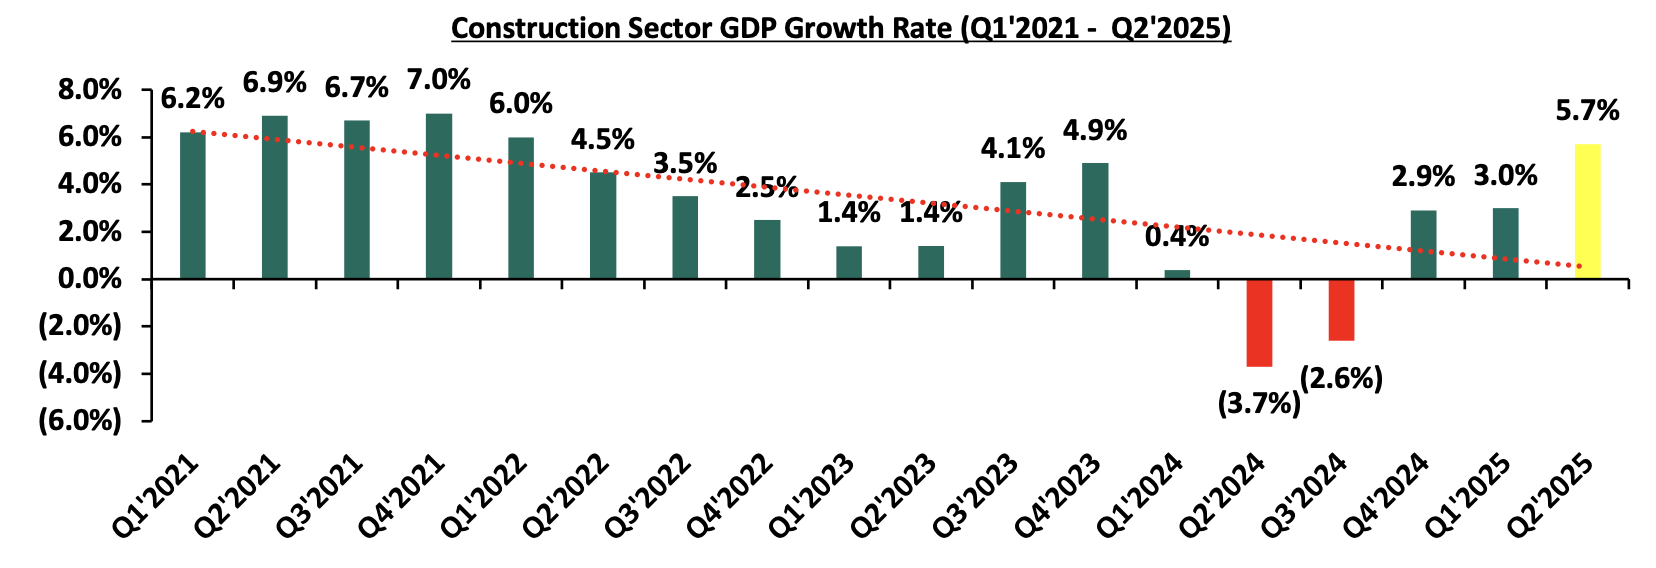
Source: Kenya bureau of statistics (KNBS)
- Sustained recovery in accommodation and restaurant sector –The accommodation and restaurant services sector grew by 7.8% in Q2’2025, representing a 27.2%-points y/y decline from the 35.0% growth recorded in Q2’2024. On a q/q basis, the performance reflected a 3.7% increase from the 4.1% growth registered in Q1’2025. The slowed growth compared to 2024 is mainly attributable to economic deceleration, high operational costs and constrained consumer spending arising from increased taxation and elevated living costs. Nevertheless, the sector continues to recover steadily from the impacts of COVID-19, with the lifting of travel restrictions remaining a key driver of activity within the wider real estate and tourism industries. The sector is expected to continue benefitting from an increased number of international arrivals; for instance, in June 2025, the number of international visitor arrivals through Jomo Kenyatta International Airport (JKIA), Moi International Airport (MIA) and other border points was 211,609, reflecting a 23.5% increase from the 171,269 arrivals recorded in May 2025. The graph below shows the accommodation and restaurant sector contribution to GDP growth rates from Q1’2021 to Q2’2025;
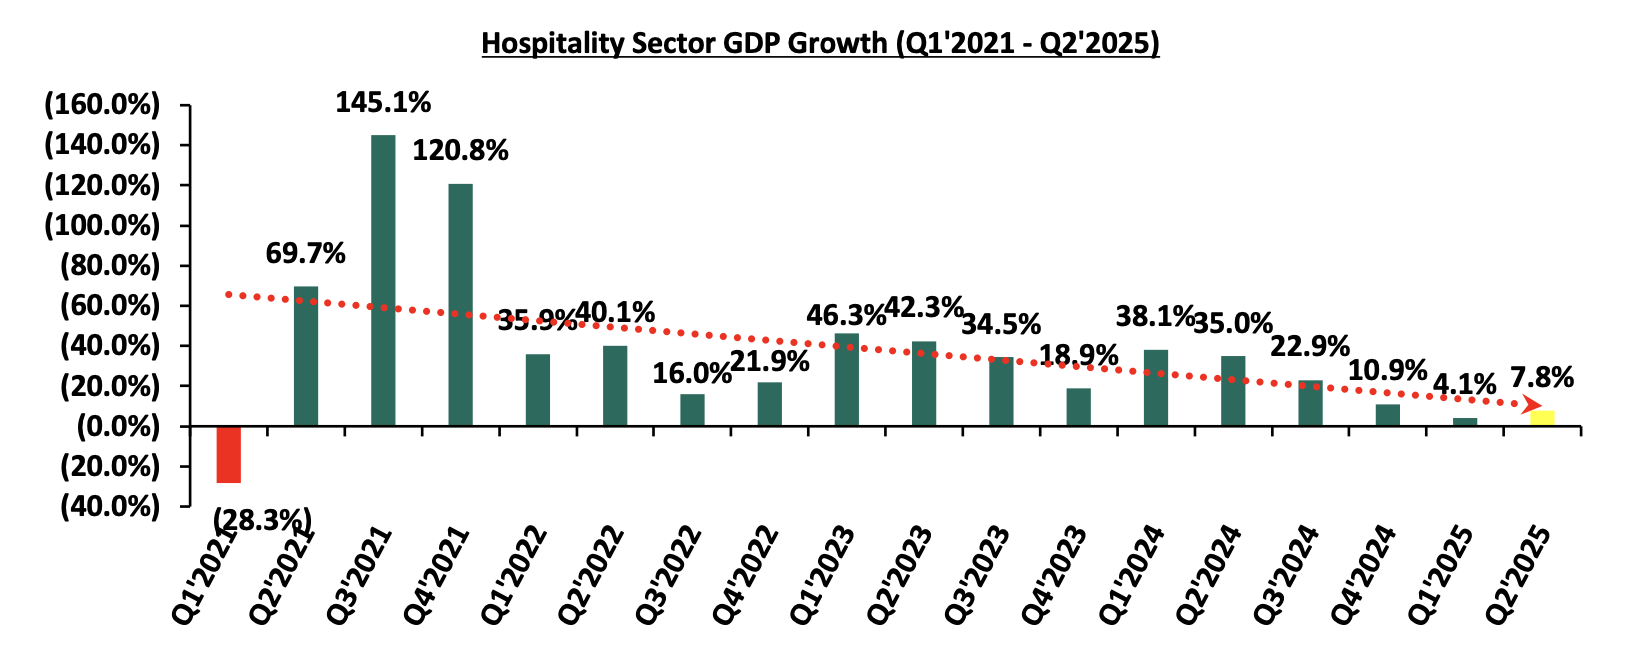
Source: Kenya bureau of statistics (KNBS)
We anticipate growth in Kenya's Real Estate sector, supported by several key factors such as; i) high urbanization and population growth rates of 3.7% p.a and 2.0% p.a, respectively, against the global average of 1.7% p.a and 1.0% p.a, respectively as at 2024, sustaining demand for housing units and other Real estate developments, ii) increased visitor arrivals through the major points of entry such as the Jomo Kenyatta International Airport (JKIA), Moi International Airport (MIA) and other border points by 21.1% to 256,173 arrivals recorded in July 2025, from 211,609 arrivals in June 2025. On a year-on-year basis, July 2025 arrivals represent a 50.9% increase compared to 169,722 in July 2024, indicating a continued rebound in tourism activity, iii) the government continued roll out and support of the affordable housing programme in the country, iv) increased activities by industry players, especially in the residential sector. However, we expect the sectors growth to be weighed down by increasing construction costs and the toughing lending environment for real estate developers.
- July 2025 Leading Economic Indicators
During the week, the Kenya National Bureau of Statistics (KNBS) released the Leading Economic Indicators (LEI) July 2025Reports, which highlighted the performance of major economic indicators,
Key highlights related to the Real Estate sector include:
- In July 2025, international visitor arrivals through Jomo Kenyatta International Airport (JKIA) and Moi International Airport (MIA) rose sharply to 256,173, a 50.9% year-on-year increase from 169,722 in July 2024. On a month-on-month basis, this was an increase of 21.1% from 211,609 in June 2025, reflecting sustained momentum in Kenya’s tourism recovery. Growth was supported by (i) new direct flight connections from Mumbai to Nairobi, Dubai to Nairobi and Mombasa, and Johannesburg to Nairobi, (ii) diversification of tourism products beyond wildlife safaris into cruise tourism, cultural heritage circuits, adventure travel and sports events such as the World Rally Championship and international marathons, (iii) intensified global marketing under the “Magical Kenya” brand using digital platforms, expos, and influencer collaborations, and (iv) visa-free entry reforms, which simplified entry procedures and enhanced Kenya’s appeal as a global destination.
The chart below shows the number of international arrivals in Kenya between Q1’2023 and July 2025.
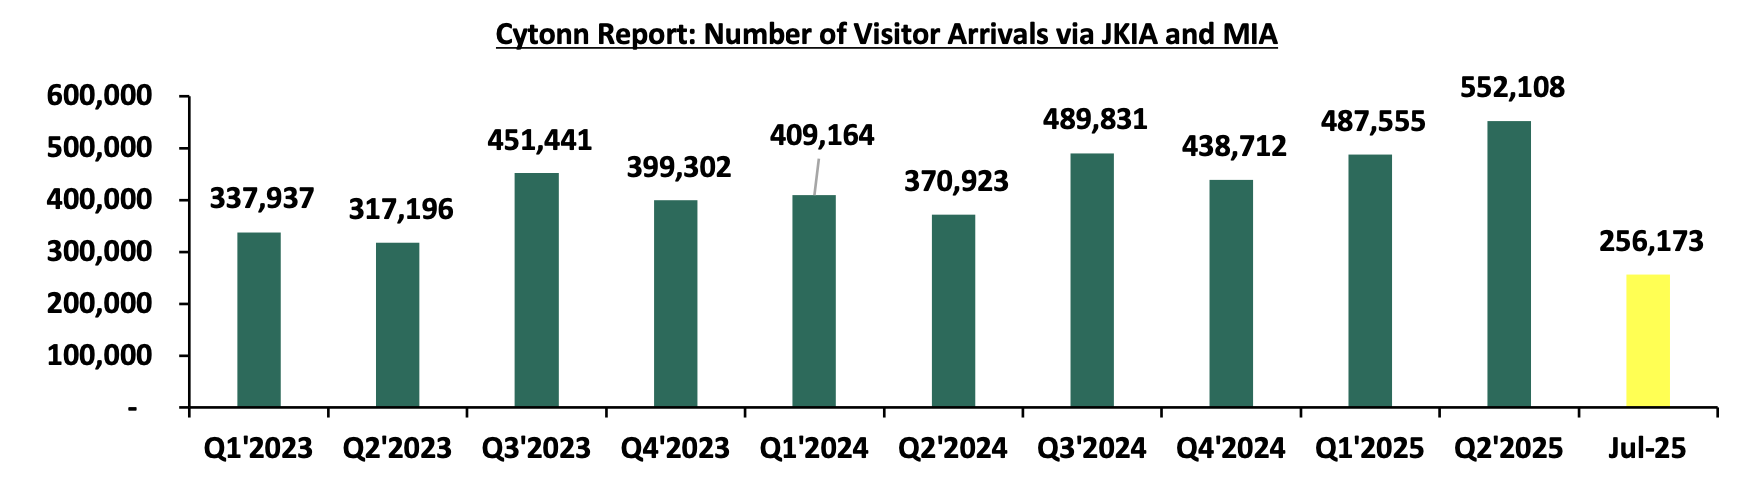
Source: Kenya National Bureau of Statistics (KNBS)
- In July 2025, cement consumption increased to 0.9 bn metric tonnes, a 23.3% y/y increase from 0.7 bn in July 2024. On a month-on-month basis, cement consumption grew by 10.6%, underscoring resilience in construction demand. The performance was anchored by (i) continued private sector construction activity in urban hubs like Nairobi, Mombasa, and Kisumu, (ii) government-led infrastructure investments under the Bottom-Up Economic Transformation Agenda (BETA), including roads, affordable housing, water, and sanitation projects, and (iii) public works initiatives in rural and semi-urban areas, which both support livelihoods and expand critical infrastructure.
The chart below shows cement consumption in metric tonnes in Kenya between Q1’2023 and July 2025.
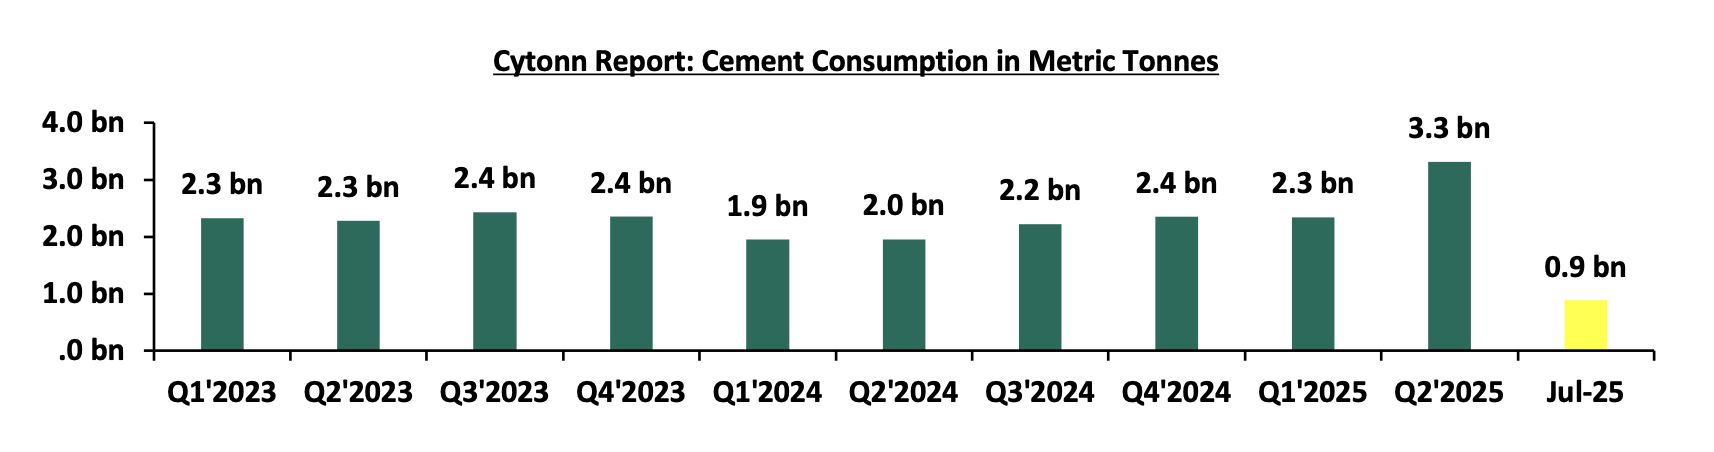
Source: Kenya National Bureau of Statistics (KNBS)
- In July 2025, the value of building plans approved in Nairobi City County declined by 27.8% on year-on-year basis to Ksh 11.2 bn from Ksh 15.7 bn in July 2024 and a 18.5% decrease on month-on-month basis, pointing to continued weakness in overall development activity. The slowdown reflects (i) a cautious investment climate in real estate amid elevated construction costs, with luxurious office block costs in the Nairobi Metropolitan Area rising by 0%,discouraging new project starts, (ii) longer approval timelines due to increased scrutiny and procedural reforms by planning authorities, and (iii) a strategic shift by developers toward completing ongoing projects rather than initiating new ones, especially in oversupplied segments such as commercial office space, iv) the high cost of construction loans, with lending rates above 20.0% in early 2025, which has significantly raised financing costs and made developers more reluctant to commit to new projects.
The chart below shows the building plans approved in billions in Kenya between Q1’2023 and Q2’2025.
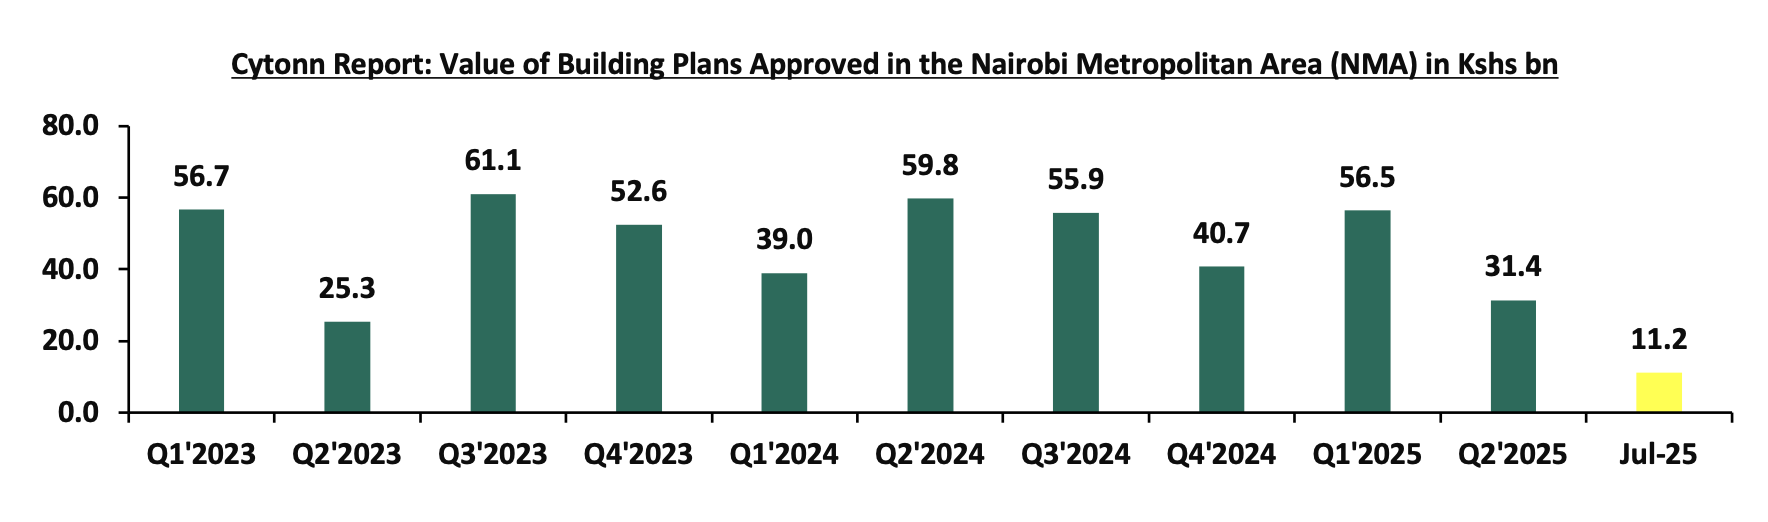
Source: Kenya National Bureau of Statistics (KNBS)
|
Cytonn Report: Notable Industry Reports During Q3’2025 |
|||
|
# |
Theme |
Report |
Key Take-outs |
|
1. |
Leading Economic Indicators (LEI) June 2024 Report by the Kenya National Bureau of Statistics (KNBS) |
Hass Consult released its Property Index Q1’2025 Report |
In Q2’2025, international visitor arrivals through Jomo Kenyatta International Airport (JKIA) and Moi International Airport (MIA) rose sharply to 552,108, a 48.8% year-on-year increase from 370,923 in Q2’2024. On a quarter-on-quarter basis, this was an increase of 13.2% from 487,555 in Q1’2025, reflecting sustained momentum in Kenya’s tourism recovery.For more information, please see our Cytonn Monthly August 2025. |
|
2 |
Hass Consult property Index |
Hass Consult released its Property Index Q1’2025 Report |
· The average selling prices for all properties posted a 3.8% increase on a quarter-on-quarter (q/q) basis in Q2’2025,1.3% points increase up from 2.5% recorded in Q1’2025. On a year-on-year (y/y) basis, property prices recorded a robust 7.8% growth, a 2.9% increase up from 4.9% in Q2’2024. · The average asking rents of housing units in the Nairobi Metropolitan Area during Q2’2025 contracted by 0.2% quarter‑on‑quarter basis, a reversal from the 0.3% increase seen in Q1’2025. · Apartments recorded a 2.4% quarter-on-quarter increase in rents in Q2’2025, while semi-detached units declined by 0.4%, and detached units fell by 1.6%. · For more information, please see our Cytonn Monthly July 2025 · |
|
3 |
Hass Consult Land Price Index |
Hass Consult released Land Price Index Q2’2025 Report |
· In Q2’2025, the average quarter-on-quarter selling prices for land in Nairobi suburbs increased by 1.7%, maintaining the same pace as Q1’2025, indicating a stable trend. On a year-on-year basis, land prices in the suburbs appreciated by 6.9%, a marginal improvement from 6.5% recorded previously. · For more information, please see our Cytonn Monthly July 2025 |
For more notable developments during Q3’2025 please visit our H1’2025 market review report, Cytonn Monthly_July 2025, and Cytonn Monthly_August 2025
We expect the industrial sector to maintain moderate growth momentum, driven by increased cement consumption, continued government infrastructure rollout under the Bottom-Up Economic Transformation Agenda (BETA), and resilient private sector construction activity in urban hubs. Expansion in manufacturing and industrial real estate is also being supported by Kenya’s positioning as a regional business hub, which continues to attract both local and international firms. However, growth will likely be weighed down by elevated production and construction costs, subdued investor confidence reflected in reduced building plan approvals, and constrained credit access due to high lending rates, which limit developers’ capacity to finance new industrial and logistics projects.
- Residential Sector
During Q3’2025, the NMA residential sector recorded a slight increase in performance, with the average total returns to investors coming in at 7.1%, a 1.1%-point increase from 6.0% recorded in Q3’2024. The performance was attributed to an increase in the residential average y/y price appreciation which came in at 1.1% in Q3’2025, 0.4%-points higher than the 0.7% appreciation recorded in Q3’2024, driven by increased property transactions during the year. On the other hand, the average rental yield came in at 5.8% in Q3’2025, recording a 0.4%-points increase from the 5.4% rental yield recorded in Q3’2024. This was driven by an increase in the average occupancy by 1.8% points to 92.6%, from 90.8% recorded in Q3’2024. The table below shows the NMA residential sector’s performance during Q3’2024 and Q3’2025;
|
(All values in Kshs unless stated otherwise) |
|||||||||
|
Cytonn Report: Nairobi Metropolitan Area (NMA) Residential Sector Summary - Q3’2025/Q3’2024 |
|||||||||
|
Segment |
Average of Price per SQM Q3'2025 |
Average of Rent per SQM Q3'2025 |
Average of Rental Yield Q3'2025 |
Average of Price Appreciation Q3'2025 |
Average of Total Returns Q3'2025 |
Average of Rental Yield Q3'2024 |
Average of Price Appreciation Q3'2024 |
Average of Total Returns Q3'2024 |
y/y change in Rental Yield (% Points) |
|
Detached Units |
|||||||||
|
High End |
209,320 |
859 |
4.8% |
0.5% |
6.5% |
4.8% |
0.6% |
5.8% |
0.0% |
|
Lower Middle |
76,153 |
388 |
4.8% |
0.3% |
6.2% |
5.2% |
0.9% |
6.0% |
(0.4%) |
|
Upper Middle |
134,577 |
571 |
5.0% |
0.2% |
5.2% |
4.9% |
0.7% |
5.5% |
0.1% |
|
Detached Units Average |
140,017 |
606 |
5.2% |
0.3% |
6.0% |
5.0% |
0.7% |
5.8% |
0.2% |
|
Apartments |
|||||||||
|
Lower Mid-End Satellite Towns |
82,202 |
456 |
6.6% |
2.1% |
8.7% |
6.1% |
0.6% |
6.5% |
0.5% |
|
Lower Mid-End Suburbs |
94,512 |
513 |
5.8% |
1.9% |
7.8% |
5.4% |
0.8% |
6.4% |
0.4% |
|
Upper Mid-End |
130,029 |
721 |
6.8% |
1.3% |
8.1% |
5.9% |
0.7% |
5.8% |
0.9% |
|
Apartments Average |
103,459 |
581 |
6.4% |
1.8% |
8.2% |
5.8% |
0.7% |
6.2% |
0.6% |
|
Residential Market Average |
121,738 |
594 |
5.8% |
1.1% |
7.1% |
5.4% |
0.7% |
6.0% |
0.4% |
Source: Cytonn Research
- Detached Units Performance
The table below shows the NMA residential sector detached units’ performance during Q3’2025;
|
All values are in Kshs unless stated otherwise |
||||||||
|
|
||||||||
|
Cytonn Report: Residential Detached Units Summary H1’2025 |
||||||||
|
Area |
Average of Price per SQM Q3'2025 |
Average of Rent per SQM Q3'2025 |
Average of Occupancy Q3'2025 |
Average of Uptake Q3'2025 |
Average of Annual Uptake Q3'2025 |
Average of Rental Yield H1'2025 |
Average of Price appreciation Q3'2025 |
Total Returns |
|
High End |
||||||||
|
Runda |
258,659 |
1,225 |
97.0% |
96.8% |
8.1% |
5.2% |
1.4% |
6.6% |
|
Kitisuru |
285,564 |
847 |
96.5% |
92.0% |
9.1% |
4.4% |
1.2% |
5.6% |
|
Rosslyn |
201,110 |
942 |
95.0% |
98.6% |
10.2% |
5.2% |
0.0% |
5.2% |
|
Lower Kabete |
129,870 |
569 |
95.8% |
93.8% |
9.4% |
4.8% |
0.0% |
4.8% |
|
Karen |
171,398 |
701 |
92.5% |
93.5% |
9.2% |
4.2% |
(0.1%) |
4.1% |
|
Average |
209,320 |
859 |
95.4% |
94.9% |
9.2% |
4.8% |
0.5% |
5.3% |
|
Upper Middle |
||||||||
|
South B/C |
114,683 |
769 |
89.9% |
88.5% |
11.8% |
7.4% |
1.7% |
9.1% |
|
Loresho |
121,626 |
613 |
90.6% |
90.6% |
9.4% |
5.5% |
1.3% |
6.8% |
|
Lavington |
191,594 |
623 |
92.4% |
94.7% |
9.0% |
3.8% |
0.8% |
4.6% |
|
Langata |
114,256 |
440 |
93.1% |
90.2% |
7.6% |
4.5% |
0.3% |
4.7% |
|
Runda Mumwe |
164,013 |
702 |
91.1% |
96.2% |
14.8% |
4.7% |
0.0% |
4.7% |
|
Ridgeways |
151,454 |
385 |
87.5% |
88.3% |
7.5% |
2.6% |
0.0% |
2.6% |
|
Redhill & Sigona |
84,416 |
468 |
92.0% |
98.4% |
9.8% |
6.3% |
(2.3%) |
4.0% |
|
Average |
134,577 |
571 |
90.9% |
92.4% |
10.0% |
5.0% |
0.2% |
5.2% |
|
Lower Middle |
||||||||
|
Ngong |
60,962 |
305 |
88.9% |
91.9% |
11.7% |
5.5% |
1.3% |
6.7% |
|
Juja |
73,491 |
270 |
90.7% |
94.2% |
12.2% |
5.4% |
1.2% |
6.6% |
|
Donholm & Komarock |
94,549 |
408 |
83.9% |
91.0% |
9.1% |
4.5% |
1.0% |
5.5% |
|
Athi River |
86,423 |
359 |
91.3% |
96.4% |
9.4% |
4.6% |
0.6% |
5.2% |
|
Kitengela |
66,043 |
302 |
93.6% |
92.5% |
9.8% |
5.2% |
0.5% |
5.7% |
|
Rongai |
89,895 |
708 |
96.9% |
94.4% |
10.1% |
9.8% |
0.0% |
9.8% |
|
Thika |
63,432 |
352 |
84.9% |
81.6% |
12.3% |
6.2% |
(0.2%) |
6.0% |
|
Syokimau/Mlolongo |
74,429 |
403 |
88.2% |
86.6% |
14.3% |
5.8% |
(2.1%) |
3.7% |
|
Average |
76,153 |
388 |
89.8% |
91.1% |
11.1% |
5.9% |
0.3% |
6.2% |
|
Grand Average |
140,017 |
606 |
91.8% |
92.7% |
10.1% |
5.2% |
0.3% |
5.5% |
Source: Cytonn Research
The key take-outs from the table include;
- Average Total Returns – The average total returns to detached units’ investors came in at 5.5%, 0.2% points lower than the 5.7% recorded in Q3’2024. The decrease in performance was attributable to 0.3% points decrease in the average price appreciation to 0.3% in Q3’2025, from 0.6 % recorded in Q3’2024,
- Segment Performance – The best-performing segment was the lower-middle segment offering an average total return of 6.2%, attributable to a relatively high average rental yield of 5.9%, 0.7%-points higher than the detached market average appreciation of 5.2%. The impressive performance of the segment was driven by returns from well-performing nodes such as Rongai, Ngong and Juja, which have continued to offer relatively high returns to investors, and,
- Nodal Performance – Overall, Rongai was the best-performing node, offering the highest returns at 9.8%, 4.3% points higher than the detached market average of 5.5%, driven by a relatively high rental yield of 10.2%. The node has seen increased detached unit property investments owing to an inflow of residents brought about by the enhanced accessibility to the Nairobi CBD through various roads such as Limuru Road and the Western bypass. Also, the area enjoys proximity to various amenities such as the JKIA due to the enhanced road network. South B/C and Ngong followed with an average total return of 9.8% and 6.7% respectively
- Apartments Performance
The table below shows the NMA residential sector apartments’ performance during Q3’2025;
|
All values are in Kshs unless stated otherwise |
|
||||||||
|
Area |
Average of Price per SQM Q3'2025 |
Average of Rent per SQM Q3'2025 |
Average of Occupancy Q3'2025 |
Average of Uptake Q3'2025 |
Average of Annual Uptake Q3'2025 |
Average of Rental Yield Q3'2025 |
Average of Price Appreciation |
Total Yields |
|
|
Upper Mid-End |
|||||||||
|
Upperhill |
123,679 |
651 |
92.3% |
90.5% |
9.8% |
6.3% |
4.7% |
11.0% |
|
|
Kileleshwa |
128,835 |
699 |
96.2% |
93.1% |
14.1% |
6.5% |
1.0% |
7.5% |
|
|
Westlands |
164,593 |
749 |
93.1% |
92.9% |
9.7% |
5.5% |
0.7% |
6.2% |
|
|
Kilimani |
106,991 |
811 |
95.9% |
92.3% |
7.0% |
9.1% |
0.4% |
9.5% |
|
|
Parklands |
126,046 |
698 |
93.2% |
94.8% |
9.9% |
6.6% |
(0.3%) |
6.3% |
|
|
Average |
130,029 |
721 |
94.6% |
92.7% |
10.1% |
6.8% |
1.3% |
8.1% |
|
|
Lower Mid-End Suburbs |
|||||||||
|
Imara Daima |
86,280 |
344 |
95.9% |
89.7% |
7.1% |
4.7% |
8.3% |
12.2% |
|
|
Dagoretti |
93,431 |
540 |
91.8% |
83.8% |
8.1% |
9.3% |
4.2% |
13.3% |
|
|
Syokimau |
70,813 |
376 |
90.8% |
89.9% |
9.6% |
5.5% |
2.6% |
7.9% |
|
|
Langata |
114,700 |
924 |
95.4% |
91.5% |
8.6% |
6.8% |
1.8% |
7.8% |
|
|
Kahawa West |
82,221 |
447 |
96.3% |
94.7% |
6.6% |
4.8% |
0.9% |
7.4% |
|
|
Waiyaki Way |
110,218 |
672 |
91.9% |
93.1% |
9.5% |
5.7% |
0.4% |
6.1% |
|
|
South B |
109,317 |
528 |
93.0% |
98.2% |
11.5% |
4.9% |
0.3% |
5.7% |
|
|
Race Course/Lenana |
97,997 |
638 |
95.5% |
95.9% |
8.3% |
7.4% |
0.0% |
7.4% |
|
|
South C |
118,331 |
623 |
84.9% |
96.0% |
11.6% |
4.3% |
0.0% |
4.1% |
|
|
Average |
98,145 |
566 |
92.8% |
92.5% |
9.0% |
5.8% |
1.9% |
7.8% |
|
|
Lower Mid-End Satellite Towns |
|||||||||
|
Athi River |
54,482 |
418 |
97.3% |
96.0% |
9.3% |
7.1% |
4.7% |
11.8% |
|
|
Ngong |
82,585 |
341 |
95.8% |
93.2% |
10.3% |
7.0% |
4.1% |
11.2% |
|
|
Kikuyu |
83,730 |
469 |
95.8% |
96.0% |
13.7% |
6.3% |
3.1% |
9.4% |
|
|
Syokimau |
67,423 |
389 |
89.3% |
92.8% |
10.7% |
6.2% |
1.7% |
8.0% |
|
|
Thindigua |
105,937 |
594 |
92.1% |
89.9% |
10.9% |
6.3% |
0.9% |
7.2% |
|
|
Ruaka |
113,234 |
549 |
91.0% |
90.0% |
10.5% |
5.3% |
0.9% |
6.3% |
|
|
Rongai |
61,354 |
369 |
91.5% |
91.6% |
10.7% |
6.1% |
0.4% |
6.5% |
|
|
Ruiru |
88,872 |
522 |
89.7% |
88.2% |
11.2% |
6.3% |
0.0% |
6.3% |
|
|
Average |
82,202 |
456 |
92.8% |
92.2% |
10.9% |
6.6% |
2.1% |
8.7% |
|
|
Apartments Grand Average |
103,459 |
581 |
93.4% |
92.5% |
10.0% |
6.4% |
1.8% |
8.2% |
|
Source: Cytonn Research
The key take-outs from the table include;
- Average Total Returns – The average total returns to apartments’ investors came in at 8.2%, recording a 1.7%-points increase from the 6.5% recorded during Q3’2024. The significant improved performance was driven by a 0.6%-points increase in the average rental yield to 6.4% in Q3’2025, from 5.8% recorded in Q3’2024. This was driven by slight increase in apartment property transactions during the period, attributable to 2.7% points increase in the average occupancy to 93.4% in Q3’2025 from 91.5% in Q3’2024,
- Segment Performance – The best-performing segment was the lower mid-end satellite towns with average total returns of 8.7%, attributed to a relatively high average y/y price appreciation of 2.1% and rental yield of 6.6%. The impressive performance of the segment was driven by returns from well-performing nodes such as Athi River, Ngong and Kikuyu that have continued to offer competitive returns to investors in comparison to other segments, and
- Nodal Performance – Overall, the best-performing node was Athi River, offering investors average total returns of 11.8%, 3.6%-points higher than the apartment market average total return of 8.2%. Athi River is attracting apartment investments owing to infrastructural development with the roads such as Mombasa Road, Nairobi expressway, proximity to CBD favouring residents in the area, a high number of middle-class families in the area, proximity to essential amenities such as the SGR and JKIA.
Notable highlights during the week;
- Court of Appeal Clears Rhapta Road for 20-Storey Developments in Landmark Zoning Ruling
During the week, the Court of Appeal delivered a landmark ruling on the long-running zoning dispute concerning Rhapta Road. The judgment provided much-needed clarity by confirming that the area falls under Zone 3C, which allows development of up to 20 storeys. This decision has far-reaching implications for property developers, residents, and the Nairobi City County government.
In its ruling, the Court declared that old zoning guidelines, such as those issued in 2004, are outdated and no longer enforceable. It affirmed the validity of NIUPLAN 2016 as the city’s strategic framework and recognized the 2021 Nairobi Development Control Policy as a guiding tool until it is fully approved and gazetted. Importantly, the Court upheld environmental licenses that had already been granted to developers, noting that there were no legal or procedural flaws in their issuance. Developers therefore have legal certainty to proceed with approved projects without fear of retroactive cancellation or demolition.
The Court further directed Nairobi City County to finalize, approve, and gazette comprehensive zoning and development control instruments within six months, while also requiring the County to submit interim progress reports. This directive signals a shift towards structured and transparent urban planning, which will likely shape the future of development in the city. Each party was also ordered to bear its own costs, recognizing the public interest nature of the case.
Overall, the ruling strengthens investor confidence in Nairobi’s real estate sector, reassures developers on the security of valid approvals, and places pressure on the county government to put in place clear and modern zoning frameworks. For residents, it underscores the importance of engaging in upcoming public participation forums to influence how urban development will be managed going forward.
Some of the notable highlights during the quarter were;
- During the quarter, Knight Frank released its annual report titled Africa Horizons 2025/26, where according to the report 15% of Nairobi’s housing units have shifted to short-term rentals, driving a 10% rent increase over two years as Nairobi residents are now competing with this new demand. Policymakers and various stakeholders face a daunting task of harnessing economic benefits of short-term rentals without worsening the housing crisis. This growth provides property owners with new income streams and travelers with flexible options. However, it also sparks concerns regarding affordability. For more information, please see our Cytonn Monthly July 2025
- During the quarter, The National Social Security Fund (NSSF) is sought to secure a Kshs1.6 bn loan from a local bank to kickstart the first phase of its ambitious Kisumu Lakeview Estate project—a major real estate venture designed to deliver over 1,300 homes and commercial amenities in Kisumu. This marks one of the fund’s largest investments outside Nairobi in more than ten years, reflecting its growing focus on regional development and real estate as a source of long-term returns for pensioners. For more information, please see our Cytonn Monthly August 2025
For more notable developments during Q3’2025 please visit our H1’2025 market review report, Cytonn Monthly_July 2025, and Cytonn Monthly_August 2025
We have a NEUTRAL outlook for the NMA residential sector, we expect continued vibrant performance in the residential sector within the country sustained by; i)ongoing residential developments under the Affordable Housing Agenda, aiming to reduce the housing deficit in the country currently estimated at 80.0%, ii) increased investment from local and international investors in the housing sector, iii) favorable demographics in the country, shown by high population and urbanization rates of 3.8% p.a and 2.0% p.a, respectively, leading to higher demand for housing units. However, challenges such as rising construction costs, strain on infrastructure development, and limited access to financing will continue to restrict the optimal performance of the residential sector.
- Commercial Office Sector
The table below highlights the performance of the Nairobi Metropolitan Area (NMA) Commercial Office sector over time;
|
All figures in Kshs unless stated otherwise |
||||||||
|
Cytonn Report: Nairobi Metropolitan Area (NMA) Commercial Office Returns Over Time |
||||||||
|
Year |
Q1'2024 |
H1'2024 |
Q3'2024 |
FY'2024 |
Q1'2025 |
H1'2025 |
Q3'2025 |
∆ YoY |
|
Occupancy % |
80.1% |
80.1% |
79.1% |
80.7% |
80.3% |
80.5% |
81.8% |
2.7% |
|
Asking Rents (Kshs/SQFT) |
103 |
103 |
102 |
103 |
103 |
103 |
103 |
1.5% |
|
Average Prices (Kshs/SQFT) |
12,665 |
12,677 |
12,856 |
12,614 |
12,614 |
12,891 |
12,926 |
0.5% |
|
Average Rental Yields (%) |
7.6% |
7.7% |
7.5% |
7.8% |
7.6% |
7.7% |
7.8% |
0.4% |
Source: Cytonn Research
The key take-outs from the table include
- Average Asking Rents – In Q3’2025, average asking rents per SQFT in the NMA increased by 2.7% points to Kshs 103 from Kshs 102 in Q3’2024. We attribute this increase to the rise in supply of Grade A offices in the market during the review period. New Grade A offices added to the market during this period between Q3’2024 and Q3’2025, include the Mandrake, purple towers and Atrium, ii) Office uptake by tech, professional services, and co-working operators has supported rent growth, iii) Landlords are adjusting rents upward to cover rising utilities and maintenance costs, iv) Demand is concentrated in modern Grade A buildings in prime nodes, tightening supply and lifting rents iv) Companies have finalized workspace needs post-COVID, creating more stable demand. On q/q basis the asking rents remains unchanged attributable to the stabilization in the Kenyan economy which grew by 4.6% as of Q2’2025 and an increase in high quality office spaces in the market,
- Average Occupancy Rate – In Q3’2025, commercial office occupancy showed an increase of 2.7% points to 81.8% from 79.1% recorded in Q3’2024. This increase can be attributed to the increased demand of office spaces in the market. On a quarter-on-quarter basis, occupancy increased by 1.3% point to 81.8% from 80.5% reflecting increased activities in the segment, in Q3’2025, and,
- Average Rental Yield – The average rental yield increased slightly by 0.4% points to 7.8% in Q3’2025 from 7.5% from Q3’2024. The increase is attributable to the slight increase in the average sale prices per SQFT by 0.5% to Kshs 12,926 from Kshs 12,856. Despite the sales price increase, the yield was supported by an increase in rental prices by 1.5% to Kshs 103 from Kshs 102, and an increase in occupancy levels by 2.7%. On q/q basis, performances, the yield increased by 0.1%
For submarket performance, Westlands emerged as the top performer, achieving an average rental yield of 9.5% in Q3’2025, surpassing the market average of 7.8%. Gigiri and Parklands also performed strongly, with rental yields of 8.6% and 8.5%, respectively. This performance can be attributed to several factors: (i) a high concentration of Grade A offices in these areas, (ii) robust infrastructure developments such as roads like the Nairobi express way and the expanded Waiyaki way (iii) proximity to residential areas making it convenient to customers, (iv) increasing demand for high-quality offices driven by embassies, international organizations, and multinational companies, and (v) availability of after-work amenities like hotels and quality social venues. In contrast, Mombasa Road was the least performing node with an average rental yield of 6.4% in Q3’2025, 1.4% points lower than the market average of 7.8%. This lower performance can be attributed to: i) its reputation as an industrial center, which diminishes its appeal to office businesses aiming to attract clients, ii) the general perception that the area is less ideal for businesses, (iii) intense competition from other neighbourhoods such as the CBD and Upperhill, and (iv) offices of relatively lower quality, which are perceived as less attractive and thus command lower rents, as evidenced by a 72.2% occupancy rate, 7.4% lower than the market average of 79.6%. The table below displays the performance of sub-markets in the Nairobi Metropolitan Area (NMA).
|
All Values in Kshs unless stated otherwise |
|||||||||||
|
Cytonn Report: NMA Commercial Office Submarket Performance Q3'2025 |
|||||||||||
|
Area |
Price/SQFT Q3'25 |
Rent/SQFT Q3'2025 |
Occupancy Q3'2025 |
Rental Yields Q3'2025 |
Price/SQFT Q3'2024 |
Rent/SQFT Q3'2024 |
Occupancy Q3'2024 |
Rental Yields Q3'2024 |
∆ in Rent |
∆ in Occupancy (% points) |
∆ in Rental Yields (% points) |
|
Westlands |
12,510 |
120 |
82.8% |
9.5% |
12,448 |
119 |
76.3% |
8.6% |
0.7% |
6.5% |
0.9% |
|
Gigiri |
15,050 |
131 |
82.4% |
8.6% |
14,850 |
127 |
81.6% |
8.4% |
3.1% |
0.8% |
0.2% |
|
Parklands |
12,018 |
94 |
89.2% |
8.5% |
11,922 |
94 |
83.0% |
7.8% |
0.1% |
6.3% |
0.6% |
|
Karen |
14,077 |
115 |
81.5% |
8.0% |
14,315 |
115 |
80.9% |
7.8% |
0.3% |
0.6% |
0.2% |
|
Nairobi CBD |
12,294 |
92 |
88.8% |
8.0% |
12,206 |
92 |
85.2% |
7.7% |
0.0% |
3.6% |
0.3% |
|
Kilimani |
12,873 |
102 |
83.2% |
7.9% |
13,051 |
102 |
82.7% |
7.8% |
(0.2%) |
0.4% |
0.1% |
|
Upperhill |
12,881 |
104 |
75.6% |
7.0% |
13,014 |
100 |
73.4% |
6.7% |
4.1% |
2.3% |
0.3% |
|
Thika Road |
13,057 |
91 |
80.1% |
6.7% |
12,571 |
88 |
76.6% |
6.3% |
2.5% |
3.5% |
0.4% |
|
Mombasa Road |
11,575 |
82 |
72.7% |
6.4% |
11,325 |
80 |
72.2% |
6.1% |
2.8% |
0.5% |
0.3% |
|
Average |
12,926 |
103 |
81.8% |
7.8% |
12856 |
102 |
79.1% |
7.5% |
1.5% |
2.7% |
0.4% |
Source: Cytonn Research
Notable highlights in Q3’2025 include;
- Within the month, the United Nations highlighted that they will be spending Kshs 43.0 bn on renovation and construction of conference facilities and office blocks in Gigiri. In July, UN revealed that three major UN agencies, including the UN Children’s Fund (UNICEF), the UN Population Fund and UN Women are in the process of moving their headquarters from expensive western cities to Nairobi; For more details, please see our Cytonn weekly #36/2025
The commercial office sector in Nairobi Metropolitan Area (NMA) remains NEUTRAL, impacted by several key dynamics: i) the increasing presence of multinational companies in Kenya is likely to drive up occupancy levels, ii) co-working spaces are gaining in popularity in the region. However, the sector continues to face challenges due to a significant oversupply of office space, currently standing at 5.7 mn SQFT. Despite these challenges, there are attractive investment opportunities in areas such as Westlands, Gigiri, and Kilimani, which offer returns that exceed the market average.
- Retail Sector
The table below shows the performance of the retail sector performance in Nairobi Metropolitan Area from Q1’2024 to Q3’2025;
|
All values in Kshs unless stated otherwise |
||||||||
|
Cytonn Report: Summary of Retail Sector Performance in Nairobi Metropolitan Area Q1’2023 - Q3’2025 |
||||||||
|
Item |
Q1'2024 |
H1'2024 |
Q3'2024 |
FY'2024 |
Q1'2025 |
H1'2025 |
Q3'2025 |
Y/Y 2025 ∆ |
|
Average Asking Rents (Kshs/SQFT) |
180 |
185 |
186 |
182 |
182 |
185 |
189 |
1.7% |
|
Average Occupancy (%) |
79.3% |
79.5% |
81.6% |
82.0% |
81.8% |
83.3% |
84.8% |
3.2% |
|
Average Rental Yields |
8.1% |
8.19% |
8.2% |
8.4% |
8.3% |
8.5% |
8.7% |
0.5% |
Source: Cytonn Research
The key take-outs from the table include;
- Average Occupancy Rate – During Q3’2025, the retail sector experienced a slight increase in average occupancy rates, rising by 3.2 % points to reach 84.8%, up from 81.6% in the same period in 2024. This growth can be attributed to several key factors: i) ongoing expansion by both local and global retailers, such as Naivas, Jaza Stores, QuickMart, Carrefour, China Square, and Panda Mart, ii) the rise of new shopping centers like Business Bay Square (BBS) Mall in Eastleigh, which has drawn a variety of smaller retailers, effectively filling crucial retail spaces, iii) continued demand for consumer products and services, fueled by favorable demographic trends, iv) response to shifting market conditions, with efforts from Jaza Stores and Carrefour enabling online shopping via platforms like WhatsApp to meet changing consumer preferences, v) ongoing infrastructure development, which has both improved existing retail spaces and created new opportunities for retail expansion, broadening the sector's footprint,
- Asking Rents – In Q3’2025, average rental rates per SQFT saw a slight rise, increasing by 1.7% to Kshs 189, up from Kshs 186 in Q3’2024. Several key factors contributed to this slight increase: i) the launch of upscale retail spaces like the Global Trade Centre (GTC) mall and Business Bay Square (BBS) Mall, which commanded premium rents due to their superior facilities and offerings, ii) ongoing demand for high-end retail spaces in prime locations within the Nairobi Metropolitan Area (NMA), including Karen, Kilimani, Westlands, and along Kiambu and Limuru roads. These strategic locations, known for their quality amenities, attracted both local and international businesses aiming to be near multinational corporations and embassies, catering to a global clientele, iii) the entry of prominent international brands like Adidas, Michael Kors, Puma and Aldo into the Kenyan market, increasing competition for top-tier retail spaces and driving up rental prices, and,
- Average Rental Yield- The average rental yield for the NMA retail sector increased by 0.5% points to 8.7% in Q3’2025 from 8.2% recorded in 2024 same period, this increase was attributable to the increase in the average rental prices by 1.7%, increase in the average occupancy rates by 3.2% to 84.8% from 81.6% in Q3’2024, and the increase in average sales price which rose by 1.1% to Kshs 21,616 from Kshs 21,381 in Q3’2024, slower than the rental prices increase and the average occupancy increase,
In terms of sub-market performance, Kilimani, Karen, and Kiambu Road & Limuru Road displayed impressive average rental yields of 9.9%, 9.7%, and 9.7%, respectively, surpassing the overall market average of 8.7%. This strong performance was mainly driven by growing demand for retail services in these key areas, the availability of premium retail spaces commanding higher rents, and the provision of high-quality infrastructure, which increased the appeal for both tenants and customers.
Conversely, retail spaces in the satellite towns reported the lowest average rental yield at 7.6%, influenced by several factors: i) Household incomes in satellite towns are generally lower, suppressing retail spending and hence rental ii) Open-air markets, kiosks, and small local shops dominate in these areas, drawing shoppers away from formal malls, iii Many satellite malls struggle to attract strong anchor tenants, limiting their ability to charge premium rents, iv) Satellite towns attract fewer shoppers compared to Nairobi’s prime retail hubs, reducing tenant sales and willingness to pay higher rents.
The following table illustrates the submarket performance of nodes within the Nairobi Metropolitan Area (NMA) in Q3’2025;
|
(All values in Kshs unless stated otherwise) |
|||||||||||
|
Nairobi Metropolitan Area Retail Market Performance Q3’2025 |
|||||||||||
|
Area |
Prices Kshs /SQFT Q3’2025 |
Rent Kshs /SQFT Q3’2025 |
Occupancy% Q3’2025 |
Rental Yield Q3’2025 |
Prices Kshs /SQFT Q3’2024 |
Rent Kshs /SQFT Q3’2024 |
Occupancy% Q3’2024 |
Rental Yield H1’2024 |
∆ in Rental Rates |
∆ in Occupancy (% points) |
∆ in Rental Yield (% points) |
|
Kilimani |
20,000 |
199 |
83.2% |
9.9% |
20,000 |
198 |
82.2% |
9.8% |
0.5% |
1.0% |
0.1% |
|
Karen |
24,800 |
222 |
92.0% |
9.7% |
23,600 |
218 |
87.5% |
9.7% |
1.6% |
4.5% |
0.1% |
|
Kiambu & Limuru Road |
20,000 |
203 |
79.7% |
9.7% |
20,667 |
201 |
76.3% |
8.9% |
1.1% |
3.3% |
0.8% |
|
Mombasa road |
20,143 |
178 |
86.8% |
9.2% |
19,571 |
169 |
82.9% |
8.6% |
5.7% |
3.9% |
0.6% |
|
Thika Road |
20,124 |
168 |
82.7% |
8.2% |
20,473 |
160 |
79.3% |
6.3% |
4.7% |
3.3% |
1.9% |
|
Ngong Road |
24,263 |
190 |
85.1% |
8.1% |
23,013 |
191 |
86.2% |
8.7% |
(0.3%) |
(1.1%) |
(0.6%) |
|
Westlands |
24,714 |
240 |
83.0% |
7.9% |
25,000 |
239 |
79.4% |
7.1% |
0.2% |
3.6% |
0.8% |
|
Eastlands |
20,500 |
161 |
83.1% |
7.8% |
20,500 |
161 |
78.1% |
7.3% |
0.0% |
5.0% |
0.5% |
|
Satellite towns |
20,000 |
142 |
88.2% |
7.6% |
19,600 |
140 |
82.8% |
7.2% |
1.5% |
5.4% |
0.4% |
|
Average |
21,616 |
189 |
84.8% |
8.7% |
21,381 |
186 |
81.6% |
8.2% |
1.7% |
3.2% |
0.5% |
Source: Cytonn Research
We maintain a NEUTRAL outlook on the retail sector’s performance for 2024, influenced by several factors: i) Continued expansion by local and international retailers, driven by evolving consumer preferences and market trends, ii) Infrastructure improvements, including ongoing road and railway projects, are set to increase accessibility to key retail zones, unlocking further investment opportunities, and iii) Favorable demographic trends, such as a growing urban population, will sustain demand for retail goods and services. However, growth could face challenges from: i) Oversupply issues, with around 3.0 million SQFT of retail space available in Nairobi and an additional 1.7 million SQFT countrywide, leading to low occupancy rates and rental yields, ii) E-commerce adoption, increasingly shifting retail demand online, pushing brick-and-mortar outlets to adapt, and iii) Limited financing options for retail developments, along with high costs, are likely to hinder investment, especially for small and medium-sized enterprises (SMEs) that need to adopt technology to stay competitive
- Hospitality Sector
During Q3’2025, Industry Reports related to the Hospitality sector were released as follows;
|
Cytonn Report: Released Industry Report related to Hospitality Sector Q3’2025 |
||
|
# |
Report |
Key Take-outs |
|
1. |
Leading Economic Indicators (LEI) June 2024 Report by the Kenya National Bureau of Statistics (KNBS) |
· In Q2’2025, international visitor arrivals through Jomo Kenyatta International Airport (JKIA) and Moi International Airport (MIA) rose sharply to 552,108, a 48.8% year-on-year increase from 370,923 in Q2’2024. On a quarter-on-quarter basis, this was an increase of 13.2% from 487,555 in Q1’2025, reflecting sustained momentum in Kenya’s tourism recovery.For more information, please see our Cytonn Monthly August 2025. |
Source; Cytonn Research
We maintain a neutral outlook for the hospitality sector in the coming quarter, supported by several key drivers:i) Aggressive marketing campaigns promoting Kenya’s tourism, expected to boost tourist arrivals and improve occupancy rates at hospitality venues, ii) International recognition of Kenya’s tourism industry, enhancing its status as a leading tourist destination and drawing more global visitors, iii) Strategic partnerships within the tourism sector, fostering innovation and collaboration to capitalize on new opportunities, iv) Events and initiatives aimed at increasing tourism activity and improving guest experiences, and v) Direct flights from Dubai to Mombasa by FlyDubai, expected to enhance accessibility and attract tourists from key markets, vi) Domestic tourism promotion under the Ministry of Tourism Strategy 2021-2025 strategy, prioritizing local tourism growth. However, challenges may arise from:i) Financing difficulties, as stricter lending criteria could limit access to capital for expanding hospitality infrastructure
- Industrial Sector
Notable highlights in the quarter include;
- President William Ruto presided over the ground breaking of Centum Investment Company’s Vipingo Special Economic Zone (SEZ) in Kilifi County, shortly after KCB Bank Kenya and the African Export-Import Bank (Afreximbank) signed a Kshs 103.0 bn financing agreement to support its development. The 2,000-acre project is envisioned as one of the most competitive manufacturing hubs in the region, offering plug-and-play infrastructure, reliable utilities and fiscal incentives designed to attract global and local manufacturers. For more information, please see our Cytonn weekly #37|2025.
We expect that the Kenyan industrial Real Estate sector to continue on an upward trajectory mainly driven by: i)Kenya’s continued recognition as a regional hub, hence attracting both local and international investors, ii) support from the government, as evidenced by the establishment of Special Economic Zones (SEZ) and Export Processing Zones (EPZ), iii) increasing demand for quality warehousing spaces due to continued growth in the E-commerce business in the country iv) the growing establishment of data centers in the country, v) increasing demand for cold storage facilities around Nairobi Metropolitan Area (NMA) driven by consumption by the middle class.
- Infrastructure
Key highlights during Q3’ 2025;
- The Athi River–Machakos dual carriageway was officially completed, marking a major milestone in efforts to ease traffic congestion along the busy Mombasa Road corridor. Spanning 20 kilometers, the road is an extension of the Mombasa Road dual carriageway and was designed to improve safety and reduce traffic delays in the area. The project cost Kshs 6.2 bn and was jointly funded by the World Bank and the Kenyan government, with contributions made on a 60:40 basis. Please see our Cytonn weekly #38/2024.
For more notable highlights during Q3’2025 please see our Cytonn Monthly – August 2025, and Cytonn Monthly –July.
We anticipate that Kenya's infrastructure sector will continue to play a vital role in driving economic growth, supported by the government's commitment to building and rehabilitating key infrastructure such as roads, bridges, railways, and airports. These improvements are expected to enhance the efficient movement of people, goods, and services, which will, in turn, boost demand for real estate properties in remote areas and satellite towns.
- Real Estate Investments Trusts (REITs)
On the Unquoted Securities Platform, Acorn D-REIT and I-REIT traded at Kshs 27.4 and Kshs 23.2 per unit, respectively, as per the last updated data on 26th September 2025. The performance represented a 37.0% and 16.0% gain for the D-REIT and I-REIT, respectively, from the Kshs 20.0 inception price. Additionally, ILAM Fahari I-REIT traded at Kshs 11.0 per share as of 26th September 2025, representing a 45.0% loss from the Kshs 20.0 inception price. The volumes traded for the D-REIT and I-REIT came in at Kshs 12.8 mn and Kshs 39.8 mn shares, respectively, with a turnover of Kshs 323.5 mn and Kshs 791.5 mn, respectively, since inception in February 2021. Additionally, ILAM Fahari I-REIT traded at Kshs 11.0 per share as of 19thSeptember 2025, representing a 45.0% loss from the Kshs 20.0 inception price. The volume traded to date came in at 1,235,285 shares for the I-REIT, with a turnover of Kshs 1.5 mn since inception in November 2015.
REITs offer various benefits, such as tax exemptions, diversified portfolios, and stable long-term profits. However, the ongoing decline in the performance of Kenyan REITs and the restructuring of their business portfolios are hindering significant previous investments. Additional general challenges include:
- Insufficient understanding of the investment instrument among investors leading to a slower uptake of REIT products,
- Lengthy approval processes for REIT creation,
- High minimum capital requirements of Kshs 100.0 mn for REIT trustees compared to Kshs 10.0 mn for pension funds Trustees, essentially limiting the licensed REIT Trustee to banks only
- The rigidity of choice between either a D-REIT or and I-REIT forces managers to form two REITs, rather than having one Hybrid REIT that can allocate between development and income earning properties
- Limiting the type of legal entity that can form a REIT to only a trust company, as opposed to allowing other entities such as partnerships, and companies,
- We need to give time before REITS are required to list – they would be allowed to stay private for a few years before the requirement to list given that not all companies may be comfortable with listing on day one, and,
- Minimum subscription amounts or offer parcels set at Kshs 0.1 mn for D-REITs and Kshs 5.0 mn for restricted I-REITs. The significant capital requirements still make REITs relatively inaccessible to smaller retail investors compared to other investment vehicles like unit trusts or government bonds, all of which continue to limit the performance of Kenyan REITs.
Real Estate Performance Summary and Outlook
Below is a summary of the sectorial performance in Q3’2025 and investment opportunities:
|
Theme |
Cytonn Report: Thematic Performance and Outlook Q3’2025 |
Outlook |
|
Residential |
· The average total returns to apartments’ investors came in at 8.2%, recording a 1.7%-points increase from the 6.5% recorded during Q3’2024 |
Neutral |
|
· Our outlook for the NMA residential sector remains NEUTRAL, as we foresee increased activity from in the industry supported by: ; i)ongoing residential developments under the Affordable Housing Agenda, aiming to reduce the housing deficit in the country currently estimated at 80.0%, ii) increased investment from local and international investors in the housing sector, iii) favorable demographics in the country, shown by high population and urbanization rates of 3.7% p.a and 2.0% p.a, respectively, leading to higher demand for housing units. However, challenges such as rising construction costs, strain on infrastructure development, and limited access to financing will continue to restrict the optimal performance of the residential sector. |
||
|
Commercial Office |
· The average rental yield increased slightly by 0.4% points to 7.8% in Q3’2025 from 7.5% from Q3’2024. The increase is attributable to the slight increase in the average sale prices per SQFT by 0.5% to Kshs 12,926 from Kshs 12,856. Despite the sales price increase, the yield was supported by an increase in rental prices by 1.5% to Kshs 103 from Kshs 102, and an increase in occupancy levels by 2.7%. On q/q basis, performances, the yield increased by 0.1% point
|
Neutral |
|
· The commercial office sector in Nairobi Metropolitan Area (NMA) remains NEUTRAL, impacted by several key dynamics: i) the increasing presence of multinational companies in Kenya is likely to drive up occupancy levels, ii) co-working spaces are gaining in popularity in the region. However, the sector continues to face challenges due to a significant oversupply of office space, currently standing at 5.7 million square feet. Despite these challenges, there are attractive investment opportunities in areas such as Westlands, Gigiri, and Kilimani, which offer returns that exceed the market average. |
||
|
Retail |
· The average rental yield for the NMA retail sector increased by 0.5% points to 8.7% in Q3’2025 from 8.2% recorded in 2024 same period, this increase was attributable to the increase in the average rental prices by 1.7%, increase in the average occupancy rates by 3.2% to 84.8% from 81.6% in Q3’2024, and the increase in average sales price which rose by 1.1% to Kshs 21,616 from Kshs 21,381 in Q3’2024, slower than the rental prices increase and the average occupancy increase, |
Neutral |
|
· We maintain a neutral outlook on the retail sector’s performance for 2025, influenced by several factors: i) Continued expansion by local and international retailers, driven by evolving consumer preferences and market trends, ii) Infrastructure improvements, including ongoing road and railway projects, are set to increase accessibility to key retail zones, unlocking further investment opportunities, and iii) Favorable demographic trends, such as a growing urban population, will sustain demand for retail goods and services. However, growth could face challenges from: i) Oversupply issues, with around 3.0 million SQFT of retail space available in Nairobi and an additional 1.7 million SQFT countrywide, leading to low occupancy rates and rental yields, ii) E-commerce adoption, increasingly shifting retail demand online, pushing brick-and-mortar outlets to adapt, and iii) Limited financing options for retail developments, along with high costs, are likely to hinder investment, especially for small and medium-sized enterprises (SMEs) that need to adopt technology to stay competitive. · In terms of the sub markets performance, investment opportunity lies in Kilimani, Karen, and Kiambu Road & Limuru Road, which offer higher returns compared to the market average. |
||
|
Hospitality |
· We maintain a neutral outlook for the hospitality sector in the coming quarter, supported by several key drivers:i) Aggressive marketing campaigns promoting Kenya’s tourism, expected to boost tourist arrivals and improve occupancy rates at hospitality venues, ii) International recognition of Kenya’s tourism industry, enhancing its status as a leading tourist destination and drawing more global visitors, iii) Strategic partnerships within the tourism sector, fostering innovation and collaboration to capitalize on new opportunities, iv) Events and initiatives aimed at increasing tourism activity and improving guest experiences, and v) Direct flights from Dubai to Mombasa by FlyDubai, expected to enhance accessibility and attract tourists from key markets, vi) Domestic tourism promotion under the Ministry of Tourism Strategy 2021-2025 strategy, prioritizing local tourism growth. However, challenges may arise from:i) Financing difficulties, as stricter lending criteria could limit access to capital for expanding hospitality infrastructure.
|
Neutral |
|
Land |
· We maintain a positive outlook for the land sector in the Nairobi Metropolitan Area (NMA), considering it a dependable investment opportunity. We expect the sector's performance to be driven by several factors; such as demand for land driven by positive demographics, government efforts to streamline land transactions through innovative solutions such as Ardhi Sasa, active participation by players in the land selling and buying segment, the launch of infrastructure development projects opening up satellite towns, and, government involvement in the Affordable Housing Program (AHP). |
Positive |
We expect Kenya’s Real Estate sector to remain on a growth trend, supported by: i) demand for housing sustained by positive demographics, such as urbanization and population growth rates of 3.8% p.a and 2.0% p.a, respectively, against the global average of 1.7% p.a and 0.9% p.a, respectively, as at 2023,, ii) activities by the government under the Affordable Housing Program (AHP) iii) heightened activities by private players in the residential sector iv) increased investment by local and international investors in the hospitality and industrial sector,v) improved infrastructure throughout the country. However, challenges such as rising construction costs, strain on infrastructure development (including drainage systems), high capital requirements for REITs, and existing oversupply in select Real Estate sectors will continue to hinder the sector’s optimal performance by limiting developments and investments.
Disclaimer: The views expressed in this publication are those of the writers where particulars are not warranted. This publication, which is in compliance with Section 2 of the Capital Markets Authority Act Cap 485A, is meant for general information only and is not a warranty, representation, advice or solicitation of any nature. Readers are advised in all circumstances to seek the advice of a registered investment advisor.

- Talk to us
- Kenya
- P.O Box 20695 - 00200, Nairobi, Kenya
- Cell +254709101200
- Tel +254709101200
- WhatsApp +254741676635
- United States
- +254709101200
- DOWNLOAD OUR APP
-


- Kenya
- 8th Floor, Pinetree Plaza, Kaburu Drive, Ngong Road, Nairobi, Kenya
- USA
- Suite 1150, 1775 Eye Street NW, USA, Washington DC 20006, USA
- Investments
- High Yield
- Private Equity
- Real Estate
- Real Estate
- RiverRun Estates
- Cytonn Towers
- The Ridge
- Taraji Heights
- The Alma