Alternative Financing for Real Estate Development, & Cytonn Weekly #33/2019
By Cytonn Investments, Aug 18, 2019
Executive Summary
Fixed Income
T-bills were undersubscribed during the week, with the overall subscription rate decreasing to 86.8% from 122.8% recorded the previous week. The underperformance is attributable to the focus on the Treasury bond, which recorded a 134.9% performance as it received bids totalling Kshs 67.4 bn, against an advertised amount of Kshs 50.0 bn. During the week, the Energy and Petroleum Regulatory Authority (EPRA) circulated the maximum retail pump prices of petroleum products, effective from 15th August 2019 to 14th September 2019, with petrol and diesel prices declining by 2.5% and 3.2% to Kshs 112.5 a litre and Kshs 100.6 a litre, respectively, while kerosene prices increased by 1.9% to Kshs 103.95 a litre;
Equities
During the week, the equities market recorded mixed performance with NASI and NSE 25 gaining 2.3% and 0.7%, respectively, while NSE 20 declined by 0.1%, taking their YTD performance to gains/(losses) of 7.7%, (10.4%) and 1.3%, for NASI, NSE 20 and NSE 25, respectively. During the week, KCB Group released their H1’2019 financial results, recording core earnings per share growth of 5.0% of Kshs 4.1, from Kshs 4.0 in H1’2018;
Private Equity
Juhudi Kilimo, a Kenyan microfinance institution, has raised EUR 2.2 mn (Kshs 252.2 mn) in equity capital from Incofin CVSO, a fund managed by Belgium-based Incofin Investment Management, for an undisclosed stake. TechAdvance, a Nigerian payment application development company, raised USD 1.0 mn (Kshs 103.5) mn in equity funding from Lamar Holding, an energy investment company based in Bahrain.
Real Estate
During the week, Kenya Bankers Association (KBA) published the KBA Housing Price Index Q2’2019. According to the report, apartments continue to dominate the housing market, supported by their affordability. The Capital Markets Authority of Kenya approved the issuance of a green bond by Acorn, a Kenya-based property developer, in partnership with Helios, a UK-based Private Equity firm, and the funds are set to be used for the construction of university hostel units in Nairobi;
Focus of the Week
Kenya’s Real Estate sector has been one of the fastest-growing sectors of the economy over the last 5 years. Recently, the sector has experienced a slower rate of growth, which can be partly attributed to the shortage of funding in the real estate sector. In the past, there has been reliance on debt and presales by developers. The slow uptake of real estate units has reduced the presales capital available for developers to plough back into the project, while the cap on interest rates in the banking sector has led to banks reducing funding to the real estate sector, owing to the perceived higher risks. In this regard, we seek to dissect the real estate sector in Kenya, particularly on the funding side, and how industry players can find alternative ways of accessing capital.
- Cytonn Money Market Fund closed the week at an average yield of 11.0% p.a. To subscribe, just dial *809#
- Edwin Dande, Chief Executive Officer, was on NTV to discuss the status of housing in the country. Watch Edwin here;
- Cytonn Investments held a client interaction cocktail event at CySuites, our serviced apartment brand that is soon being launched. Read the event note here;
- Phase 1 of The Alma is now 100% sold with early buyers having achieved over 55% capital appreciation. We are now running a promotion in Phase 2: Buy a unit in Phase 2 with a 15-year payment plan and 0% deposit. For inquiries, please email us on clientservices@cytonn.com. The site is open between 8 am - 5 pm, 7-days a week for site visits;
- For an exclusive tour of Cytonn’s real estate developments, visit: Sharp Investor’s Tour and for more information, email us at sales@cytonn.com;
- Following the completion and handover of Amara Ridge in Karen, we have now launched our next Karen project, dubbed Applewood, a Kshs 2.5 bn residential development located in Miotoni, Karen. This signature development shall comprise luxury homes, each sitting on 1/2 acre. We invite you to the exhibition of Applewood which is ongoing at the Amara Ridge Clubhouse (Location pin: https://goo.gl/maps/B3GVnu8pHyn) or at the Applewood Sales Centre on Miotoni Road (Location pin: https://goo.gl/maps/ZfABuGjFo1z) from 9:00 am to 5:00 pm daily. Call 0709 101 000 or email resales@cytonn.com to reserve a villa! See Video here;
- We continue to hold weekly workshops and site visits on how to build wealth through real estate investments. The weekly workshops and site visits target both investors looking to invest in real estate directly and those interested in high yield investment products to familiarize themselves with how we support our high yields. Watch progress videos and pictures of The Alma, Amara Ridge, and The Ridge;
- We continue to see very strong interest in our weekly Private Wealth Management Training (largely covering financial planning and structured products). The training is at no cost and is open only to pre-screened participants. We also continue to see institutions and investment groups interested in the training for their teams. Cytonn Foundation, under its financial literacy pillar, runs the Wealth Management Training. If interested in our Private Wealth Management Training for your employees or investment group, please get in touch with us through wmt@cytonn.com. To view the Wealth Management Training topics, click here;
- For recent news about the company, see our news section here;
- We have 10 investment-ready projects, offering attractive development and buyer targeted returns. See further details here: Summary of Investment-Ready Projects.
Money Markets, T-Bills & T-Bonds Primary Auction:
T-bills were undersubscribed during the week, with the overall subscription rate decreasing to 86.8%, from 122.8% recorded the previous week. The underperformance is attributable to the focus on the 2 bonds on offer for the month of August in the primary market, which closed during the week. The yields on the 91-day paper and 364-day paper remained unchanged at 6.4% and 9.2%, respectively, while the 182-day paper yield fell by 0.1% points to 7.1% from 7.2% recorded the previous week. The acceptance rate for all treasury bills bid increased to 99.6%, from 90.3% the previous week, with the government accepting Kshs 20.76 bn of the Kshs 20.84 bn worth of bids received, lower than the weekly quantum of Kshs 24.0 bn. The 91-day, 182-day and 364-day papers recorded a downturn in subscription to 68.8%, 29.4% and 151.5% from 103.7%, 63.9% and 189.5% recorded the previous week, respectively.
For the month of August, the Kenyan Government issued a 10-year bond (FXD 3/2019/10) and re-opened a 20-year bond (FXD 1/2019/20) for a total of Kshs 50.0 bn for budgetary support. The accepted yields for the issue came in at 11.6% and 12.7% for the (FXD 3/2019/10) and (FXD 1/2019/20), respectively, in line with our expectations as highlighted in last week’s bidding ranges of 11.5% - 11.7% and 12.6% - 12.8%, for the (FXD 3/2019/10) and (FXD 1/2019/20), respectively. The issue was oversubscribed with the subscription rate at 134.9%, having received Kshs 67.4 bn worth of bids against the advertised amount of Kshs 50.0 bn, with the market biased towards the 10-year bond that had bids amounting to Kshs 52.8 bn, mainly driven by the perception that risks may not be adequately priced on the longer end of the yield curve, which is relatively flat due to a narrowing spread between the short-term and long-term interest rates.
In the money markets, 3-month bank placements remained unchanged compared to last week, ending the week at 8.6% (based on what we have been offered by various banks), the 91-day T-bill was also unchanged, ending the week at 6.4%, while the average of Top 5 Money Market Funds came in at 9.6% compared to 10.1% last week, with the Cytonn Money Market Fund closing the week at 11.1% compared to 11.0% last week.
Liquidity:
Liquidity in the market tightened during the week, with the average interbank rate rising to 3.7% from 3.3% recorded the previous week due to banks trading cautiously in the interbank market in order to meet the 5.25% cash reserve requirements (CRR) as the monthly CRR cycle ended this week on 14th August. Commercial banks’ excess reserves stood at Kshs 9.2 bn in relation to the 5.25% cash reserves requirement (CRR). The average volumes traded in the interbank market rose by 18.4% to Kshs 7.9 bn, from Kshs 6.6 bn the previous week.
Kenya Eurobonds:
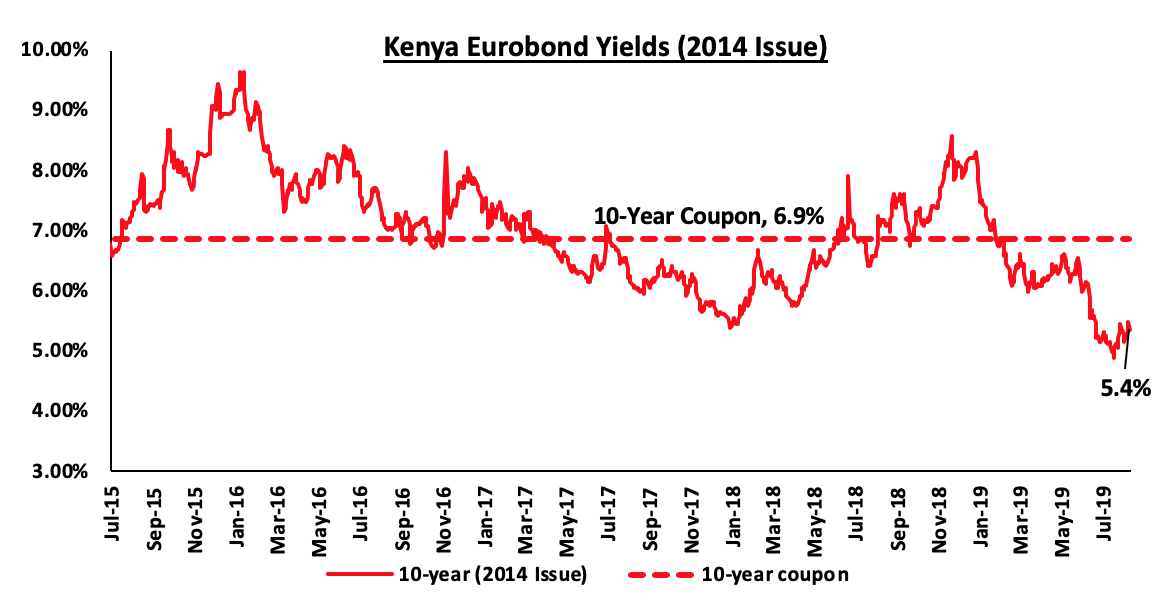
The yield on the 10-year Eurobond issued in 2014 rose by 0.3% points to 5.4%, from 5.1% recorded the previous week.
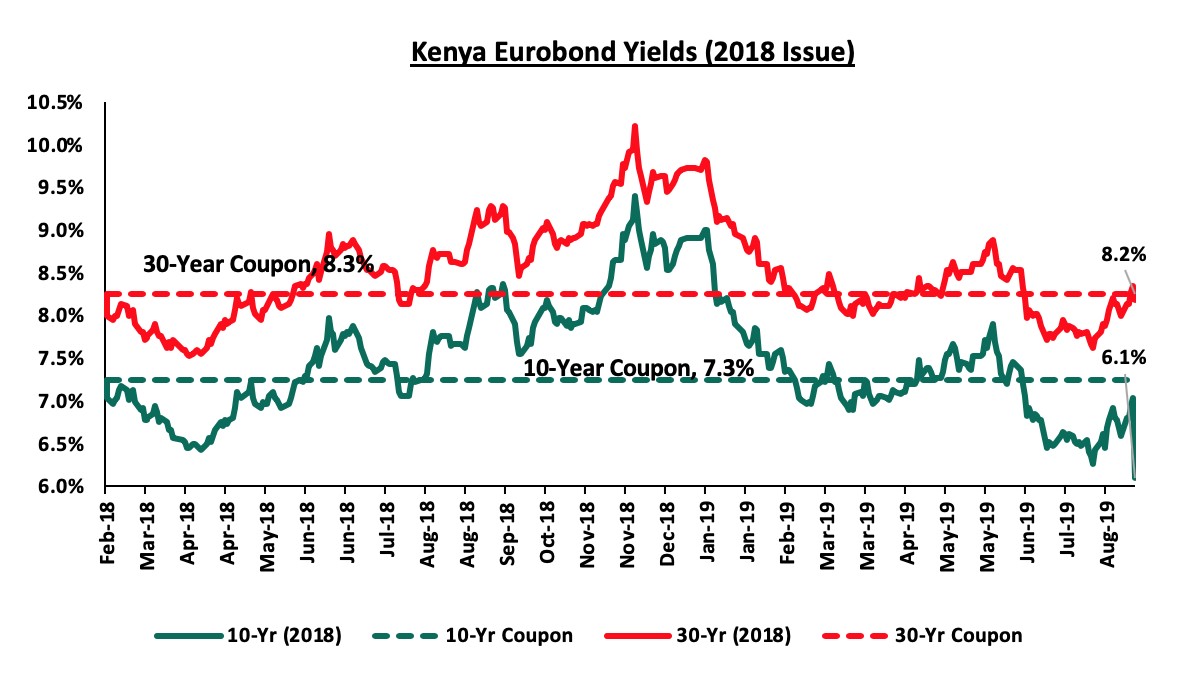
For the February 2018 Eurobond issue, yields on the 10-year Eurobond dropped by 0.5% points to 6.1% from 6.6% while those of the 30-year Eurobond rose by 0.2% points to 8.2%, from 8.0% recorded the previous week, respectively.
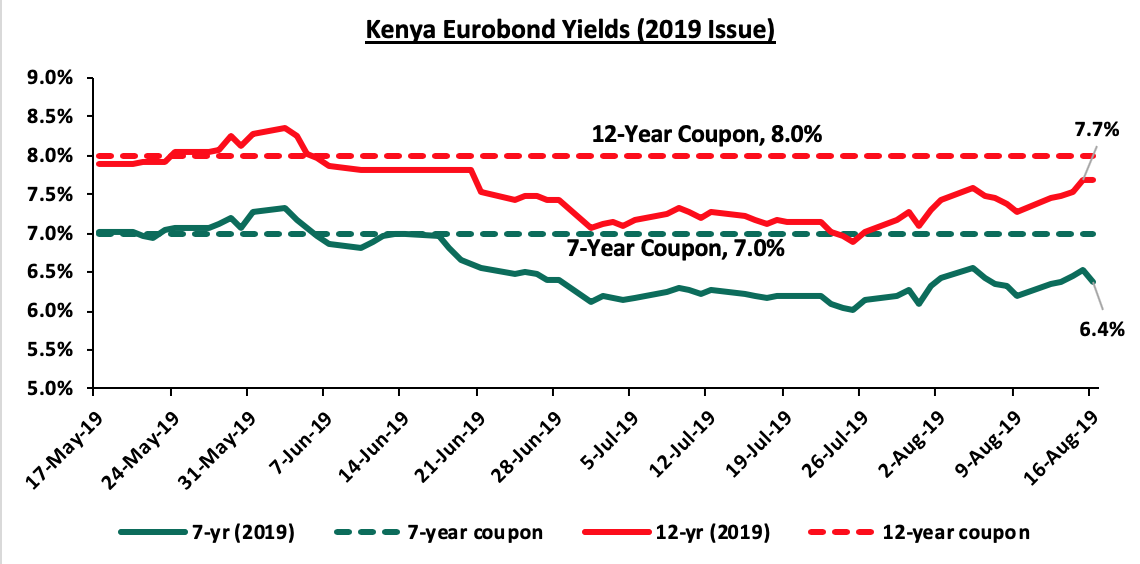
For the newly issued dual-tranche Eurobond with 7-years and 12-years tenors, priced at 7.0% for the 7-year tenor and 8.0% for the 12-year tenor, respectively, the yields on the 7-year bond and the 12-year bond rose by 0.2% and 0.4% points to 6.4% and 7.7% from 6.2% and 7.3% recorded the previous week, respectively.
The Kenya Shilling:
During the week, the Kenya Shilling appreciated marginally against the US Dollar to close at Kshs 103.3, from Kshs 103.4 recorded the previous week, supported by inflows from offshore investors buying government debt amid tight liquidity in the local money market. The Kenya Shilling has depreciated by 1.5% year to date, in comparison to the 1.3% appreciation in 2018. Despite the recent depreciation, we still expect the shilling to remain relatively stable to the dollar in the short term, supported by:
- The narrowing of the current account deficit, with preliminary data indicating that the current account deficit narrowed to 4.2% of GDP in the 12-months to June 2019, from 5.4% recorded in June 2018. The decline has been attributed to the resilient performance of exports particularly horticulture and coffee, strong diaspora remittances, and higher receipts from tourism and transport services. Growth of imports also slowed mainly due to lower imports of food,
- Improving diaspora remittances, which have increased cumulatively by 13.6% in the 12-months to June 2019 to USD 2.8 bn, from USD 2.4 bn recorded in a similar period of review in 2018. The rise is due to:
- Increased uptake of financial products by the diaspora due to financial services firms, particularly banks, targeting the diaspora, and,
- New partnerships between international money remittance providers and local commercial banks making the process more convenient,
- CBK’s supportive activities in the money market, such as repurchase agreements and selling of dollars, and,
- High levels of forex reserves, currently at USD 9.4 bn (equivalent to 5.9-months of import cover), above the statutory requirement of maintaining at least 4.0-months of import cover, and the EAC region’s convergence criteria of 4.5-months of import cover.
Weekly Highlights
The Energy and Petroleum Regulatory Authority released their monthly statement on the maximum retail fuel prices in Kenya effective from 15th August 2019 to 14th September 2019. Below are the key take-outs from the statement:
- Petrol prices have declined by 2.5% to Kshs 112.5 from Kshs 115.4 per litre previously, while diesel prices have declined by 3.2% to Kshs 100.6 from Kshs 103.9, previously,
- Kerosene prices however increased by 1.9% to Kshs 103.95 from Kshs 101.97 per litre
The changes in prices are attributable to:
- A decrease in the average landing cost of imported super petrol by 5.6% to USD 498.5 per cubic metre in July 2019, from 528.3 per cubic metre in June 2019,
- A decrease in the average landing costs of imported diesel by 7.1% to USD 482.5 per cubic metre in July 2019, from 519.4 per cubic metre in June 2019, and Kerosene decreasing by 0.4% to USD 532.9 per cubic metre in May 2019, from 535.2 per cubic metre in April 2019, and,
- The Free on Board (FOB) price of Murban crude oil lifted in July 2019 posted an increase by 2.1% to USD 66.2 from USD 64.8, per barrel in June 2019,
We expect a decline in the transport index, which carries a weighting of 8.7% in the total consumer price index (CPI), due to the decreased petrol and diesel pump prices. Consequently, the decline in the transport index will ease inflationary pressures.
Rates in the fixed income market have remained relatively stable as the government rejects expensive bids. A budget deficit is likely to result from depressed revenue collection with the revenue target for FY’2019/2020 at Kshs 2.1 tn, creating uncertainty in the interest rate environment as additional borrowing from the domestic market goes to plug the deficit. Despite this, we do not expect upward pressure on interest rates due to increased demand for government securities, driven by improved liquidity in the market owing to the relatively high debt maturities. Our view is that investors should be biased towards medium-term fixed income instruments to reduce duration risk associated with long-term debt, coupled with the relatively flat yield curve on the long-end due to saturation of long-term bonds.
Market Performance
During the week, the equities market recorded mixed performance with NASI and NSE 25 gaining 2.3% and 0.7%, respectively, while NSE 20 declined by 0.1%, taking their YTD performance to gains/losses of 7.7%, (10.4%) and 1.3%, for NASI, NSE 20 and NSE 25, respectively. The performance in NASI was driven by gains in Diamond Trust Bank and Safaricom, which gained 6.3% and 6.1%, respectively. The gains were however weighed down by declines in Equity Group, NIC Group, EABL and Co-operative Bank, which declined by 3.2%, 2.8%, 2.2%, and 1.7%, respectively.
Equities turnover increased by 259.1% during the week to USD 25.8 mn, from USD 7.2 mn the previous week, taking the YTD turnover to USD 915.8 mn. Foreign investors remained net buyers for the week, with a net buying position of USD 0.02 mn, from a net selling position of USD 1.8 mn the previous week.
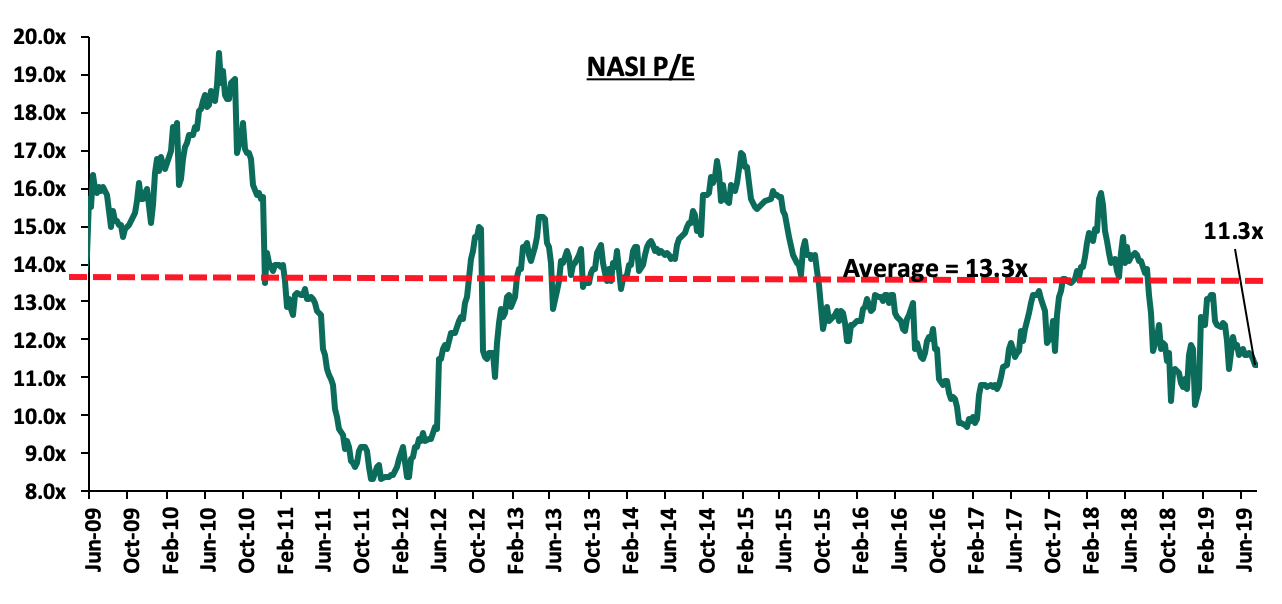
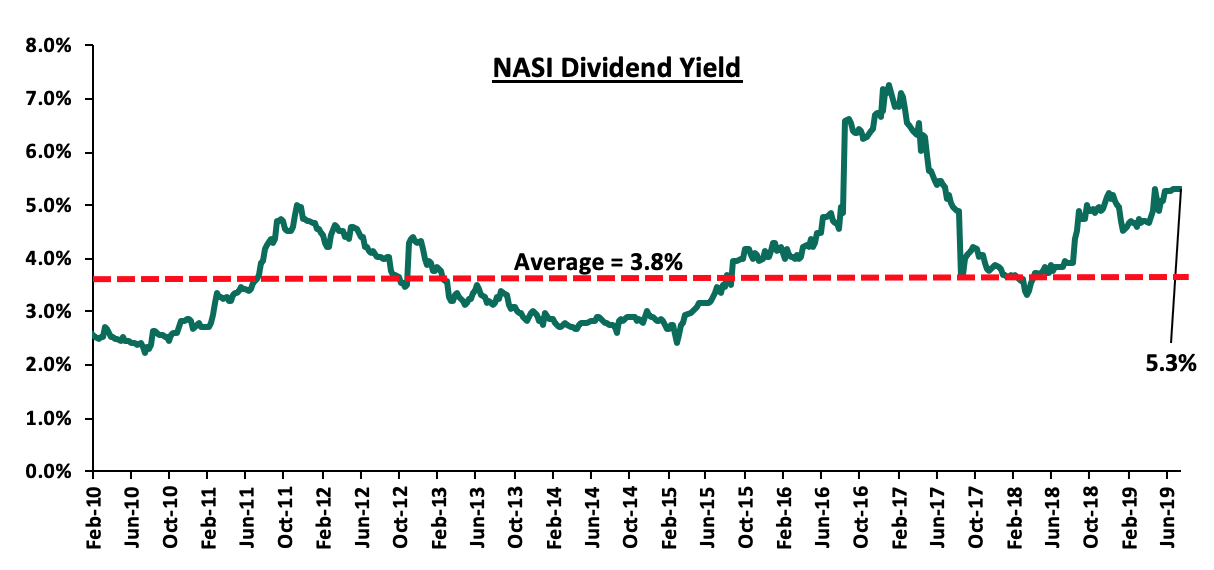
The market is currently trading at a price to earnings ratio (P/E) of 11.3x, 15.0% below the historical average of 13.3x, and a dividend yield of 5.3%, 1.5% points above the historical average of 3.8%. With the market trading at valuations below the historical average, we believe there is value in the market. The current P/E valuation of 11.3x is 16.5% above the most recent trough valuation of 9.7x experienced in the first week of February 2017, and 36.1% above the previous trough valuation of 8.3x experienced in December 2011. The charts below indicate the historical P/E and dividend yields of the market.
Earnings Releases
KCB Group released their H1’2019 financial results, recording a 5.0% increase in core earnings per share to Kshs 4.1 from Kshs 4.0 in H1’2018, in line with our expectations. The performance was driven by an 8.3% increase in total operating income to Kshs 38.6 bn, from Kshs 35.6 bn in H1’2018. Highlights of the performance from H1’2018 to H1’2019 include:
- Total operating income increased by 8.3% to Kshs 38.6 bn, from Kshs 35.6 bn in H1’2018. This was driven by a 14.7% increase in Non-Funded Income (NFI) to Kshs 13.2 bn, from Kshs 11.5 bn in H1’2018, coupled with a 5.2% increase in Net Interest Income (NII) to Kshs 25.4 bn, from Kshs 24.1 bn in H1’2018,
- Interest income increased by 4.3% to Kshs 33.6 bn, from Kshs 32.2 bn in H1’2018. This was driven by a 4.5% growth in interest income on loans and advances to Kshs 26.8 bn, from Kshs 25.6 bn in H1’2018, and a 3.5% increase in interest income from government securities to Kshs 6.6 bn, from Kshs 6.3 bn in H1’2018. The yield on interest-earning assets however declined to 11.1% from 11.4% in H1’2018, attributed to a decline in yields on government securities as well as a decline in lending rates due to the 100 bps CBR cuts last year to 9.0%, which saw interest income growing by only 4.3% despite interest earning assets growing by 8.1%,
- Interest expenses rose by 1.6% to Kshs 8.2 bn, from Kshs 8.1 bn in H1’2018, following a 26.8% rise in interest expense on deposits and placement from banking institutions to Kshs 960.9 mn from Kshs 757.8 mn in H1’2018. The rise however was weighed down by a 1.0% decline in interest expense on customer deposits to Kshs 7.2 bn, from Kshs 7.3 bn. The cost of funds however remained unchanged at 3.0%. The Net Interest Margin (NIM) thus declined to 8.2%, from 8.6% in H1’2018,
- Non-Funded Income (NFI) increased by 14.7% to Kshs 13.2 bn, from Kshs 11.5 bn in H1’2018. The increase was mainly driven by a 51.5% rise in total fees and commissions’ income to Kshs 4.7 bn, from Kshs 3.1 bn in H1’2018, which rose as the bank registered acceleration in loan disbursements. The growth was however weighed down by the 27.0% decline in forex trading income to Kshs 2.1 bn, from Kshs 2.8 bn in H1’2018. As a result, the revenue mix shifted to 66:34 from 68:32 funded to non-funded income, due to the faster growth in NFI compared to NII,
- Total operating expenses increased by 11.4% to Kshs 20.6 bn, from Kshs 18.5 bn, largely driven by a 266.2% rise in Loan Loss Provisions (LLP) to Kshs 3.0 bn in H1’2019, from Kshs 827.7 mn in H1’2018, coupled with a 4.6% rise in staff costs to Kshs 9.0 bn in H1’2019, from Kshs 8.6 bn in H1’2018,
- Due to the faster growth of total operating expenses that outpaced the growth in operating income, Cost to Income Ratio (CIR) deteriorated to 53.5%, from 52.0% in H1’2018. Without LLP however, the cost to income ratio improved to 45.7%, from 49.7% in H1’2018, highlighting the increase in cost of risk to 7.9%, from 2.3% in a similar period in 2018 and,
- Profit before tax increased by 4.9% to Kshs 17.9 bn, up from Kshs 17.1 bn in H1’2018. Profit after tax grew by 5.0% to Kshs 12.7 bn in H1’2019, from Kshs 12.1 bn in H1’2018. The effective tax rate increased by 0.9% point to 33.2%, from 32.3% in H1’2018, with deferred tax also posting an increase by 36.1% to Kshs 0.7 bn, from Kshs 0.5 bn recorded in H1’2018.
- The bank declared an interim dividend of Kshs 1.0 per share, which will be paid in November 2019. Assuming a final dividend payout of Kshs 2.5 the dividend yield translates to 8.8% at the current price of Kshs 39.8.
Balance Sheet
- The balance sheet recorded an expansion as total assets increased by 11.8% to Kshs 746.5 bn, from Kshs 667.7 bn in H1’2018. This growth was largely driven by a 20.3% increase in investments in government and other securities to Kshs 132.9 bn, from Kshs 110.5 bn in H1’2018, coupled with a 13.6% increase in the loan book to Kshs 478.7 bn, from Kshs 421.5 bn in H1’2018,
- Total liabilities rose by 10.6% to Kshs 629.0 bn, from Kshs 568.7 bn in H1’2018, driven by a 7.3% increase in deposits to Kshs 563.2 bn, from Kshs 524.9 bn in H1’2018. Deposits per branch increased by 9.4% to Kshs 2.2 bn from Kshs 2.0 bn in H1’2018, with the number of branches reducing to 258 from 263 in H1’2018,
- The faster growth in loans as compared to deposits led to a rise in the loan to deposit ratio to 85.0% from 80.3% in H1’2018,
- Gross Non-Performing Loans (NPLs) rose by 3.9% to Kshs 39.1 bn in H1’2019, from Kshs 37.6 bn in H1’2018. The NPL ratio however, improved to 7.8% from 8.4% in H1’2018 due to the faster growth in loans which outpaced the growth in NPLs. General Loan Loss Provisions (LLP) declined by 17.0% to Kshs 16.1 bn, from Kshs 19.4 bn in H1’2018. The NPL coverage consequently declined to 52.7%, from 63.6% in H1’2018,
- Shareholders’ funds increased by 18.7% to Kshs 117.5 bn in H1’2019, from Kshs 99.0 bn in H1’2018, as retained earnings grew by 35.7% y/y to Kshs 94.8 bn, from Kshs 69.9 bn in H1’2018,
- KCB Group is currently sufficiently capitalized with a core capital to risk-weighted assets ratio of 18.0%, 7.5% points above the statutory requirement of 10.5%. In addition, the total capital to risk-weighted assets ratio was 19.4%, exceeding the statutory requirement of 14.5% by 4.9% points. Adjusting for IFRS 9, the core capital to risk weighted assets stood at 18.6%, while total capital to risk-weighted assets came in at 20.1%, and,
- The bank currently has a Return on Average Assets (ROaA) of 3.5%, and a Return on Average Equity (ROaE) of 22.7%.
Key Take-Outs:
- The bank’s asset quality improved, with the NPL ratio improving to 7.8%, from 8.4% in H1’2018. The improved NPL ratio was mainly attributed to an improvement in the corporate loan book’s NPL ratio to 9.5% in H1’2019, from in 11.6% in H1’2018, as well as the SME and Micro loan book, which improved to 14.1% in H1’2019, down from 15.2% in H1’2018, respectively,
- There was an improvement in operational efficiency as evidenced by the decline in the Cost to Income Ratio (CIR) without LLP to 45.7% in H1’2019, from 49.7% in H1’2018. This has mainly been driven by increased innovation and digitization as seen with 96.0% of total transactions performed outside the branch comprising of 78.0% on mobile, 14.0% on agency, internet and POS and 4.0% on the ATM, which has facilitated the faster growth of transactional income outpacing the growth in operating expenses. This has also seen a 131.0% growth in non-branch revenue to over Kshs 5.2 bn, and,
- Non-Funded Income (NFI) increased by 14.7% to Kshs 13.2 bn, from Kshs 11.5 bn in H1’2018. As a result, the revenue mix shifted to 66:34 from 68:32 funded to non-funded income, due to the faster growth in NFI compared to NII. The average NFI growth for the listed Banks that have released their H1’2019 results currently stands at 16.8%.
For more information, please see our KCB Group Earnings Note
The table below summarizes the performance of listed banks that have released their H1’2019 results
|
Bank |
Core EPS Growth |
Interest Income Growth |
Interest Expense Growth |
Net Interest Income Growth |
Net Interest Margin |
Non-Funded Income Growth |
NFI to Total Operating Income |
Growth in Total Fees & Commissions |
Deposit Growth |
Growth in Government Securities |
Loan to Deposit Ratio |
Loan Growth |
Return on Average Equity |
|
Stanbic Holdings |
14.4% |
10.5% |
5.2% |
19.5% |
5.1% |
10.1% |
47.8% |
53.2% |
10.3% |
8.1% |
74.4% |
15.0% |
15.3% |
|
Equity Group |
9.1% |
9.2% |
14.3% |
7.6% |
8.5% |
25.6% |
44.0% |
16.1% |
16.5% |
13.0% |
70.0% |
16.7% |
22.1% |
|
KCB Group |
5.0% |
4.3% |
1.6% |
5.2% |
8.2% |
14.7% |
34.1% |
3.5% |
7.3% |
20.3% |
85.0% |
13.6% |
22.7% |
|
H1'2019 Mkt Weighted Average |
9.5% |
8.0% |
7.0% |
10.8% |
7.3% |
16.8% |
42.0% |
24.3% |
11.4% |
13.8% |
76.5% |
15.1% |
20.0% |
|
H1'2018 Mkt Weighted Average |
19.0% |
7.9% |
12.0% |
6.4% |
8.1% |
6.9% |
34.3% |
4.6% |
10.0% |
14.9% |
73.8% |
3.8% |
19.5% |
|
*Market cap weighted as at 16/08/2019 **Market cap weighted as at 31/08/2018 |
|||||||||||||
Key takeaways from the table above include:
- The three listed Kenyan banks that have released recorded a 9.5% average increase in core Earnings Per Share (EPS), compared to an increase of 19.0% in H1’2018, and consequently, the Return on Average Equity (RoAE) increased to 20.0%, from 19.5% in H1’2018,
- The sector recorded weaker deposit growth, which came in at 13.8%, slower than the 14.9% growth recorded in H1’2018. Interest expenses also increased at a slower pace of 7.0%, compared to 12.0% in H1’2018, indicating banks have been able to mobilize relatively cheaper deposits,
- Average loan growth came in at 15.1%, which was faster than the 3.8% recorded in H1’2018, indicating that there was an improvement in credit extension to the economy. Government securities on the other hand recorded a growth of 13.8% y/y, which was slower compared to the loans, and also a decline from the 14.9% recorded in H1’2018. This highlights banks’ adjustment of their business models back to private sector lending as opposed to investing in government securities, which offer better risk-adjusted returns. Interest income increased by 8.0%, compared to a similar increase of 7.9% recorded in H1’2018, as increased allocations to loans bore fruit. The Net Interest Income (NII) thus grew by 10.8% compared to a growth of 6.4% in H1’2018,
- The average Net Interest Margin in the banking sector currently stands at 7.3%, down from the 8.1% recorded in H1’2018, despite the Net Interest Income increasing by 10.8% y/y. The decline was mainly due to the 13.8% increase in allocation to relatively lower yielding government securities, coupled with the decline in yields on loans due to the 100 bps decline in the Central Bank Rate (CBR), and,
- Non Funded Income grew by 16.8% y/y, faster than the 6.9% recorded in H1’2018. The growth in NFI was boosted by the total fee and commission income which improved by 24.3%, compared to the 4.6% growth recorded in H1’2018, owing to the faster loan growth.
Weekly Highlights
During the week, Financial Sector Deepening Trust Kenya released a survey on the state of the credit sector in Kenya. The survey highlighted the indebtedness in the country, with one out of every five borrowers defaulting on a loan over the past year. The report highlighted that farmers and low-income households are among the worst hit by the debt crisis. In addition, Non-Performing Loans (NPL) ratios among Kenyan banks were the most elevated among major economies in the continent, with the average NPL ratio for the banking sector coming in at 9.7%, as at FY’2018. Despite this, private sector credit growth recorded a marginal improvement, coming in at 5.2% in June, from 4.4% recorded in May, but still remains below the 5-year average of 11.2%. We expect the trend of subdued credit growth to continue given the fact that the Monetary Policy Committee maintained the interest rate cap at 9.0%, which has pushed banks to adjust their lending patterns as they shy away from unsecured loans, and focus on collateral based lending. In addition, asset quality distress for banking sector players is expected to remain elevated, with the current relatively tougher operating regime characterized by reduced credit availability to Micro, Small and Medium Enterprises (MSMEs), set to persist. Thus, we continue to expect asset quality to remain constrained.
Universe of Coverage
Below is a summary of our SSA universe of coverage:
|
Banks |
Price as at 09/08/2019 |
Price as at 16/08/2019 |
w/w change |
YTD Change |
Target Price |
Dividend Yield |
Upside/ Downside |
P/TBv Multiple |
Recommendation |
|
Diamond Trust Bank |
112.0 |
119.0 |
6.3% |
(24.0%) |
228.4 |
2.2% |
96.1% |
0.6x |
Buy |
|
CRDB |
100.0 |
100.0 |
0.0% |
(33.3%) |
207.7 |
0.0% |
88.8% |
0.3x |
Buy |
|
UBA Bank |
5.7 |
5.6 |
(1.8%) |
(27.9%) |
10.7 |
15.3% |
87.9% |
0.4x |
Buy |
|
Zenith Bank |
16.8 |
16.6 |
(1.2%) |
(28.0%) |
33.3 |
16.3% |
84.5% |
0.7x |
Buy |
|
KCB Group *** |
39.7 |
39.8 |
0.3% |
6.3% |
60.4 |
8.8% |
66.7% |
1.1x |
Buy |
|
GCB Bank |
5.0 |
5.0 |
(1.6%) |
7.6% |
7.7 |
7.7% |
64.3% |
1.2x |
Buy |
|
I&M Holdings |
53.0 |
49.0 |
(7.5%) |
15.3% |
81.5 |
7.1% |
55.3% |
0.9x |
Buy |
|
Access Bank |
6.2 |
6.1 |
(2.4%) |
(11.0%) |
9.5 |
6.6% |
52.8% |
0.4x |
Buy |
|
Co-operative Bank |
12.1 |
11.9 |
(1.7%) |
(16.8%) |
17.1 |
8.4% |
50.5% |
1.0x |
Buy |
|
Equity Group*** |
40.5 |
39.2 |
(3.2%) |
12.5% |
53.7 |
5.1% |
42.9% |
1.7x |
Buy |
|
NIC Group |
29.0 |
28.2 |
(2.8%) |
1.4% |
42.5 |
3.5% |
42.4% |
0.6x |
Buy |
|
CAL Bank |
1.0 |
1.0 |
1.0% |
2.0% |
1.4 |
0.0% |
40.0% |
0.8x |
Buy |
|
Barclays Bank *** |
10.8 |
10.8 |
0.0% |
(1.8%) |
12.8 |
10.2% |
32.7% |
1.3x |
Buy |
|
Stanbic Bank Uganda |
29.0 |
28.8 |
(0.6%) |
(7.0%) |
36.3 |
4.1% |
29.1% |
2.0x |
Buy |
|
SBM Holdings |
5.5 |
5.7 |
3.3% |
(5.0%) |
6.6 |
5.3% |
22.9% |
0.8x |
Buy |
|
Guaranty Trust Bank |
26.8 |
26.0 |
(3.0%) |
(24.5%) |
37.1 |
9.2% |
22.0% |
1.6x |
Buy |
|
Stanbic Holdings |
100.0 |
98.5 |
(1.5%) |
8.5% |
113.6 |
5.9% |
20.6% |
1.1x |
Buy |
|
Ecobank |
8.5 |
8.5 |
(0.6%) |
12.7% |
10.7 |
0.0% |
19.2% |
1.9x |
Accumulate |
|
Union Bank Plc |
6.8 |
6.8 |
0.0% |
21.4% |
8.2 |
0.0% |
16.4% |
0.7x |
Accumulate |
|
Standard Chartered |
196.3 |
197.0 |
0.4% |
1.3% |
200.6 |
6.3% |
9.5% |
1.4x |
Hold |
|
Bank of Kigali |
274.0 |
274.0 |
0.0% |
(8.7%) |
299.9 |
5.1% |
8.5% |
1.5x |
Hold |
|
FBN Holdings |
4.9 |
4.7 |
(5.1%) |
(41.5%) |
6.6 |
5.4% |
6.6% |
0.3x |
Hold |
|
Bank of Baroda |
128.0 |
128.0 |
0.0% |
(8.6%) |
130.6 |
2.0% |
3.4% |
1.1x |
Lighten |
|
Standard Chartered |
19.0 |
19.0 |
0.0% |
(9.5%) |
19.5 |
0.0% |
2.3% |
2.4x |
Lighten |
|
National Bank |
4.0 |
3.8 |
(5.1%) |
(29.5%) |
3.9 |
0.0% |
(4.8%) |
0.2x |
Sell |
|
Stanbic IBTC Holdings |
38.1 |
32.0 |
(16.0%) |
(33.3%) |
37.0 |
1.9% |
(6.2%) |
1.6x |
Sell |
|
Ecobank Transnational |
7.0 |
6.0 |
(15.0%) |
(65.0%) |
9.3 |
0.0% |
(15.6%) |
0.2x |
Sell |
|
HF Group |
4.0 |
3.5 |
(12.5%) |
(37.0%) |
2.9 |
0.0% |
(27.7%) |
0.1x |
Sell |
|
Average |
|
|
-2.5% |
|
|
|
|
1.0x |
|
|
High |
|
|
6.3% |
|
|
|
|
2.4x |
|
|
Low |
|
|
(16.0%) |
|
|
|
|
0.1x |
|
|
*Target Price as per Cytonn Analyst estimates **Upside / (Downside) is adjusted for Dividend Yield ***Banks in which Cytonn and/or its affiliates are invested in ****Stock prices indicated in respective country currencies |
|||||||||
We are “Positive” on equities for investors as the sustained price declines have seen the market P/E decline to below its historical average. We expect increased market activity, and possibly increased inflows from foreign investors, as they take advantage of the attractive valuations to support the positive performance.
Juhudi Kilimo, a Kenyan microfinance institution, has raised EUR 2.2 mn (Kshs 252.2 mn) in equity capital from Incofin CVSO, a fund managed by Belgium-based Incofin Investment Management, for an undisclosed stake. This will be Incofin’s first equity investment in the country, adding to its expansive portfolio, which includes over 325 investments in 65 countries, with a combined value of over USD 1.0 bn, focused on growing the financial services industry in developing countries.
The funds will be directed towards Juhudi Kilimo’s expansion strategy, which is targeted at widening its geographical coverage, diversifying its product range as well as improving the welfare of its employees. Juhudi Kilimo currently serves over 45,000 farmers in rural Kenya, with 90% of the loans disbursed via mobile phone, in addition to the 34 physical branches, thus giving access to the unbanked population in the marginalized areas of the country. Since its inception in 2004, Juhudi Kilimo has deployed over (USD 22.0 mn) Kshs 2.5 bn in loans.
TechAdvance, a Nigerian payment application development company, raised USD 1.0 mn (Kshs 103.5) mn in equity funding from Lamar Holding, an energy investment company based in Bahrain.
TechAdvance will use this funding to support its expansion strategy, aimed at widening its coverage in Africa as well as reaching out to other markets globally, having gotten approval from the Central Bank of Bahrain to operate a payment solutions service business, in addition to a similar license from the Central Bank of Nigeria, indicating that the firm intends to leverage the partnership with Lamar Holdings to cross into the Middle Eastern market. The firm is also looking to shift from being a business process outsourcing provider, to being a key digital financial services provider, with one of its initial plans being the launch of a fully digital bank, to complement its subsidiaries, GPay Africa, PayElectricityBills, Advance BancCorp Digital Microfinance Bank, as well as reach the unbanked and last-mile users.
This investment is a notable investment for Lamar Holding, being one of their first investments within their new strategy to diversify their investments, both geographically and in terms of sector, given that they have only been investing in energy companies in the Middle East and China. It will also help the firm venture into technology, has also provided seed capital of an undisclosed amount to one of TechAdvance portfolio companies in 2011.
We expect the Fintech sector to continue to witness more investments, given the untapped potential in credit and credit-related industries in Africa, highlighted by the significant difference in credit extension activity in Africa compared to other world regions. Fintech lending addresses this by providing access to credit via convenient and already established channels.
Private equity investments in Africa remain robust as evidenced by the increasing investor interest, which is attributed to; (i) rapid urbanization, a resilient and adapting middle class and increased consumerism, (ii) the attractive valuations in Sub Saharan Africa’s private markets compared to its public markets, (iii) the attractive valuations in Sub Saharan Africa’s markets compared to global markets, and (iv) better economic projections in Sub Sahara Africa compared to global markets. We remain bullish on PE as an asset class in Sub-Sahara Africa. Going forward, the increasing investor interest and a stable macro-economic environment will continue to boost deal flow into African markets.
- Industry Reports
During the week, Kenya Bankers Association published their Housing Price Index Q2'2019 which highlighted that apartments continue to dominate the housing market due to their affordability. The take-outs were;
- In terms of uptake, apartments continued to dominate the housing market, an indication of the predominance of the mid-income earning population. As per the report, in Q2’2019 apartments accounted for 81.2% of total market uptake while maisonettes and bungalows accounted for 12.9% and 5.9%, respectively, in comparison to 62.6%, 23.4% and 14.0%, respectively, in Q1’2019 attributed to apartments’ affordability. The increased supply of apartments was attributed to developers’ continued focus on optimization of returns through land maximization,
- In terms of performance, the residential market prices slightly stabilized during the quarter declining marginally by 1.7% compared to a 2.8% decline in the previous quarter. The continued slowdown in prices is attributable to a weak household income, which continues to keep demand for housing tight, in addition to the slow private sector credit growth during the first half of the year.
The report is in tandem with Cytonn’s Nairobi Metropolitan Area Residential Report 2018/19, which highlighted that the sector recorded subdued performance compared to prior years attributed to a challenging financial environment in Kenya on account of the interest rate cap, with has led to stringent underwriting practices by lending institutions affecting homebuyers, hence a decline in effective demand, and thus leading to a sluggish growth in prices and uptake. The report also noted that apartments recorded a higher uptake at 22.3% p.a. compared to detached units at 20.0% p.a., attributed to the former’s continued demand by the constantly growing middle class, mainly due to their affordability.
However, in our view, despite the subdued performance, the residential sector has pockets of value mainly in the low end and middle-end sectors where the demand for affordable housing continues to grow supported by the growing middle class. Venturing in the same will also present developers with a chance to benefit from government’s incentives related to the affordable housing initiative, among them;
- The 50.0% corporate tax break from 30.0% to 15.0% for developers who put up affordable housing units numbering 100 and above, and,
- Tax exemption for supplies imported or purchased for direct and exclusive use in the construction of affordable houses by licensed Special Economic Zones (SPZ) for a minimum of 5,000 housing units in addition to having a recommendation from the Cabinet Secretary for housing.
Serviced Apartments Mini Note
Serviced apartments have continued to gain popularity in the Kenyan hospitality market, as an alternative to hotel accommodation, especially for guests looking for extended stay. Unlike hotel rooms, serviced apartments bear close resemblance to apartment-style living and are therefore preferred by guests who want a homely feel or who travel as families. Following the growing popularity of the concept, today we look into factors driving investment in serviced apartments. We also look at the advantages of the concept to guests, serviced apartment’s performance in the Nairobi Metropolitan Area, and conclude with our outlook on the investment opportunity in the sector.
Demand for serviced apartments has been on the rise and thus, they record relatively high occupancy rates of above 70.0%, compared to hotels in Nairobi at 35.5%, according to Kenya National Bureau of Statistics Statistical Abstract 2018, and we attribute this to the large number of international guests who stay for more than 2-weeks in the country. According to the Kenya National Bureau of Statistics, while 43.2% of international visitors in 2017 stayed for less than 14-days, 56.8% stayed for at least 15-days.
Supported by the growing popularity of the serviced apartments concept, Nairobi Metropolitan Area had approximately 3,414 serviced apartments as at 2015, and an additional 1,174 set to be complete by 2020. Some of the developments introduced in the market in the last 2 years include: (i) Cysuites by Cytonn Investments, a 40-unit project in Westlands set to be opened next month, (ii) Movenpick Hotel and Residences opened in 2018, and, (iii) The 38-unit Gem Suites development also situated in Westlands, off Riverside Lane. Notable international hospitality groups that have also revealed plans of setting up hotel residences include; Radisson Hotel Group and Marriot Group under their Radisson Blu and JW Marriott brands, respectively. The key drivers of investment in serviced apartments include:
- Relatively Higher Demand - As firms aim to optimize their travel budgets, more travelers are choosing to stay in serviced apartments as they are less expensive in the long-run, resulting in high demand and thus, high occupancy rates at above 70.0% in Nairobi, in comparison to hotels at 35.5%,
- Convertibility - Serviced apartments can be easily converted to normal or furnished apartments, in the case where the former is not performing well,
- Stable Revenue - The clientele for serviced apartments is majorly long-term stays, and thus the guarantee of a more stable income due to relatively longer tenancy periods as compared to hotels,
- Lower Operating Expenses as Compared to Hotels - Operating serviced apartments requires less number of staff and lower ancillary costs for amenities and foodstuff, and are thus cheaper to run compared to hotels, and,
- Relatively High Returns- Serviced apartments have continued to offer relatively high returns with the market average rental yield coming in at 7.4%, compared to residential sector’s average yield of 4.3%, according to Cytonn Research.
From our research, the demand for serviced apartments has also continued to grow over the years evidenced by the 8.0% points increase in occupancy levels in 2018 to an average of 80.0%, from 72.0% in 2017. The growing demand is supported by benefits that come with the theme among them;
- Lower Room Rates - Serviced apartments are considered more affordable given their relatively lower charges compared to hotels. For instance, a standard 3-star hotel in Nairobi charges on average Kshs 14,000 per night for a suite, while a studio serviced apartments charges on average Kshs 8,000 per night and a 1-bedroom apartment charges on average Kshs 11,000 per night,
- Easy Integration- Serviced apartments are located within or in close proximity to other residential developments, hence long stay guests are able to integrate with the community,
- Home Away from Home Feel - Unlike a hotel, a serviced apartment can easily accommodate a family, as they are structured like normal apartments, in addition to allowing someone to cook and hence creating the home away from home experience that is sought after by many long-term travelers, and,
- Bigger Spaces Compared to Hotels - Serviced apartments often have bigger room sizes than hotels. For instance, in Nairobi, while the standard hotel room size is 30-50 SQM, the average size of serviced apartments is 75 SQM for 1-bedroom units, 116 SQM for 2-bedroom units, and 152 SQM for 3-bedroom units.
In terms of performance, serviced apartments in the Nairobi Metropolitan Area recorded improved performance in 2018, with average rental yield coming in at 7.4%, 2.1% points higher than 5.3% recorded in 2017, attributed to increased demand, which triggered an increase in charge rates, as well as increased occupancy rates with an average of 80.0% in 2018, compared to 72.0% in 2017. The improved performance was supported by a stable political environment and improved security, making Nairobi an ideal destination for both business and holiday travelers.
Kilimani and Westlands area were the best performing nodes recording relatively high occupancy rates of 86.0% and 76.0%, and rental yields of 10.9% and 10.6%, respectively, attributed to presence of recreational amenities such as high-end shopping facilities, good infrastructure, which enhances their accessibility and interconnectivity with other nodes such as Upperhill, Gigiri, and CBD, and the availability of high quality apartments. Thika Road (Muthaiga North, Mirema and Garden Estate) recorded the lowest rental yield at 4.4%, attributed to its unpopularity, given the distance from main commercial zones, the lack of high quality serviced apartments, and general relatively low levels of security, thus not attractive to expatriates due to security concerns.
The table below shows the summary of performance:
|
Nairobi Metropolitan Area Serviced Apartments Performance 2018 |
|||||||||||
|
Sizes (SQM) |
Monthly Rates 2018 (Kshs) |
|
|
|
|||||||
|
Node |
Studio |
1 bed |
2 bed |
3 bed |
Studio |
1 Bed |
2 Bed |
3 Bed |
Occupancy 2018 |
Monthly Charge per SM(Kshs) |
Rental Yield |
|
Kilimani |
39 |
69 |
110 |
149 |
197,850 |
266,915 |
319,304 |
361,421 |
86% |
3,567 |
10.9% |
|
Westlands& Parklands |
33 |
85 |
115 |
177 |
282,938 |
260,928 |
300,492 |
340,000 |
76% |
4,044 |
10.6% |
|
Limuru Road |
51 |
137 |
107,438 |
193,621 |
84% |
3,685 |
9.7% |
||||
|
Kileleshwa& Lavington |
38 |
70 |
134 |
100,000 |
231,000 |
285,750 |
337,000 |
83% |
2,686 |
7.8% |
|
|
Nairobi CBD |
51 |
90 |
115 |
137 |
120,000 |
199,500 |
294,917 |
320,000 |
74% |
2,374 |
5.7% |
|
Upperhill |
75 |
110 |
156 |
274,680 |
300,492 |
310,000 |
60% |
2,580 |
5.3% |
||
|
Msa Road |
34 |
90 |
107 |
151 |
114,912 |
120,000 |
201,096 |
258,552 |
85% |
1,642 |
5.0% |
|
Thika Road |
70 |
100 |
144 |
100,646 |
128,375 |
90% |
1,361 |
4.4% |
|||
|
Average |
39 |
75 |
116 |
152 |
153,856 |
205,911 |
261,489 |
321,162 |
80% |
2,742 |
7.4% |
|
|||||||||||
Source: Cytonn Research
With the hospitality sector on an upward growth trajectory, serviced apartments concept in Kenya is set to continue growing supported by; (i) relatively high returns to investors, (ii) growing middle class and resultant demand for different luxury hospitality products, and (iii) increased the number of long-stay international tourists and expatriates, and therefore, we expect the theme to continue recording relatively good performance going forward. For investors seeking to venture into the theme, the investment opportunity lies in Kilimani, Westlands, and Parklands, which are the best performing areas with average rental yields of above 10.0% and occupancy rates of above 75.0%.
Other highlights during the week:
- During the week, the Capital Markets Authority of Kenya approved the issuance of a green bond by Acorn Group, a Kenya-based property developer, in partnership with Helios, a UK-based Private Equity firm. The Kshs 5.0 bn medium-term note, which is Kenya’s first unlisted green bond, also received a stable rating from Moody’s, a global ratings agency. The funds will be used to finance the construction of sustainable and climate-resilient student hostel units in Nairobi, with the two firms targeting to put up approximately 3,800 units in Nairobi at a cost of approximately Kshs 7.4 bn. Acorn Group and Helios have already put up approximately 1,000 hostel units located in Parklands, Jogoo Road and Ruaraka under the Qwetu brand. The move is a step in the right direction towards linking the cash-strapped real estate sector with capital market funding in Kenya, in the wake of tough economic times evidenced by the limited access to credit occasioned by the capping of the interest rates thus crippling development. The deficit of student accommodation in Kenyan tertiary institutions has continued to attract investors as there’s a ready market with Jumia reporting a deficit of 489,000 bed spaces as at 2016. According to Cytonn Research, modern student hostels have potentially high yields of between 7.2% - 9.6% compared to the conventional real estate sectors i.e., commercial office, retail, and residential, whose average yields were 6.7% as at 2019.
We expect the real estate to continue recording activities fuelled by continued demand for affordable housing units, and developers shifting focus to underserved concepts such as serviced apartments and student hostels, which attract relatively high investor returns.
Kenya’s real estate sector has been one of the fastest-growing sectors of the economy over the last 5 years. Recently, the sector has experienced a lower rate of development, with the shortage of funding in the real estate sector being a contributing factor to the slow growth, with most developers relying on presales and debt. The slow uptake has reduced the presales capital available for developers to plough back into the project, with average uptake in the Nairobi Metropolitan Area declining from 23.3% in 2017 to 20.9% in 2018 as per our 2019 Residential Report. The decision to cap interest rates in the banking sector has led to banks reducing funding to the real estate sector, owing to the tighter credit conditions, given the inherent risks in funding long-term real estate projects, as evidenced by the increase in non-performing loans (NPLs) in the sector. The latest data from the Central Bank of Kenya reported a 48.0% increase in NPLs from 2017 to 2018, equivalent to Kshs 14.4 bn, thus bringing the total NPLs in the sector to Kshs 44.4 bn. In this regard, we sought to dissect the real estate sector in Kenya, particularly on the funding side, and how industry players can find alternative ways of accessing capital. This focus addresses the topic as follows:
- Overview of the real estate sector, where we highlight the developing trends in the real estate sector and introduce traditional investment strategy vs modern real estate investment strategy,
- Traditional financing for real estate development, where we highlight traditional methods of financing real estate and the challenges in financing real estate development the traditional way,
- Alternative financing for real estate development, where we highlight uses of alternative financing methods, merits of alternative sources of financing and factors limiting the adoption of alternative financing sources in the real estate industry,
- Case Study – South Africa listed property market, and,
- Steps to increasing access to real estate development funding.
Section I: Overview of the Real Estate Sector
The Kenyan real estate sector has witnessed tremendous growth over the last few years, supported by the growing population, expanding middle class, rapid rural-urban migration, and investments in infrastructure across Kenya. The real estate sector growth is expected to be bolstered by current trends such as government initiatives like Affordable Housing as one of its Big Four Agenda, continued investment in infrastructure and devolution. On the demand side, the government is working on uptake through the introduction of the housing scheme and the establishment of the Kenya Mortgage Refinance Company, which is expected to increase credit availability.
In 2018, the real estate sector recorded continued investment across all themes driven by;
- The continued positioning of Nairobi as a regional hub that has led to the increased entry of multinationals creating demand for residential units, retail space, commercial offices, and hospitality spaces,
- Kicking off the affordable housing initiative as part of the Kenyan Government’s Big 4 Agenda, which has gained momentum with the launching of projects such as the Pangani Estate in Nairobi, and,
- An improving macroeconomic environment, with the country’s GDP growing by 6.3% in 2018, higher than the 4.9% recorded in 2017.
In terms of performance, however, the sector recorded an average total return of 11.2% in 2018, 2.9% points decline from 14.1% in 2017 as per our Cytonn Annual Markets Review 2018. This is attributable to a decline in effective demand for property amid the growing supply, evidenced by the 3.0% decline in the residential sector occupancy rates, and an oversupply in the commercial sector, currently at 2.0 mn SQFT and 5.2 mn SQFT for the retail and commercial office sector, respectively. However, it is important to note that the development returns for investment-grade real estate continue to average above 20.0% p.a.
The first way of investing in Real Estate is the traditional way and is what most people are conversant with. This is brick and mortar investment, where a developer, either an individual or an institution, purchase a parcel of land and develops a building, which they later rent out or sell to end-users. Some of the key challenges here include;
- Little or no research and feasibility analysis – Investments of this type are usually speculative in nature, with investment done based on prediction of trends, which in most cases is not backed by data,
- Low returns – As a result of the little research put into such investments, they usually give low returns, especially in instances where there is oversupply of similar units or developments, or shortage of demand for the real estate units,
- Illiquidity – Exiting brick and mortar real estate is hard as there lacks an official platform for transactions.
Traditional / Conventional Transaction Scenario: A saver with money takes it to the bank and gets little to no return on their deposit. The bank, in turn, lends the money to, say, a developer and charges market rate cost of borrowing. The bank enjoys the difference between the cost of the deposit paid to the saver and the yield on loan received from the developer. This is illustrated below:
- Saver has Kshs 10.0 mn; he can go deposit it in a bank and get at best 7.0% per annum return on the deposit,
- Developer can then go to the bank and borrow the Kshs 10.0 mn from the bank. Remember the bank will be lending to the developer the same Kshs 10.0 mn that the bank got from the saver, but the all-in cost after all bank charges and loan fees comes to about 18.0% per annum,
- Developer will then use the money to develop a house and sell it for Kshs 12.5 mn, essentially making a gross return of 25.0%, or Kshs 2.5 mn on the Kshs 10.0 mn loan,
- Developer will then pay to the bank the Kshs 10.0 mn loan plus 18.0% total cost of loan, equal to Kshs 1.8 mn, so a total of Kshs 11.8 mn goes back to the bank, leaving the developer with Kshs. 0.7 mn of profit.
Looking at an Alternative Financing Transaction, the facts remain essentially the same, except that the intermediary is not a bank but an investment vehicle; the saver with money takes it to an investment professional, through an Investment Vehicle, who gives the money directly to the developer. The developer will still pay the usual cost of borrowing, but instead of paying it to the bank, it will be paid to the Investment Vehicle, which will pass the returns to the saver. By structuring out the bank, the saver has been able to increase the returns from the typical rate of return given on deposits, to the typical rate of borrowing paid by developers. This is illustrated below:
- The saver has changed to an investor and channels his Kshs 10.0 mn to an Investment Vehicle managed by an investment professional,
- The developer can then borrow the Kshs 10.0 mn from the Investment Vehicle and pay the same 18% per annum they would have paid to the bank in the conventional scenario,
- The developer will then use the money to develop a house and sell it for Kshs 12.5 mn, essentially making a gross return of 25.0% or Kshs 2.5 million on the Kshs 10.0 mn loan,
- The developer will then pay to the Investment Vehicle the Kshs 10.0 mn loan plus 18.0% total cost of loan, or Kshs 1.8 mn, which will be paid to Mr. Investor,
- As a result, a total of Kshs 11.8 mn goes to the saver turned investor, leaving the developer with Kshs 0.7 mn of profit.
The difference between the Traditional Transaction and the Alternative Transaction is that the parties with money have come up with a private Investment Vehicle to be able to transact directly, by structuring out the bank. For the party with money, they get a much higher return, and for the party needing the money, the developer, they are able to transact very quickly and move faster than other developers relying only on conventional bank funding. This is the key essence of the Alternative Transaction: using highly customized features, it brings two parties together to transact through innovative features and delivers to them superior results than they would not otherwise get in conventional channels.
Section II: Traditional Financing for Real Estate Development
Traditionally, the two main ways of funding real estate development are through debt and equity.
- Debt Financing
This has been the most common source of real estate funding, and is where a developer gets capital from a financier, and pays it back at a fixed rate, regardless of whether their investment yields return or not. Some of the common debt sources include;
- Bank debt – This is where a developer obtains development capital from a bank or an institutionalized lender. The interest rates are usually determined by market forces, but in some instances, such as is the case in Kenya, can be controlled by regulatory authorities. The tenors of these loans vary in length, dependent on the profile of the project being funded. These loans are heavily collateralised and involve a lengthy due diligence process.
- Private Lenders – Such capital is advanced by anyone with access to capital and a willingness to invest it. Usually, such lenders are not institutionalized or licensed to lend money, but rather do so with the intentions of earning a return. One of the benefits of such capital is that the lenders’ terms are typically easier to meet. The biggest disadvantage, however, is that the size of loans tends to be much smaller.
- Equity
- Presales Financing – This is whereby project developers can cover their capital requirements by selling their projects early on. This model of real estate development has garnered the interest of investors since it allows them to take advantage of capital appreciation of these properties that are sold off-plan.
- Joint Ventures – This refers to a business arrangement in which two or more parties come together to undertake a project by pooling their resources together. Normally, real estate joint ventures combine the real estate development expertise and financing capability of a developer with the landowner’s contribution in the form of land.
Though the above methods of financing have worked for the real estate sector, they have not been short of challenges, in turn preventing the sector from growing to its full potential in terms of scale, as well as limiting the returns to real estate investors, as highlighted below:
- Shortage of foreign financing and investment capital – In the traditional way of investing in real estate, the returns are low. This, coupled with the small scale in which these investments are done, discourages foreign investors from advancing funding. The long processes involved in the due diligence stage also drive away those who are seeking funding, with most opting to source for financing from other easier sources.
- Difficulty in securing bank funding – Banks and other financial institutions have been very averse to offering credit, especially to the real estate sector, since they consider it a high-risk segment. This is attributable to the slow uptake of developed housing units. This, in addition to the interest rate cap that has tightened bank lending to the private sector, has seen the real estate sector struggle to secure bank funding.
- When foreign financing is available, it tends to be expensive and of short tenor – Foreign investors, when choosing to invest in Africa, demand high returns, compared to what they would get in their local markets. Such funds also tend to have a shorter tenor, which does not give the developers sufficient time to yield returns from the real estate investment in order to pay back.
- High degree of risk perception depending on firm/company – Most financiers usually require a long track record of delivery of real estate, which tends to isolate upcoming developers.
- Unreliability of presales for funding – While presales are considered a cheap source of funding, they tend to be unreliable due to the possibility of defaults or delayed payments which in turn would result in project delays if relied upon.
- Access to limited amounts of capital – Banks only provide a certain percentage of construction funding usually 50% - 70% of construction funding, thus developers have to look for alternative funding sources. Furthermore, bank debt is usually charged on the property title and thus a borrower cannot seek funding from other banks.
Section III: Alternative Financing for Real Estate Development
With the advancement in the real estate sector, as well as the various challenges facing the traditional funding methods for real estate, there has been a need to diversify the capital raising methods. This has given rise to innovative ways of funding real estate. Of these new real estate funding options, structured real estate investment solutions have gained the most traction. Structured real estate investments are solutions that are packaged by investment professionals to enable an investor access a return, supported by the performance of real estate, in a form that meets an investor’s needs. Structured products tend to have the following characteristics;
- They involve adding layers or features to traditional real estate, through a process called “structuring”,
- They generally deliver higher returns to the investors, in comparison to traditional investments,
- Like real estate, they tend to provide principal protection, coupled with an above-average yield return, and,
- They are generally traded in the private markets to qualified or sophisticated investors through alternative investment managers such as private equity managers.
While structured products are geared towards providing favorable returns to the investors, they have also proven to be quite indispensable in the real estate sector, in that in the hunt for high yield, they are invested heavily in asset classes such as real estate, making them an easily accessible means of financing for real estate developers. Another major advantage of structured funding is that it cuts out the middleman, in most cases financial institutions such as banks.
Some of the key financing options in structured financing are;
- Mezzanine Funding – This is where an entity provides subordinated financing to a real estate development. The financing is junior to bank debt, hence gets paid only after the bank but senior to equity, and hence gets paid before equity investors.
- Real Estate Structured Notes – This involves various options issued by a private firm, as a method of real estate financing. They include project notes, real estate-backed medium-term notes and other high yield loan notes, and,
- Real Estate Investment Trusts - This involves purchasing units in a company that has converted the physical real estate asset into a liquid investable product. This can either be public markets tradable like REITs or privately placed.
Structured products and other alternative real estate funding options have proven to be useful in funding real estate. However, there is a heavy reliance in bank funding as opposed to funding from the capital markets, with 95% of business funding in Kenya being sourced from the banking industry, despite having one of the highest banking spreads globally, as compared to 40% in advanced markets. This slow uptake can be attributed to;
- Lack of sufficient market knowledge – There is insufficient knowledge of structured products in the industry, both on the supply side, with investment managers not bringing these products to the market, and on the demand side, with investors not being fully aware of the benefits they stand to get from structured products, thus opting for the traditional way of investing in real estate,
- Lack of institutional development capacity – most of the real estate that is currently under development is not institutional-grade, and thus does not have the capacity to take up specialized funding such as that offered by structured products.
Section IV: Case Study – South Africa Listed Property Market
The South African listed property industry has experienced substantial growth over the past decade. The sector is dominated by a few large entities, with the biggest 10 accounting for about 80% of the sector’s market capitalisation. There are currently 27 entities listed as REITs on the JSE, with more attempts to bring new entities onto the exchange. According to the South African REIT Association, REITs represent about ZAR 233 bn (Kshs 1.6 tn) worth of real estate assets. South Africa is estimated to be the eighth-largest REIT market globally, with the US dominating the global REIT sector. Most South African REITs invest in commercial properties, such as shopping malls, warehouses, hotels, hospitals, and office buildings, with some investment in properties offshore.
Some of the factors that have led to the rapid development of the alternative funding sources in the South African industry are;
- Presence of an already developed capital market – Even before the incorporation of alternative funding sources such as REITs and other structured products, the capital markets in the country were already well established. Not only did this make it easier for investment managers in structuring offerings for investors, given that they had built expertise, but it also boosted the uptake given that investors already had sufficient confidence in the capital markets.
- Diverse property offerings – The property sector in South Africa is well diversified, with large institutional developers in all the real estate subsectors, who have built a strong track record in real estate delivery, while at the same time giving attractive returns. This has had a snowball effect, by encouraging lenders and investors to commit capital to this sector, further spurring the growth of this sector.
- Good Corporate Governance – Good regulation practices and corporate governance have acted as an incentive to both local and foreign investors, who have the assurance that their funds are being properly administrated and utilized.
The success in the implementation of alternatives in the South African industry did not go without a host of challenges, such as;
- Fluctuation in the real estate industry, where the property market in South Africa took a hit following the 2008 global economic crisis, and,
- Competition with higher returns in Asia and other African markets.
Section V: Steps in Increasing Access to Real Estate Development Funding
Increasing the access to funding for real estate development can be achieved through;
- The Development Of Structured Products In The Kenyan Market - These products have been a welcome alternative to banks for businesses seeking capital for growth, and the same can be applied to real estate financing. In developing markets such as Kenya, capital markets remain underdeveloped, hence businesses are forced to source up to 95% of funding from banks, while only 5% from capital markets. As such, real estate development and investment is not being provided with adequate access to this source of capital, which is provided at competitive rates can increase the development of affordable housing,
- Tax Amendments to Level the playing field – Structured Products and Non-bank funding need to be given favorable tax treatment as all other funding methods, which will provide an incentive to capital providers to invest in the real estate sector. This is expected to spur development of alternative sources of funding at competitive rates available for the real estate development,
- A Review of I-REITs - There is need to conduct a review on REITs, given that we only have one REIT on the stock exchange, and trading at 40% below its listing price due to negative investor sentiments,
- Reduce Minimum Amount Investable in all Real Estate Investment Trusts (REIT) - In order to attract capital into capital market vehicles such as Real Estate Investment Trusts (REIT’s) for real estate development, the minimum investment amount needs to be amended. The current regulations, which define the minimum subscription amount per investor at Kshs 5.0 mn for a Development REIT (D-REIT) is too high to attract significant interest from investors. An amount of Kshs 1.0 mn ensures the investor is sophisticated while also allowing a larger pool of investors to participate.
- Expand Trustees of a Collective Investment Scheme - Collective Investment Scheme Trustees should not only be banks but also include companies licensed by the CMA. For capital markets to fund real estate development, the players will need to accumulate capital in a fund overseen by trustees. The Capital Markets (Collective Investment Scheme) Regulations (2001) limit approved trustees to banks or financial institutions. Kenya has only 4 banks certified as CIS trustees, and thus we need to go the way of more developed countries and increase the pool to include other appropriate players.
- Expand Tax Relief for Regular Savings Towards Home Purchase- Savings into Collective Investment Schemes regulated by the Capital Markets Authority (CMA) should qualify as HOSP (Home Ownership Savings Plan). Savings in CMA approved products, such as Money Market Funds currently don’t qualify as HOSP. Therefore, savers only have the option of banks, which pay low interest. There is need to expand the meaning of "approved institution" that hold deposits intended for the Home Ownership Savings Plan (HOSP) to include Fund Managers, thus enabling the potential homeowners making savings through the CIS to enjoy the tax relief provided under HOSP.
- HOSP Guidelines should include Capital Markets Authority (CMA) investment guidelines in addition to the Central Bank of Kenya (CBK) - HOSP guidelines only recognize investment guidelines per CBK. If Fund Managers are included, the guidelines would be as per CMA. So that an investor has a choice whether to save through a bank or an investment savings product. To include investment guidelines provided by the CMA regulations, in addition to the prudential guidelines issued by CBK to regulate investment of deposits under a registered HOSP.
- Allowing Specialized Collective Investment Schemes- There is currently no provision to register a Collective Investment Scheme (CIS) that invests in a single asset class, specific sector, or is formed for a specific purpose, thus limiting the financing available to real estate from Collective Investment Schemes. The Capital Markets regulations for Collective Investment Schemes do not allow a sector-specific fund to be formed e.g. a technology, financial services, or real estate fund.
Real Estate development is crucial in any developing economy, According to the National Housing Corporation, Kenya has a cumulative housing deficit of 2.0 mn units growing by 200,000 units per year being driven mainly by (i) rapid population growth of 2.6% p.a. compared to the global average of 1.2%, and, (ii) a high urbanization rate of 4.4% against a global average of 2.1%. Supply, on the other hand, has been constrained with the Ministry of Housing estimating the total annual supply to be at 50,000 units. Alternative sources of funding are critical to helping meet the housing demand and real estate needs of the country and help provide affordable housing.
Disclaimer: The views expressed in this publication are those of the writers where particulars are not warranted. This publication is meant for general information only and is not a warranty, representation, advice or solicitation of any nature. Readers are advised in all circumstances to seek the advice of a registered investment advisor.

- Talk to us
- Kenya
- P.O Box 20695 - 00200, Nairobi, Kenya
- Cell +254709101200
- Tel +254709101200
- WhatsApp +254741676635
- United States
- +254709101200
- DOWNLOAD OUR APP
-


- Kenya
- 8th Floor, Pinetree Plaza, Kaburu Drive, Ngong Road, Nairobi, Kenya
- USA
- Suite 1150, 1775 Eye Street NW, USA, Washington DC 20006, USA
- Investments
- High Yield
- Private Equity
- Real Estate
- Real Estate
- RiverRun Estates
- Cytonn Towers
- The Ridge
- Taraji Heights
- The Alma