Nairobi Metropolitan Area (NMA) Residential Report 2018/2019, & Cytonn Weekly #28/2019
By Cytonn Research Team, Jul 14, 2019
Executive Summary
Fixed Income
T-bills remained oversubscribed during the week with the overall subscription rate increasing to 183.8% from 133.3% recorded the previous week. The continued oversubscription is attributable to favourable liquidity in the market supported by government payments;
Equities
During the week, the equities markets had mixed performances with NASI remaining flat while NSE 20 and NSE 25 gained by 0.5% and 0.2%, respectively, taking their YTD performance to gains/ (losses) of 6.5%, (5.5%) and 2.1%, for NASI, NSE 20 and NSE 25, respectively. During the week, the Kenya Bankers Association (KBA) released the State of Banking Industry Report 2019, highlighting the various factors that shaped the banking sector’s performance in 2018, the emerging trends, and the outlook for the sector going forward. Also, KCB released the offer document for the intended acquisition of the National Bank of Kenya (NBK);
Private Equity
During the week, Sterling Capital, a Kenyan based investment bank, acquired a 20.0% stake in Afvest, a Nairobi-based emerging markets private equity firm, which focuses on early-stage businesses in the financial services, energy, agri-processing and technology sectors, for an undisclosed value. In fundraising: (i) OPay, a Nigerian based mobile payment platform raised USD 50.0 mn (Kshs 5.1 bn) in its Series A round of funding, and (ii) Rent-to-Own, a Zambian based asset-financing company, secured a EUR 1.0 mn (Kshs 116.0 mn) investment from the seed capital and business development facility of the Dutch Good Growth Fund (DGGF), managed by Triple Jump B.V, a Netherlands based impact investment manager;
Real Estate
During the week, Stima Investment Cooperative, a local investments company, was appointed as the lead sales agent of Pangani Heights, one of the seven Nairobi Urban Regeneration Projects under the affordable housing initiative. In the retail sector, Naivas, a local supermarket chain, opened their 53rd outlet in Ongata Rongai, Kajiado County;
Focus of the Week
This week, we look at the performance of the Nairobi Metropolitan Area’s (‘NMA’) residential sector over the 2018/2019 period, as we update the findings of the Nairobi Metropolitan Area Residential Report 2017/2018, which we released in July 2018. This year, the residential sector had total returns of 4.7%, compared to 8.2% over a similar period last year. Key highlights for the sector over the period under review included the launch of the Kenya Mortgage Refinancing Company and introduction of affordable housing tax reliefs for homebuyers.
- Daniel Mainye, Senior Manager, Technology, Brand and Innovation, was on NTV to discuss the digital space, making money online and regulation of online spaces by the government. Watch Daniel here;
- Caleb Mugendi, Asst. Head of Investments, was on CNBC to analyze the Capital Markets Authority’s (CMA) actions against individuals accused of insider trading. Watch Caleb here;
- Caleb Mugendi, Asst. Head of Investments, was on KTN News to discuss investments with a bias to pensions. Watch Caleb here;
- Beatrice Mwangi, Real Estate Analyst, was on Metropol TV to discuss the latest in real estate, regulation, and the pervasion of mobile loans companies. Watch Beatrice here;
- Phase 1 of The Alma is now 100% sold with early buyers having achieved up to 55% capital appreciation. We are now running a promotion in Phase 2: Buy a unit in Phase 2 with a 15-year payment plan and 0% deposit. For inquiries, please email us on clientservices@cytonn.com. The site is open between 8 am - 5 pm, 7-days a week for site visits;
- Cytonn Money Market Fund closed the week at an average yield of 11.0% p.a. To subscribe, just dial *809#
- In line with increasing the product offering to our clients, Cytonn Asset Managers officially launched its pensions business and in addition to managing segregated funds, it has received licenses from the Retirement Benefits Authority (RBA) to offer other products including; (i) a Personal Retirement Benefits Scheme with a monthly payment platform, an Umbrella Retirement Benefits Scheme and an Income Drawdown Fund. For more information on the pension products, email us at pensionsales@cytonn.com;
- For an exclusive tour of Cytonn’s real estate developments, visit: Sharp Investor’s Tour and for more information, email us at sales@cytonn.com;
- Following the completion and handover of Amara Ridge in Karen, we have now launched our next Karen project, dubbed Applewood, a Kshs 2.5 bn residential development located in Miotoni, Karen. This signature development shall comprise luxury homes, each sitting on 1/2 acre. We invite you to the exhibition of Applewood which is ongoing at the Amara Ridge Clubhouse (Location pin: https://goo.gl/maps/B3GVnu8pHyn) or at the Applewood Sales Centre on Miotoni Road (Location pin: https://goo.gl/maps/ZfABuGjFo1z) from 9:00 am to 5:00 pm daily. Call 0709 101 000 or email resales@cytonn.com to reserve a villa! See Video here;
- We continue to hold weekly workshops and site visits on how to build wealth through real estate investments. The weekly workshops and site visits target both investors looking to invest in real estate directly and those interested in high yield investment products to familiarize themselves with how we support our high yields. Watch progress videos and pictures of The Alma, Amara Ridge, and The Ridge;
- We continue to see very strong interest in our weekly Private Wealth Management Training (largely covering financial planning and structured products). The training is at no cost and is open only to pre-screened participants. We also continue to see institutions and investment groups interested in the training for their teams. Cytonn Foundation, under its financial literacy pillar, runs the Wealth Management Training. If interested in our Private Wealth Management Training for your employees or investment group, please get in touch with us through wmt@cytonn.com. To view the Wealth Management Training topics, click here;
- For recent news about the company, see our news section here;
- We have 10 investment-ready projects, offering attractive development and buyer targeted returns. See further details here: Summary of Investment-Ready Projects.
Money Markets, T-Bills & T-Bonds Primary Auction:
T-bills remained oversubscribed during the week with the overall subscription rate increasing to 183.8% from 133.3% recorded the previous week. The continued oversubscription is attributable to favourable liquidity in the market supported by government payments. The yields on the 91-day paper rose by 0.1% points to 6.6% from 6.7% recorded the previous week, while that of the 182-day paper rose by 0.1% points to 7.5% from 7.4% the previous week, respectively. The 364-day paper, however, remained unchanged at 8.6%. The acceptance rate for all treasury bills bid increased to 100% from 94.2% recorded the previous week, with the government accepting all the Kshs 44.1 bn worth of bids received, higher than the weekly quantum of Kshs 24.0 bn. Investors’ participation remained skewed towards the longer-dated paper, with the continued demand being attributable to the scarcity of newer short-term bonds in the primary market. The 91-day, 182-day and 364-day papers registered improved subscription to 81.1%, 111.1% and 297.7% from 53.8%, 48.2% and 250.2% recorded the previous week, respectively.
In the money markets, 3-month bank placements ended the week at 8.8% (based on what we have been offered by various banks), 91-day T-bill at 6.6%, average of Top 5 Money Market Funds at 10.1%, with the Cytonn Money Market Fund closing the week at 11.0%.
Liquidity:
Liquidity in the market remained favourable during the week, with the average interbank rate still at low levels despite rising slightly to 2.3% from 2.0%, recorded the previous week. This saw commercial banks’ excess reserves coming in at Kshs 14.8 bn in relation to the 5.25% cash reserves requirement (CRR). The average volumes traded in the interbank market however declined by 2.0% to Kshs 7.6 bn, from Kshs 7.8 bn the previous week.
Kenya Eurobonds:
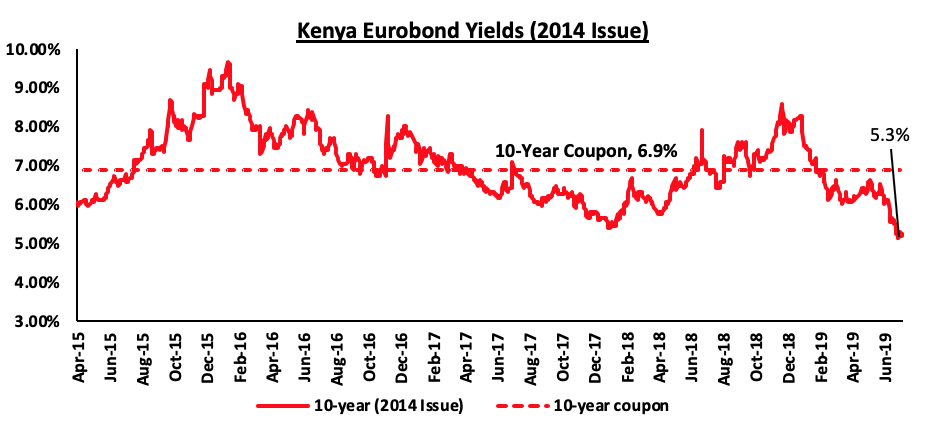
The yield on the 10-year Eurobond issued in 2014 rose by 0.1% points to 5.3%, from 5.2% recorded the previous week.
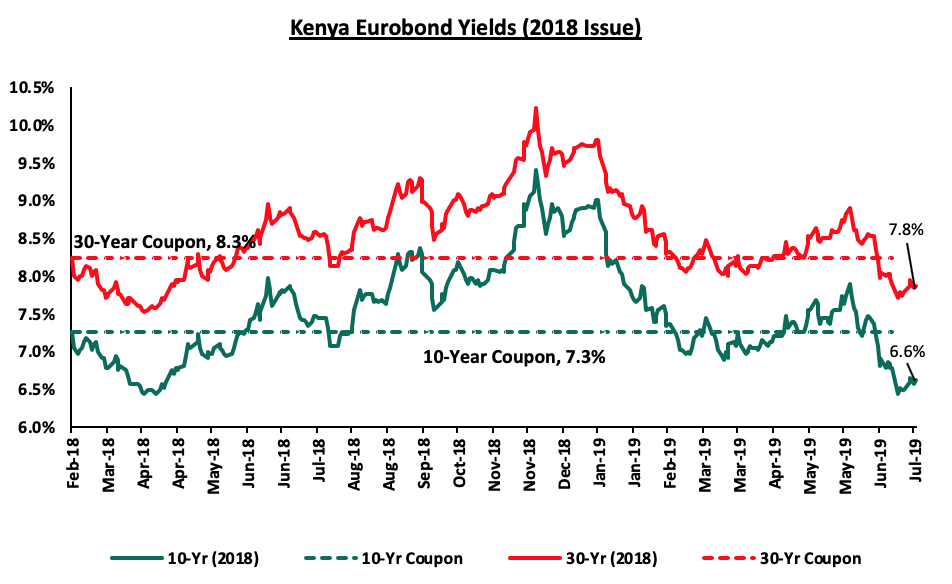
For the February 2018 Eurobond issue, yields on both the 10-year and 30-year Eurobonds remained unchanged at 6.6% and 7.8%, respectively.
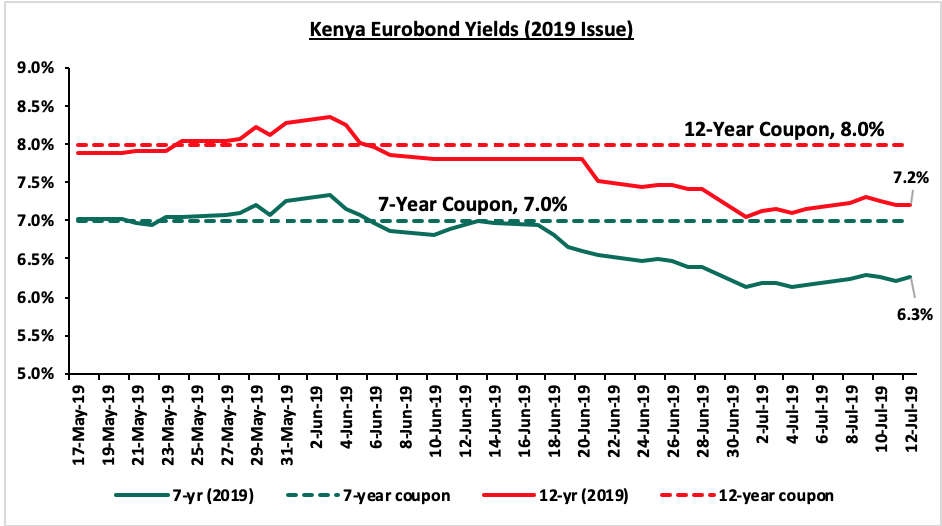
For the newly issued dual-tranche Eurobond with 7-years and 12-years tenor, priced at 7.0% for the 7-year tenor and 8.0% for the 12-year tenor, respectively, the yields on the 7-year bond rose by 0.1% point to 6.3% from 6.2%, while the 12-year bond yields remained unchanged at 7.2%.
The Kenya Shilling:
During the week, the Kenya Shilling depreciated by 0.3% against the US Dollar to close at Kshs 102.9, from Kshs 102.6 the previous week, this was due to increased dollar demand from oil and merchandise importers during the week. The Kenya Shilling has appreciated by 0.5% year to date in addition to the 1.3% appreciation in 2018, and in our view, the shilling should remain relatively stable to the dollar in the short term, supported by:
- The narrowing of the current account deficit with preliminary data indicating that the current account deficit narrowed to 4.2% percent of GDP in the 12 months to May 2019 from 5.8% recorded in May 2018. The decline has been attributed to the resilient performance of exports particularly horticulture and coffee, strong diaspora remittances, and higher receipts from tourism and transport services. Growth of imports also slowed mainly due to lower imports of food,
- Improving diaspora remittances, which have increased by 3.8% in May 2019 to USD 1.2 bn, from USD 1.1 bn recorded in a similar period of review in 2018. The rise is due to:
- Increased uptake of financial products by the diaspora due to financial services firms, particularly banks, targeting the diaspora, and,
- New partnerships between international money remittance providers and local commercial banks making the process more convenient,
- CBK’s supportive activities in the money market, such as repurchase agreements and selling of dollars, and,
- High levels of forex reserves, currently at USD 9.8 bn (equivalent to 6.2-months of import cover), above the statutory requirement of maintaining at least 4-months of import cover, and the EAC region’s convergence criteria of 4.5-months of import cover.
Rates in the fixed income market have remained relatively stable as the government rejects expensive bids. A budget deficit is likely to result from depressed revenue collection with the revenue target for FY’2019/2020 at Kshs 2.1 tn, creating uncertainty in the interest rate environment as additional borrowing from the domestic market goes to plug the deficit. Despite this, we do not expect upward pressure on interest rates due to increased demand for government securities, driven by improved liquidity in the market owing to the relatively high debt maturities. Our view is that investors should be biased towards medium-term fixed income instruments to reduce duration risk associated with long-term debt, coupled with the relatively flat yield curve on the long-end due to saturation of long-term bonds.
Market Performance
During the week, the equities markets had mixed performances with NASI remaining flat while NSE 20 and NSE 25 gained by 0.5% and 0.2%, respectively, taking their YTD performance to gains/ (losses) of 6.5%, (5.5%) and 2.1%, for NASI, NSE 20 and NSE 25, respectively. The performance in NASI was driven by declines in KCB Group, Co-op Bank and Safaricom which declined by (1.9%), (1.2%) and (0.4%), respectively, which offset the gains made in East Africa Breweries Limited (EABL), Standard Chartered Bank Kenya (SCBK) and Equity Group, which recorded gains of 1.9%, 1.8% and 1.3%, respectively.
Equities turnover increased by 17.2% during the week to USD 24.4 mn, from USD 20.9 mn the previous week, taking the YTD turnover to USD 816.1 mn. Foreign investors remained net sellers for the week, with the net selling position increasing by 36.1% to USD 6.4 mn, from USD 4.7 mn the previous week.
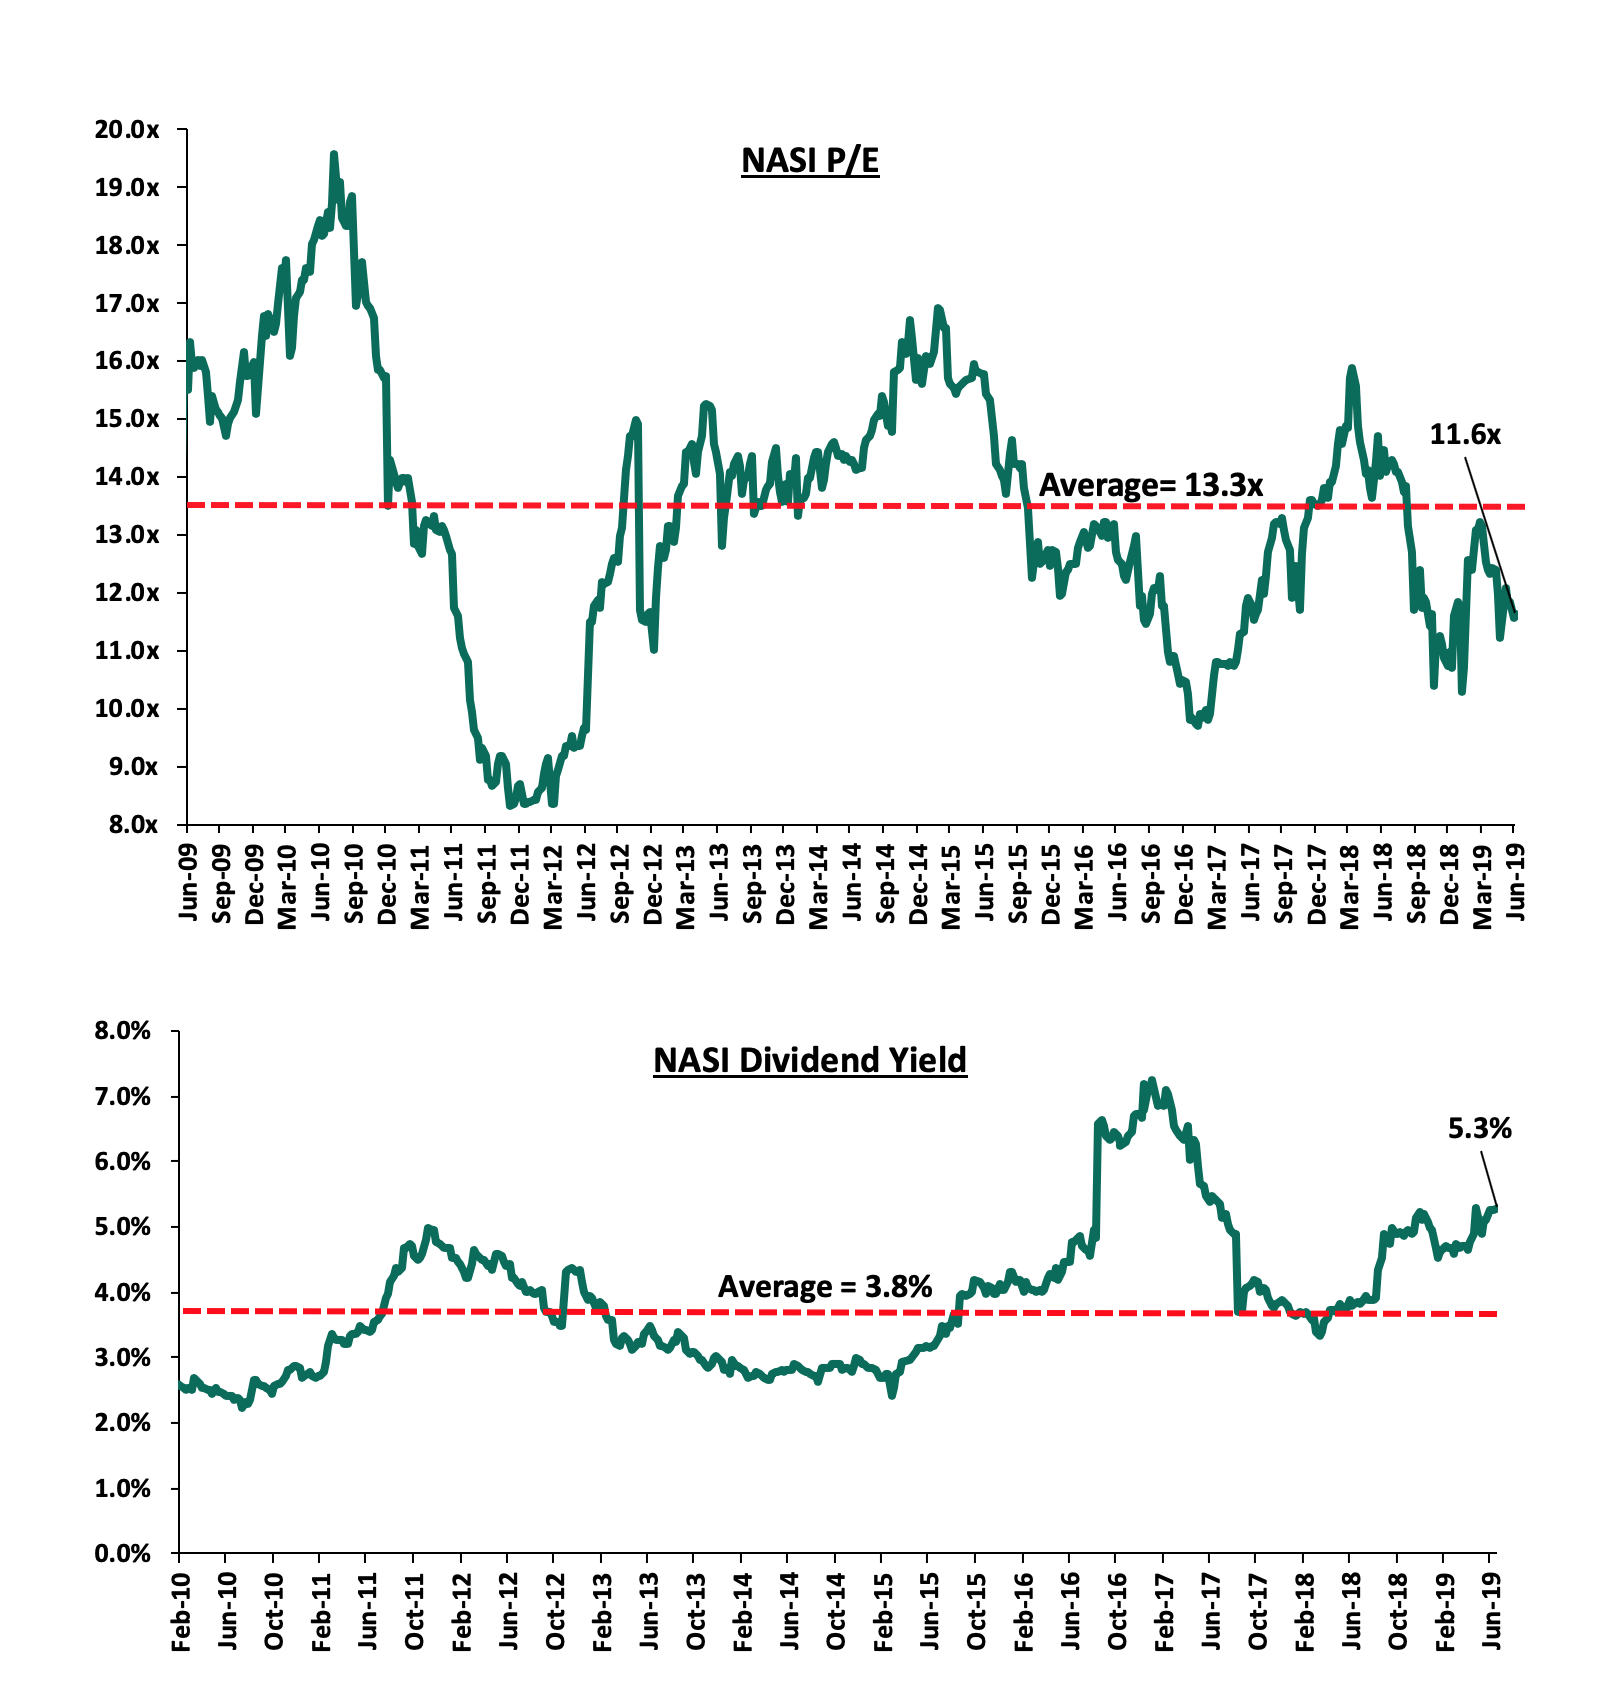
The market is currently trading at a price to earnings ratio (P/E) of 11.6x, 13% below the historical average of 13.3x, and a dividend yield of 5.3%, 1.5% points above the historical average of 3.8%. With the market trading at valuations below the historical average, we believe there is value in the market. The current P/E valuation of 11.6x is 19.4% above the most recent trough valuation of 9.7x experienced in the first week of February 2017, and 39.4% above the previous trough valuation of 8.3x experienced in December 2011. The charts below indicate the historical P/E and dividend yields of the market.
Weekly Highlights
During the week, the Kenya Bankers Association (KBA) released the State of Banking Industry Report 2019. The report gives the various factors that shaped the banking sector’s performance in 2018, the emerging trends, and the outlook for the sector going forward. The following are the key take-outs from the report:
- The banking sector recorded a 9.8% growth in total assets, faster than the 6.8% growth recorded in 2017, aided by the relative recovery in the economy in 2018, from the harsh economic environment experienced in 2017 largely due to extended electioneering period. Growth was largely supported by increased allocations to government securities, as loans and advances recorded a relatively slower 1.9% growth in 2018, compared to the 4.0% growth recorded in 2017,
- Deposits continued to record relatively strong growth, as they grew by 10.7% in 2018, compared to the 9.7% growth recorded in 2017. The growth in deposits was largely supported by relative better economic performance in 2018, coupled with increased usage and penetration of mobile and agency banking. Tier 3 banks recorded the fastest growth in deposits, which came in at 33.0%, faster than tier 1 and tier 2 banks, which recorded growths of approximately 8.0% and 10.0% in 2018, from growths of approximately 10.6%, 9.0% 9.0%, for tier 1, tier 2 and tier 3 banks in 2017, respectively. This is indicative of improved confidence in tier 3 banks, from the negative perception of the banks that stemmed from the collapse of banks witnessed between 2015 and 2016,
- The relatively slower growth in loans, coupled with faster growth in deposits has led to a decline in the Loan to Deposit Ratio (LDR) to 74.0% in 2018, from 80.0% in 2017. The decline in lending has largely been attributed to banks reallocating lending to the public sector, which offered better risk-adjusted returns than lending to the private sector. Reduced lending to the private sector has further been compounded by the asset quality deterioration over the last 3 years, with the Gross Non Performing Loans (NPL) ratio rising to 12.0% and 12.3% in 2018 and 2017, from 9.4% in 2016. Banks thus became relatively risk-averse and adopted relatively stringent credit policies to curb the rising NPLs, and consequently, avoid the associated provisioning expense,
- The relatively lower loans to deposit ratio points to the banking sector holding relatively higher liquidity, thus balancing the liquidity-profitability trade-off, given the reallocations to the more liquid, and relatively lower yielding government securities,
- The banking sector remains relatively well buffered, with a core capital to risk-weighted asset ratio of 17.0% in 2018, an increase from 16.0% as at 2017, and 6.5% points above the minimum statutory requirement of 10.5%. Total capital to risk-weighted assets stood at 18.0%, a decline from 19.0% as at 2017, and 3.5% points above the minimum statutory requirement of 14.5%. The decline in total capital is presumably due to the implementation of the new IFRS 9 reporting standard from January 2018, which required banks to provide for both incurred credit losses and the expected credit losses. Banks were allowed to charge the incremental provisions arising from the implementation of the IFRS 9 standard on their balance sheets over a 5-year period from 2018. Furthermore, Loan Loss Provisions (LLP) increased by 11.7% in 2018, as a result of the implementation of IFRS 9,
- An improved operating environment led to an improvement in the financial performance, with total operating income growing by 3.3%, a recovery from the 4.8% decline recorded in 2017. Total operating expenses declined by 4.0%, from the 0.1% increase recorded in 2017. The decline in expenses has largely been aided by the various restructurings done by banks, which involved staff layoffs and branch closures. The shift in focus to alternative channels of transactions also helped reduce expenses, as they led to reduced staff and branch demands, and,
- In terms of funding costs, the industry cost of funds remained relatively flat, at approximately 2.2%, with the various tiers averaging 1.9%, 2.5% and 3.0%, for tier 1, tier 2 and tier 3, respectively. The relatively cheaper funding cost for the large banks is largely due to the economies of the scale enjoyed by the banks, as they have been able to successfully deploy the agency and mobile banking models, which enables them to cheaply mobilize funds. Furthermore, the banks have specialized lines of credit from international organizations and Development Finance Institutions (DFIs), in addition to having access to capital markets, which is not available for the small banks.
In summary, we note that the sector remains resilient, in the face of various challenges experienced, such as the current regime of capped interest rates. Given the bi-directional influence between the performance of the banking sector and the economy, the performance of the banking sector is shaped by the influences of the economic conditions, macroeconomic policies adopted, and the regulatory environment. Key regulations such as the Banking (Amendment) Act 2015 will continue to affect the sector’s performance, mainly affecting the funded income segment. With a proposal to repeal the law currently included in the Finance Bill 2019, we continue to expect an amendment of the law, possibly in the way of an increase in the margin from the current 4.0% above the Central Bank Rate (CBR). We also expect continued focus on alternative channels of transactions, which have the benefits of improving operating efficiency by growing Non-Funded Income (NFI) and reducing operating expenses. Under the current regime, we expect banks to continue exploring new revenue lines, largely by way of consolidations and strategic partnerships with Financial Technology (FinTech) and telecommunication companies. Consolidation would further help banks strengthen their deposit franchise, access niche segments, improve their pricing power in the market, provide cost benefits brought about by scale, shore up their capital bases, and consequently drive sustainable long-term growth.
During the week, KCB Group released the offer document for the intended 100% acquisition of the National Bank of Kenya (NBK), and timelines for the acquisition. The expected timelines are as follows:
- Both the Central Bank of Kenya (CBK) and the Competition Authority of Kenya (CAK) are expected to grant their approvals by 30thJuly 2019,
- The offer has a closing date of 30th August 2019,
- The settlement of the swap transaction, where the swap ratio will be 1 KCB share for 10 NBK shares, will be done on the 12th September 2019 with the listing of additional KCB shares set for 16th September 2019.
Details of the transaction are as follows:
- The offer will be by way of a share swap at a ratio of 10:1, 10 ordinary shares of NBK for 1 ordinary share of KCB, whose shares are currently trading at Kshs 4.0 and Kshs 39.2, respectively as at 18th April 2019,
- NBK, which has both ordinary and preference shareholders, will have the preference shareholders convert their preference shares into new ordinary shares. The conversion ratio will be 1:1, i.e. 1 preference share for 1 ordinary share. With the number of preference shares at 1.13 bn, and the number of ordinary shares at 338.7 mn, this will imply a total of 1.47 bn ordinary shares post-conversion, and a dilution of 77.0% to the ordinary shareholders of NBK,
- Thus using the share swap ratio of 10:1, NBK’s 1.47 bn ordinary shares will be swapped for 147.4 mn KCB shares,
- KCB will thus have to issue an additional 147.4 mn ordinary shares to complete the share swap. This will increase KCB’s total shares outstanding to 3.21 bn shares from the current 3.06 bn shares, and current shareholders will be diluted by 4.6%,
- The implied transaction value will, therefore, be Kshs 5.6 bn, being the offer of 147.4 mn KCB shares at a price of Kshs 38.0, which was the adjusted volume-weighted average share price for KCB Group for the period of 180 days to 16th April 2019, and,
- As at Q1’2019, NBK had a book value of Kshs 7.2 bn. As such the transaction is being carried out at a price-to-book value (P/Bv) of 0.8x, which is a 38.5% discount to the current listed banks trading book value of 1.3x, and 42.9% below the historical average P/Bv of 1.4x for the Kenyan Bank Transactions in the last 5 years;
The table below indicates previous banking acquisition deals and their transaction multiples in the Kenyan banking industry;
|
Mergers and Acquisitions in Kenya |
||||||
|
Acquirer |
Bank Acquired |
Book Value at Acquisition (Kshs bns) |
Transaction Stake |
Transaction Value (Kshs bns) |
P/Bv Multiple |
Date |
|
KCB Group |
National Bank of Kenya |
7.2 |
100.0% |
5.6 |
0.8x |
19-Apr* |
|
CBA Group |
Jamii Bora Bank |
3.4 |
100.0% |
1.4 |
0.4x |
19-Jan* |
|
AfricInvest Azure |
Prime Bank |
21.2 |
24.2% |
5.1 |
1.0x |
19-Jan |
|
NIC Group |
CBA Group |
30.5** |
47:53*** |
18.0 |
0.6x |
19-Jan* |
|
KCB Group |
Imperial Bank |
Unknown |
Undisclosed |
Undisclosed |
N/A |
18-Dec |
|
SBM Bank Kenya |
Chase Bank Ltd |
Unknown |
75.0% |
Undisclosed |
N/A |
18-Aug |
|
DTBK |
Habib Bank Kenya |
2.4 |
100.0% |
1.8 |
0.8x |
17-Mar |
|
SBM Holdings |
Fidelity Commercial Bank |
1.8 |
100.0% |
2.8 |
1.6x |
16-Nov |
|
M Bank |
Oriental Commercial Bank |
1.8 |
51.0% |
1.3 |
1.4x |
16-Jun |
|
I&M Holdings |
Giro Commercial Bank |
3 |
100.0% |
5 |
1.7x |
16-Jun |
|
Mwalimu SACCO |
Equatorial Commercial Bank |
1.2 |
75.0% |
2.6 |
2.3x |
15-Mar |
|
Centum |
K-Rep Bank |
2.1 |
66.0% |
2.5 |
1.8x |
14-Jul |
|
GT Bank |
Fina Bank Group |
3.9 |
70.0% |
8.6 |
3.2x |
13-Nov |
|
Average |
|
|
78.3% |
|
1.4x |
|
|
* Announcement date |
||||||
|
** Book Value as of the announcement date |
||||||
|
*** Shareholder swap ratio between NIC and CBA, respectively |
||||||
From the table, we can see that Kenyan bank acquisition P/Bv average is at 1.4x, down from the previous 1.5x, as a result of the KCB-NBK Acquisition that was carried out at a lower P/Bv multiple. The average stake acquired is at 78.3%, up from 76.1%. Previously, transactions have taken place at a premium, (i) SBM and Fidelity at 57.0% above market, (ii) I&M Holdings and Giro at 30.8% above market, and (iii) M Bank and Oriental at 9.0% above market. Thus going forward, we expect acquisition transactions to take place at cheaper valuations. For NBK, the discount to the book value may be due to the bank’s high Non-Performing Loans ratio of 48.5% as at Q1’2019, and NBK’s deteriorating top line revenue, with the bank’s core lending activities constrained by its significantly low capitalization, with the banks total capital to risk-weighted assets coming in at 3.8% as at Q1’2019 compared to regulatory minimum of 14.5%.
- In our view, Kenya’s banking sector consolidation will continue to happen and it will lead to a more stable, safer banking sector. Smaller banks constrained in capital, and struggling in their operations are likely to continue receiving take-over offers, which would present the best case scenario to navigate the current competitive banking sector landscape. Transactions are happening at significantly cheaper valuations, perhaps due to the smaller banks’ relatively poor performance, leading to liquidity constraints, which may warrant even further capital injections, hence the cheaper acquisition costs. For more information on Banking Sector consolidation and Performance, see our Q1’2019 Kenya Listed Banking Report.
Universe of Coverage
Below is a summary of our SSA universe of coverage:
|
Banks |
Price as at 05/07/2019 |
Price as at 12/07/2019 |
w/w change |
YTD Change |
Target Price |
Dividend Yield |
Upside/ Downside |
P/TBv Multiple |
Recommendation |
|
Diamond Trust Bank |
116.0 |
116 |
0.0% |
(25.9%) |
228.4 |
2.2% |
96.2% |
0.6x |
Buy |
|
CRDB |
110.0 |
105.0 |
(4.5%) |
(30.0%) |
207.7 |
0.0% |
88.8% |
0.4x |
Buy |
|
UBA Bank |
6.1 |
5.9 |
(2.5%) |
(23.4%) |
10.7 |
14.4% |
87.0% |
0.4x |
Buy |
|
Zenith Bank |
19.3 |
19.0 |
(1.6%) |
(17.6%) |
33.3 |
14.2% |
82.5% |
0.8x |
Buy |
|
KCB Group*** |
40.0 |
39.3 |
(1.9%) |
4.8% |
60.4 |
8.9% |
66.9% |
1.0x |
Buy |
|
GCB Bank |
4.9 |
5.0 |
0.2% |
7.6% |
7.7 |
7.7% |
64.3% |
1.2x |
Buy |
|
I&M Holdings |
59.5 |
55.0 |
(7.6%) |
29.4% |
81.5 |
6.4% |
54.5% |
1.0x |
Buy |
|
Access Bank |
6.6 |
6.7 |
1.5% |
(1.5%) |
9.5 |
6.0% |
52.1% |
0.4x |
Buy |
|
Co-operative Bank |
12.3 |
12.1 |
(1.2%) |
(15.4%) |
17.1 |
8.3% |
50.4% |
1.0x |
Buy |
|
Equity Group |
40.0 |
40.6 |
1.3% |
16.4% |
53.7 |
4.9% |
42.7% |
1.7x |
Buy |
|
NIC Group |
30.3 |
30.5 |
0.8% |
9.7% |
42.5 |
3.3% |
42.2% |
0.6x |
Buy |
|
CAL Bank |
1.0 |
1.0 |
(5.0%) |
(3.1%) |
1.4 |
0.0% |
40.0% |
0.8x |
Buy |
|
Barclays Bank |
10.3 |
10.3 |
0.5% |
(5.9%) |
12.8 |
10.7% |
33.1% |
1.2x |
Buy |
|
Stanbic Bank Uganda |
29.0 |
28.8 |
(0.6%) |
(7.0%) |
36.3 |
4.1% |
29.1% |
2.0x |
Buy |
|
SBM Holdings |
5.5 |
5.6 |
0.7% |
(6.7%) |
6.6 |
5.4% |
23.0% |
0.8x |
Buy |
|
Guaranty Trust Bank |
29.4 |
29.9 |
1.9% |
(13.2%) |
37.1 |
8.0% |
20.8% |
1.9x |
Buy |
|
Stanbic Holdings |
100.0 |
100.0 |
0.0% |
10.2% |
113.6 |
5.9% |
20.6% |
1.1x |
Buy |
|
Ecobank |
7.6 |
7.5 |
(0.7%) |
0.0% |
10.7 |
0.0% |
19.2% |
1.6x |
Accumulate |
|
Union Bank Plc |
6.9 |
7.5 |
8.7% |
33.9% |
8.2 |
0.0% |
16.4% |
0.8x |
Accumulate |
|
Standard Chartered |
194.0 |
198.0 |
1.9% |
1.8% |
200.6 |
6.3% |
9.5% |
1.4x |
Hold |
|
Bank of Kigali |
274.0 |
275.0 |
0.4% |
(8.3%) |
299.9 |
5.0% |
8.5% |
1.5x |
Hold |
|
FBN Holdings |
6.3 |
6.0 |
(4.0%) |
(24.5%) |
6.6 |
4.2% |
5.4% |
0.3x |
Hold |
|
Bank of Baroda |
127.8 |
128.0 |
0.1% |
(8.6%) |
130.6 |
2.0% |
3.4% |
1.1x |
Lighten |
|
Standard Chartered |
19.3 |
19.3 |
0.0% |
(8.3%) |
19.5 |
0.0% |
2.3% |
2.4x |
Lighten |
|
National Bank |
4.1 |
4.1 |
(0.2%) |
(23.1%) |
3.9 |
0.0% |
(4.8%) |
0.2x |
Sell |
|
Stanbic IBTC Holdings |
40.3 |
40.0 |
(0.6%) |
(16.6%) |
37.0 |
1.5% |
(6.6%) |
2.1x |
Sell |
|
Ecobank Transnational |
9.9 |
10.0 |
0.5% |
(41.5%) |
9.3 |
0.0% |
(15.6%) |
0.4x |
Sell |
|
HF Group |
4.0 |
4.3 |
7.0% |
(22.6%) |
2.9 |
0.0% |
(27.7%) |
0.2x |
Sell |
|
*Target Price as per Cytonn Analyst estimates **Upside / (Downside) is adjusted for Dividend Yield ***Banks in which Cytonn and/or its affiliates are invested in ****Stock prices indicated in respective country currencies |
|||||||||
We are “Positive” on equities for investors as the sustained price declines have seen the market P/E decline to below its historical average. We expect increased market activity, and possibly increased inflows from foreign investors, as they take advantage of the attractive valuations to support the positive performance.
During the week, Sterling Capital, a Kenyan-based investment bank acquired a 20.0% stake in Afvest, a Nairobi-based emerging markets private equity firm, for an undisclosed value. Afvest focuses on early-stage businesses in the financial services, energy, agri-processing and technology sectors. This acquisition is in line with the two firms’ strategy of investing in early-stage businesses and entrepreneurs with the potential to generate high returns. In 2018, Afvest launched a Kshs 250.0 mn fund for long-term investment in early-stage businesses with the potential to generate at least 25.0% annual return on investment. In March 2019, Sterling Capital announced that they would launch a Kshs 2.0 bn hedge fund, with backing from Kuramo Capital, a New York-based private equity firm, which holds a minority equity stake in the firm since August 2018. Sterling Capital would operate the hedge fund by raising money from institutions and high net-worth individuals. The hedge fund is expected to focus on a wide range of assets and strategies, including derivatives that have recently been launched at the NSE, and on investments in the small and medium-sized enterprises (SME) sector or business with capital requirements of less than Kshs 50.0 mn. For Sterling Capital, this acquisition will diversify its investment portfolio which mainly consists of equities and bonds into the small and medium-sized enterprises (SMEs) segment.
In fundraising, OPay, a Nigerian based mobile payment platform, has raised USD 50.0 mn (Kshs 5.1 bn) in its first round of funding. The startup, founded by Norwegian browser company Opera in 2018, aims to use the capital for expansion to other African Markets including Tanzania, Ghana and South Africa where Opera reaches 120 mn customers across the region and to support Opera’s commercial network in Nigeria which includes ORide, a motorcycle ride-hailing app and OFood, a food delivery service application. This round of funding was led by the following Chinese firms; IDG Capital, a venture capital firm, Sequoia China, a technology investment firm; Source Code Capital, an emerging markets venture capital firm, Meituan-Dianping, a retail company; GSR Ventures, a early-stage technology venture capital firm; and, the founding company, Opera Limited. OPay has built a leading mobile payments platform in Nigeria with more than 40,000 active agents with daily transaction volumes in excess of USD 5.0 mn (Kshs 514.8 mn).
Rent-to-Own (RTO), a Zambia based asset-financing company, secured a EUR 1.0 mn (Kshs 116.0 mn) investment from the seed capital and business development facility of the Dutch Good Growth Fund (DGGF), managed by Triple Jump B.V, a Netherlands-based impact investment manager. Rent-to-Own provides high-impact assets to small scale entrepreneurs and smallholder farmers in rural Zambia. This follows last year’s seed round funding of USD 1.1 mn (Kshs 113.2 mn), which was led by AAHL Venture Partners, an African impact investing venture capital firm, with participation from Small Foundation and Jordan Engineering, through its investment arm, Serenity Investments.
In our view, the continued investment in (i) FinTech by international firms point to the growing need for financial services among the unbanked in Sub-Saharan Africa, and (ii) early-stage businesses and entrepreneurs points to the growing need of capital and technical support within this segment and private equity firms looking to increase revenue by focusing on this segment of clients. We expect:
- Investments in the FinTech sector to continue as technology companies offer better cost efficiency and the customer experience in providing financial services; and
- Investments in early-stage businesses and entrepreneurs to continue owing to the continued need for capital and potential for the segment to generate high returns on investment.
Private equity investments in Africa remains robust as evidenced by the increasing investor interest, which is attributed to; (i) rapid urbanization, a resilient and adapting middle class and increased consumerism, (ii) the attractive valuations in Sub Saharan Africa’s private markets compared to its public markets, (iii) the attractive valuations in Sub Saharan Africa’s markets compared to global markets, and (iv) better economic projections in Sub Sahara Africa compared to global markets. We remain bullish on PE as an asset class in Sub-Sahara Africa. Going forward, the increasing investor interest and a stable macroeconomic environment will continue to boost deal flow into African markets.
- Residential Sector
During the week, Stima Investment Cooperative, a local investments company, was appointed as the lead sales agent of Pangani Heights, one of the seven Nairobi Urban Regeneration Projects under the affordable housing initiative. The development set on 5.2 acres along Ring Road Ngara, was launched in December 2018 and was awarded to Technofin Kenya as the lead developer. The project construction is expected to begin in August 2019 and will consist of 1,434 units, comprising of social and low-cost units. The social units will comprise of 25 SQM- 1-bed and 50 SQM- 2-bed units at Kshs 1 mn and Kshs 2.5 mn, respectively, translating to Kshs 45,000 per SQM. The low-cost units will comprise of 30 SQM- 1-bed, 40 SQM- 2-bed, 60 SQM- 3-bed and 90 SQM- 3-bed duplex units, selling at Kshs 1.5 mn, Kshs 2.25 mn, Kshs 3.0 mn and Kshs 7.5 mn, respectively, translating to Kshs 59,896 per SQM. According to Stima Investment Cooperative, in order for prospective buyers to be eligible they must; (i) be members of Stima Investment Co-operative Society, and (ii) earn a basic salary of not more than Kshs 100,000 p.m.
As per the Kenyan Government affordable housing development framework, the affordable housing units target the following income group categories as follows:
- Social Housing: (individuals earning up to Kshs 19,999),
- Low-Cost Housing: (Kshs 20,000 – Kshs 49,999),
- Mortgage Gap: (Kshs 50,000 – Kshs 149,999).
Individuals who fall under social and low-cost housing categories will acquire homes through Tenant Purchase Schemes while those earning above Kshs 50,000 will purchase through low-interest rate mortgage loans. According to State Housing and Urban Development, individuals will be acquiring the units through a rent-to-own model with monthly payments at an interest rate of 3.0%-7.0% p.a., however it is not yet clear how the funding for the low interest rates will be sourced.
For the investor and developers, the expected returns are 5.3% on average for lower mid-end apartments according to Cytonn research 2018/2019.
|
Residential Apartment Performance Summary 2018/2019: Y/Y Change |
|||||||||
|
Segment |
Average Rental Yield 2018/19 |
Average Y/Y Price Appreciation 2018/19 |
Average Total Returns 2018/19 |
Average Rental Yield 2017/18 |
Average Y/Y Price Appreciation 2017/18 |
Average Total Returns 2017/18 |
Change in Rental Yield |
Change in Y/Y Price Appreciation |
Change in Total Returns |
|
Apartments: Upper Mid-End |
5.0% |
0.4% |
5.3% |
6.0% |
2.9% |
8.8% |
-1.0% |
-2.6% |
-3.5% |
|
Apartments: Lower Mid-End |
4.8% |
0.4% |
5.3% |
5.6% |
3.1% |
8.7% |
-0.8% |
-2.7% |
-3.5% |
|
Apartments: Satellite Towns |
4.5% |
0.6% |
5.1% |
5.9% |
2.7% |
8.5% |
-1.4% |
-2.1% |
-3.4% |
|
Residential Market Average |
4.8% |
0.5% |
5.2% |
5.8% |
2.9% |
8.7% |
-1.1% |
-2.5% |
-3.5% |
Source: Cytonn Research 2019
With the continued government incentives in support of the affordable housing initiative, we expect to see increased developments in the lower and middle-income segment of the market as developers tap into government incentives to maximize returns amid the falling performance in the upper and high-end markets.
- Retail Sector
Kenya’s retail sector has been vibrant over the past few years, attracting interest from renowned international retailers as well as the robust expansion of local retailers. In line with this, during the week, Naivas Supermarkets, a local supermarket chain, opened their latest outlet in Ongata Rongai, Kajiado County. The 8,000 SQFT store is the retailer’s 53rd store in Kenya. The continued expansion of local retailers is supported by; (i) the improving macroeconomic environment, with the country’s GDP growing by 6.3% in 2018, 1.4% points higher than 4.9% recorded in 2017, (ii) Increased disposable income as a result of an expanding middle class thus creating demand for goods and services, with GDP per Capita growing at a CAGR of 10.3% p.a. over the last 4-years, from Kshs 125,756 in 2014 to Kshs 186,296 in 2018, and (iii) the exit of struggling local retailers, such as Nakumatt and Uchumi, leaving prime locations for occupation, creating an easy gap for the international retailer’s expansion.
In our view, satellite towns such as Ongata Rongai, Kitengela and Ruaka, are increasingly presenting a viable opportunity to retailers due to: (i) low rental charges of Kshs 129 per SQFT in H1’2019 compared to market average at 170 per SQM hence maximizing on profits, and (ii) positive demographics with these areas acting as the Nairobi dormitory areas thus creating a demand for consumer goods & retail services.
For investors in retail real estate, with an average rent of Kshs 129 per SQFT, retail space in Satellite Towns, records rental yield of 5.7%, 2.5% points lower than the market average of 8.2%, with an average occupancy rate of 69.2% compared to the market average of 75.6%. The poor performance in satellite towns is mainly attributable to the competition from the informal retail stalls such as kiosks. We, however, expect the performance in these areas to improve as they attract middle-income earners looking for affordability in the housing sector, hence boosting adoption of the formal retail in the location.
The table below shows a summary of Nairobi’s Retail Market Performance in H1’2019:
(All Values in Kshs Unless Stated Otherwise)
|
Summary of Nairobi’s Retail Market Performance H1’ 2019 |
||||||||||
|
Location |
Rent Kshs/SQFT H1’ 2019 |
Occupancy H1’ 2019 |
Rental Yield H1’ 2019 |
Rent Kshs/SQFT FY’ 2018 |
Occupancy FY’ 2018 |
Rental Yield FY’ 2018 |
H1’ 2019 ∆ in Rental Rates |
H1’ 2019 ∆ in Occupancy (% points) |
H1’ 2019 ∆ in Rental Yield (% points) |
|
|
Westlands |
209 |
89.0% |
12.0% |
219 |
82.2% |
12.2% |
(4.7%) |
6.8% |
(0.2%) |
|
|
Kilimani |
173 |
91.4% |
10.5% |
167 |
97.0% |
10.7% |
3.6% |
(5.6%) |
(0.2%) |
|
|
Ngong Road |
171 |
87.5% |
9.3% |
175 |
88.8% |
9.7% |
(2.3%) |
(1.3%) |
(0.4%) |
|
|
Karen |
219 |
71.8% |
8.8% |
225 |
88.8% |
11.0% |
(2.5%) |
(17.0%) |
(2.2%) |
|
|
Eastlands |
145 |
74.2% |
7.5% |
153 |
64.8% |
6.8% |
(5.6%) |
9.4% |
0.7% |
|
|
Kiambu Road |
169 |
65.3% |
7.3% |
183 |
69.5% |
8.1% |
(7.6%) |
(4.2%) |
(0.8%) |
|
|
Thika road |
168 |
66.5% |
6.8% |
177 |
75.0% |
8.3% |
(5.4%) |
(8.5%) |
(1.5%) |
|
|
Mombasa road |
144 |
65.5% |
6.3% |
162 |
72.4% |
7.9% |
(10.7%) |
(6.9%) |
(1.6%) |
|
|
Satellite Towns |
129 |
69.2% |
5.7% |
142 |
73.7% |
6.7% |
(9.2%) |
(4.5%) |
(1.0%) |
|
|
Average |
170 |
75.6% |
8.2% |
178 |
79.1% |
9.0% |
(4.9%) |
(3.5%) |
(0.8%) |
|
|
· The sector’s performance softened, with yields declining by 0.8% points in H1’ 2019, as a result of an oversupply of retail space, currently at 2.0mn SQFT leading to a 3.5% points decline in occupancy levels, · The sector recorded a decline in rental rates by 4.9% to Kshs 170 per SQFT in H1’2019 from Kshs 178 per SQFT in FY’2018 attributable to property managers’ adoption of innovative pricing models such as reducing rental charges and rent-free grace periods of up to 6 months in order to attract tenants, · Satellite towns recorded a 9.2% decline in rental charges to Kshs 129 per SQFT in H1’2019 from Kshs 142 per SQFT in FY’2018. |
||||||||||
Source: Cytonn Research 2019
We maintain a neutral outlook for the real estate sector supported by; (i) the continued entry and expansion of local and international retailers, (ii) the improving infrastructure, (iii) positive demographics and (iv) a stable economic environment. The investment opportunity lies in the lower mid-end residential sectors, which continue to exhibit fast growing demand from the majority of Kenyans seeking to buy affordable homes amidst a tough financial environment.
This week, we look at performance in the residential sector over the 2018/2019 period, as we update the findings of the Nairobi Metropolitan Area Residential Report 2017/2018, which we released in July 2018. According to the report, residential sector in 2017/2018 registered an average return to investors of 8.2% (price appreciation and rental yields of 2.8% and 5.4%, respectively), which was 1.2% points lower than 9.4% in 2016/2017 (rental yields and capital appreciation of 5.6% and 3.8%, respectively). The decline in performance was attributed to a tough macroeconomic environment characterized by relatively low private sector credit growth, and the spillover effects of the protracted 2017 political elections.
This year, we update the findings of the 2017/2018 report by looking at the residential market performance in 2018/2019 covering 41 markets across the Nairobi Metropolitan Area. As such, we shall cover the following:
- Overview of the Residential Sector,
- Market Performance in the Residential Sector,
- Investment opportunity in the Sector, and,
- Outlook and Conclusion.
- Overview of The Residential sector
According to the March 2019 issue of the KNBS Leading Economic Indicator, the residential sector posted a 10.3% drop in the value of approvals to Kshs 33.0 bn in Q1’2019, from Kshs 36.8 bn in Q1’2018, an indicator of decreased building activity in the sector. However, the entire real estate market also posted a decline in contribution to the national GDP, which came in at 11.3% in Q1’2019, from 14.4% in Q4’2018 and 12.4% in FY’2018. From our research, transaction volumes were also on the decline with average residential unit’s annual uptake coming at 20.9%, in comparison to 23.3% in 2017/2018.
- Residential Sector Trends in 2018/2019
Below, we recapture key developments that occurred in the residential sector:
- Launching of the Kenya Mortgage Refinancing Company: The National Treasury officially launched the Kenya Mortgage Refinancing Company in June 2019. The company is set to enhance mortgage affordability in Kenya by enabling long-term loans at attractive market rates through the provision of affordable long-term funding and capital market access to primary mortgage lenders such as banks and financial co-operatives. However, as per our Note, in addition to the availability of low-cost homes in the market, the right amount of investing in the capital markets to be able to realize its funding needs, is needed to ensure KMRC achieves its objectives,
- Launch of the Boma Yangu Portal: National Housing Corporation established the Boma Yangu portal where all stakeholders in the housing sector, including end-buyers and investors, interact with the Housing Fund. The portal will also serve as evidence of aggregating demand from potential homebuyers to developers and other investors in the affordable housing initiative, while also serving as a platform for prequalifying eligible individuals for the affordable homes under development,
- National Housing Development Fund: During the period, the proposed Housing Fund levy was increased to 1.5% from the initial 0.5%. However, this yet to be affected due to public opposition as to its being a mandatory contribution while remaining unclear as to how the contributors shall benefit. For our analysis on this, see here
- Statutory Changes: In regards to housing, the President of Kenya signed various bills into law, including (i) Amendment of the Income Tax Act to allow buyers get a 15.0% tax relief up to a maximum of Kshs 108,000 p.a., or Kshs 9,000 p.m., under the introduced Affordable Housing Relief section, and, (ii) Amendment of the Stamp Duty Act, to allow for exemption of first time homebuyers under the affordable housing scheme from paying the Stamp Duty Tax, which is normally set at 2.0% - 4.0% of the property value depending on the location,
- Capital Gains Tax Increment: The National Treasury through the Finance Bill 2019 proposed to increase Capital Gains Tax from 5.0% to 12.5%. If enacted, the increase will have only negative effects on real estate investors, which is already burdened by financial constraints. Therefore, the tax will most likely lead to a decline in transaction volumes as it (i) as investors attempt to avoid paying the increased tax, and (ii) will lead to a hike in prices as the liability will be transferred to the end buyers.
We expect the focus on affordable housing to intensify with developers scaling back on upscale markets to partner with the government to tap into the low-end markets where the majority of the housing deficit falls.
- Factors Influencing Residential Demand
Going forward, we expect the following factors to shape demand:
- Access to Mortgages: With the stringent lending practices, private sector credit still remains low with April 2019 posting 4.9% as at April 2019, compared to a five-year average of 14.0%. However, with the launch of the Kenya Mortgage Refinance Company (KMRC), which occurred in June 2019, we expect growth in the primary mortgage market, which according to Central Bank of Kenya, has 26,187 mortgages as at 2017 out of a total adult population of 23.0 mn persons,
- Demographic Growth: The housing deficit in the Nairobi Metropolitan Area is expected to come in at 2.1 mn units in 2019 according to our estimations, compared to 2.0 mn in 2018, owing to a rapid population growth rate and high urbanization rate at 2.6% and 4.3%, respectively, compared to a global average of 1.2% and 2.1%, respectively. The high demographic growth is expected to continue sustaining demand for more dwelling units with 97.1% of the demand being in the lower mid-end and low-end segments, who according to KNBS Statistics, earn below Kshs 50,000 p.m.,
- Purchasing Power: The Kenyan economy expanded by 6.3% in 2018 and according to KNBS Economic Survey 2019, average real earnings grew by 3.2% in that period, in comparison to a 2.7% decline in 2017. The increasing household incomes have increased demand for formal housing, thus pushing prices up, albeit marginally in the period under review due to a tough economic environment as a result of a persistent drought, driving the cost of living up.
Therefore, we expect positive demographic growth coupled with growing disposable incomes to support residential demand. However, our outlook on the anticipated KMRC effect occurring this year on the mortgage market is neutral due to government delays in fully rolling it out.
- Factors Influencing Residential Supply
The following factors are likely to affect the level of supply going forward:
- Government Incentives: The affordable housing initiative has gained substantial progress in 2018/2019 period. However, with the initiative lagging behind on its timelines ahead of 2022, we, therefore, expect to see more government incentives geared towards creating an enabling environment for developers to roll out more mass housing projects within the short period remaining, while also improving the land sector’s efficiency, particularly through digitization. The unlocking of prime government-owned land for development by private developers as well as continued infrastructural support should encourage more development activity, while also enabling the delivery of actual affordable homes,
- High Development Costs: Development costs remain high subject to high land and financing costs. According to Cytonn Markets Review H1'2019, the average land price per acre within Nairobi County is currently at Kshs 220.3 mn, compared to Satellite Town’s average of Kshs 23.7 mn per acre. Additionally, despite continued infrastructural improvements, developers still continue to face challenges in form of insufficient sewer lines, access roads and water supply,
- Access to Finance: With the interest rates cap law still in effect, we expect developers to continue experiencing barriers to adequate financial access, which is expected to affect housing supply in 2019. We, therefore, expect to see developers opting for alternative sources of finance such as Real Estate Investment Trusts and more partnerships with foreign investment institutions seeking to enter the market, and local pension funds seeking to diversify their investments with their growing portfolio of assets under management.
We expect reduced supply in the high-end and upper mid-end sectors given the existing supply against waning demand with developers shifting focus to differentiated concepts such as mixed-use developments, especially in the upper mid-end markets, as well as niche markets in the lower mid-end and low-end segments, which have the highest uptake, thus potential for better returns.
- Market Performance in the Residential Sector
To gauge residential performance in 2018/2019, we carried out research in 41 areas within the Nairobi Metropolitan Area (NMA).
In our submarket analysis, we classified the various suburbs in the Nairobi Metropolitan Area into three segments:
- High-End Segment – Consists of prime suburbs in Nairobi, such as Karen, Runda and Kitisuru. Most of these zones have been zones for low rise residential developments, and are characterized by palatial villas and bungalows on half acre parcels,
- Upper Middle-Income Segment – Consists of suburbs such as Kilimani, Lavington, Kileleshwa, Loresho and Ridgeways, among others. The population in these zones are middle class but with higher incomes than the average characterization of the middle class. They are zones for both high rise and low-density houses, and,
- Lower Middle-Income Segment – Consists of suburbs in Nairobi habited by middle class such as Kahawa West, Imara Daima, as well as Satellite Towns such as Ngong, Ruiru, and Juja.
We also analyzed detached units and apartments separately;
- Detached units refer to stand-alone houses such as townhouses, maisonettes and bungalows, and,
- Apartments refer to self-contained housing units occupying part of a building, also called flats.
According to the research, prices in the NMA region appreciated marginally by 0.3% in 2018/2019, which is 2.5% points lower than the 2.8% growth recorded in 2018. The sluggish growth in capital gains could be attributed to the tough financial environment in Kenya on account of the interest rates capping law, with has led to stringent underwriting practices by lending institutions affecting homebuyers, hence a decline in effective demand. In addition, increased residential stock in some markets, especially high-end and upper mid-end segments, has slowed down the rate of price appreciation as supply surpasses effective demand. Rental yields in 2018/19 declined by 1.1% points, coming in at 4.3%, on average, from 5.4% in 2017/2018. We attribute this to increased supply stock, especially in high-end and upper mid-end markets, leading to investors having to keep rents stable at an average of Kshs 532 per SQM to attract and retain existing clients, while prices have generally been increasing from an average of Kshs 109,000 per SQM in 2017/2018 to approximately Kshs 119,000 per SQM in 2018/2019.
Therefore, on the overall performance, with price appreciation of 0.3% in 2018/19 and rental yields averaging at 4.3%, total returns per annum in the residential market averaged at 4.7%, with the best performing market being Ruaka which posted 8.0%.
(All Values in Kshs Unless Stated Otherwise)
|
Residential Performance Summary 2018/2019 |
||||||||
|
Segment |
Typology |
Average Price Per SQM |
Average Rent Per SQM |
Average Annual Uptake |
Average Occupancy |
Average Rental Yield |
Average Y/Y Price Appreciation |
Average Total Returns |
|
High End |
Detached |
201,275 |
735 |
18.5% |
83.5% |
3.7% |
0.1% |
3.8% |
|
Upper Mid-End |
Detached |
142,303 |
535 |
21.5% |
87.5% |
4.1% |
0.1% |
4.2% |
|
Lower Mid-End |
Detached |
77,396 |
335 |
18.5% |
73.3% |
3.9% |
0.4% |
4.3% |
|
Upper Mid-End |
Apartments |
129,598 |
720 |
25.6% |
82.7% |
4.9% |
0.4% |
5.3% |
|
Lower Mid-End |
Apartments |
88,731 |
472 |
20.0% |
85.9% |
4.8% |
0.4% |
5.3% |
|
Satellite Towns |
Apartments |
76,676 |
395 |
21.4% |
79.6% |
4.5% |
0.6% |
5.1% |
|
Residential Market Average |
119,330 |
532 |
20.9% |
82.1% |
4.3% |
0.3% |
4.7% |
|
|
The residential market has an average total return of 4.7% in 2017/18 with rental yield averaging at 4.3% while price appreciating averaged at 0.3%. |
||||||||
Source: Cytonn Research
Price appreciation declined by 2.5% points y/y to 0.3% p.a., from 2.8% in 2017/2018, while rental yields declined by 1.1% points to 4.3% from 5.4% in 2017/2018. The low performance compared to prior years is due to a challenging financial environment, leading to sluggish growth in prices and uptake. However, innovative investment methods such as off-plan purchases are guaranteed to offer double-digit returns albeit in niche markets. Thus, investors ought to conduct market research to identify niches in the market.
|
Residential Performance Summary 2018/2019: Y/Y Change |
|||||||||
|
Segment |
Average Rental Yield 2018/19 |
Average Y/Y Price Appreciation 2018/19 |
Average Total Returns 2018/19 |
Average Rental Yield 2017/18 |
Average Y/Y Price Appreciation 2017/18 |
Average Total Returns 2017/18 |
Change in Rental Yield |
Change in Y/Y Price Appreciation |
Change in Total Returns |
|
Detached: High-End |
3.7% |
0.1% |
3.8% |
4.7% |
3.5% |
8.3% |
(1.0%) |
(3.4%) |
(4.5%) |
|
Detached: Upper Mid-End |
4.1% |
0.1% |
4.2% |
5.1% |
2.4% |
7.5% |
(1.0%) |
(2.3%) |
(3.3%) |
|
Detached: Lower Mid-End Satellite Towns |
3.9% |
0.4% |
4.3% |
5.0% |
2.0% |
7.0% |
(1.1%) |
(1.6%) |
(2.7%) |
|
Apartments: Upper Mid-End |
5.0% |
0.4% |
5.3% |
6.0% |
2.9% |
8.8% |
(1.0%) |
(2.6%) |
(3.5%) |
|
Apartments: Lower Mid-End |
4.8% |
0.4% |
5.3% |
5.6% |
3.1% |
8.7% |
(0.8%) |
(2.7%) |
(3.5%) |
|
Apartments: Satellite Towns |
4.5% |
0.6% |
5.1% |
5.9% |
2.7% |
8.5% |
(1.4%) |
(2.1%) |
(3.4%) |
|
Residential Market Average |
4.3% |
0.3% |
4.7% |
5.4% |
2.8% |
8.1% |
(1.1%) |
(2.5%) |
(3.5%) |
|
Overall change in prices in the residential market came in at 0.3%, 2.5% points lower than the 2.8% change in 2018 attributable to a tough financial environment which has negatively affected effective demand thus driving prices down as developers attempt to sell old stock Average market rental yields also declined to 4.3% in 2018/19 from 5.4% in 2017/18. This is as rental charges have remained flat as developers try to attract and retain the existing clients as well as declining occupancy rates in the face of growing residential stock Apartments in the upper mid-end and lower mid-end sector registered the highest returns owing to continued demand for housing from the constantly growing middle class Detached units in high-end market registered the slowest growth in prices at 0.1% in 2018/19 in comparison to 3.5%, the previous year on account of increasing supply surpassing effective demand |
|||||||||
Source: Cytonn Research
- Detached Units Performance
Detached units registered average total returns of 4.1%, 0.6% points lower than the residential market average of 4.7%. This is attributable to slow price growth owing to decline in demand for maisonettes and bungalows, possibly due to the growing need for affordability with apartments costing Kshs 98,335 per SQM compared to detached units at Kshs 140,325 per SQM. This is evidenced by the lower annual uptake of 20.0%, in comparison to apartments with 22.3%.
The high-end market registered average price appreciation of 0.1% and a rental yield of 3.7%, thus average annual returns of 3.8%, 4.5% points lower than 8.3% in 2017/18. The subdued returns are attributable to increased supply amidst stagnated demand.
Upper mid-end markets registered average rental yields of 4.1% and a price appreciation of 0.1%, thus average annual returns of 4.2%, and also registered the highest average annual uptake in the detached category at 26.5%, owing to demand from the growing middle class as evidenced by relatively high annual uptake in markets like Lavington and Runda Mumwe at 27.3% and 26.4%, respectively.
Lower mid-end satellite areas posted the highest average price appreciation for detached units at 0.4%, compared to the detached market average of 0.2%, due to increased demand for units in these areas boosted by infrastructural improvements, and affordability in comparison to the upper markets.
Loresho and Ruiru markets registered the highest returns in the detached unit’s market with 6.2% and 6.0%, respectively. Loresho appeal to investors is attributable to its proximity to neighborhoods such as Kitisuru, thus, attracting the middle-income class clientele seeking exclusivity but in relatively affordable areas. The area is also well-connected with the newly finished Westlands Link Road boosting accessibility hence increased prices. Ruiru’s performance is on account of the presence of good infrastructure such as the Eastern bypass, Thika Superhighway for Ruiru, and upcoming master-planned cities, such as Tatu City and Northlands driving speculative demand due to expected developments in terms of infrastructure and social amenities.
Juja and Rosslyn registered the lowest returns with 0.7% and 1.7%, respectively. Rosslyn continues to face challenges in form of competition from other surrounding neighborhoods such as Gigiri, Runda, and Muthaiga in addition to the market’s inadequacy in terms of what it offers investors while Juja’s decline is attributable to declined effective demand in the area as a result of competition from other satellite towns, namely Ruiru, and its increased densification due to demand by the relatively high student population in the area.
The performance of detached units in Nairobi Metropolitan Area is as summarized below;
(All values in Kshs Unless Stated Otherwise)
|
Nairobi Metropolitan Area Detached Units Performance 2018/2019 |
|||||||
|
Area |
Average Price per SQM |
Average Rent per SQM |
Average Annual Uptake |
Average Occupancy |
Average Rental Yield |
Average Price Appreciation |
Average Total Returns |
|
Runda |
234,697 |
888 |
17.8% |
83.8% |
4.0% |
1.8% |
5.8% |
|
Karen |
205,087 |
659 |
20.0% |
76.6% |
3.0% |
1.8% |
4.8% |
|
Kitisuru |
223,310 |
903 |
19.4% |
83.3% |
3.7% |
(0.4%) |
3.2% |
|
Rosslyn |
178,237 |
757 |
19.1% |
84.3% |
4.3% |
(2.6%) |
1.7% |
|
Lower Kabete |
165,043 |
467 |
16.3% |
89.5% |
3.3% |
0.0% |
3.3% |
|
High–End Average |
201,275 |
735 |
18.5% |
83.5% |
3.7% |
0.1% |
3.8% |
|
Loresho |
146,540 |
575 |
17.5% |
94.6% |
4.5% |
1.7% |
6. 2% |
|
Runda Mumwe |
158,932 |
662 |
26.1% |
83.6% |
4.3% |
1.5% |
5.8% |
|
South C |
120,928 |
494 |
23.8% |
92.5% |
4.6% |
(0.7%) |
3.8% |
|
Redhill |
105,218 |
367 |
21.1% |
77.5% |
3.3% |
0.3% |
3.6% |
|
Langata |
142,183 |
556 |
17.7% |
97.2% |
4.7% |
(1.7%) |
3.0% |
|
Lavington |
180,021 |
555 |
27.3% |
79.4% |
3.3% |
(0.3%) |
3.0% |
|
Upper Mid-End Average |
142,303 |
535 |
22.3% |
87.5% |
4.1% |
0.1% |
4.2% |
|
Ruiru |
99,064 |
353 |
21.4% |
79.6% |
5.1% |
0.9% |
6.0% |
|
Rongai |
74,820 |
305 |
17.0% |
69.0% |
4.6% |
0.7% |
5.3% |
|
Athi River |
92,054 |
406 |
19.3% |
79.6% |
4.5% |
0.6% |
5.0% |
|
Ngong |
64,843 |
238 |
19.4% |
72.8% |
3.2% |
1.6% |
4.8% |
|
Thika |
68,824 |
408 |
20.3% |
84.1% |
4.6% |
0.0% |
4.6% |
|
Kitengela |
73,919 |
446 |
17.7% |
66.1% |
3.1% |
1.2% |
4.3% |
|
Syokimau |
72,464 |
263 |
20.9% |
73.2% |
3.4% |
0.0% |
3.4% |
|
Juja |
73,182 |
260 |
16.6% |
61.9% |
2.7% |
(2.1%) |
0.7% |
|
Lower Mid-End Average |
77,396 |
335 |
19.1% |
73.3% |
3.9% |
0.4% |
4.3% |
|
Average Detached Units |
140,325 |
535 |
20.0% |
81.4% |
3.9% |
0.2% |
4.1% |
|
Detached units registered average returns of 4.1%, 0.6% points lower than the residential market average of 4.7%. This is attributable to slow price growth owing to a decline in demand for maisonettes and bungalows as apartments are more affordable in this market evidenced by the lower uptake of 20.0% in comparison to apartments with 22.3% Satellite Towns recorded the highest average returns of 4.3%, driven by increasing demand for affordable units as well as infrastructural improvements in these towns The high-end market registered the lowest returns owing to increased supply amidst stagnated demand for upscale properties |
|||||||
Source: Cytonn Research
- Apartments Performance
Apartments performed better, registering average capital gains of 0.4%, with average rental yields of 4.8%, thus, average total returns of 5.2%, compared to detached units with 4.2%. Apartments also registered higher uptake and occupancy which averaged at 21.4% and 82.8%, respectively compared to detached units with 20.0% and 81.4%, respectively.
Upper mid-end markets registered the highest annual uptake at 25.6%, on average, attributable to strong investor demand. This is as the upper mid-end market attract high rental income of Kshs 720 per SQM compared to market average at Kshs 532 per SQM, hence registering relatively high average rental yields, which came in at 4.9%, in comparison to the residential market average of 4.3%, with select markets such as Kilimani, Riverside, Imara Daima, and Ruaka offering yields of up to 5.6%.
Lower mid-end suburbs recorded average rental yields of 4.8%, price appreciation of 0.4%, thus, total returns averaging at 5.3%, and also notably, the highest average occupancy in the residential market at 85.9%, attributable to these areas’ appeal to Nairobi’s working class due to their proximity to key commercial nodes, amidst growing need for affordable formal housing.
Satellite towns posted the highest average annual price appreciation of 0.6%, with average rental yields of 4.5%, thus, average total annual returns of 5.1%. This is attributable to the infrastructural improvements ongoing in these areas such as roads, sewerage and water improvements, thus, attracting high demand translating to increase in prices as developers try to match the supply to demand.
Ruaka and Langata were the best performing towns with average returns of 8.0% and 6.8%, respectively, driven by the continued demand from young middle and working populations while still offering affordability and ample social amenities. Ruiru and Thika recorded the lowest returns on account of decline in asking prices in the areas, which are more popular for detached units from families seeking to settle down. This has been witnessed through various price offers as developers attempt to attract their target clientele, which has also had the effect of increasing uptake for units in these areas.
(All Values in Kshs Unless Stated Otherwise)
|
Nairobi Metropolitan Area Apartments Performance 2018/2019 |
|||||||
|
Area |
Average Price per SQM |
Average Rent per SQM |
Average Annual Uptake |
Average Occupancy |
Average Rental Yield |
Average Price Appreciation |
Total returns |
|
Riverside |
135,813 |
737 |
22.9% |
76.2% |
5.1% |
0.9% |
5.9% |
|
Loresho |
113,122 |
479 |
20.9% |
95.4% |
4.3% |
1.4% |
5.7% |
|
Kilimani |
121,845 |
852 |
30.4% |
76.8% |
5.6% |
0.0% |
5.6% |
|
Westlands |
145,042 |
665 |
27.8% |
80.4% |
5.2% |
0.2% |
5.4% |
|
Parklands |
123,146 |
744 |
23.3% |
85.7% |
5.1% |
(0.3%) |
4.8% |
|
Kileleshwa |
138,619 |
846 |
28.1% |
81.7% |
4.2% |
0.0% |
4.2% |
|
Upper Mid-End Average |
129,598 |
720 |
25.6% |
82.7% |
4.9% |
0.4% |
5.3% |
|
Lang’ata |
97,012 |
544 |
15.0% |
85.4% |
5.5% |
1.3% |
6.8% |
|
South B/C |
99,059 |
497 |
20.6% |
88.8% |
4.8% |
0.8% |
5.6% |
|
Imara Daima |
63,203 |
354 |
22.3% |
98.9% |
5.6% |
(0.2%) |
5.4% |
|
Dagoretti |
89,807 |
627 |
16.5% |
88.7% |
5.1% |
0.0% |
5.1% |
|
Ngong Road |
99,800 |
508 |
20.7% |
84.7% |
4.5% |
0.9% |
5.4% |
|
Upper Kabete |
97,719 |
380 |
25.8% |
82.3% |
4.3% |
1.0% |
5.3% |
|
Kahawa West |
74,521 |
396 |
19.0% |
72.8% |
3.9% |
(0.7%) |
3.1% |
|
Lower Mid-End Suburbs Average |
88,731 |
472 |
20.0% |
85.9% |
4.8% |
0.4% |
5.3% |
|
Ruaka |
98,098 |
454 |
23.0% |
91.9% |
5.6% |
2.4% |
8.0% |
|
Kitengela |
60,124 |
341 |
16.5% |
76.3% |
4.5% |
2.2% |
6.6% |
|
Thindigua |
99,270 |
499 |
21.1% |
88.4% |
4.2% |
1.8% |
6.1% |
|
Rongai |
63,064 |
350 |
19.1% |
68.5% |
4.6% |
1.1% |
5.7% |
|
Syokimau |
59,242 |
289 |
15.6% |
88.2% |
4.9% |
0.0% |
4.9% |
|
Kikuyu |
77,269 |
409 |
21.7% |
72.1% |
4.3% |
0.0% |
4.3% |
|
Lower Kabete |
96,876 |
449 |
20.8% |
86.5% |
4.3% |
(1.1%) |
3.3% |
|
Ruiru |
89,421 |
433 |
31.1% |
74.0% |
3.9% |
(0.8%) |
3.2% |
|
Thika |
46,722 |
331 |
24.2% |
71.0% |
4.6% |
(2.0%) |
2.6% |
|
Satellite Towns Average |
76,676 |
395 |
21.4% |
79.6% |
4.5% |
0.6% |
5.1% |
|
Apartments Average |
98,335 |
529 |
22.3% |
82.8% |
4.8% |
0.4% |
5.2% |
|
In comparison to detached units, apartments performed better, registering an average capital gain of 0.4%, with an average rental yield of 4.8%, thus, average total returns of 5.2% attributable to demand for formal housing especially from the growing middle class who cannot afford the villa market Apartments also registered higher uptake and occupancy which averaged at 21.4% and 82.8%, respectively |
|||||||
Source: Cytonn Research
- Investment Opportunity
Whereas the overall market performance has declined, there exists an opportunity in some sub-markets. To identify the developer’s investment opportunity in the sector and single out the specific suburbs that would be best to invest in, we used the following metrics;
- Annual Uptake- This refers to how fast developments sell on average per annum, the higher/ faster the sales rate, the higher the points allotted,
- Average returns- This is the sum of the rental yield and price appreciation for each suburb. The higher the return the more points allotted,
- Amenities – areas with a regional mall in close proximity among other social amenities scored high with areas that lack a mall scoring low,
- Distance from Main Business Nodes- This is to establish the commute distance for the majority of the working population, where we assumed Nairobi Central Business District as the common node,
- State of infrastructure - Here we looked at bits of infrastructure that affect real estate heavily, that is, roads and sewer systems. For the purpose of the ranking, for detached properties, we used the status of the roads only, while the following factors were used to rank the state of the infrastructure for high rise areas;
- Good-Access mainly through tarmac Roads and main sewer line,
- Average- Access mainly through tarmac roads but lack main sewer line,
- Poor- Access mainly through earth roads and lack main sewer line,
With the above considerations, we allotted the highest weighting to uptake, and average returns at 30.0% and 35.0%, respectively. This is because for the investors these are the most important factors to consider when investing in an area. The lowest weighting was allotted to distance from the main business node and amenities at 5.0%. This is as these factors are catered for in the pricing while for infrastructure (incoming and existing), we allocated 15.0% as it is what attracts both developers and buyers. Thus, the best ranking areas for investment opportunity are as shown below:
|
Investment Opportunity: Top 5 Detached Units |
|||||||||
|
Location |
Distance from main Business Node |
Social Amenities |
Infrastructure |
Annual Uptake |
Average Returns |
Availability of Development Land |
Total Points |
Rank |
|
|
Runda Mumwe |
3.0 |
2.0 |
2.0 |
3.0 |
2.0 |
3.0 |
2.4 |
1 |
|
|
Ruiru |
1.0 |
1.0 |
2.0 |
2.0 |
3.0 |
3.0 |
2.3 |
2 |
|
|
Loresho |
3.0 |
1.0 |
2.0 |
1.0 |
3.0 |
2.0 |
2.1 |
3 |
|
|
Karen |
3.0 |
3.0 |
3.0 |
2.0 |
1.0 |
3.0 |
2.0 |
4 |
|
|
Runda |
3.0 |
3.0 |
2.5 |
1.0 |
2.0 |
2.0 |
1.9 |
5 |
|
|
Runda Mumwe and Ruiru present the best investment opportunity for detached units development driven by returns and relatively higher uptake |
|
||||||||
For apartments, Ruaka and Kilimani emerged the best ranking areas.
|
Investment Opportunity: Top 5 Apartments |
||||||||
|
Location |
Distance from Main Business Node |
Social Amenities |
Infrastructure |
Annual Uptake |
Returns |
Availability of Development Land |
Total Points |
Rank |
|
Ruaka |
2.0 |
3.0 |
3.0 |
2.0 |
3.0 |
3.0 |
2.7 |
1 |
|
Kilimani |
3.0 |
3.0 |
3.0 |
3.0 |
2.0 |
2.0 |
2.6 |
2 |
|
Westlands |
3.0 |
3.0 |
3.0 |
3.0 |
2.0 |
1.0 |
2.6 |
3 |
|
Thindigua |
3.0 |
2.0 |
2.0 |
2.0 |
3.0 |
2.0 |
2.4 |
4 |
|
Upper Kabete |
3.0 |
3.0 |
2.0 |
3.0 |
2.0 |
1.0 |
2.4 |
5 |
|
Ruaka and Kilimani presents the best opportunity for residential development driven by uptake, good infrastructure and market returns |
||||||||
- Outlook and Conclusion
For the key metrics that have been used to determine the performance of the sector, two are positive, that is, demand and infrastructure; one is neutral, that is, access to developer and end buyer credit, and a negative on performance with the returns this year being below the government risk-free rate, thus our outlook for the sector is neutral.
|
Residential Report Outlook |
||||
|
Measure |
2018/2019 Experience and Outlook Going Forward |
2018 Outlook |
2019 Outlook |
|
|
Demand |
·The Housing deficit in the Nairobi Metropolitan Area continues to grow driven by rapid population growth rate at an average of 3.3%, compared to the national average of 2.6%, with 97.1% being lower middle-income and low-end income earners, creating demand for affordable homes ·The number of wealthy Kenyans has been on the rise and is expected to grow by 60.5% by 2022, creating demand for luxury homes ·In terms of delivered stock, Nairobi Metropolitan Area had an estimated supply of 20,771 units in 2018 according to KNBS data, a 19.5% decline from 25,819 units in 2017. For 2019, we anticipate 26,000 units to be delivered, bringing the total number of units available to 1.97 mn. Therefore, with an estimated constant population growth of 3.3%, the projected number of units required in 2019 is 4.0 mn units, and therefore, the deficit in Nairobi Metropolitan Area in 2019 will be approximately 2.1 mn units |
Positive |
Positive |
|
|
Credit |
·In 2018, private sector credit growth was relatively lower coming in at 2.1% as at April 2018 compared to a 5-year average of 14.0% between 2013 and 2018 ·In 2019, this was still relatively low coming in at 4.9% as at April 2019, ·The introduction of innovative financial credit solutions through the recently launched Kenya Mortgage Refinancing Company, is set to link real estate and capital markets which will create a better credit financing environment for developers and end buyers alike |
Neutral |
Neutral |
|
|
Infrastructure |
·The government continued to realize most of its infrastructural development plans with works ongoing for key roads including duelling of Waiyaki way and Ngong Road ·Westlands Link Road which connects Waiyaki Way and Limuru Road was completed, a boost for high-end areas such as Loresho, Kitisuru and Lower Kabete as well as areas along Limuru Road such as Ruaka ·More infrastructural improvements are expected especially to pave way for the Bus Rapid Transit system. Notable projects include the incoming Western Bypass, expansion of the Northern Bypass, Kiambu Road and Mombasa Roads as well as the planned sewer and water improvements in areas such as Ruiru and Kitengela |
Positive |
Positive |
|
|
Performance |
·In 2017/18, average annual returns in the residential sector came in at 8.2%, with a price appreciation of 2.8% and rental yields at 5.4%, with the best-performing markets have returns of up to 13.9% ·In 20118/2019, performance continued to slow down with the average change in price across the sector coming in at 0.3% and rental yields at 4.3%, thus average annual returns at 4.7%. However, the best performing market recorded returns of 8.0% ·However, we expect investors to scale back on new developments in a bid to get rid of existing stock especially in oversupplied markets, which will boost prices up ·For investors, off-plan investments in niche markets will give better returns, and therefore, trend analysis and proper research is required to identify these markets |
Neutral |
Negative |
|
Conclusion
Despite the subdued performance, housing deficit continues to be a major concern in Kenya, with Nairobi Metropolitan Area accounting for a substantial amount of the deficit owing to rapid population growth and urbanization. Therefore, we expect the residential sector to continue growing, with growth in prices to pick up on the back of improved mortgage market following the launch of Kenya Mortgage Refinancing Company, whereas developers will shift focus to the lower end market segment, in a bid to tap into government’s initiatives amidst a tough financial environment, and differentiated concepts in the upscale markets especially as mixed-use developments in an attempt to diversify their returns from the real estate sector.
For the full report, download here.
Disclaimer: The views expressed in this publication are those of the writers where particulars are not warranted. This publication, which is in compliance with Section 2 of the Capital Markets Authority Act Cap 485A, is meant for general information only and is not a warranty, representation, advice or solicitation of any nature. Readers are advised in all circumstances to seek the advice of a registered investment advisor.

- Talk to us
- Kenya
- P.O Box 20695 - 00200, Nairobi, Kenya
- Cell +254709101200
- Tel +254709101200
- WhatsApp +254741676635
- United States
- +254709101200
- DOWNLOAD OUR APP
-


- Kenya
- 8th Floor, Pinetree Plaza, Kaburu Drive, Ngong Road, Nairobi, Kenya
- USA
- Suite 1150, 1775 Eye Street NW, USA, Washington DC 20006, USA
- Investments
- High Yield
- Private Equity
- Real Estate
- Real Estate
- RiverRun Estates
- Cytonn Towers
- The Ridge
- Taraji Heights
- The Alma