Analysis of Kenya’s Doing Business Environment, & Cytonn Weekly #43 2018
By Cytonn Research Team, Nov 11, 2018
Executive Summary
Fixed Income
T-bills were under-subscribed during the week, with the overall subscription rate coming in at 87.4%, a decline from 106.4% recorded the previous week. Yields on the 182-day and 364-day papers remained unchanged at 8.3% and 9.5%, respectively, while the yields on the 91-day paper declined to 7.3%, from 7.4% the previous week. According to Stanbic Bank’s Monthly Purchasing Managers Index (PMI), the business environment in the country recorded an improvement in October 2018 for the 11th month in a row since December 2017. The seasonally adjusted PMI recovered to record an improvement to 54.0 from a 10-month low of 52.7 in September 2018;
Equities
During the week, the equities market recorded mixed performances with NSE 20 and NSE 25 gaining by 0.1% and 0.5%, respectively, while NASI declined by 0.6%, taking their YTD performance to declines of 14.1%, 23.7% and 14.9%, for NASI, NSE 20 and NSE 25, respectively. Equity Group Holdings released their Q3’2018 financial results, recording a core Earnings per Share growth of 8.1% to Kshs 4.2 from Kshs 3.9 in Q3’2017
Private Equity
During the week, there was increased investment in the Private Equity industry, with (i) Catalyst principal partners, a Kenyan Private Equity firm specializing in growth, emerging growth, expansion, buyout, recapitalization, acquisition, replacement capital, and pre-IPO investments in medium-sized companies, has raised USD 155.0 mn in its second round of funding, (ii) MFS Africa, a Pan- African Fintech company, announcing the second close of its series B funding round led by LUN partners Group, a Shanghai- based global investment management group bringing the total round of equity funding to USD 14.0 mn, and (iii) South African Private Equity firm Ethos announcing a USD 49.0 mn investment into Channel VAS, a Fintech provider that specializes in data analytics, airtime credit services, and mobile financial services
Real Estate
US-based human resource consulting firm Mercer, a wholly-owned subsidiary of Marsh & McLennan Companies, released a report themed “People First: Driving Growth in Emerging Megacities”. The Report indicated that (i) affordable housing, (ii) safety and security, (iii) air and water pollution, (iv) transport and traffic, and (v) pay and bonuses, in that order, are the key factors that will influence employees’ stay in Nairobi in the next 1 to 5 years. In the residential sector, the Cabinet Secretary for Transport, Infrastructure, Housing and Urban Development, Hon. James Macharia, published the Housing fund Regulations 2018 that will govern the National Housing Development Fund introduced by the Finance Act 2018
Focus of the Week
The World Bank Group released their annual Doing Business 2019 Report, which investigates the regulations that enhance business activity in a country and those that constrain it. In this connection, this week, we analyze the findings of the 2019 report with a focus on Kenya’s overall performance, which moved from position 80 to position 61, highlight specific areas that performed well, and those areas that need to be improved.
- On 8th November 2018, Cytonn and its lead investor, Taaleri of Finland, held a client cocktail meeting at the Nairobi Serena Hotel. The forum served as a platform to enable Cytonn celebrate the ongoing successful partnership with Taaleri, while also providing an opportunity for Cytonn clients to interact directly with the Cytonn Board and Taaleri. See the full Event Note here;
- Samuel Ng’anga, Finance Manager, was on Kameme T.V to discuss the impact of Kenyan Government privatizing Companies. See Samuel here;
- Harrison Muiruri, Clerk of Works, was on Njata T.V to discuss the development Projects by Cytonn Real Estate. Watch Harrison here;
- We continue to hold weekly workshops and site visits on how to build wealth through real estate investments. The weekly workshops and site visits target both investors looking to invest in real estate directly and those interested in high yield investment products to familiarize themselves with how we support our high yields. Watch progress videos and pictures of The Alma, Amara Ridge, The Ridge, and Taraji Heights. Key to note is that our cost of capital is priced off the loan markets, where all-in pricing ranges from 16.0% to 20.0%, and our yield on real estate developments ranges from 23.0% to 25.0%, hence our top-line gross spread is about 6.0%. If interested in attending the site visits, kindly register here;
- We continue to see very strong interest in our weekly Private Wealth Management Training (largely covering financial planning and structured products). The training is at no cost and is open only to pre-screened participants. We also continue to see institutions and investment groups interested in the training for their teams. The Wealth Management Training is run by the Cytonn Foundation under its financial literacy pillar. If interested in our Private Wealth Management Training for your employees or investment group, please get in touch with us through wmt@cytonn.com. To view the Wealth Management Trainingtopics, click here;
- For recent news about the company, see our news section here;
- We have 10 investment-ready projects, offering attractive development and buyer targeted returns of around 23.0% to 25.0% p.a. See further details here: Summary of Investment-Ready Projects; and
- We continue to beef up the team with ongoing hires for Financial and Real Estate Advisors for our offices in Nairobi, Nakuru, Kisumu, and Nyeri. Visit the Careers sectionon our website to apply.
- Cytonn Centre for Affordable Housing (CCFAH) is looking for a 2-acre land parcel for a joint venture in Kiambu County (Ruiru, Kikuyu, Lower Kabete), Nairobi County and its environs. The parcel should be; i) fronting a main road, or not more than 800 metres from the main road, and ii) priced at Kshs 20 mn per acre or below. For more information or leads email us at affordablehousing@cytonn.com
T-Bills & T-Bonds Primary Auction:
T-bills were under-subscribed during the week, with the overall subscription rate coming in at 87.4%, a decline from 106.4% recorded the previous week. The subdued performance was partly attributable to the tight liquidity position in the interbank market, as evidenced by the average interbank rate, which rose to 3.0%, from 2.7% recorded the previous week. The subscription rate for the 364-day paper increased to 167.1%, from 144.3% the previous week, while the subscription rate for the 91-day and 182-day papers declined to 49.1% and 23.0% from 128.4% and 59.8%, recorded the previous week, respectively. Investor participation remained skewed towards the longer dated paper, attributed to the scarcity of newer short-term bonds in the primary market. The yields on the 182-day and 364-day paper remained unchanged at 8.3% and 9.5%, respectively, while the yield on the 91-day paper declined to 7.3%, from 7.4% recorded the previous week. The acceptance rate for T-bills declined to 89.0%, from 100.0%, the previous week, with the government accepting Kshs 18.7 bn of the Kshs 21.0 bn worth of bids received.
Liquidity:
The average interbank rate increased to 3.0%, from 2.7% the previous week, while the average volumes traded in the interbank market rose by 29.6% to Kshs 29.5 bn from Kshs 22.7 bn the previous week. The higher interbank rate points to tightened liquidity conditions, attributed to mobilization of funds by Banks for PAYE remittances.
Kenya Eurobonds:
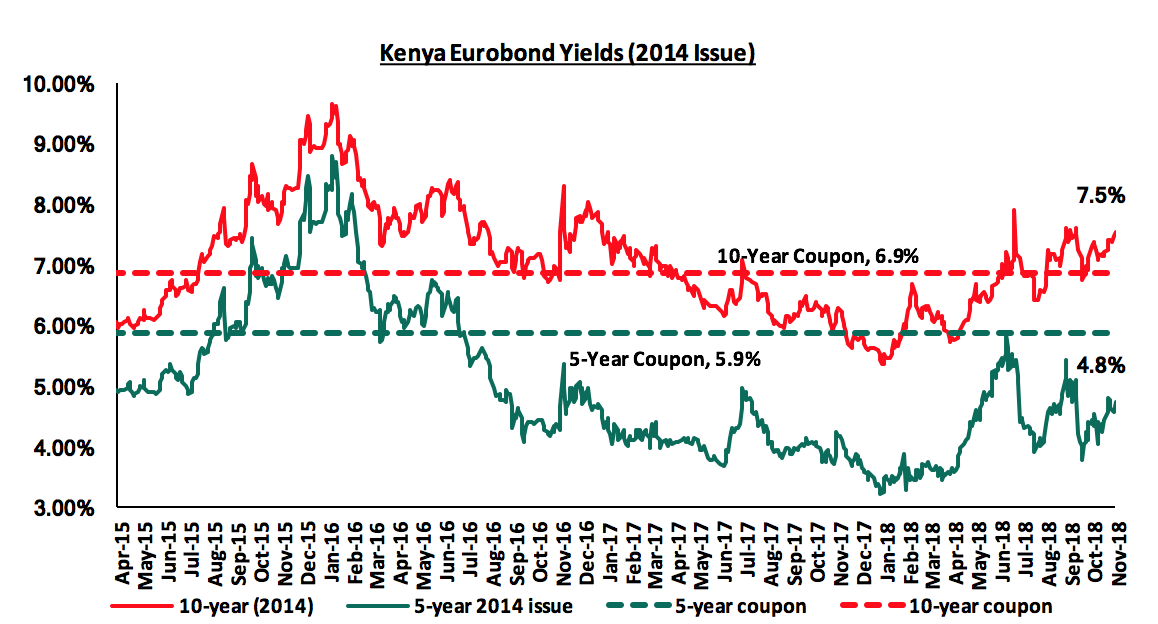
According to Bloomberg, the yields on the 5-year and 10-year Eurobonds issued in 2014 both increased by 0.1% points to 4.8% and 7.5%, from 4.7% and 7.4% recorded the previous week, respectively. Since the mid-January 2016 peak, yields on the Kenyan Eurobonds have declined by 2.1% points and 4.4% points for the 10-year and 5-year Eurobonds, respectively, an indication of the relatively stable macroeconomic conditions in the country. Key to note is that these bonds have 0.6-years and 5.6-years to maturity for the 5-year and 10-year bonds, respectively.
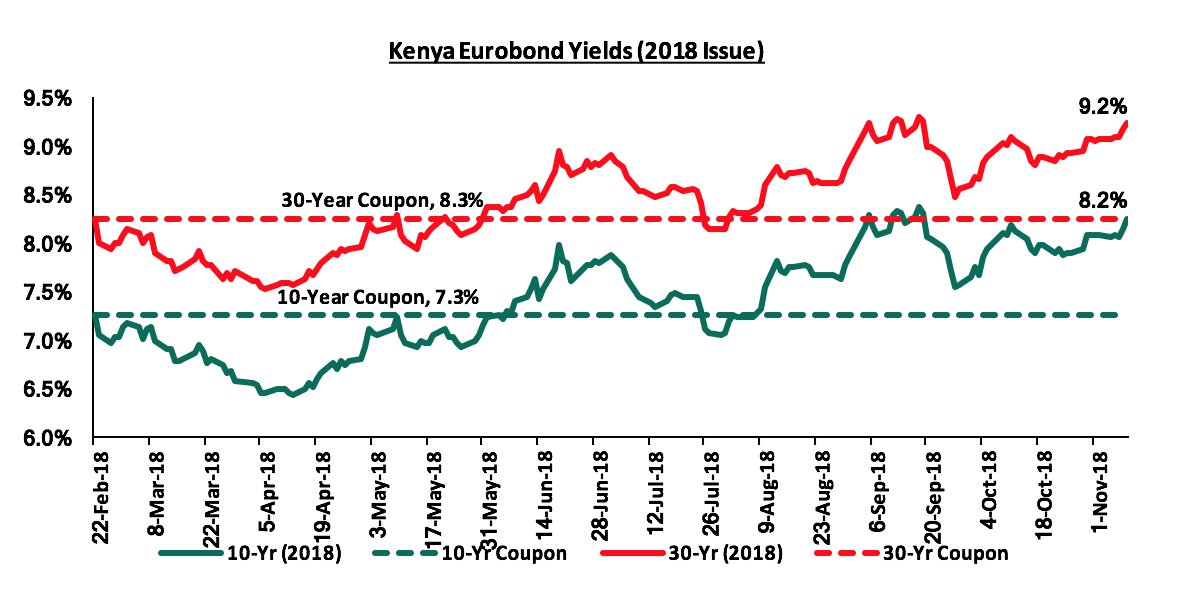
For the February 2018 Eurobond issue, during the week, the yields on both the 10-year and 30-year Eurobonds rose by 0.1% points to 8.2% and 9.2%, from 8.1% and 9.1% the previous week, respectively. Since the issue date, the yields on the 10-year and 30-year Eurobonds have both increased by 0.9% points.
Kenya Shilling:
During the week, the Kenya Shilling depreciated by 0.1% against the US Dollar to close at Kshs 101.9, from Kshs 101.7 recorded the previous week, attributed to increased dollar demand from oil and import merchants. The Kenya Shilling has appreciated by 1.3% year to date, and in our view the shilling should remain relatively stable to the dollar in the short term, supported by:
- The narrowing of the current account deficit to 5.8% in the 12-months to June 2018, from 6.3% in March 2018, attributed to improved agriculture exports, and lower capital goods imports following the completion of Phase I of the Standard Gauge Railway (SGR) project,
- Stronger inflows from principal exports, which include coffee, tea, and horticulture, which increased by 9.3% y/y during the month of August to Kshs 19.7 bn, from Kshs 18.1 bn in August 2018,
- Improving diaspora remittances, which increased by 71.9% y/y to USD 266.2 mn in June 2018 from USD 154.9 mn in June 2017 and by 4.9% m/m, from USD 253.7 mn in May 2018, with the largest contributor being North America at USD 130.1 mn, attributed to (a) recovery of the global economy, (b) increased uptake of financial products by the diaspora due to financial services firms, particularly banks, targeting the diaspora, and (c) new partnerships between international money remittance providers and local commercial banks making the process more convenient,
- CBK’s activities in the money market, such as repurchase agreements and selling of dollars, and,
- High levels of forex reserves, currently at USD 8.2 bn, equivalent to 5.4-months of import cover, compared to the one-year average of 5.5-months.
Highlight of the Week:
According to the Stanbic Bank’s Monthly Purchasing Managers Index (PMI), the business environment in the country recorded an improvement in October for the 11th month in a row since December 2017. The seasonally adjusted PMI recovered to record an improvement to 54.0 from a 10-month low of 52.7 in September 2018. A PMI reading of above 50 indicates improvements in the business environment, while a reading below 50 indicates a worsening outlook. Firms reported growth in the value of outputs in response to a rise in new orders, with export demand growing rapidly during the month. This was despite high input costs, which dipped slightly but still remained high attributed to the exertion of pressure from the introduced taxes on fuel in the Finance Bill 2018, which made firms to continue raising selling prices in October. In response to increased output requirements, firms also raised their staffing levels during the month recording the strongest rate in 6-months mainly driven by temporary staff hires to meet the demand.
Notably, Kenya’s PMI had declined in Q3’2018 averaging at 53.6, lower than 55.6 and 54.4 in Q2’2018 and Q1’2018, respectively. This was mainly attributable to reduced business confidence following the introduction of the new tax measures in a bid to increase government revenues in its fiscal consolidation strategy. We expect this to weigh on economic activity during the quarter. We however expect a recovery in Q4’2018, driven by improved agricultural productivity, following improved weather conditions due to the short rain season.
Rates in the fixed income market have been on a declining trend, as the government continues to reject expensive bids, as it is currently 43.1% ahead of its pro-rated borrowing target for the current financial year, having borrowed Kshs 149.6 bn against a pro-rated target of Kshs 104.6 bn. The 2018/19 budget had given a domestic borrowing target of Kshs 271.9 bn, 8.6% lower than the 2017/2018 fiscal year’s target of Kshs 297.6 bn, which may result in reduced pressure on domestic borrowing. With the rate cap still in place, with the president having assented to the Finance Bill 2018, we maintain our expectation of stability in the interest rate environment. With the expectation of a relatively stable interest rate environment, our view is that investors should be biased towards medium-term fixed-income instruments.
Market Performance
During the week, the equities market recorded mixed performances with NSE 20 and NSE 25 gaining by 0.1% and 0.5%, respectively, while NASI declined by 0.6%, taking their YTD performance to declines of 14.1%, 23.7% and 14.9%, for NASI, NSE 20 and NSE 25, respectively. The decline in the NASI was driven by declines in large cap stocks such as Equity Group Holdings, Co-operative Bank, Safaricom and East Africa Breweries Limited (EABL), which declined by 1.3%, 1.1%, 1.0% and 0.6%, respectively.
Equities turnover declined by 71.7% during the week to USD 10.7 mn from USD 37.8 mn the previous week, taking the YTD turnover to USD 1.6 bn. Foreign investors remained net sellers for the week, with a net selling position of USD 0.3 mn, a 95.4% decline from last week’s net selling position of USD 7.1 mn. We expect the market to remain subdued in the near-term as international investors exit the broader emerging markets due to the expectation of rising US interest rates coupled with the strengthening of the US Dollar.
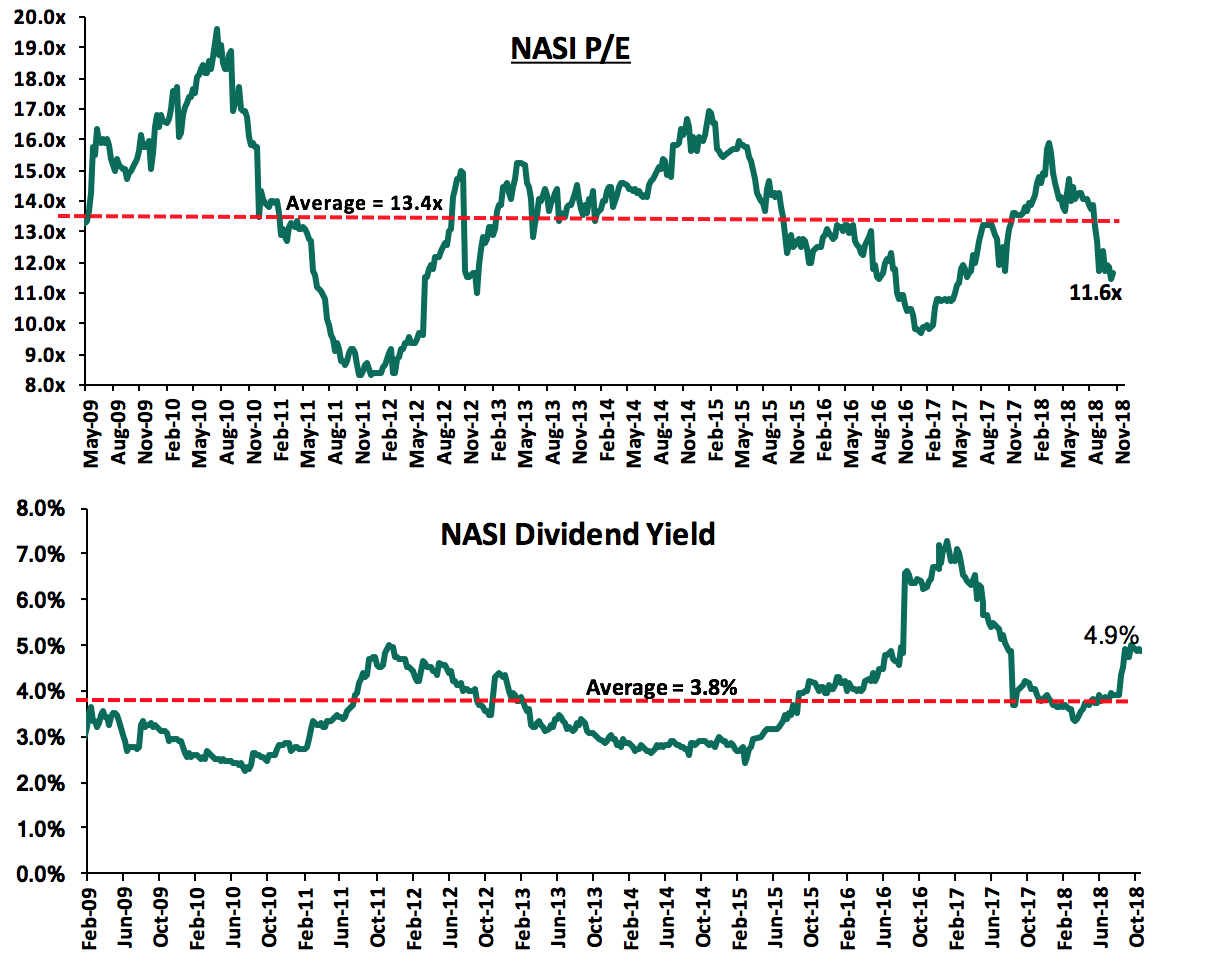
The market is currently trading at a price to earnings ratio (P/E) of 11.6x, 13.4% below the historical average of 13.4x, and a dividend yield of 4.9%, above the historical average of 3.8%. With the market trading at valuations below the historical average, we believe there is value in the market. The current P/E valuation of 11.6x is 19.6% above the most recent trough valuation of 9.7x experienced in the first week of February 2017, and 39.8% above the previous trough valuation of 8.3x experienced in December 2011. The charts below indicate the historical P/E and dividend yields of the market.
Earnings Releases
Equity Group Holdings released Q3’2018 results during the week;
Equity Group Holdings released their Q3’2018 results, registering a core earnings per share growth of 8.1% to Kshs 4.2 from Kshs 3.9 in Q3’2017, below our expectation of a 23.2% increase to Kshs 4.8. The performance was driven by a 1.1% increase in total operating income, coupled with a 4.0% decline in the total operating expenses. The variance in core earnings per share growth against our expectations was largely due to the 6.7% decline in Non-Funded Income (NFI) to Kshs 19.8 bn from Kshs 21.3 bn. We had expected a 4.8% increase in NFI to Kshs 22.3 bn from Kshs 21.3 bn in Q3’2017. Highlights of the performance from Q3’2017 to Q3’2018 include:
- Total operating income increased by 1.1% to Kshs 49.3 bn year-to-date (YTD) Q3’2018, from Kshs 48.8 bn over the same period to Q3’2017. This was due to a 7.2% increase in Net Interest Income (NII) to Kshs 29.5 bn from Kshs 27.5 bn in Q3’2017, which outweighed the 6.7% decline in Non-Funded Income (NFI) to Kshs 19.8 bn, from Kshs 21.3 bn in Q3’2017,
- Interest income increased by 8.6% to Kshs 38.5 bn, from Kshs 35.4bn in Q3’2017. This was driven by a 24.1% growth in interest income from government securities to Kshs 12.1 bn from Kshs 9.8 bn in Q3’2017, and a 2.9% increase in interest income on loans and advances to Kshs 25.8 bn, from Kshs 25.0 bn in Q3’2017. Interest income on deposits and placements with banking institutions rose by 15.2% to Kshs 0.5 bn from Kshs 0.4 bn in Q3’2017. However, the yield on interest earning assets declined to 11.1% in Q3’2018 from 12.1% in Q3’2017, due to a faster increase at 24.1% in government securities that have relatively lower yields than loans,
- Interest expense increased by 13.5% to Kshs 9.0 bn from Kshs 7.9 bn in Q3’2017, following an 8.8% increase in the interest expense on customer deposits to Kshs 7.0 bn, from Kshs 6.5 bn in Q3’2017. Interest expense on deposits and placements from banking institutions increased by 108.7% to Kshs 0.4 bn from Kshs 0.2 bn in Q3’2017. Other interest expenses increased by 23.7% to Kshs 1.6 bn, from Kshs 1.3 bn in Q3’2017. The cost of funds thus increased to 2.7%, from 2.6% in Q3’2017. As a consequence, the Net Interest Margin (NIM) declined to 8.5%, from 9.4% in Q3’2017,
- Non-Funded Income (NFI) declined by 6.7% to Kshs 19.8 bn, from Kshs 21.3 bn in Q3’2017. The decline in NFI was realized across all NFI segments. Fees and commissions on loans declined by 1.7% to Kshs 4.28 bn from Kshs 4.35 bn in Q3’2017. Other fees and commission income declined by 2.7% to Kshs 9.4 bn, from Kshs 9.6 bn in Q3’2017. Forex trading income declined by 7.4% to Kshs 2.4 bn, from Kshs 2.6 bn in Q3’2017. Other income declined by 19.1% to Kshs 3.8 bn, from Kshs 4.7 bn in Q3’2017. As a result, the current revenue mix shifted to 60:40 funded to non-funded income as compared to 56:44 in Q3’2017. The proportion of NFI to total revenue decreased owing to the decline in NFI coupled with the increase in NII,
- Total operating expenses declined by 4.0% to Kshs 26.9 bn, from Kshs 28.0 bn, largely driven by a 54.0% decrease in Loan Loss Provisions (LLP) to Kshs 1.3 bn in Q3’2018, from Kshs 2.9 bn in Q3’2017, coupled with a marginal 0.2% decrease in other operating expenses to Kshs 17.31 bn in Q3’2018, from Kshs 17.34 bn in Q3’2017. Staff costs however rose by 6.0% to Kshs 8.3 bn from Kshs 7.8 bn in Q3’2017, attributed to heavy recruitment by the bank for several managerial positions, and the data analytics departments across its group and subsidiary offices,
- The Cost to Income Ratio (CIR) improved to 55.0%, from 57.5% in Q3’2017. Without LLP, the cost to income ratio deteriorated albeit marginally to 51.9%, from 51.6% in Q3’2017,
- Profit before tax increased by 8.1% to Kshs 22.4 bn, up from Kshs 20.7 bn in Q3’2017. Profit after tax also increased by 8.1% to Kshs 15.8 bn in Q3’2018, from Kshs 14.6 bn in Q3’2017,
- The balance sheet recorded an expansion as total assets increased by 8.1% to Kshs 560.4 bn from Kshs 518.2 bn in Q3’2017. This growth was largely driven by a 24.1% increase in government securities to Kshs 158.6 bn, from Kshs 127.7 bn in Q3’2017, coupled with an 8.6% increase in their loan book to Kshs 288.4 bn from Kshs 265.5 bn in Q3’2017,
- Total liabilities rose by 9.7% to Kshs 469.7 bn from Kshs 428.1 bn in Q3’2017, driven by a 9.1% increase in total deposits to Kshs 402.3 bn from Kshs 368.8 bn in Q3’2017. Deposits per branch also increased by 9.1% to Kshs 1.4 bn from Kshs 1.3 bn in Q3’2017, with no new branches opened or closed. Placement liabilities increased by 304.3% to Kshs 9.9 bn from Kshs 2.5 bn in Q3’2017. Borrowings increased by 1.4% to Kshs 46.3 bn from Kshs 45.7 bn in Q3’2017,
- The faster growth in deposits as compared to loans led to a slight decline in the loan to deposit ratio to 71.7% from 72.0% in Q3’2017,
- Gross Non-Performing Loans (NPLs) increased by 28.1% to Kshs 26.5 bn in Q3’2018 from Kshs 20.7 bn in Q3’2017. Consequently, the NPL ratio deteriorated to 8.9% in Q3’2018 from 7.5% in Q3’2017. General Loan Loss Provisions (LLPs) increased by 3.8% to Kshs 7.6 bn from Kshs 7.3 bn in Q3’2017. With the growth in NPLs not matched with a similar increase in provisioning, the NPL coverage decreased to 38.9% in Q3’2018 from 48.2% in Q3’2017. The increase in the non-performing loans was attributed major corporate clients. Large enterprises contributed the largest proportion of NPLs at 14.7%, with Small and Medium Enterprises (SMEs) contributing 9.4% and agriculture 5.4%. In terms of regional contribution, South Sudan contributed 40.9% of total NPLs, with Tanzania and Kenya contributing 12.9% and 9.1%, respectively,
- Shareholders’ funds increased marginally by 0.6% to Kshs 90.7 bn in Q3’2018 from Kshs 90.1 bn in Q3’2017, as retained earnings grew by 6.9% y/y to Kshs 80.3 bn from Kshs 75.1 bn. The growth was however weighed down by revaluation losses, which rose 41.0% to Kshs 8.4 bn from Kshs 6.0 bn in Q3’2017,
- Equity Group Holdings is currently sufficiently capitalized with a core capital to risk weighted assets ratio of 18.0%, 7.5% above the statutory requirement. In addition, the total capital to risk weighted assets ratio was 18.0%, exceeding the statutory requirement by 3.5%. Adjusting for IFRS 9, the core capital to risk weighted assets stood at 21.9%, while total capital to risk weighted assets came in at 18.8%, indicating that the bank’s total capital relative to its risk-weighted assets declined by 0.8% due to implementation of IFRS 9,
- The bank currently has a Return On Average Assets (ROaA) of 3.9% and a Return On Average Equity (ROaE) of 22.2%.
We expect the bank’s growth to be further propelled by:
Channelled diversification, which is likely to further improve efficiency, with emphasis on alternative channels of transactions, as the bank rides on the digital revolution wave, thereby further improving the cost to income ratio by cost rationalization. With management indicating their strategy of capturing market share and monetize later, this will likely propel the bank’s prospects of achieving sustainable growth in the segment, as it deploys its successful business model across its various regional subsidiaries, such as DRC Congo, which has 85.0% of the population that is unbanked, thereby presenting significant headroom for growth.
For more information, see our Equity Group Holdings Q3’2018 Earnings Note
Weekly Highlights
Morocco based bank Attijariwafa Bank highlighted its plans for several acquisitions in Africa in the coming year, with the key focus countries being Rwanda, Kenya and Ethiopia. Attijariwafa, Morocco’s biggest bank with an asset base of USD 51.0 bn, has subsidiaries in Cameroon, Congo Republic, Egypt, Gabon, Ivory Coast, Mali, Mauritania, Senegal, Tunisia and Togo. The bank highlighted its strategy to acquire banks that are ranked among the first five banks, in terms of asset base, in their respective operating markets. In August 2017, the bank acquired the Egyptian unit of Barclays, with the transaction details yet to be disclosed. However, the Bank’s CEO indicated the acquisition happened at almost 2 times the bank’s equity, which translates to USD 0.5 bn, with the bank’s equity at the time being USD 0.3 bn. The 5 largest banks in Kenya by asset base include Kenya Commercial Bank, Equity Group Holdings, Cooperative Bank, Standard Chartered Bank Kenya and Diamond Trust Bank Kenya, and there is no indication that any of them could be up for sale hence in Kenya, Attijariwafa would have to look into second and third tier banks. The Kenyan banking sector has had several acquisitions in the last 5-years, with the acquisition of Chase Bank by SBM Bank Kenya being the most recent. The acquisition of Imperial Bank Limited under Receivership by KCB is still ongoing, with the Kenya Deposit Insurance Corporation (KDIC) acknowledging the receipt of the revised proposal from KCB in July 2018. We maintain our expectations of continued acquisitions in the Kenyan banking sector, as the smaller banks that do not serve any niche, and are constrained in capital, become acquired by the larger and more stable banks. This would improve the industry’s overall stability by having fewer but stronger players.
Universe of Coverage
Below is a summary of our SSA universe of coverage:
|
Equities Universe of Coverage |
|||||||||
|
Banks |
Price as at 2/11/2018 |
Price as at 9/11/2018 |
w/w change |
YTD Change |
LTM Change |
Target Price* |
Dividend Yield |
Upside/Downside** |
P/TBv Multiple |
|
NIC Bank*** |
23.0 |
23.0 |
0.0% |
(31.9%) |
(33.4%) |
48.8 |
4.3% |
116.5% |
0.6x |
|
Diamond Trust Bank |
155.0 |
160.0 |
3.2% |
(16.7%) |
(14.9%) |
283.7 |
1.6% |
78.9% |
0.9x |
|
KCB Group |
38.0 |
38.0 |
0.0% |
(11.1%) |
(7.3%) |
61.3 |
7.9% |
69.2% |
1.2x |
|
Union Bank Plc |
5.1 |
4.9 |
(4.0%) |
(37.8%) |
(20.8%) |
8.2 |
0.0% |
68.0% |
0.5x |
|
Ghana Commercial Bank*** |
5.2 |
5.1 |
(1.2%) |
0.8% |
20.3% |
7.7 |
7.5% |
59.1% |
1.2x |
|
I&M Holdings*** |
90.0 |
90.0 |
0.0% |
(29.1%) |
(25.0%) |
138.6 |
3.9% |
57.9% |
0.9x |
|
Ecobank Ghana |
6.7 |
7.0 |
4.6% |
(7.9%) |
2.1% |
10.7 |
0.0% |
53.3% |
1.5x |
|
Equity Group Holdings |
39.5 |
39.0 |
(1.3%) |
(1.9%) |
(2.5%) |
56.2 |
5.1% |
49.2% |
1.9x |
|
Zenith Bank*** |
23.6 |
24.4 |
3.6% |
(4.8%) |
(2.8%) |
33.3 |
11.1% |
47.6% |
1.1x |
|
Co-operative Bank |
14.4 |
14.2 |
(1.0%) |
(11.3%) |
(13.1%) |
19.9 |
5.6% |
45.8% |
1.2x |
|
UBA Bank |
7.9 |
8.0 |
0.6% |
(22.8%) |
(18.0%) |
10.7 |
10.7% |
45.3% |
0.5x |
|
CRDB |
150.0 |
145.0 |
(3.3%) |
(9.4%) |
(9.4%) |
207.7 |
0.0% |
43.2% |
0.5x |
|
CAL Bank |
1.0 |
1.0 |
(1.9%) |
(5.6%) |
11.0% |
1.4 |
0.0% |
37.3% |
0.9x |
|
HF Group |
5.3 |
5.4 |
0.9% |
(48.6%) |
(51.1%) |
6.6 |
6.5% |
29.9% |
0.2x |
|
Access Bank |
8.4 |
7.7 |
(7.8%) |
(26.3%) |
(23.2%) |
9.5 |
5.2% |
28.6% |
0.5x |
|
Barclays Bank Kenya |
11.0 |
11.2 |
2.3% |
16.7% |
12.0% |
12.5 |
8.9% |
20.5% |
1.5x |
|
Stanbic Bank Uganda |
33.0 |
33.0 |
0.0% |
21.1% |
21.1% |
36.3 |
3.5% |
13.5% |
2.3x |
|
SBM Holdings |
6.2 |
6.1 |
(0.3%) |
(18.1%) |
(17.9%) |
6.6 |
4.9% |
11.7% |
0.9x |
|
Standard Chartered |
188.0 |
192.0 |
2.1% |
(7.7%) |
(15.4%) |
196.3 |
6.5% |
8.8% |
1.5x |
|
Bank of Kigali |
289.0 |
289.0 |
0.0% |
(3.7%) |
1.4% |
299.9 |
4.8% |
8.6% |
1.6x |
|
Bank of Baroda |
140.0 |
125.0 |
(10.7%) |
10.6% |
13.6% |
130.6 |
2.0% |
6.5% |
1.1x |
|
Guaranty Trust Bank |
37.5 |
37.2 |
(0.9%) |
(8.8%) |
(12.6%) |
37.1 |
6.5% |
6.3% |
2.3x |
|
Stanbic Holdings |
91.5 |
91.5 |
0.0% |
13.0% |
14.4% |
92.6 |
2.5% |
3.7% |
0.9x |
|
FBN Holdings |
7.7 |
7.5 |
(2.6%) |
(15.3%) |
2.9% |
6.6 |
3.4% |
(7.7%) |
0.4x |
|
Standard Chartered |
21.8 |
21.8 |
0.0% |
(13.7%) |
27.2% |
19.5 |
0.0% |
(10.7%) |
2.7x |
|
National Bank |
4.7 |
5.8 |
22.3% |
(38.5%) |
(45.0%) |
4.9 |
0.0% |
(14.8%) |
0.4x |
|
Stanbic IBTC Holdings |
47.0 |
47.1 |
0.2% |
13.5% |
10.8% |
37.0 |
1.3% |
(20.2%) |
2.4x |
|
Ecobank Transnational |
16.0 |
15.6 |
(2.8%) |
(8.5%) |
(8.5%) |
9.3 |
0.0% |
(40.3%) |
0.6x |
|
*Target Price as per Cytonn Analyst estimates **Upside / (Downside) is adjusted for Dividend Yield ***Banks in which Cytonn and/or its affiliates holds a stake. For full disclosure, Cytonn and/or its affiliates holds a significant stake in NIC Bank, ranking as the 5th largest shareholder ****Stock prices indicated in respective country currencies |
|||||||||
We are “NEUTRAL” on equities since the markets are currently trading below historical P/E averages. However, pockets of value continue to exist, with a number of undervalued sectors like Financial Services, which provide an attractive entry point for medium and long-term investors, and with expectations of higher corporate earnings this year, we are “POSITIVE” for investors with a long-term investment horizon.
Catalyst principal partners, a Kenyan Private Equity firm specializing in growth, emerging growth, expansion, buyout, recapitalization, acquisition, replacement capital, and pre-IPO investments in medium-sized companies, has raised USD 155.0 mn in its second round of funding. The capital was mainly from local pension funds and international investors. The capital raised will target USD 7.5 mn - USD 22.5 mn range of investments, targeting companies in Kenya, Uganda, Tanzania, Ethiopia, Zambia, Rwanda and the Democratic Republic of Congo. They mainly focus on Consumer goods and Retail, Financial and Business services, Industrials, Manufacturing and Value-add processing, Technology and Communication sectors. Founded in 2009, Catalyst partners secured their first funding in November 2012 of USD 125.0 mn under Catalyst Fund I. They have made investments in a range of companies with the most recent in May & April 2017, when they invested in Britania Foods Limited and Kensta Group respectively.
Their investment criteria for Catalyst Fund I is:
- USD 5.0 million to USD 20.0 million for strategic minority or control transactions,
- Expansion and replacement capital, recapitalizations and pre-IPO investments,
- 4 to 6 year investment horizon, with exits via trade and financial buyers, capital markets and self-redeeming instruments, and
- Target 20.0% to 25.0% USD cumulative net returns.
Their Investment focus is on sectors with attractive underlying fundamentals, driven by compelling demographic trends and urbanization, rising consumer demand, a deepening middle class, under-penetrated rural mass market as well as convergence and integration of the regional economies
MFS Africa, a Pan-African FinTech company founded in 2009, headquartered in Johannesburg, South Africa, announced the close of its second round of Series B funding, raising equity totalling to USD 14.0 mn. The funding was from a consortium of investors, who participated in undisclosed portions led by LUN Partners Group, a Shanghai-based global investment management group, Goodwell Investments, an Amsterdam based investment firm, ShoreCap III, a private equity fund managed by US-based Equator Capital Partners, and UK-based FSD Africa, bringing the total round of funding to USD 14.0 mn. The total equity raised of USD 14.0 mn will be used for the expansion of its mobile financial services (MFS) into additional areas in Africa, starting with Mauritius, Rwanda, Tanzania, Uganda and Kenya. The FinTech Company operates the largest digital payments hub in Africa. This payments hub is connected to over 170 mn users across sub-Saharan Africa via partnerships with money transfer organizations, banks and other institutions, enabling money remittances to and from mobile money accounts. MFS Africa connects mobile money systems to each other and to money transfer organizations, banks and other financial institutions, enabling money remittances TO and FROM mobile money accounts.
South African private equity firm, Ethos, announced a USD 49.0 mn investment into Channel VAS, a FinTech provider that specializes in data analytics, airtime credit services and mobile financial services. The stake acquired in this transaction has however not been disclosed. This investment was the first to be made by the firm’s new buyout fund, Ethos Fund VII, which has set the trend for the firm’s increasing investments towards technology, with the fund set to invest alongside the firm’s specialized Artificial Intelligence Fund. The fund is targeting USD 563.0 mn in capital from local and international investors, having already raised USD 141.0 mn, with the remaining USD 322.0 mn by Q1’2019. This reinforces the huge opportunity for value creation in the Fintech sector in Sub-Saharan Africa. This partnership will be instrumental in helping Channel VAS expand geographically into other regions, to increase their coverage from the current 650 million users in the 30 countries that they cover, both in Sub-Saharan Africa and in the Middle East. Ethos will also leverage the brand value and market share of Channel VAS in its plan to effectively conquer the Fintech sector.
FinTech remains the most attractive sector and the highest funded sector for investors in 2018 with 4 of the 10 largest deals made in 2018 being from this sector. The growth in the funding of FinTech companies is expected to improve due to;
- High Returns - According to data collected by Crunchbase, since 2007, Fintech start-ups have raised an average of USD 41.0 mn in Venture Capital and exited for an average value of USD 242.9 mn. This gives investors a better opportunity to invest in a sector that attracts a growing pool of new investors and in the end exit at a high price,
- Attractive Realization Periods - Private equity firms typically focus on investing for a short lead-time, often between three to five years. Many Fintech companies start showing profits by year three hence giving a chance for investors to realize their gains in time, and,
- Cheaper Running Costs - They are cheaper to run since the FinTech company is not weighed down by the same burden of costly regulation that governs traditional businesses. This makes PE firms to manage their FinTech portfolio with easy flexibility.
FinTech lending and microfinance institutions in general have been a major attraction for investors in Kenya and Sub-Saharan Africa. Lack of access to finance is a major issue for entrepreneurs and Micro, Small and Medium Enterprises (MSMEs) across Africa. According to the IMF, there are 44.2 mn MSMEs in Sub-Saharan Africa with a potential demand for USD 404.0 bn in financing. The current volume of financing in Sub-Saharan Africa is estimated at USD 70.0 bn signifying a huge financing gap of USD 331.0 bn. Microfinance institutions aim to bridge this gap by offering convenient access to credit.
Private equity investments in Africa remains robust as evidenced by the increasing investor interest, which is attributed to; (i) rapid urbanization, a resilient and adapting middle class and increased consumerism, (ii) the attractive valuations in Sub Saharan Africa’s private markets compared to its public markets, (iii) the attractive valuations in Sub Saharan Africa’s markets compared to global markets, and (iv) better economic projections in Sub Sahara Africa compared to global markets. We remain bullish on PE as an asset class in Sub-Sahara Africa. Going forward, the increasing investor interest and stable macro-economic environment will continue to boost deal flow into African markets.
- Industry Reports
During the week, US-based human resource consulting firm Mercer, a wholly-owned subsidiary of Marsh & McLennan Companies, released a report themed “People First: Driving Growth in Emerging Megacities”. The report examines various factors across 4 pillars; Human, Health, Money, and Work in order to inform on what motivates most skilled workers to move to or stay in a city. The report covered 15 cities based in seven countries, namely India, China, Brazil, Mexico, Morocco, Nigeria and Kenya, and for Kenya included Nairobi. Cities were selected based on the following criteria: i) strong projected GDP and population growth in the next 10-years, ii) population of 3-15 mn persons, and iii) more than USD 4.0 bn of annual Foreign Direct Investment (FDI). According to the report, the key factors driving people to cities are overall satisfaction with life, security, safety and lack of violence, total income, affordable healthcare, and affordable housing, among others. Narrowing down to Nairobi City, the following were the key take-outs;
- The main clusters of Nairobi City residents are 31% being business owners, 28% white-collar professionals and graduates, 20% confident achievers (executives and senior professionals) and 10% as struggling vocational,
- Factors that will determine where residents will live and work in the next 1 to 5-years, according to the report, are; i) affordable housing, ii) safety and security, iii) air and water pollution, iv) transportation and traffic, and v) pay and bonuses, in that order, and,
- The overall life satisfaction in Nairobi stood at 41% against the sampled global average of 62%, due to low human, health, money and work satisfaction at 40%, 37%, 42% and 47%, respectively compared to global average at 63%, 62%, 58% and 63% for human, health, money and work satisfaction, respectively.
Access to affordable housing and adequate infrastructure continue to be key issues facing the country, and mainly in key cities such as Nairobi with a population of approximately 4.0 mn persons as at 2018 translating to a density of 3,950 persons/SQKM compared to the national average population density of 90 persons/SQKM and a population growth rate of 2.6% compared to global average at 1.2% p.a according to world bank data. This accentuates the need for more efforts by both the public and the private sector towards provision of affordable housing and infrastructure in order to improve living standards not only in Nairobi, but also other fast growing urban centres in Kenya such as Mombasa, Kisumu and Nakuru. Already, we are seeing works towards this with; i) the affordable housing initiative by the Kenyan Government under the Big 4 Agenda, and ii) the Kenyan Government’s dedication to improving the state of infrastructure in Kenya, especially in transport, as part of its efforts to elevate the country to upper middle-class status by 2030. For instance, according to the KNBS Economic Survey 2018, the development expenditure on roads is set to grow by 19.2% to Kshs 134.9 bn in 2017/18 from Kshs 109.0 bn in 2016/17.
- Residential Sector
The affordable housing initiative by the Kenyan Government continues to witness increased activities in support of its implementation. During the week, the Cabinet Secretary for Transport, Infrastructure, Housing and Urban Development, Hon. John Macharia, published the Housing fund Regulations 2018 that shall govern the National Housing Development Fund introduced by the Finance Act 2018. The key guidelines include the following;
- The affordable housing scheme will be categorized and accessed by persons under the following income brackets:
- Social Housing - Designated for individuals earning up to Kshs 14,999 monthly, accounting for 2.6% of the formal income earners according to the latest statistics from Kenya National Bureau of Statistics (KNBS),
- Low-Cost Housing - Designated for individuals earning between Kshs 15,000 and Kshs 49,999 monthly, accounting for 71.8% of the formal income earners, and
- Mortgage-Gap Housing - Designated for individuals earning between Kshs 50,000 and Kshs 100, 000 monthly, accounting for 22.6% of the formal income earners.
- Every employer shall register with the Housing Fund as a contributing employer and shall register all employees as members of the Housing Fund,
- Any employer who fails to register or make contributions to the fund shall be liable to imprisonment for a term of 2-years or to a fine not exceeding Kshs 10,000, or to both, (it’s not clear whether this is per individual),
- Contributions by individuals shall only be accessed for purposes of offsetting housing loans, security for mortgage or housing development after 5-years of uninterrupted contribution, and shall attract an annual return as may be determined by the National Housing Corporation, and,
- A person shall qualify for the affordable housing scheme if that person is; i) a Kenyan citizen of 18 years of age and above, ii) has proof of registration with the affordable housing scheme, iii) has proof of remittance of the contribution, and iv) is a first-time home owner under the affordable housing scheme.
In our view, the above housing development fund regulations are commendable. If successfully implemented they will increase transparency in money contribution into the fund and its usage and increase funds available for delivering 500,000 affordable housing units by 2022, an initiative expected to cost a total of Kshs 2.3 tn and bridge the housing gap in the market growing by 200,000 units per year, according to National Housing Corporation.
- Commercial Office Sector
In commercial office sector, this week, the European Union (EU) delegation to Kenya announced its headquarters’ relocation from Union Insurance House along Ragati Road in Upperhill to Dunhill Towers along Waiyaki Way in Westlands. In our view, Westlands is a preferred location by corporates as it is;
- An upper middle-income neighborhood and is in close proximity to other high-end neighborhoods such as Loresho, Parklands and Springvalleys,
- Its proximity to Diplomatic Police Unit, and
- Has a wider range of high standard social amenities such as schools and malls including Sarit Centre and Westgate
Upperhill is losing its appeal as the ideal location for corporate headquarters due to inadequate amenities and traffic congestion along its key access ways such as s Ngong Road and Mbagathi Way. According to Cytonn Research, Upperhill recorded a rental yield of 9.0%, 0.5% points lower than the market average of 9.5%, compared to Westlands which had an average rental yield of 10.0% in Q3’2018. Upperhill will have to be reinvented through improvement of infrastructure, and diversification into other themes such as residential and retail spaces in order to boost real estate performance in the node.
Below is an extract from our commercial offices report highlighting the performance of Westlands, Upperhill and other office nodes in Nairobi in Q3’2018:
|
(All values in Kshs unless otherwise stated) |
|||||||||||
|
Nairobi Commercial Office Performance by Nodes Q3’2018 |
|||||||||||
|
Nodes |
Price Kshs / SQFT Q3' 2018 |
Rent Kshs/SQFT Q3 2018 |
Occupancy (%) Q3 2018 |
Rental Yield (%) Q3 2018 |
Price Kshs / SQFT Q2 2018 |
Rent Kshs/SQFT Q2 2018 |
Occupancy (%) Q2 2018 |
Rental Yield (%) Q2 2018 |
Q/Q Δ in Rents (%) |
Q/Q Δ in Yields (%) |
Q/Q Δ in Occupancy (%) |
|
Karen |
12,888 |
117 |
89.0% |
10.8% |
13,776 |
118 |
87.2% |
10.2% |
(0.7%) |
0.6% |
1.8% |
|
Westlands |
10,667 |
111 |
89.0% |
10.0% |
12,567 |
109 |
84.7% |
9.7% |
2.0% |
0.3% |
4.3% |
|
Parklands |
12,208 |
103 |
86.0% |
9.8% |
12,433 |
103 |
85.6% |
9.8% |
0.0% |
0.0% |
0.4% |
|
Kilimani |
13,031 |
101 |
87.3% |
9.6% |
12,694 |
101 |
85.4% |
9.4% |
0.0% |
0.2% |
1.9% |
|
Nbi CBD |
11,333 |
88 |
92.1% |
9.1% |
11,750 |
87 |
92.1% |
8.7% |
1.3% |
0.4% |
0.0% |
|
UpperHill |
13,386 |
100 |
90.1% |
9.0% |
12,708 |
101 |
85.7% |
9.0% |
(1.0%) |
0.0% |
4.4% |
|
Msa Road |
11,750 |
82 |
71.0% |
8.7% |
11,770 |
83 |
68.0% |
8.6% |
(1.0%) |
0.1% |
3.0% |
|
Thika Road |
11,750 |
85 |
89.0% |
8.7% |
11,500 |
85 |
80.0% |
8.7% |
0.0% |
0.0% |
9.0% |
|
Grand Average |
12,202 |
102 |
87.3% |
9.5% |
12,527 |
102 |
84.6% |
9.3% |
0.1% |
0.2% |
3.1% |
|
· Upperhill recorded a rental yield of 9.0%, 0.5% points lower than the market average of 9.5%, compared to Westlands which had an average rental yield of 10.0% in Q3’2018, attributable to inadequate amenities and traffic congestion along key access ways such as Ngong Road and Mbagathi Way in Upperhill while Westlands is characterized by key amenities such as malls and schools and its proximity to Diplomatic Police Unit · Karen generated the highest yields of 10.8%, as the area offers the highest asking rents of Kshs 117/SQFT attributable to it being a prime area with Grade A and high-quality Grade B offices thus enabling the developers to charge premium rates · Thika Road and Mombasa Road recorded the least rental yields in the sector of 8.7% each, 0.9% points lower than the market average at 9.5%, driven by the low asking rents in the market of Kshs 82/SQFT and Kshs 85/SQFT attributable to the areas majorly offer low quality grade B and C offices and are also affected by high traffic snarl ups that have made them generally unattractive to firms |
|||||||||||
Source: Cytonn Research
- Mixed-Use Developments
In the mixed-use development sector, Jesus House of Praise International Church launched plans to build a 30-floor commercial property in Meru County located 1.6 km from Meru Town along the Meru-Embu-Nairobi Highway (size and other details undisclosed). The development will comprise of office spaces, retail complex, serviced apartments, hotel, church and conference halls. The move highlights the increased investment in commercial property in other counties outside Nairobi driven by high demand and low supply of the same. The real estate sector in Kenya is generally witnessing growing popularity of mixed-use developments (MUDs) mainly driven by the advantages of MUDs such as i) economies of scale and effective use of space hence maximization on returns, ii) creation of a live work and play environment, and iii) diversification and interdependence of the themes. We therefore expect the real estate sector to embrace the concept of Mixed-Use Developments, with the completed MUDs in Nairobi comprising of office and retail recording an average rental yield of 11.0%, 2.9% higher than the office and retail sector market average at 9.5%.
Other real estate highlights during the week are;
- Kiambu County Government has increased land rates as follows;
- Owners of stand-alone homes will pay between Kshs 5 and Kshs 12/SQM annually depending on location, up from a range of Kshs 2 and Kshs 3/SQM, representing a 240% average increase,
- Rental apartment owners will pay between Kshs 10 and Kshs 12/SQM up from Kshs 8/SQM, representing a 37.5% increase, and
- Industries will pay Kshs 10/SQM up from Kshs 8/SQM, representing a 25% increase,
- Commercial buildings’ owners will continue paying Kshs15/SQM, and
While the increase in land rates will result in higher revenues for the county, it will lead to an increase in property management costs for end users.
We expect continued increase in activities in the real estate sector, supported by government incentives such as the increased focus on affordable housing and heightened real estate development activities in county headquarters driven by urban population growth due to devolution.
The World Bank Group released the Doing Business 2019 Report, which investigates the regulations that enhance business activity in a country and those that constrain it. The report analyses survey results across 190 economies. The report covers regulations affecting 11 areas of the life of a business which include: starting a business, dealing with construction permits, getting electricity, registering property, getting credit, protecting minority investors, paying taxes, trading across borders, enforcing contracts, resolving insolvency, and labor market regulation.
We have previously covered Ease of Doing Business in our Ease of Doing Business in Kenya , when we spoke about Kenya’s improved score, and concluded with the areas we expect the government to improve upon.
In this note, we analyze the findings of the report with a focus on Kenya’s overall performance, specific areas that performed well, and those areas that need to be improved. This note breaks down the analysis as follows:
- Introduction to the Doing Business Report,
- Doing Business Report 2019:
- Kenya’s Ranking,
- Kenya’s Performance in Specific Areas and Reforms Highlighted, and,
- Areas of Improvement,
- Outlook on Kenya’s Doing Business Environment.
Section I: Introduction to the Doing Business Report
Launched in 2002, the Doing Business project by the World Bank provides objective measures of business regulations and their enforcement across 190 economies. By gathering and analyzing comprehensive quantitative data to compare business regulation environments across economies and over time, Doing Business encourages economies to compete towards more efficient business regulation and offers measurable benchmarks for reform. Doing Business measures the processes for business incorporation, getting a building permit, obtaining an electricity connection, transferring property, getting access to credit, protecting minority investors, paying taxes, trading across borders, enforcing contracts, resolving insolvency and labor market regulation. Each of the measured business regulatory areas is important to nascent and existing entrepreneurs. Details of these are highlighted below;
|
Ease of Doing Business Indicators |
||
|
No. |
Indicator |
Details (What is Measured) |
|
1. |
Starting a business |
Procedures, time, cost and paid-in minimum capital to start a limited liability company for men and women |
|
2. |
Dealing with construction permits |
Procedures, time and cost to complete all formalities to build a warehouse and the quality control and safety mechanisms in the construction permitting system |
|
3. |
Getting electricity |
Procedures, time and cost to get connected to the electrical grid, the reliability of the electricity supply and the transparency of tariffs |
|
4. |
Registering property |
Procedures, time and cost to transfer a property and the quality of the land administration system for men and women |
|
5. |
Getting credit |
Movable collateral laws and credit information systems |
|
6. |
Protecting minority investors |
Minority shareholders’ rights in related-party transactions and in corporate governance |
|
7. |
Paying taxes |
Payments, time and total tax and contribution rate for a firm to comply with all tax regulations as well as post-filing processes |
|
8. |
Trading across borders |
Time and cost to export the product of comparative advantage and import auto parts |
|
9. |
Enforcing contracts |
Time and cost to resolve a commercial dispute and the quality of judicial processes for men and women |
|
10. |
Resolving insolvency |
Time, cost, outcome and recovery rate for a commercial insolvency and the strength of the legal framework for insolvency |
|
11. |
Labour market regulation |
Flexibility in employment regulation and aspects of job quality |
Source: World Bank Doing Business Report 2019
Section II: Doing Business Report 2019
As opposed to previous years, the Doing Business report 2019 did not include labor market regulation data in the ranking. As a result, countries were ranked based on an average score of 10 metrics.
- Kenya’s Ranking:
Of the 190 countries, Kenya’s ranking improved by 19 positions to #61 from #80 in the 2018 Report. In Africa, Kenya maintained its 4th position from last year’s report after Mauritius, Rwanda and Morocco. The score improved by 5.1 points to 70.3 from 65.2 in the 2018 Report. Over the last 5-years, Kenya has improved by a total of 15.3 points and 75 positions as highlighted below:
|
Ease of Doing Business Kenya Ranking (Past 5-Years) |
||||||||
|
2015 |
2016 |
2017 |
2018 |
2019 |
||||
|
Ease of Doing Business Rank (1-190) |
136 |
113 |
92 |
80 |
61 |
|||
|
Ease of Doing Business Score (0-100) |
55.0 |
58.1 |
62.4 |
65.2 |
70.3 |
|||
|
Ease of Doing Business Average Score |
60.0 |
60.3 |
61.1 |
61.6 |
62.7 |
|||
Source: World Bank Doing Business Report 2019
- Kenya’s Performance in Specific areas and Key Reforms Highlighted:
With 5 reforms implemented among the 11 areas of focus, since the last report, Kenya was the 7th most improved country in terms of comprehensive ranking in ease of doing business. The three main drivers of this improvement were:
- Protection of Minority Investors – Kenya’s score increased by 20.0 points and improved by 51 positions to #11 from #62 in the 2018 report
- Getting Credit - Kenya’s score increased by 15.0 points and improved by 21 positions to #8 from 29 in the 2018 report
- Resolving Insolvency - Kenya’s score increased by 14.3 points and improved by 38 positions to #57 from #95 in the 2018 report
In Africa, Kenya was the 3rd most improved behind Djibouti and Togo, which increased their score by 8.9 and 6.3 points, respectively. These reforms were reflected in the significant improvement in the specific areas as highlighted in the chart below:
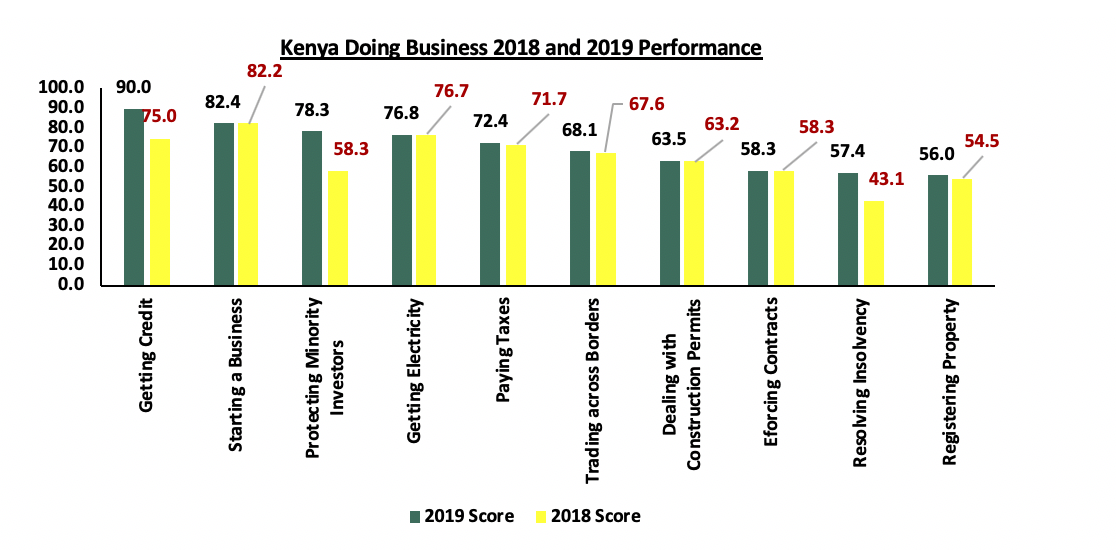
Source: World Bank Doing Business Report 2019
The areas credited for this improvement, as highlighted in the report, include:
- Registering Property
|
Registration of Property (Kenya) |
||
|
|
2018 |
2019 |
|
Registering Property (rank) |
125 |
122 |
|
Score for Registering Property (0-100) |
54 |
56 |
|
Procedures (number) |
9 |
9 |
|
Time (days) |
61 |
49 |
|
Cost (% of property value) |
6 |
6 |
|
Quality of land administration index (0-30) |
16 |
16 |
Source: World Bank Doing Business Report 2019
Kenya’s ranking Improved to positon 122 in 2019 from #125 in 2018 with the score improving by 2 points to 56 from 54 in the 2018 report. The World Bank acknowledged the following reforms as the cause of improvement:
Reforms: Kenya made registering property easier by introducing an online system to clear land rent rates. The Ministry of Lands and Physical Planning implemented an online land rent financial management system on the eCitizen portal, enabling property owners to determine the amount owed in land rent, make an online payment and obtain the land rates clearance certificate digitally. As a result, the rent payment process has been streamlined and now requires a lesser number of procedures and takes less time.
- Getting Credit
|
Getting Credit |
||
|
|
2018 |
2019 |
|
Getting Credit (rank) |
29 |
8 |
|
Score for Getting Credit (0-100) |
75 |
90 |
|
Strength of legal rights index (0-12) |
7 |
10 |
|
Depth of credit information index (0-8) |
8 |
8 |
|
Credit bureau coverage (% of adults) |
30 |
30 |
|
Credit registry coverage (% of adults) |
0 |
0 |
Source: World Bank Doing Business Report 2019
Kenya’s ranking Improved to #8 in 2019 from #29 in 2018 with the score improving by 15 points to 90 from 75 in the 2018 report. The World Bank acknowledged the enactment of the Movable Property Security Rights Act, 2017 as a major step and the main cause of improvement;
Reform: Kenya strengthened access to credit by introducing a new secured transactions law ‘The Movable Property Security Rights Act, 2017, which creates a unified secured transactions legal framework, and establishes a new unified collateral registry. This new law facilitates the use of movable property as collateral for credit facilities, establishes the office of the Registrar of Security Rights and provide for the registration of security rights in movable property. This Act also benefits small and medium-sized enterprises, which experience difficulty in accessing finance from the formal sector.
- Protecting Minority Investors
|
Protecting Minority Investors |
||
|
|
2018 |
2019 |
|
Protecting Minority Investors (rank) |
62 |
11 |
|
Score for Protecting Minority Investors (0-100) |
58 |
78 |
|
Extent of disclosure index (0-10) |
6 |
10 |
|
Extent of director liability index (0-10) |
5 |
10 |
|
Ease of shareholder suits index (0-10) |
9 |
9 |
|
Extent of shareholder rights index (0-10) |
5 |
7 |
|
Extent of ownership and control index (0-10) |
6 |
6 |
|
Extent of corporate transparency index (0-10) |
4 |
5 |
Source: World Bank Doing Business Report 2019
Kenya’s ranking Improved to #11 in 2019 from #62 in 2018 with the score improving by 20 points to 78 from 58 in the 2018 report. The CMA’s code of corporate governance was the primary reason for this improvement. The code is strict on the required levels of disclosure and pushes for more transparency by Kenyan companies;
Reforms: Kenya strengthened minority investor protections by increasing disclosure requirements, regulating the approval of transactions with interested parties and increasing available remedies if said transactions are prejudicial, increasing shareholders’ rights and role in major corporate decisions and requiring greater corporate transparency. Kenya enacted the Companies Amendment Act 2017, which holds directors liable for transactions with interested parties valued at 10% or more of a company’s assets and that cause damages to the company. Directors involved in prejudicial transactions are now required to pay damages, disgorge profits and may be disqualified from holding similar office for up to five years. Execution of this was witnessed In April 2018 when the Board of CMA issued a statement that it had taken administrative action against the NBK Board Members and former Senior Managers who served at the bank as at 31st December 2015 for the alleged misrepresentation of financial statements and embezzlement of funds at NBK. The Authority also recommended to the Office of the Director of Public Prosecutions the prosecution of some of the Senior Managers and further criminal investigations of additional individuals.
- Resolving Insolvency
|
Resolving Insolvency |
||
|
|
2018 |
2019 |
|
Resolving Insolvency (rank) |
95 |
57 |
|
Score for Resolving Insolvency (0-100) |
43 |
57 |
|
Time (years) |
5 |
5 |
|
Cost (% of estate) |
22 |
22 |
|
Recovery rate (cents on the dollar) |
28 |
31 |
|
Strength of insolvency framework index (0-16) |
9 |
13 |
Source: World Bank Doing Business Report 2019
Kenya’s ranking Improved to #57 in 2019 from #95 in 2018 with the score improving by 14 points to 57 from 43 in the 2018 report.
Reforms: Kenya made resolving insolvency easier by facilitating the continuation of the debtor’s business during insolvency proceedings, providing for equal treatment of creditors in reorganization proceedings and granting creditors greater participation in the insolvency proceedings. According to the Kenyan Insolvency Act, Administration is a proceeding intended to maintain the company as a going concern. The powers of the Board transfer to the Administrator who owes its duties to the company, and to the court. This is in contrast with receivership, where the Administrator owes duty to creditors. Implementation of this has been witnessed with the case of ARM Cement PLC, which was placed under administration in August 2018 following an application by the secured lenders. The running of the Company is now placed in the hands of PwC who have been named the Administrators of ARM Cement Plc
- Paying Taxes
|
Paying Taxes |
||
|
|
2018 |
2019 |
|
Paying Taxes (rank) |
92 |
91 |
|
Score for Paying Taxes (0-100) |
72 |
72 |
|
Payments (number per year) |
26 |
25 |
|
Time (hours per year) |
186 |
180 |
|
Total tax and contribution rate (% of profit) |
37 |
37 |
|
Post filing index (0-100) |
62 |
62 |
Source: World Bank Doing Business Report 2019
Kenya’s ranking Improved slightly to #91 in 2019 from #92 in 2018 with the score remaining flat at 72 points. Although no improvement in score, the World Bank acknowledged the fact that Kenya made a positive stride by streamlining the tax paying process through merging of all permits into a single unified business permit and by simplifying the value added tax schedule on its iTax platform.
- Areas of Improvement:
Despite the overall improvement, there remain areas that need to be improved. Below we highlight these areas and reforms for the same that have been implemented by other countries in sub-Saharan Africa within the coverage period of the 2019 report;
- Trading Across Borders:
|
Trading Across Borders |
||
|
|
2018 |
2019 |
|
Trading Across Borders (rank) |
106 |
112 |
|
Score for Trading Across Borders (0-100) |
68 |
68 |
|
Time to export |
||
|
Documentary compliance (hours) |
19 |
19 |
|
Border compliance (hours) |
21 |
16 |
|
Cost to export |
||
|
Documentary compliance (USD) |
191 |
191 |
|
Border compliance (USD) |
143 |
143 |
|
Time to import |
||
|
Documentary compliance (hours) |
60 |
60 |
|
Border compliance (hours) |
180 |
180 |
|
Cost to import |
||
|
Documentary compliance (USD) |
115 |
115 |
|
Border compliance (USD) |
833 |
833 |
Source: World Bank Doing Business Report 2019
Kenya’s rank declined to #112 from #106 in the 2018 report with the score remaining constant at 68 points. In our view, the performance in this metric can be improved through efficiency measures such as automation of custom procedures and establishment of proper controls to prevent corruption by custom officials. Other reforms as witnessed in other countries in Sub-Saharan Africa include;
- Employing electronic submission and processing of documents for exports: Uganda fully implemented the Centralized Document Processing Centre, an electronic processing platform that centralizes all documentary checks. Traders in Uganda also began using the Uganda Electronic Single Window, which allows for electronic submission of documents as well as for the exchange of information between trade agencies.
- Strengthening of border infrastructure for exports: Rwanda reduced border compliance time to 83 hours from 97 hours by having staff from the Rwanda Revenue Authority and the Tanzania Revenue Authority at the Rusomo one-stop border post, the result of the implementation of the Single Customs Territory.
- Enhancement of customs administration and inspections for exports and imports: Mauritius made exporting easier by introducing a risk-based management system which reduced border compliance time by 14 hours.
- Dealing with Construction Permits:
|
Dealing with Construction Permits |
||
|
|
2018 |
2019 |
|
Dealing with Construction Permits (Rank) |
124 |
128 |
|
Score for Dealing with Construction Permits (0-100) |
63 |
63 |
|
Procedures (number) |
16 |
16 |
|
Time (days) |
159 |
159 |
|
Cost (% of warehouse value) |
5 |
5 |
|
Building quality control index (0-15) |
9 |
9 |
Source: World Bank Doing Business Report 2019
Kenya’s rank declined to #128 from #124 in the 2018 report with the score remaining the same at 63 points. In our view, the performance in this metric can be improved through quality control reforms as witnessed in other countries in Sub-Saharan Africa. Some of the reforms include;
- Adopting new building regulations: Ghana strengthened construction quality control by imposing stricter qualification requirements for professionals in charge of technical inspections.
- Improved transparency: Burundi increased the transparency of dealing with construction permits by publishing regulations related to construction online and free of charge.
- Enforcing Contracts:
|
Enforcing Contracts |
||
|
|
2018 |
2019 |
|
Enforcing Contracts (rank) |
90 |
88 |
|
Score for Enforcing Contracts (0-100) |
58 |
58 |
|
Time (days) |
465 |
465 |
|
Cost (% of claim) |
42 |
42 |
|
Quality of judicial processes index (0-18) |
9 |
9 |
Source: World Bank Doing Business Report 2019
Kenya’s rank improved to #88 from #90 in in the 2018 report. Despite the improvement in rank, the score remained the same at 58.0, well below Kenya’s comprehensive score of 70.3. This indicates that Kenya still has room for improvement in this regard. This can be done through automation, digitization and improvement of judicial processes. Examples of reforms implemented in other countries in Sub-Saharan Africa to enhance enforcement of contracts include;
- Introducing a specialized commercial court: Djibouti and Ethiopia introduced dedicated benches to resolve commercial disputes.
- Automation of court processes: Madagascar introduced an electronic case management system, which employs random and automatic assignment of cases to judges throughout the courts.
- Expanding the alternative dispute resolution framework: Djibouti adopted laws that regulate all aspects of mediation as an alternative dispute resolution mechanism. Sudan recognized voluntary conciliation and mediation as ways of resolving commercial disputes.
Section III: Outlook on Kenya’s Doing Business Environment
Kenya has made significant political and economic reforms that have driven sustained economic growth and social development over the past decade. The same continues to be witnessed and the improvement in both ranking and score is a reflection of the same. Behind only Morocco (#60), Rwanda (#29) and Mauritius (#20) in the ranking, Kenya’s economy remains among the most attractive business environments in Africa. As highlighted in the report however, there exists room for Kenya to improve its business climate to attract more entrepreneurs and investors to start businesses and foreign direct investment. This can be achieved by;
- Streamlining the processes involved in starting a company by; (i) setting up a one-stop shop for all services required in starting a company, (ii) automating the processes involved, and (iii) eliminating minimum capital requirements.
- Improved sharing of credit information to facilitate lending decisions especially towards the private sector. Kenya should adopt additional sources of customer data, which generates incentives to improve borrower discipline especially following the enactment of Banking Act Amendment 2015 that effectively placed an interest rate cap on loans by commercial banks.
- The tax paying process can be made easier by (i) consolidating payments and filings of taxes, (ii) establishing taxpayer service centres, and (iii) allowing for more deductions, exemptions or lower tax rates.
- Kenya can improve on the efficiency of contract enhancement through (i) reducing the current case backlog by clearing inactive cases from the docket, (ii) automation of court and judicial procedures, (iii) complaints being filed electronically through a dedicated platform within the competent court, (iv) court fees being paid electronically within the competent court enforcing contracts, and (v) reducing the number of days taken to deliver case verdicts.
- Corruption remains an adverse factor in the country and has had a great impact on the economy. We analyzed this in detail in our focus on corruption. During the release of the Doing business report the World Bank gave a disclaimer that it does not factor in corruption in the ranking. As a result, the score does not indicate the extent to which corruption affects Kenya’s doing business environment. Comprehensive measures to handling corruption include (i) proper vetting of public officials by the Ethics and Anti-Corruption Commission, (ii) educating people on the effect corruption has on development, and (iii) independence of the judiciary in handling cases.
Disclaimer: The Cytonn Weekly is a markets report published by Cytonn Asset Managers Limited, “CAML”, which is regulated by the Capital Markets Authority. CAML is also an affiliate of Cytonn Investments Management Plc. However, the views expressed in this publication are those of the writers where particulars are not warranted. This publication, which is in compliance with Section 2 of the Capital Markets Authority Act Cap 485A, is meant for general information only and is not a warranty, representation, advice or solicitation of any nature. Readers are advised in all circumstances to seek the advice of a registered investment advisor.

- Talk to us
- Kenya
- P.O Box 20695 - 00200, Nairobi, Kenya
- Cell +254709101200
- Tel +254709101200
- WhatsApp +254741676635
- United States
- +254709101200
- DOWNLOAD OUR APP
-


- Kenya
- 8th Floor, Pinetree Plaza, Kaburu Drive, Ngong Road, Nairobi, Kenya
- USA
- Suite 1150, 1775 Eye Street NW, USA, Washington DC 20006, USA
- Investments
- High Yield
- Private Equity
- Real Estate
- Real Estate
- RiverRun Estates
- Cytonn Towers
- The Ridge
- Taraji Heights
- The Alma