Cytonn 2019 Markets Outlook
By Cytonn Research Team, Jan 13, 2019
Executive Summary
Global Markets Outlook
2018 was characterized by a moderate decline in global growth to 3.0% from a growth of 3.1% recorded in 2017 as per data from the World Bank, as the negative effects of the trade conflicts between the US, China and Eurozone, as well as a weaker outlook for key emerging markets such as China and Brazil weighed down growth. Central Banks’ Policy stance in advanced economies adjusted towards economic tightening, with the US Federal Reserve raising the Federal Funds Rate four times in 2018, while the European Central Bank indicated a cease to the monthly bond purchases in December 2018. However, with a decline in corporate earnings growth, possibility of a recession in the US and Germany, and a decline in the stock markets and oil prices, we expect that the global market in 2019 will likely be shaped by the monetary policy stance, a decline in global trade, and falling commodity prices, with global growth expected to come in at 2.9% in 2019;
Regional Market Outlook
In 2019, Sub Saharan Africa (SSA) is expected to register economic growth of 3.4%, higher than the 2.7% expected in 2018, and 2.6% recorded in 2017, according to the World Bank. The stronger growth will be driven by improvement in weather conditions which will boost agricultural production, improved growth in commodity driven countries such as Nigeria and Angola, and strong economic growth in Ethiopia, Ghana and Kenya at 8.8%, 7.3% and 5.8%, respectively;
Kenya Macro Economic Outlook
GDP Growth – Our outlook for 2019 is POSITIVE on GDP Growth. Economic growth of 5.7% - 5.9% is projected in 2019, supported by the recovery of the agriculture sector, growth in the tourism, real estate and manufacturing sectors with a focus on the “Big 4 Agenda”,
Inflation - Our outlook for 2019 is POSITIVE on Inflation. We expect muted inflationary pressures and the inflation rate to average 5.4% over 2019, which is within the government target range of 2.5% - 7.5%,
Currency - Our outlook for 2019 is NEUTRAL on Currency. We project the Kenya Shilling will range between Kshs 101.0 and Kshs 104.0 against the USD in 2019, supported by the Central Bank of Kenya (CBK) in the short term through its sufficient reserves of USD 8.0 bn, increasing diaspora remittances, and an improving current account position,
Interest Rates - Our outlook for 2019 is NEUTRAL on Interest Rates. We expect interest rates to remain relatively stable as the CBK continues to reject expensive bids amidst improved liquidity in the market;
Fixed Income Outlook
We do not expect upward pressure on interest rates due to increased demand for government securities, driven by improved liquidity in the market from the relatively high debt maturities, and as the government rejects expensive bids despite being behind their borrowing target.
Our view is that investors should be biased towards MEDIUM-TERM FIXED INCOME INSTRUMENTS to reduce duration risk associated with long-term debt, as the yield curve is relatively flat on the long-end;
Equities Outlook
We expect the strong macroeconomic environment and cheap valuations to provide support for the equities market in 2019. Despite expectations of slower corporate earnings growth, a number of counters in sectors such as Financial Services are trading at attractive prices.
We expect investors to come in at these attractive levels and the market to register net inflows from foreign investors, as they repatriate funds from developed economies, which are expected to record economic slowdowns in 2019, thereby resulting in a POSITIVE outlook for equities in 2019;
Private Equity Outlook
We expect more deal activity in the private equity space supported by a strong macroeconomic environment in Africa’s most developed PE markets, increasing Foreign Direct Investments and improvements in the Ease of Doing Business in Africa. Sector specific drivers like the need for consolidation in the Financial Services sector, the demand for quality education in the education sector, and the untapped potential in credit extension for FinTech, will continue to attract entry of private equity investors.
We are POSITIVE for the Private Equity Outlook in 2019;
Real Estate Outlook
Residential Sector: Our outlook for the residential sector is NEUTRAL. We expect the sector’s performance to remain flat with occupancy and transaction rates stagnating, and only selected markets continuing to exhibit high returns. The opportunity is in undersupplied segments such as low-cost housing and selected markets such as Kilimani, Riverside, Thindigua, and Runda Mumwe, which recorded attractive returns of 11.5%, 11.6%, 13.8% and 14.8%, respectively, in 2018;
Commercial Office Sector: Our outlook for the commercial office sector is NEGATIVE. The sector is constrained by oversupply, with the Nairobi region currently experiencing an oversupply of 5.3 mn SQFT that is forecasted to increase by 7.5% in 2019 to 5.7 mn SQFT.
Pockets of value remain, in differentiated concepts such as serviced offices that attract yields of up to 13.4% in markets such as Westlands, as well as areas with low office spaces supply such as Gigiri and Karen with rental yields of 10.5% and 9.2%, respectively;
Retail Sector: Our outlook for the retail real estate sector is NEUTRAL. Returns are expected to soften as a result of the current retail oversupply at 2.0 mn SQFT. Occupancy rates are expected to decline by 2.9% points to 76.9% from 79.8% in 2018, leading to reduced yields of 8.7%, from 9.0% in 2018.
We expect the continued entry of international retailers and expansion of local retailers to cushion the market. The opportunity is in County Headquarters in markets such as Mombasa and Mt. Kenya Regions that have retail space demand of 0.3 mn and 0.2 mn SQFT, attractive yields at 8.3% and 9.9%, and retail occupancy rates at 96.3% and 84.5%, respectively;
Mixed Use Developments (MUDs): Our outlook for MUDs is POSITIVE. We expect an increase in performance driven by the convenience they offer to tenants thus have stable occupancies.
The investment opportunity in the Nairobi Metropolitan Area is in areas such as Limuru Road, Karen, Upperhill and Kilimani, recording the highest rental yield returns of 9.7%, 9.4%, 8.7%, and 8.6%, respectively, in 2018;
Hospitality Sector: (Serviced Apartments) Our outlook for Serviced Apartments is POSITIVE given the country’s political stability, continued marketing of Kenya as an experience destination, and improved air transport and flight operations.
We expect international arrivals to grow by 30% to approximately 2.6 mn in 2019 from 2.0 mn in 2018, and expect occupancy rates in the serviced apartments sector to remain above 80.0% and result in a rental yield of above 7.0%. The investment opportunity is in areas such as Kilimani and Westlands markets with rental yields of above 10.0%;
Land Sector: Our outlook for land is POSITIVE with an expected capital appreciation of 4.9% in 2019, fueled by the demand for development land, improving infrastructure and demographics.
The investment opportunity in land lies in satellite towns such as Ruaka, Utawala, Ruiru and Thika, supported by high annual capital appreciation of 16.2%, 17.5%, 4.7%, 7.7%, respectively;
Infrastructure: Our outlook for infrastructure is NEUTRAL as we expect reduced infrastructural activities due to the reduced budget allocation for 2018/19 attributable to the government’s financial constraints given the country’s public debt, which currently stands at 56.4% of the GDP. We, however, expect continued execution of the planned infrastructure development such as roads, sewer connection in Ruiru and Kitengela, water improvement program and proposed light rail, which will allow for higher density construction and boost real estate;
Listed Real Estate: Our outlook for the listed real estate is NEGATIVE as we expect the Fahari I-REIT to continue trading at low prices and volumes in 2019 due to poor market sentiment with investors inclining towards brick and mortar real estate which offered higher yields of 7.3% compared to an average yield of 5.7% earned from the REIT in H1’2018, and the REIT recording an average share price of Kshs 10.6 in 2018, a 49.0% decline from its initial price of Kshs 20.8 in November 2015.
- Cytonn Asset Managers, the regulated affiliate of Cytonn Investments, will host an event on Saturday, 19th January, to discuss the 2019 Market Outlook. You can attend the event at Sarova Stanley (RSVP here: cytonn.com/training ) or follow the coverage via Facebook Live;
- Maurice Oduor, Principal Officer for Cytonn Asset Managers, was on KTN News to discuss the 2019 Business Outlook. Watch Maurice here;
- Caleb Mugendi, Senior Investments Analyst, was on CNBC to discuss performance of the Kenyan Shilling. Watch Caleb here;
- Faith Maina, Investments Analyst, was on NTV to discuss the 2019 Business Outlook. Watch Faith here;
- Derrick Kieya, Investments Analyst, was on Lolwe TV to discuss the 2018 Markets Review. Watch Derrick here;
- We continue to hold weekly workshops and site visits on how to build wealth through real estate investments. The weekly workshops and site visits target both investors looking to invest in real estate directly and those interested in high yield investment products to familiarize themselves with how we support our high yields. Watch progress videos and pictures of The Alma, Amara Ridge, The Ridge, and Taraji Heights. Key to note is that our cost of capital is priced off the loan markets, where all-in pricing ranges from 16.0% to 20.0%, and our yield on real estate developments ranges from 23.0% to 25.0%, hence our top-line gross spread is about 6.0%. If interested in attending the site visits, kindly register here;
- We continue to see very strong interest in our weekly Private Wealth Management Training (largely covering financial planning and structured products). The training is at no cost and is open only to pre-screened participants. We also continue to see institutions and investment groups interested in the training for their teams. The Cytonn Foundation, under its financial literacy pillar, runs the Wealth Management Training. If interested in our Private Wealth Management Training for your employees or investment group, please get in touch with us through wmt@cytonn.com. To view the Wealth Management Training topics, click here;
- For recent news about the company, see our news section here;
- We have 10 investment-ready projects, offering attractive development and buyer targeted returns of around 23.0% to 25.0% p.a. See further details here: Summary of Investment-Ready Projects;
- We continue to beef up the team with ongoing hires for Financial and Real Estate Advisors for our offices in Nairobi, Nakuru, Kisumu, and Nyeri. Visit the Careers Section on our website to apply;
- Cytonn Centre for Affordable Housing (CCFAH) is looking for a 2-acre land parcel for a joint venture in Kiambu County (Ruiru, Kikuyu, and Lower Kabete), Nairobi County and its environs.
The parcel should be; (i) fronting a main road, or not more than 800 metres from the main road, and (ii) priced at Kshs 20 mn per acre or below. For more information or leads email us at affordablehousing@cytonn.com.
2018 was characterized by a moderate decline in global economic growth, which was weighed down by the negative effects of the trade conflicts between the US, China and Eurozone, as well as weaker growth in key emerging markets such as China and Brazil, arising from country-specific factors such as (i) country-wide industrial action in Brazil, (ii) political uncertainty in Britain due to Brexit, and (iii) country-wide protests in France. According to the World Bank, global GDP growth in 2019 is expected to come in at 2.9%, a decline from the 3.0% recorded in 2018, as a result of softened international trade and investments, trade tensions and substantial financial markets pressure in emerging markets and developing economies.
Following the flat economic growth in 2018, we look at the three key themes that we believe will shape the global markets in 2019:
- Monetary Policy Tightening…
Monetary policy stances are expected to tighten in advanced economies. The US Federal Open Market Committee (FOMC) is expected to continue on the path towards interest rate normalization through the tightening of monetary policy, with expectation of two further rate hikes in 2019. The European Central Bank (ECB) is expected to maintain its benchmark interest rates through the first half of 2019, having announced that it would stop its asset-bond buying program in December 2018. This stance to gradually remove accommodative policies by Central Banks highlights the stronger growth in their specific regions. However, a benign inflationary environment and increased possibility of a recession in Germany and the US in 2019 are key downside risks to further tightening monetary policy.
- Global Trade to Slow Down…
Escalating trade tensions between major trade partners and the potential shift away from a multilateral, rule-based trading system are key threats to the global economy in 2019. The US has been imposing tariffs on a variety of imports with major trade partners, including on USD 200.0 bn worth of imports from China, and trading partners undertaking or promising retaliatory and other protective measures. An intensification of trade tensions, and the associated rise in policy uncertainty, could dent business and financial market sentiment, trigger financial market volatility, and slow investment and trade. Higher trade barriers would also disrupt global supply chains and slow the spread of new technologies, ultimately lowering global productivity. More import restrictions would also make tradable consumer goods less affordable.
- Falling Commodity Prices…
Global commodities registered declines in 2018, with agriculture, non-energy commodities, Brent Crude and metals & minerals registering declines of 3.0%, 3.7%, 5.5%, and 7.9%, respectively, while energy gained by 4.9%, according to the World Bank Commodity Prices Index. Oil prices closed 2018 at USD 53.8 per barrel, having averaged USD 68.0 per barrel during 2018. According to the World Bank, oil prices are forecasted to decline marginally to an average of USD 67.0 per barrel in 2019. This is owing to an expected decline in demand following the slowdown in the global economy, an oversupply of oil in the market, and an expected rise in shale oil output from the US. However, efforts by the OPEC organization, namely capping of oil output in the first half of 2019, should help rebalance the market in terms of supply and demand.
Having considered the three key factors that will drive Global Markets in 2019, we now look at specific economic regions and expectations for their GDP performance in 2019:
|
World GDP Growth Rates |
|||||||||||
|
|
Region |
2015a |
2016a |
2017a |
2018e |
2019f |
|||||
|
1. |
India |
8.2% |
7.1% |
6.7% |
7.3% |
7.5% |
|||||
|
2. |
China |
6.9% |
6.7% |
6.9% |
6.5% |
6.2% |
|||||
|
3. |
Sub-Saharan Africa* |
3.1% |
1.3% |
2.6% |
2.7% |
3.4% |
|||||
|
4. |
United States |
2.9% |
1.6% |
2.2% |
2.9% |
2.5% |
|||||
|
5. |
Brazil |
(3.5%) |
(3.3%) |
1.1% |
1.2% |
2.2% |
|||||
|
6. |
Middle East, North Africa |
2.8% |
5.1% |
1.2% |
1.7% |
1.9% |
|||||
|
7. |
Euro Area |
2.1% |
1.9% |
2.4% |
1.9% |
1.6% |
|||||
|
8. |
United Kingdom |
2.3% |
1.8% |
1.7% |
1.3% |
1.4% |
|||||
|
9. |
South Africa (SA) |
1.3% |
0.6% |
1.3% |
0.9% |
1.3% |
|||||
|
10. |
Japan |
1.4% |
0.6% |
1.9% |
0.8% |
0.9% |
|||||
|
|
Global Growth Rate |
2.8% |
2.4% |
3.1% |
3.0% |
2.9% |
|||||
|
*Including South Africa |
|||||||||||
Source: World Bank
United States:
The US economy is expected to grow by 2.5% in 2019, 0.4% points lower than the 2.9% growth expected in 2018, owing to the trade tensions with major trading partners, tighter financial conditions, and as the fiscal stimulus from the tax cut package fades. The Federal Reserve has continued implementing its tighter monetary policy, with four rate hikes in 2018, of 25 bps each, in March, June, October and December, with the Federal Funds rate ending the year at a band of 2.25% - 2.50%, from a range of 1.25% - 1.50% at the beginning of 2018. The Federal Reserve has signaled the possibility for two additional rate hikes in 2019, with the key downside risk being a benign inflationary environment, with inflation currently at 1.9%, 10 bps below the Fed’s targeted 2.0% inflation rate, and increased possibility of a recession in the US in 2019 owing to an intensified trade war and tighter financial conditions.
In 2018, the US Government raised tariffs on about USD 300.0 bn worth of imports, mostly from China. Other countries have retaliated with tariffs on about USD 150.0 bn worth of US exports. The tariffs may expand further in 2019 as the Trump Administration has threatened additional tariffs for some of its major trading partners, including China, if current negotiations do not yield intended results. This will result in higher prices, which will weigh down on activity, especially exports and investments.
The stock market declined in 2018, with the S&P 500 losing 6.2%. In terms of valuations, the Cyclically Adjusted Price/Earnings (CAPE) ratio is currently at 29.0x, 72.6% above the historical average of 16.8x, indicating the market, despite being on a declining trend, remains overvalued relative to historical levels. In 2019, the stock market is expected to be bearish weighed down by negative investor sentiments owing to increased concerns of a slower global economic growth, tighter monetary conditions, increased trade and geopolitical tensions and expected lower corporate earnings with major technology companies revising downwards their earnings expectations.
Eurozone:
The Eurozone is expected to grow by 1.6% in 2019, 0.3% points lower than the 1.9% growth expected in 2018. This is as a result of continued country wide specific factors such as; (i) political uncertainty in Britain due to the Brexit vote, (ii) country-wide protests in France, and (iii) a looming recession in Germany, all of which are likely to continue to suppress economic activity in the region in 2019. The European Central Bank (ECB) is expected to maintain its benchmark interest rates through the first half of 2019. The ECB also announced that it would stop its asset-bond buying program in December 2018. We therefore expect growth to decelerate in 2019 as monetary stimulus is withdrawn, declining global trade results in reduced exports from the region, geopolitical tensions persist, and business activity slows down as evidenced by a Eurozone composite PMI of 51.1 in December, which was at the weakest level in four-years.
Eurozone stock markets were on a declining trend in 2018, with the EuroStoxx 600 index declining by 17.4% during the year. In terms of valuations, the EuroStoxx 600 Index is currently trading at a P/E of 14.8x, 27.1% below its historical average of 20.3x, indicating markets are undervalued and are trading at cheap valuations relative to historical levels. In 2019, the stock market is expected to be bearish weighed down by negative investor sentiments owing to the reduced global economic growth, and heightened geopolitical tensions, following civil unrest in France and increased uncertainty on Britain’s withdrawal from the EU (“Brexit”).
China:
The Chinese economy is expected to grow by 6.2% in 2019, slower than the 6.6% expected growth in 2018, owing to persistent trade tensions with the US and a deceleration of industrial production and export growth. China and the US have been caught up in a trade war, with the US imposing a 10.0% tariff on Chinese goods worth USD 200.0 bn, and China imposing a further retaliatory 10.0% tariff on goods worth USD 60.0 bn. This will however be offset by robust domestic demand aided by policies to boost consumption. Supportive fiscal policies that have been undertaken or announced are also expected to largely offset the negative impact of higher tariffs.
The Chinese Government has adopted a more accommodative monetary policy amid concerns about the slowdown in investment, and negative impact of the trade war with the US. The Chinese Central Government is focusing on encouraging local governments to speed up spending of unused revenues and banks to ensure adequate financing for local government projects. The Chinese Government announced CNY 1.2 tn (USD 180.0 bn) in business tax cuts in addition to policies aimed at boosting infrastructure expenditure. The People’s Bank of China also announced that it would cut the required reserve ratio (RRR) by 1.0% point to free up bank reserves and inject money in the banking system to be lent out to stimulate the economy.
The stock market recorded a negative return in 2018, with the Shanghai Composite declining by 28.7% in 2018. In terms of valuations, the Shanghai Composite index is currently trading at a P/E of 11.6x, 24.7% lower than the historical average P/E of 15.4x, indicating the market is currently undervalued, and is currently trading at cheap valuations relative to historical levels. In 2019, the stock market is expected to be bearish weighed down by negative investor sentiments owing to the prolonged trade tensions with the US, heightened geopolitical tensions, and an overall slower economic growth.
In 2019, Sub Saharan Africa (SSA) is expected to register economic growth of 3.4%, higher than 2.7% expected in 2018 and 2.6% recorded in 2017, according to the World Bank. This is due to expectations of easing drought conditions, which will boost agricultural production and improved growth in commodity driven countries such as Nigeria and Angola, which are expected to grow by 2.2% and 2.9% in 2019, up from 1.9% and (1.8%) expected in 2018, respectively. Nigeria’s economic growth is expected to be propelled by growth in the Agriculture and Services sector and on the back of an improved outlook for oil prices despite the restrained oil production and political uncertainty ahead of February’s general elections. Angola’s economic growth is expected to return to expansion in 2019, bolstered by support from the IMF, which approved a USD 3.7 bn credit facility in December 2018 to support structural and economic reforms and help the country restore external and fiscal sustainability. Angola’s dependence on the volatile oil sector remains the key downside risk to the outlook. South Africa’s GDP growth is also expected to improve to 1.3% in 2019 from 0.9% in 2018, despite political uncertainty ahead of the country’s elections scheduled in May 2019. Other countries expected to drive growth in 2019 are Ethiopia, Ghana and Kenya with expected economic growth rates of 8.8%, 7.3% and 5.8%, respectively. Despite the expected growth, the regional economic growth still faces downside risks, mainly:
- Difficult business conditions and poor infrastructure,
- High levels of public debt in most economies in the region and sharp currency declines, which will make the servicing of foreign currency-denominated debt a concern,
- Political uncertainties in some countries like Nigeria and South Africa ahead of the elections scheduled for February and May 2019, respectively, and,
- Escalating trade tensions involving major economies in the world
In 2018, the Kenyan economy recorded an average growth of 6.0% for the first three quarters of 2018, compared to an average of 4.7% in a similar period in 2017. The growth was mainly supported by (i) recovery in agriculture due to improved weather conditions, (ii) increased output in the manufacturing, and wholesale & retail trade sectors, and (iii) continued recovery of the tourism sector.
We project 2019 GDP growth to come in between 5.7% and 5.9%, supported by:
- Continued growth of the agricultural sector, as a result of expected improvement of weather conditions and increased budgetary allocation to the sector for ongoing irrigation projects, strategic food reserves, cereal and crop enhancement and crop insurance schemes, in order to enhance food security and nutrition, which is a key pillar on the “Big 4 Agenda”,
- Continued strong growth in the real estate and tourism sectors. Tourism has continued to record doubled digits growth, having averaged 15.1% in the first three quarters of 2018 mainly boosted by a rise in the number of visitors’ arrivals as well as a notable rise in conference activities. We expect growth in the sector to continue, driven by the introduction of direct flights to and from the US and the continued efforts of marketing of the country’s tourist attraction sites. Growth in the real estate sector is expected to be supported by improved infrastructure, as well as the increased focus on the affordable housing initiative,
- Public infrastructural investments are expected to be driven by the budgetary allocations in infrastructural projects, with the highest allocation being on road constructions at Kshs 87.5 bn (domestically financed) and Kshs 34.2 bn (foreign financed), as well as allocations in energy, rail and ports construction, ICT and on sustaining water supplies, and,
- Growth in the manufacturing sector driven by the Kenyan Government’s initiatives, like reducing the cost of energy, aimed towards supporting the various industries, such as textile, leather and agro-business.
Private sector credit growth improved in 2018, averaging 3.4% in the 10-months to October, compared to 2.3% in a similar period in 2017, but remained below the 5-year average of 12.4%. The low credit growth has persisted since the enactment of the Banking (Amendment) Act, 2015, with banks finding it difficult to adequately price risk, prompting banks to reassess their risk assessment framework, preferring to lend to the government at the expense of the private sector, as returns are higher on a risk-adjusted basis. With the rate cap still in place coupled with the implementation of IFRS 9, which requires banks to be more prudent in terms of provisioning for bad loans, we expect private sector credit growth to remain well below the government target of 18.3%.
Currency:
The Kenyan Shilling remained resilient in 2018, appreciating by 1.3% against the USD during the year to close at Kshs 101.3, from Kshs 103.2 in 2017. This saw the shilling reclassified to a stabilized arrangement from floating by the IMF, necessitated by the fact that Kenya Shilling has remained within a margin of 2.0% against its “de facto” anchor exchange rate with the US Dollar for at least 6-months. On an YTD basis, the Kenyan Shilling has gained by 0.1% against the US Dollar, and we expect it to remain stable within a range of Kshs 101.0 and Kshs 104.0 against the USD in 2019, with the underlying fundamentals still similar to the previous year, supported by:
- The CBK’s intervention activities, as they have sufficient forex reserves to protect the shilling against any instability, currently at USD 8.0 bn, equivalent to 5.2-months of import cover,
- Improving diaspora remittances, having increased by 42.5% to USD 2.2 bn during the first 10-months of 2018, from USD 1.6 bn during the same period in 2017, with the largest contributor being North America at USD 1.2 bn attributed to; (a) recovery of the global economy, (b) increased uptake of financial products by the diaspora due to financial services firms, particularly banks, targeting the diaspora, and (c) new partnerships between international money remittance providers and local commercial banks making the process more convenient,
- The continued narrowing of the current account deficit to 5.3% in the 12-months to September 2018, compared to 6.5% in September 2017. The narrowing of the current account deficit is largely due to increased exports of tea and horticulture, increased diaspora remittances, strong receipts from tourism, and lower imports of food and SGR-related equipment in 2018, relative to 2017. Come 2019, the current account is likely to come under pressure mainly due to the continued rise of the oil’s import bill mainly attributed to increased domestic demand, coupled with an expected recovery of global oil prices, and,
- A decline in food imports and improved agricultural exports as production improves due to improved weather conditions.
Inflation:
In 2018, inflation averaged 4.7% compared to the 2017 average of 8.0%. Inflation rose towards the tail end of the year to 5.7% in December, mainly due to rising fuel prices due to the implementation of the 8.0% VAT on fuel. We expect inflation to average 5.4% in 2019, within the government target range of 2.5% - 7.5% with inflationary pressure gradually picking up, due to the base effect and the uptick in international oil prices. We also expect the effects of the 8.0% VAT on petroleum products as well as other tax policy measures introduced in a bid to raise revenue in line with the government’s efforts of fiscal consolidation to continue being felt in 2019, especially in the first half of the year. Inflationary pressure is however, expected to be mitigated by the continued decline in food prices following favorable weather conditions, as well as lower energy prices due to the recent downward revision in electricity tariffs.
Interest Rates:
We expect monetary policy to remain relatively stable in 2019, and lean to a possible easing, as the CBK monitors Kenya’s inflation rate and the currency. The inflation rate is expected to remain within the government target of 2.5% - 7.5% due to improved weather conditions, leading to relatively lower food inflation, while the currency is expected to remain stable supported by improved diaspora remittances and a narrowing current account deficit.
The table below summarizes the various macro-economic factors and the possible impact on the business environment in 2018. With three indicators being positive, three at neutral and one negative, the general outlook for the business environment in 2019 is POSITIVE. The only change from last year’s outlook is on investor sentiment to neutral from positive in 2018, necessitated by the increased sell-offs by foreign investors in the equity markets as well as the increased risk perception, which has seen the country’s debt distress raised from low to moderate.
|
Macro-Economic & Business Environment Outlook |
||
|
Macro-Economic Indicators |
2019 Outlook |
Effect |
|
Government Borrowing |
•With the expectations of KRA not achieving the revenue targets, we expect this to result in further borrowing from the domestic market to plug in the deficit. This coupled with heavy maturities might lead to pressure on domestic borrowing •The government has a net external financing target of Kshs 272.0 bn to finance the budget deficit, coupled with the need to retire 3 commercial loans maturing in H1’2019. We expect this to put pressure on yields on Eurobond yields coupled with the higher country risk perception by investors, partly attributed to the International Monetary Fund (IMF) raising the risk of Kenya’s debt distress from low to moderate on October |
Negative |
|
Exchange Rate |
•We project that currency will range between Kshs 101.0 and Kshs 104.0 against the USD in 2018, with continued support from the CBK in the short term through its sufficient reserves of USD 8.0 bn (equivalent to 5.2-months of import cover) |
Neutral |
|
Interest Rates |
•We expect slight upward pressure on interest rates in H1’2019, as the government falls behind its domestic borrowing targets for the fiscal year coupled with heavy domestic maturities of Kshs 586.1 bn for the current financial year. This is however expected to be mitigated by the increased demand for government securities due to improved liquidity in the market and crowding out of the private sector |
Neutral |
|
Inflation |
•We expect inflation to average 5.4% and within the government target range of 2.5% - 7.5% |
Positive |
|
GDP |
•5.8% growth projected in 2019, lower than the expected growth rate of 6.0% in 2018, but higher than the 5-year historical average of 5.4% |
Positive |
|
Investor Sentiment |
•We expect 2019 to register improved foreign inflows from the negative position in 2018, mainly supported by long term investors who enter the market looking to take advantage of the current low/cheap valuations in select sections of the market |
Neutral |
|
Security |
•We expect security to be maintained in 2019, especially given that the political climate in the country has eased, with security maintained and business picking up |
Positive |
Eurobond Yields:
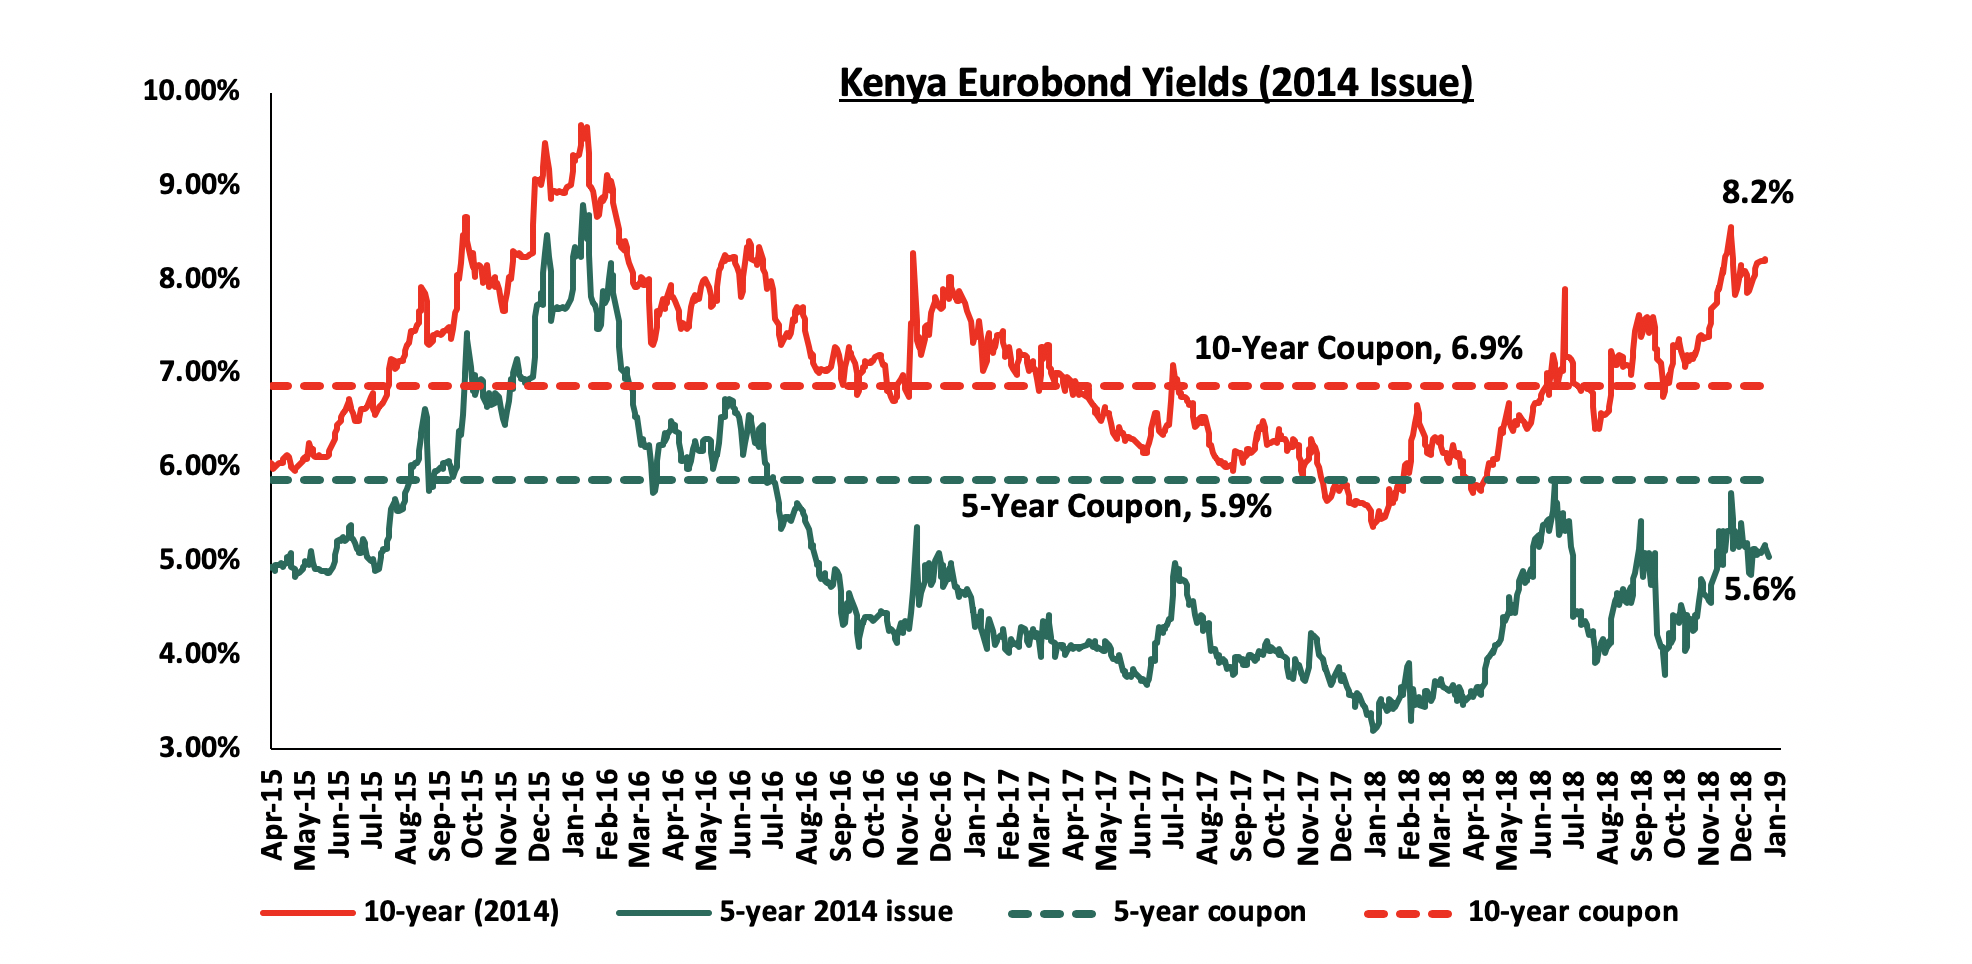
According to Bloomberg, yields on the 5-year and the 10-year Eurobond issued in 2014 increased by 2.2% points and 3.2% points to close at 5.6% and 8.2% at the end of 2018, from 3.4% and 5.0% at the end of 2017, respectively. We expect the trend in rising yields to continue mainly due to higher country risk perception by investors, partly attributed to the International Monetary Fund (IMF) raising the risk of Kenya’s debt distress from low to moderate in October. This coupled with the aggressive tightening monetary policy regime adopted by the U.S Federal Open Market Committee (FOMC), and with the prospects of additional hikes in 2019, is expected to exacerbate the rise in yields as most foreign investors continue pulling out their capital in the wake of rising US treasury yields. Furthermore, the government has a foreign borrowing target of Kshs 272.0 bn, and needs to retire three commercial loans maturing in H1’2019 totaling to Kshs 200 bn, including the repayment of about Kshs 78.3 bn of the debut Eurobond in June. As such, investors will require higher yields to match the risk profile.
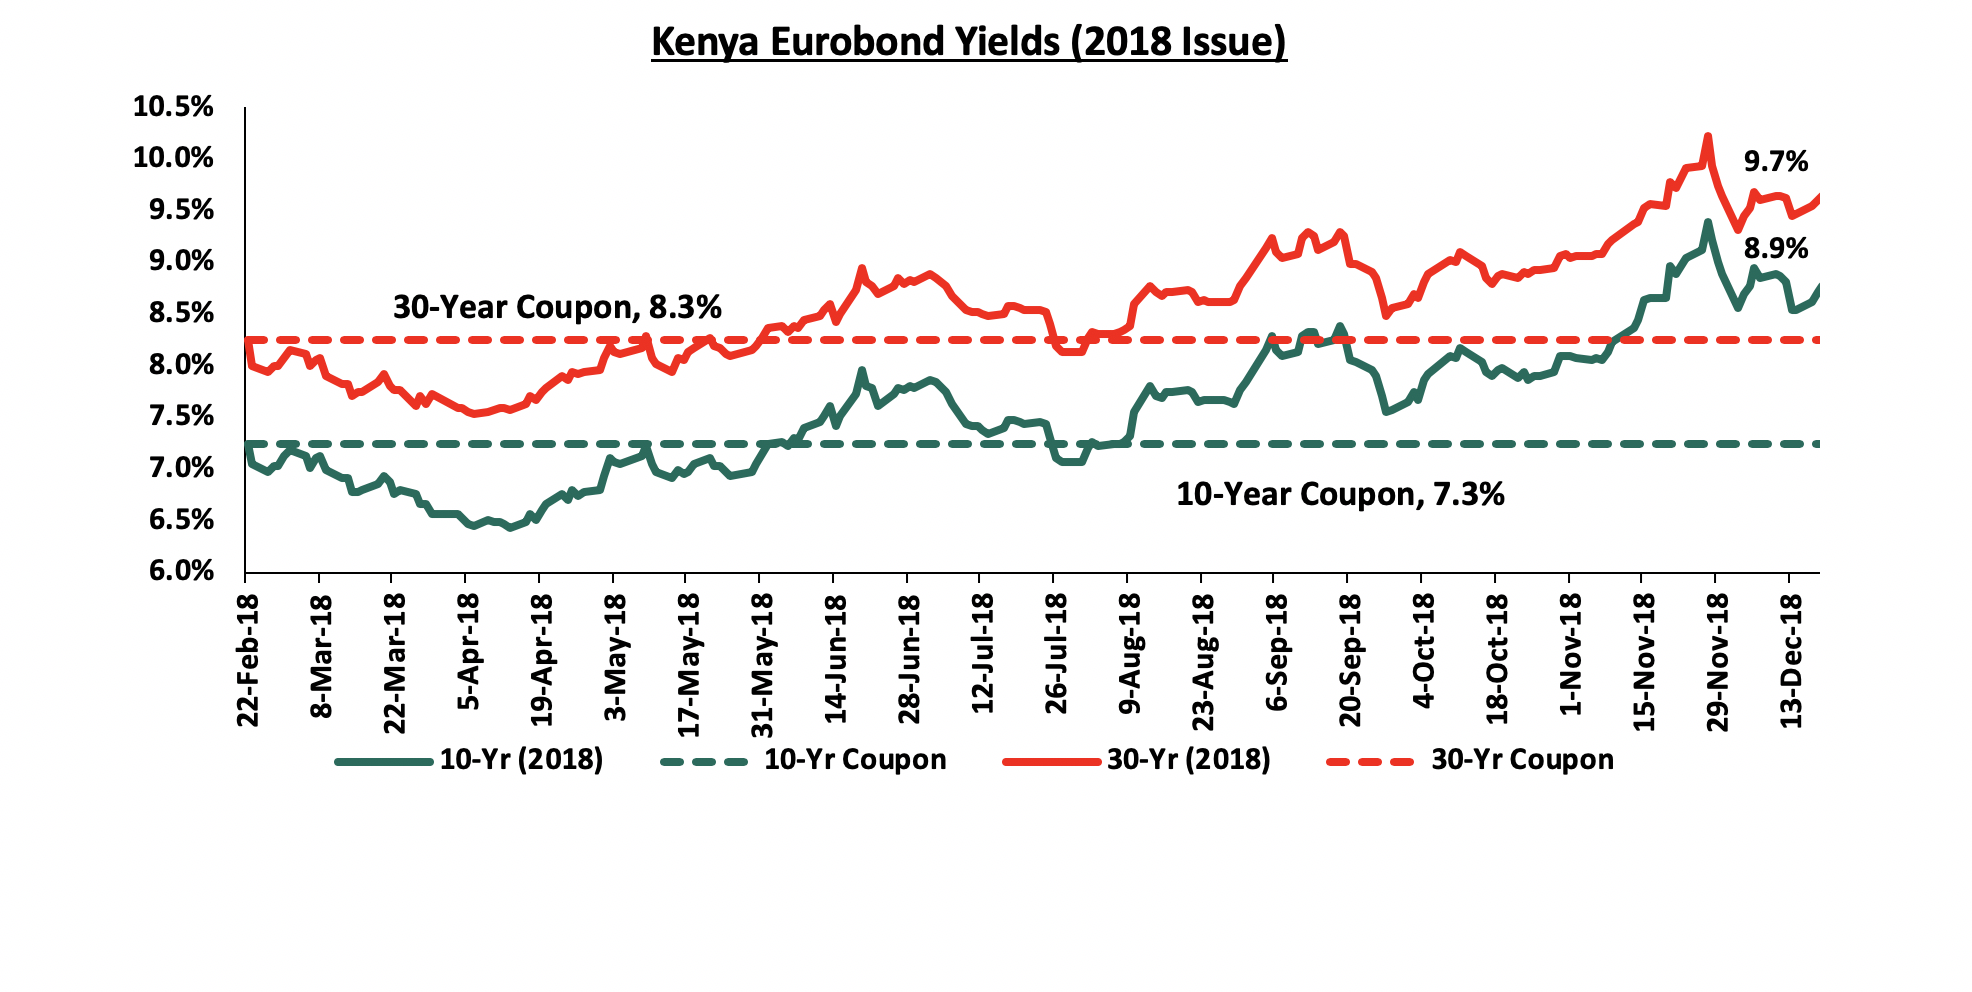
For the February 2018 Eurobond issue, the yields on the 10-year Eurobond and the 30-year Eurobond have increased by 1.7% points and 1.5% points to close the year at 8.9% and 9.7% from a yield of 7.3% and 8.3% when they were issued in February 2018, respectively.
The government is currently 35.9% behind its domestic borrowing target, currently having borrowed Kshs 107.2 bn domestically, against the pro-rated target of Kshs 167.2 bn, going by the revised government domestic borrowing target of Kshs 299.8 bn as per the Budget Review and Outlook Paper (BROP) 2019. The result of this is expected average monthly borrowing of Kshs 129.8 bn in the 2nd half of the current fiscal year. We however do not expect this to lead to upward pressure on interest rates, with the increased demand on government securities, driven by improved liquidity, provided the government does not accumulate too much short term debt during the year, which would worsen the government’s debt maturity profile.
Below is a summary of treasury bills and bonds maturities and the expected borrowings over the same period. The government will need to borrow Kshs 129.8 bn on average each month for the rest of the fiscal year in order to meet the revised domestic borrowing target of Kshs 299.8 bn, and also cover arising T-bill and T-bond maturities, as illustrated in the graph below.
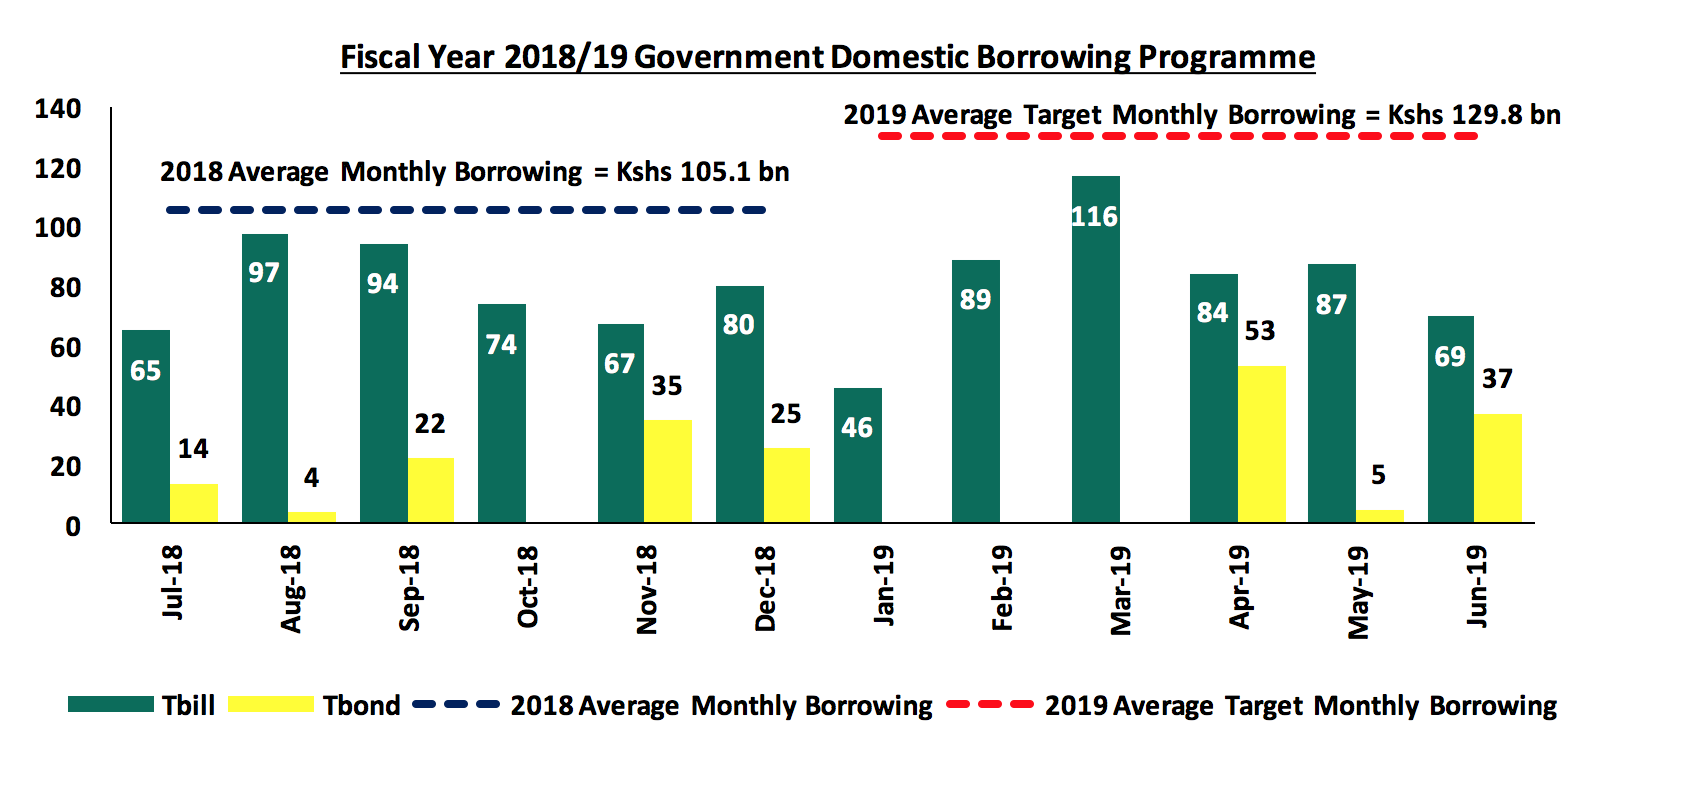
Fig: Schedule of Treasury bills and bonds maturities and the expected target borrowings in the 2018-2019 fiscal year to cater for the maturities and additional government borrowing.
In the first two auctions in 2019, T-Bill subscription has averaged 209.6% indicating improved demand. During the week, T-bills were over-subscribed, with the overall subscription coming in at 281.6%, compared to 137.6% recorded the previous week. Subscription rates for the 91, 182, and 364-day papers came in at 355.8%, 244.6%, and 288.8% from 31.6%, 73.3%, and 244.3%, the previous week, respectively. Yields on all the papers declined, with the weighted average interest rate of accepted bids coming in at 7.2%, 8.9% and 10.0% for the 91, 182, and 364-day papers, respectively. Despite the decline in yields, the government managed to raise Kshs 48.9 bn, higher than its weekly quantum of Kshs 24.0 bn, indicating the ability of the government to raise domestic debt while keeping rates low by rejecting expensive bids.
Rates in the fixed income market have remained stable as the government rejects expensive bids despite being behind their borrowing target. However, a budget deficit that is likely to result from depressed revenue collection creates uncertainty in the interest rate environment as any additional borrowing in the domestic market goes to plug the deficit. Despite this, we do not expect upward pressure on interest rates due to increased demand on government securities, driven by improved liquidity in the market owing to the relatively high debt maturities. Our view is that investors should be biased towards MEDIUM-TERM FIXED INCOME INSTRUMENTS to reduce duration associated with the long-term debt, coupled with the relatively flat yield curve on the long-end due to saturation of long-term bonds.
In 2018, the Kenyan equities market was on a downward trend, with NASI, NSE 25 and NSE 20 declining by 18.0%, 17.1% and 23.7%, respectively. Since the peak in February 2015, NASI and NSE 20 are down 20.9% and 48.4%, respectively. The only large cap gainer during the year was Barclays Bank, which gained 14.1%, while the largest losers were East Africa Breweries (EABL), Bamburi Cement, Diamond Trust Bank (DTB), NIC Group and Safaricom, which lost 26.6%, 26.4%, 18.5%, 17.6% and 17.0%, respectively.
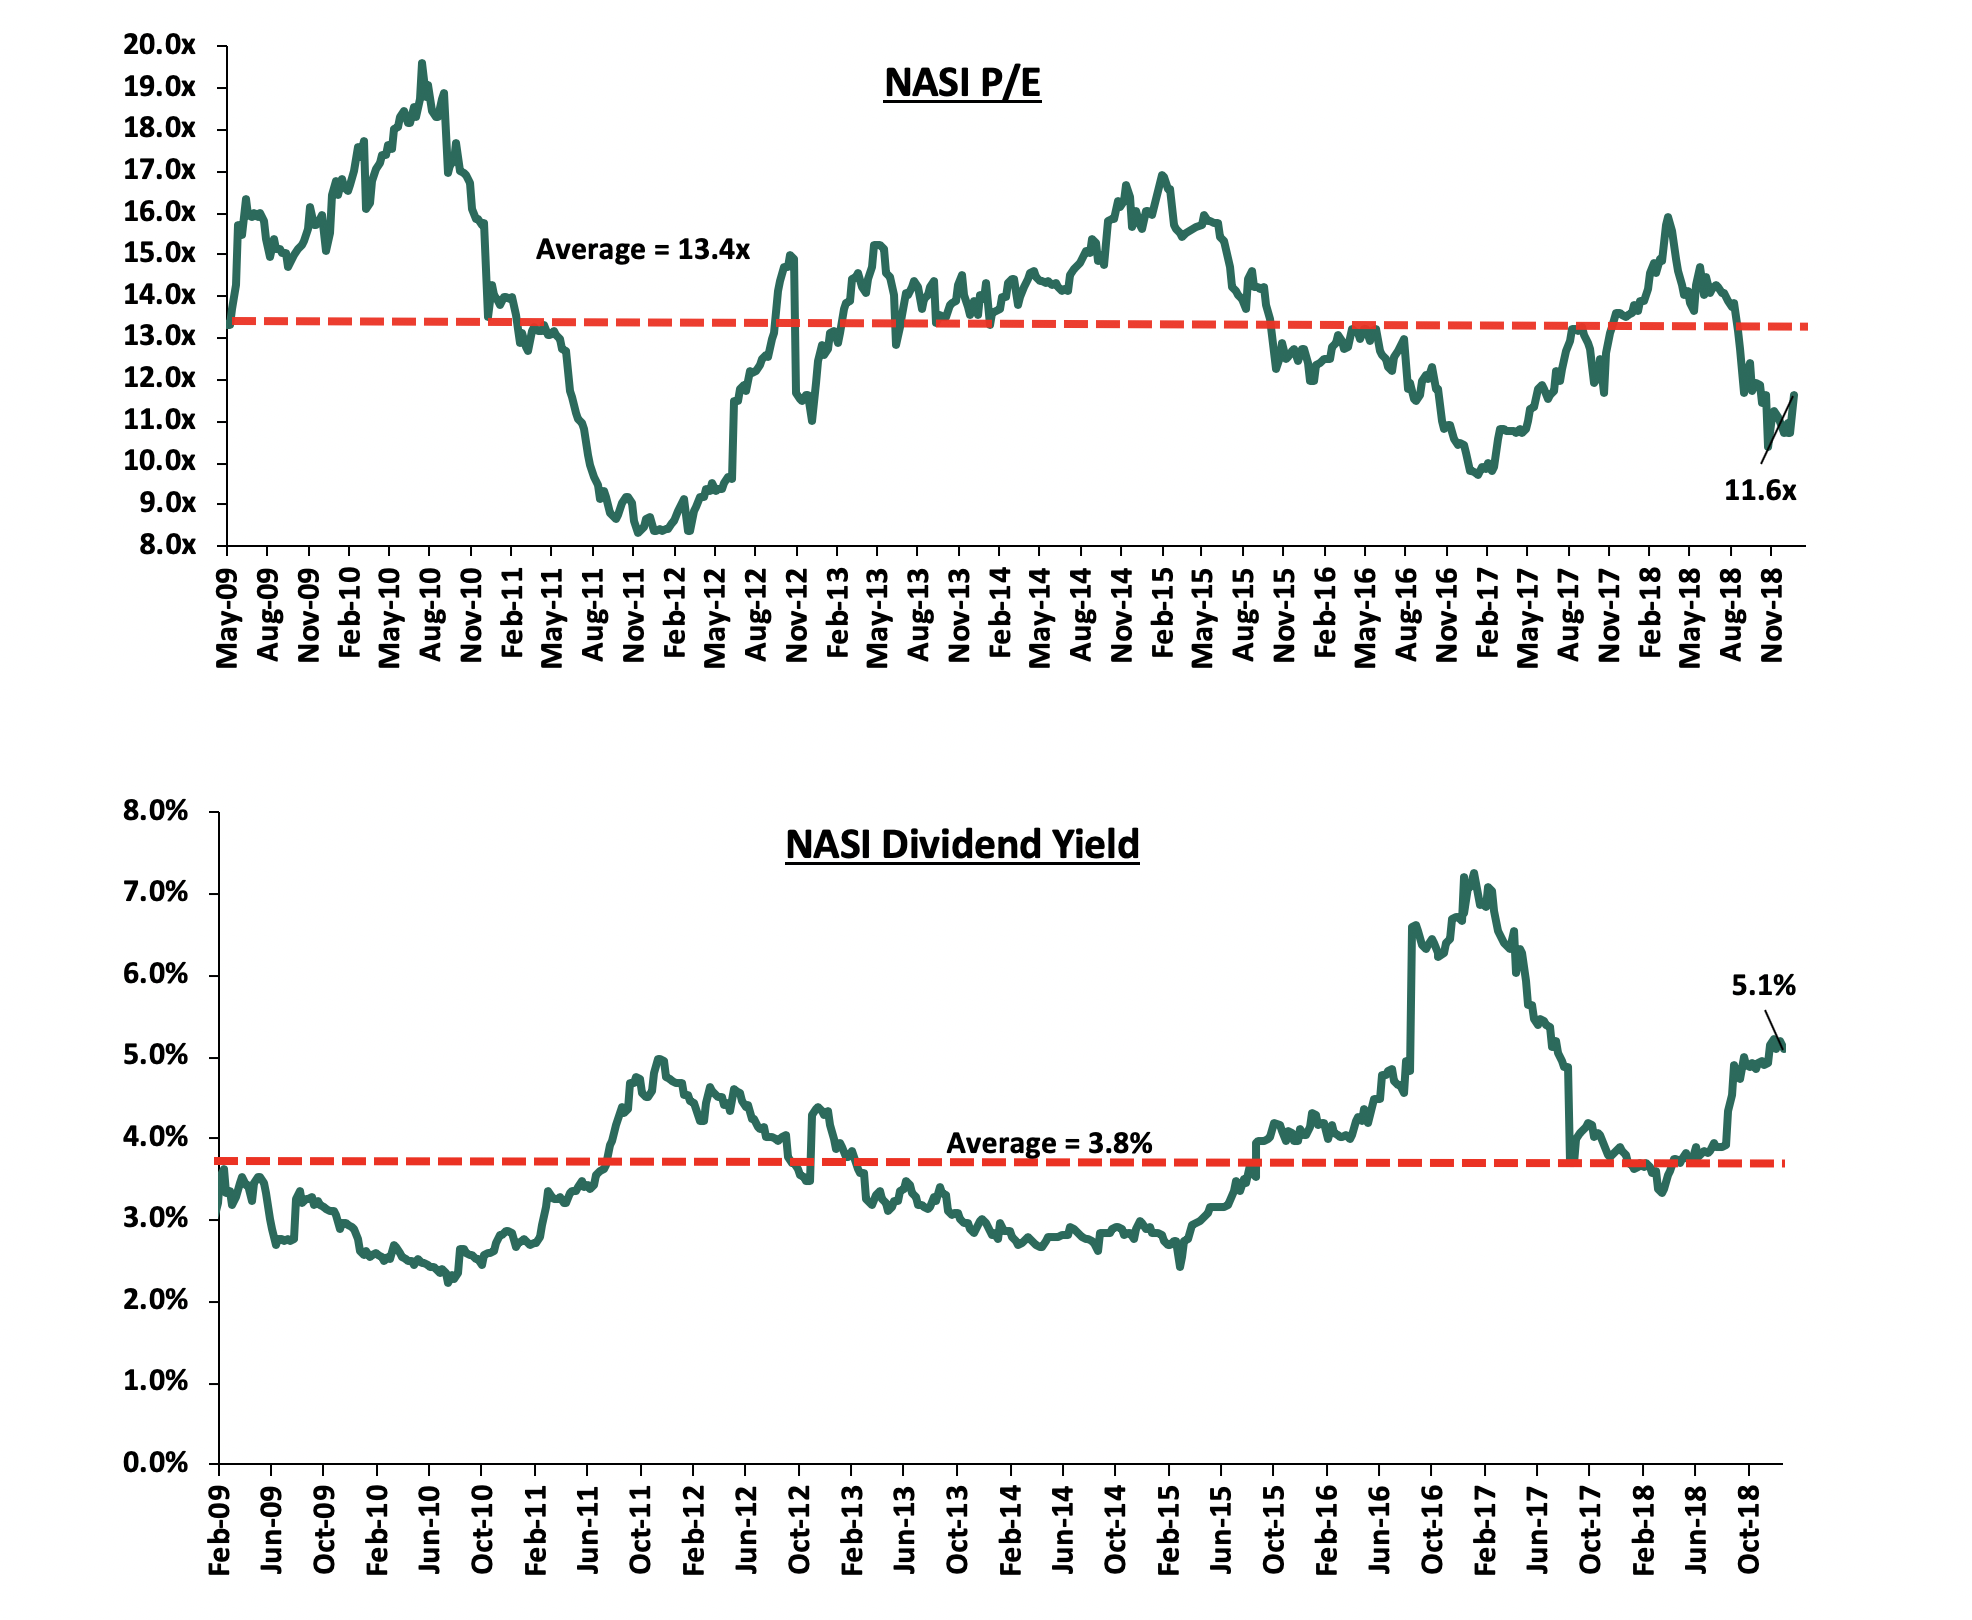
Following the sustained price declines, the market valuation declined to below its historical average with NASI P/E currently at 11.6x compared to the historical average of 13.4x. Equity turnover during the year rose by 2.3% to USD 1,723.8 mn from USD 1,684.4 mn in FY’2017. Foreign investors remained net sellers with a net outflow of USD 288.8 mn, a 146.6% increase compared to net outflows of USD 113.7 mn recorded in FY’2017. The foreign investor outflows during the year was largely due to negative investor sentiment, as international investors exited the broader emerging markets due to the rising US interest rates, improved corporate performance in the US, and the strengthening US Dollar.
The year also saw 8 companies issue profit warnings to investors, compared to 12 companies that issued profit warnings in 2017. The companies cited the relatively tougher operating environment, which affected the top-line revenue, leading to rising inefficiencies, and consequently declining net income. However, we note that 4 of the companies that issued profit warnings in 2018 also issued in 2017, suggesting their poor run in performance is due to specific company business models as opposed to the operating environment. The companies are summarized in the table below.
|
Companies that issued profit warning comparison |
||
|
No |
2017 |
2018 |
|
1 |
Bamburi Cement |
Bamburi Cement |
|
2 |
Britam Holdings |
Britam Holdings |
|
3 |
HF Group |
HF Group |
|
4 |
Deacons East Africa |
Deacons East Africa PLC |
|
5 |
Flame Tree |
Kenya Power & Lightning Company |
|
6 |
BOC Kenya |
Sanlam |
|
7 |
Standard Group |
UAP-Old Mutual |
|
8 |
Family Bank |
Sameer Africa |
|
9 |
Mumias Sugar |
|
|
10 |
Nairobi Business Ventures |
|
|
11 |
Unga Group |
|
|
12 |
Standard Chartered Bank Kenya |
|
Market Performance
During the week, the equities market was on an upward trend with NASI, NSE 20 and NSE 25 gaining 4.1%, 0.4% and 3.4%, respectively, taking their YTD performances to 1.6%, (1.4%) and 0.9%, for NASI, NSE 20 and NSE 25, respectively. The equities market performance during the week was driven by gains in large caps such as, Safaricom, Equity Group, Standard Chartered Bank Kenya (SCBK) and Barclays Bank, which gained 9.9%, 9.5%, 2.2% and 1.8%, respectively.
Equities turnover rose by 103.7% during the week to USD 21.9 mn from USD 10.7 mn the previous week, owing to a shortened trading week due to the New Year holiday, taking the YTD turnover to USD 29.2 mn. Foreign investors remained net sellers for the week, with a net selling position of USD 1.9 mn, a 30.6% decrease from last week’s net selling position of USD 2.8 mn.
The market is currently trading at a price to earnings ratio (P/E) of 11.6x, 13.4% below historical average of 13.4x, and a dividend yield of 5.1%, above the historical average of 3.8%. The current P/E valuation of 11.6x is 19.6% above the most recent trough valuation of 9.7x experienced in the first week of February 2017, and 39.8% above the previous trough valuation of 8.3x experienced in December 2011. In our view, at current valuations, there is value in the market, with the current P/E valuation being 27.0% below the most recent peak of 15.9x in March 2018. The charts below indicate the historical P/E and dividend yields of the market.
Weekly Highlights
During the week, the amendment to the Income Tax Act, included in the Finance Act 2018, was made public. The amendment makes it a requirement for Kenyan firms to pay a 30.0% tax on dividends received from their subsidiaries, and are redistributed to shareholders. Under the previous legislation, a holding company would receive dividends from its subsidiary, without paying the withholding tax, if its ownership in the subsidiary exceeded 12.5%. The tax is payable on dividends distributed out of net income that have not been previously taxed. The introduced amendments scrapped the requirement by companies to maintain a dividend tax account, effectively abolishing and replacing the compensating tax, which would be chargeable on distribution of untaxed gains or profits. The distribution of qualifying dividends attracts withholding tax at the rate of 5.0% for residents, and 10.0% for non-resident shareholders. However, distribution of dividends to a company controlling more than 12.5% of the distributing company is exempt from withholding tax. Thus, with the new regulation being enforced, it seems that companies distributing the tax-exempt dividends from subsidiaries to their holding companies, would not be exempted from the withholding tax even if the holding company owns more than 12.5% of the subsidiary, and effectively, in our view, creating a higher tax expense, which is a contradiction to the prevailing provision. Secondly this would also mean that there would be double taxation, given that dividends are obtained from after-tax income, and redistribution of the same, does not change the fact the income had undergone taxation. When enforced, it may also lead to a downgrade of the country’s investment attractiveness, given the relatively stricter tax profile that would effectively reduce the absolute dividend income received by investors.
Commercial Bank of Africa (CBA) has issued a cash buy-out offer of Kshs 1.4 bn to Jamii Bora bank. The Kshs 1.4 bn buyout represents a steep discount from the Kshs 3.4 bn book value as at Q1’2018. This essentially implies the transaction, if the offer is accepted and no further injections made, would happen at a Price to Book ratio (P/Bv) of 0.4x, significantly lower than the average P/B ratio of 1.6x of recent transactions in the banking sector. Jamii Bora had a deposit base of Kshs 5.0 bn, and a net loan book of Kshs 7.9 bn. The bank had a relatively solid capital base, with a total capital to risk-weighted assets ratio of 19.3%, exceeding the 14.5% statutory requirement by 4.8% points. The bank’s financial performance has been deteriorating since Q1’2017, possibly caused by the implementation of the Banking (Amendment) Act 2015, which capped interest chargeable on loans at 4.0% above the Central Bank Rate (CBR), with the bank’s loan book declining to Kshs 8.3 bn as at FY’2017, from Kshs 10.5 bn in FY’2016, in the first full year of the interest rate cap implementation. The declining loan book consequently saw the interest income decline by 36.2% to Kshs 1.4 bn in FY 2017, from Kshs 2.2 bn as at FY’2016. Consequently, operating income declined 57.8% to Kshs 0.5 bn from Kshs 1.3 bn in FY’2016. With the decline in operating income faster than the decline in total operating expenses of 28.0% to Kshs 1.3 bn from Kshs 1.8 bn, the bank consequently recorded losses, and the loss-making trend continued to Q1’2018. We are of the view that the bank’s acquisition presents the best-case scenario, to navigate the relatively tougher and competitive operating environment, amid expectation that Mshwari under CBA may be spun off and operate under Jamii Bora, with possibly the intention of sharping management’s focus on the corporate and Small and Medium Enterprise (SME) banking in the merged entity after the NIC-CBA merger. We are of the view that the huge discount to the equity value in the offer, may be due to (i) the possibility of an additional capital injection by CBA, with Jamii Bora operating at a negative liquidity position, and (ii) the high Non Performing Loans ratio (NPL) of 22.4% as at Q1’2018, with gross NPLs of Kshs 2.2 bn. In conclusion, we note that the pace of consolidation activity especially in the banking sector has picked up, and we expect this to continue, as banks merge to form strategic partnerships, or are acquired, especially those that do not serve a niche, and are struggling to operate in the current environment. We also expect acquisition transactions to take place at significantly cheaper multiples, going forward. The table below highlights the various transactions that have happened in the banking sector over the last 5-years.
|
Acquirer |
Bank Acquired |
Book Value at Acquisition (Kshs bns) |
Transaction Stake |
Transaction Value (Kshs bns) |
P/Bv Multiple |
Date |
|
CBA Group |
Jamii Bora Bank |
3.4 |
100.00% |
1.4 |
0.4x |
19-Jan* |
|
AfricInvest Azure |
Prime Bank |
21.2 |
24.20% |
5.1 |
1.0x |
19-Jan |
|
NIC Group |
CBA Group |
30.6** |
Undisclosed |
Undisclosed |
N/A |
Dec-18* |
|
KCB Group |
Imperial Bank |
Unknown |
Undisclosed |
Undisclosed |
N/A |
18-Dec |
|
SBM Bank Kenya |
Chase Bank ltd |
Unknown |
75.00% |
Undisclosed |
N/A |
18-Aug |
|
DTBK |
Habib Bank Kenya |
2.4 |
100.00% |
1.8 |
0.8x |
17-Mar |
|
SBM Holdings |
Fidelity Commercial Bank |
1.8 |
100.00% |
2.8 |
1.6x |
16-Nov |
|
M Bank |
Oriental Commercial Bank |
1.8 |
51.00% |
1.3 |
1.4x |
16-Jun |
|
I&M Holdings |
Giro Commercial Bank |
3 |
100.00% |
5 |
1.7x |
16-Jun |
|
Mwalimu SACCO |
Equatorial Commercial Bank |
1.2 |
75.00% |
2.6 |
2.3x |
15-Mar |
|
Centum |
K-Rep Bank |
2.1 |
66.00% |
2.5 |
1.8x |
14-Jul |
|
GT Bank |
Fina Bank Group |
3.9 |
70.00% |
8.6 |
3.2x |
13-Nov |
|
Average |
|
|
76.10% |
|
1.6x |
|
|
* Announcement date |
||||||
|
** Book Value as of the announcement date |
||||||
Kenya Equities Outlook
In 2019, the factors that will affect the direction of the Kenyan equities market include:
- Corporate Earnings: On average, we expect earnings growth for the year 2019 to come in at 8.1%, lower than our 2018 expectation of 12.0%. The expectation of lower earnings growth for 2019 is mainly due to (i) anticipation of depressed earnings from commercial banks as the full implementation of the new IFRS 9 standard, which uses a prospective approach to credit risk provisioning, is completed, thereby meaning that provisioning expense will likely be incurred on the income statement, rather than the balance sheet, as allowed in the initial year of IFRS 9 implementation. This, coupled with the rising Non Performing Loans (NPLs) will likely lead to lower earnings on a higher provisioning expense, and (ii) given the persistence of the tight operating environment, non-financials are also likely to report suppressed earnings weighed down by factors such as the limited credit access;
- Capital Markets Investor Sentiment: We expect the equities market to register increased foreign inflows in 2019, mainly supported by:
- Existence of value to be derived from stocks, with the market, and various counters trading at cheaper valuations relative to historical levels, which provide attractive entry opportunities for medium and long-term investors,
- With the slowdown in the global economy, we expect reduced capital flight from frontier and emerging economies into developed economies, and,
- Generally, Kenya remains more attractive compared to other frontier markets boosted by stronger economic growth compared to other economies in the region such as Nigeria, and Kenya’s rank at position 61 in the Ease of Doing Business, higher than regional peers Uganda and Tanzania, which will attract investors seeking the high growth in frontier markets;
- Diversification of Capital Markets and New Listings: We expect a number of activities to be undertaken by NSE in 2019 including (i) a possible commencement of derivatives trading at the bourse in Q2’2019, with the testing phase now completed, with the main types of derivatives being stock and index futures, (ii) the Central Depository and Settlement Corporation’s (CDSC) plan to launch a new trading platform that would allow a settlement cycle of 1 day (t+1), and possibly implementing margin trading, and, (iii) we expect both new listings (Initial Public Offerings (IPOs)), and cross listings of stocks from other African countries. Once implemented, these initiatives would result in; (i) increased liquidity in the market by increasing the volume of securities available for trading, and (ii) improve depth of the capital market by increasing product offerings at the exchange, and consequently attracting investors. Key challenges in the market, however, are the deferment of these initiatives without clear timelines, and the low uptake of the new products introduced in the exchange, such as the Barclays Gold ETF, which may be attributed to lack of proper investor education. We maintain our view that there remains the need for increased focus towards extensive public education, and engagement before rolling out new products;
- Monetary Policy Direction: We expect monetary policy to remain relatively stable in 2019, and lean to a possible easing, as the CBK monitors Kenya’s inflation rate, and the currency. The inflation rate is expected to remain within the government target of 2.5% - 7.5% due to improved weather conditions, leading to relatively lower food inflation, while the currency is expected to remain stable supported by improved diaspora remittances, and a narrowing current account deficit;
As can be seen in the table below, we expect equities market activity in 2019 to be driven by (i) continued economic recovery, with the GDP growth rate for the year projected at between 5.7% - 5.9% supported by agriculture and tourism, (ii) an 8.1% growth in corporate earnings, and (iii) attractive valuations in a majority of the counters, with the market currently trading at P/E of 11.6x, 13.4% below the historical average of 13.4x, thereby providing attractive entry point, and possibly a higher capital appreciation gain potential. Compared to 2018, we have maintained our “POSITIVE” outlook on the macroeconomic environment and valuations of the market. Our outlook on corporate earnings growth was however downgraded to “NEUTRAL”, on a slower expected corporate earnings growth of 8.1% compared to the 12.0% earnings growth in 2018. We have also changed our outlook on investor sentiment and security to “NEUTRAL” from “POSITIVE” last year due to expectations of a possible dampening of investor sentiment on equities given the expected global economic slowdown, leading to higher volatility. We however expect positive inflows especially in select large cap stocks as foreign investors take advantage of the cheap valuations whilst leveraging on dividend income earned. As such in consideration of the above, we have a “POSITIVE” outlook on Kenyan equities going into 2019.
|
Equities Market Indicators |
Outlook 2019 |
Current View |
|
Macro-economic Environment |
• GDP growth is expected to continue recovery in 2019, and come in at between 5.7%-5.9%. This will be driven by recovery of agriculture and tourism • Interest rates are expected to remain at the current levels, as the CBK monitors inflation and exchange rates |
Positive |
|
Corporate Earnings Growth |
• We expect corporate earnings growth of 8.1% in 2019, lower than the expected 12.0% growth for 2018, weighed down by the relatively tougher operating environment, as several firms cite lack of credit access, and the base effect of relatively higher earnings in 2018 |
Neutral |
|
Valuations |
• With the market currently trading at a P/E of 11.6x, and expected earnings growth of 8.1%, the market is currently trading at a forward P/E of 10.7x, representing a potential upside of 24.9% compared to historical levels. |
Positive |
|
Investor Sentiment and Security |
• We expect 2019 to register improved foreign inflows from the negative position in 2018, as investors possibly balance out the slower expected global growth, and mainly supported by long term investors who enter the market looking to take advantage of the current low/cheap valuations in the market • We expect security to be maintained in the country supported by government initiatives towards maintaining internal security |
Neutral |
Equities Universe of Coverage
Below is our Equities Universe of Coverage:
|
Equities Universe of Coverage |
||||||||
|
Banks |
Price as at 4/1/2019 |
Price as at 11/1/2019 |
w/w change |
YTD Change |
Target Price* |
Dividend Yield |
Upside/Downside** |
P/TBv Multiple |
|
Diamond Trust Bank |
156.0 |
152.0 |
(2.6%) |
(2.9%) |
283.7 |
1.7% |
88.4% |
0.9x |
|
NIC Bank |
27.4 |
27.6 |
0.5% |
(0.9%) |
48.8 |
3.6% |
80.8% |
0.7x |
|
Ghana Commercial Bank*** |
4.6 |
4.6 |
(0.2%) |
(0.2%) |
7.7 |
8.3% |
76.5% |
1.1x |
|
Access Bank |
5.8 |
5.7 |
(2.6%) |
(16.9%) |
9.5 |
7.1% |
75.2% |
0.4x |
|
KCB Group |
37.4 |
36.9 |
(1.2%) |
(1.5%) |
61.3 |
8.1% |
74.3% |
1.2x |
|
Zenith Bank*** |
21.7 |
21.9 |
0.7% |
(5.2%) |
33.3 |
12.4% |
64.9% |
1.0x |
|
Equity Group |
33.8 |
37.0 |
9.5% |
6.0% |
56.2 |
5.4% |
57.5% |
1.8x |
|
UBA Bank |
7.9 |
7.4 |
(7.0%) |
(4.5%) |
10.7 |
11.6% |
57.1% |
0.5x |
|
I&M Holdings |
90.5 |
91.0 |
0.6% |
7.1% |
138.6 |
3.8% |
56.2% |
0.9x |
|
Co-operative Bank |
13.9 |
13.9 |
(0.4%) |
(3.1%) |
19.9 |
5.8% |
49.5% |
1.2x |
|
CRDB |
150.0 |
140.0 |
(6.7%) |
(6.7%) |
207.7 |
0.0% |
48.4% |
0.5x |
|
Ecobank Ghana |
7.5 |
7.5 |
0.0% |
0.0% |
10.7 |
0.0% |
43.1% |
1.6x |
|
CAL Bank |
1.0 |
1.0 |
1.0% |
2.0% |
1.4 |
0.0% |
40.0% |
0.8x |
|
Union Bank Plc |
6.0 |
6.0 |
0.0% |
7.1% |
8.2 |
0.0% |
35.8% |
0.6x |
|
HF Group |
5.6 |
5.4 |
(3.9%) |
(2.5%) |
6.6 |
6.5% |
28.7% |
0.2x |
|
Stanbic Bank Uganda |
30.9 |
30.0 |
(3.0%) |
(3.2%) |
36.3 |
3.9% |
24.8% |
2.1x |
|
Barclays |
10.9 |
11.1 |
1.8% |
1.4% |
12.5 |
9.0% |
21.6% |
1.5x |
|
Guaranty Trust Bank |
33.5 |
33.5 |
0.0% |
(2.8%) |
37.1 |
7.2% |
17.9% |
2.1x |
|
SBM Holdings |
5.9 |
6.0 |
1.7% |
1.0% |
6.6 |
5.0% |
14.0% |
0.9x |
|
Bank of Kigali |
290.0 |
290.0 |
0.0% |
(3.3%) |
299.9 |
4.8% |
8.2% |
1.6x |
|
Standard Chartered |
190.3 |
194.5 |
2.2% |
0.0% |
196.3 |
6.4% |
7.4% |
1.6x |
|
Stanbic Holdings |
90.0 |
90.0 |
0.0% |
(0.8%) |
92.6 |
2.5% |
5.4% |
0.9x |
|
Bank of Baroda |
138.0 |
135.0 |
(2.2%) |
(3.6%) |
130.6 |
1.9% |
(1.4%) |
1.2x |
|
FBN Holdings |
7.5 |
7.4 |
(0.7%) |
(6.9%) |
6.6 |
3.4% |
(7.0%) |
0.4x |
|
Standard Chartered Ghana |
21.1 |
21.1 |
0.0% |
0.4% |
19.5 |
0.0% |
(7.7%) |
2.6x |
|
National Bank |
5.2 |
5.5 |
5.4% |
2.6% |
4.9 |
0.0% |
(10.3%) |
0.4x |
|
Stanbic IBTC Holdings |
47.0 |
46.2 |
(1.8%) |
(3.8%) |
37.0 |
1.3% |
(18.5%) |
2.4x |
|
Ecobank Transnational |
14.0 |
13.5 |
(3.6%) |
(20.6%) |
9.3 |
0.0% |
(31.3%) |
0.5x |
|
**Target Price as per Cytonn Analyst estimates* **Upside / (Downside) is adjusted for Dividend Yield* **Banks in which Cytonn and/or its affiliates are invested in** **Stock prices indicated in respective country currencies* |
||||||||
We are “POSITIVE” on equities for investors as the sustained price declines has seen the market P/E decline to below its historical average. With a number of counters in sectors such as Financial Services, trading at attractive prices relative to historical level, we expect increased market activity, and possibly increased inflows from foreign investors, as they take advantage of the attractive valuations, and repatriate funds from developed economies, which are expected to record economic slowdowns in 2019, thereby resulting in positive performance, relative to 2018.
Summary of 2018 Private Equity Activity
The year 2018 saw a slight slowdown in private equity (PE) activity across Sub-Saharan Africa, with the total value of reported African private equity deals in H1’2018 being USD 0.9 bn, a 10.0% drop from USD 1.0 bn reported in H1’2017. In regards to fund raising, the total value of African PE fundraising in H1’2018 was USD 2.1 bn. This is an improvement compared to the total value fundraising in H1’2017, which was reported at USD 2.0 bn. The slowdown was attributed to macroeconomic headwinds that hit two of Africa’s most developed PE markets, South Africa and Nigeria, coupled with a slump in oil prices, which negatively affected private investments. The table below highlights fundraising activity by sector in Africa;
|
2018 Private Equity Fundraising Activity by Sector |
||
|
Sector |
Funding Raised (Kshs bns) |
Entities Funded |
|
Fintech |
27.0 |
10 |
|
Financial Services |
2.8 |
3 |
|
Education |
4.9 |
2 |
|
Real Estate |
None Disclosed |
|
|
Hospitality |
None Disclosed |
|
|
Total |
34.7 |
15 |
2019 Outlook
Despite the slowdown in 2018, we view the long-term growth trajectory for private equity as POSITIVE, supported by the following key factors;
- Economic Growth: According to the World Bank, GDP growth in Sub-Saharan Africa rebounded to 2.4% in 2017, after slowing sharply to 1.3% in 2016. Growth in the region is projected to continue to rise to 2.7% in 2018 and an average of 3.4% in 2019-20, on the back of firming commodity prices and gradually strengthening domestic demand. According to IMF analysis, private investment increases when GDP growth is high; a 1%-point increase in GDP growth rates leads to a 0.21% points increase in the private investment rate. We expect this positive correlation to hold, and as a result private equity activity is set to improve,
- Political Stability: According to IMF data, reforms that strengthen the judiciary and regulatory environment are crucial for promoting private investment during periods of strong economic growth. Democratic elections have passed in multiple African countries, including Angola, which saw its first transfer of power to the opposition party since peacetime in 2002. This should provide investors in those countries with much greater confidence than in previous years, and,
- Economic Recovery in West Africa: Improvements in commodity prices combined with the regions expected economic recovery will drive further investment in West Africa. Private equity investors and other state players, such as China, will also benefit from a potential uptick in public sector spending on important infrastructure works, and we may see greater appetite for Private Public Partnerships (PPPs) and general private capital in government-led projects.
We expect private equity activity to be largely focused in the following sectors we cover;
|
Key Private Equity Sectors |
||
|
Sector |
Driving Factors |
Outlook |
|
Fintech |
· Africa’s low penetration rates for traditional banking services at 25 % according to the Global Findex database · Higher mobile penetration at 44% according to the GSMA 2017 Report · Fintech lending, in particular continues to draw most interest from investors. The untapped potential in credit and credit related industries in Africa is highlighted by the significant difference in credit extension activity in Africa compared to other world regions. Fintech lending addresses this by providing access to credit via convenient and already established channels |
Positive |
|
Financial Services |
· The increasing demand for credit, · The growing financial services inclusion in the region through alternative banking channels, · Increased innovation and new product development within the financial services sector, and · Need for consolidation in the sector, which has already picked up pace |
Positive |
|
Education |
· Demand for quality education and a more comprehensive curriculum, · The entry of international brands over the past years such as the Nova Academies, GEMS Cambridge, JSE listed ADvTech Limited and Bridge Schools
Despite this, the market still seems opportunistic, and the regulation landscape is still very uncertain in Kenya. |
Neural |
The table below summarizes the various factors that affect private equity activity in the country. With three indicators being POSITIVE, and two at NEUTRAL, the general outlook for the private equity environment in 2019 is POSITIVE.
|
Private Equity Indicators |
||
|
Factor |
2019 Outlook |
Effect |
|
Economic Growth |
5.8% growth projected in 2019, lower than the expected growth rate of 6.0% in 2018, but higher than the 5-year historical average of 5.4% |
Positive |
|
Foreign Direct Investments |
FDI into the country steadily decreased at a CAGR of 27.3% from 2012 USD 1.4 bn to USD 0.4 bn in 2016. Kenya however saw FDI increase by 71.0% in 2017, to USD 0.7 bn. This is a reflection of the degree of foreign interest in the Kenyan business environment. We expect this growth to continue albeit at a slower pace given concerns of slowing global growth. |
Neutral |
|
Doing Business Environment |
Kenya has been improving steadily in the World Bank’s Doing Business Report, from position #136 in 2015 to position #61 in the 2019 report, with the score improving to 70.3 from 55.0, out of a possible 100 points. This indicates a more accommodative business environment |
Positive |
|
Political Stability |
Political climate in the country has cooled with security maintained and business picking up. Kenya now has direct flights to and from the USA, a signal of improving security in the country |
Positive |
|
Exit Routes |
Despite being the most active private equity markets in terms of deal activity, Kenya still lags behind other African economies in regard to Exits. IPO's are among the most common PE exit routes. However, out of the 134 IPO’s recorded in the last 5-years in Africa, Kenya only
As a remedy, the Nairobi Securities Exchange has introduced Ibuka Program, an incubation and acceleration platform that will help address the listing drought at the bourse and we expect that will open up more private equity exit channels. |
Neutral |
During the Week
In the financial services sector, private Equity firms AfricInvest, which is based in Tunisia, and Catalyst Principal Partners, based in Kenya, acquired 24.2% stake in Prime Bank Kenya. The acquisition was valued at Kshs 5.1 bn, with the capital injection targeted to carry out strategic plans including expanding locally and into the region. The investment has been carried out through a special purpose vehicle, AfricInvest Azure, formed jointly by AfricInvest and Catalyst, on terms which have not been disclosed. As at Prime Bank’s last reporting in Q3’2018, the bank had a book value of Kshs 21.2 bn. As such, the transaction is being carried out at a price-to-book value (P/Bv) of 1.0x, which is a 23.6% discount to the market’s current trading valuation of 1.3x P/Bv for listed Kenyan banks. For more details on the transaction, please see our Prime Bank Acquisition Note. The transaction marks the first bank acquisition in 2019.
In yet another announcement, Tier I Bank, Commercial Bank of Africa (CBA), has issued a Kshs 1.4 bn cash offer to Jamii Bora Bank shareholders, to acquire a 100.0% stake. If successful, and without further capital injection, the acquisition would be done at a 0.4x P/Bv multiple, lower than the recent local bank acquisitions average of 1.6x P/Bv. This was analyzed in detail in our CBA Acquisition Note. These transactions are in line with our expectation of consolidation in the Kenya banking sector following the enactment of the Banking (Amendment) Act, 2015 and the fact that Kenya is overbanked, as highlighted in our Q3’2018 Banking Sector Report.
In the education sector, Dubai based GEMS Education, an international education company owned by a consortium of institutional investors, including Varkey Group and American private equity firm Blackstone Group, is set to acquire 100% stake of Hillcrest International Schools from its current owners, Fanisi Capital and businessman Anthony Wahome, for Kshs 2.6 bn. The transaction details are as below;
- Fanisi owns 55.0% stake in the school, while Mr. Wahome owns 45.0%,
- The amounts paid in consideration for the combined stake is Kshs 2.6 bn,
- Fanisi Capital and Mr Wahome acquired 100% of Hillcrest from Barclays Bank of Kenya, the family of Kenneth Matiba and other creditors in 2011, for a total of Kshs 1.8 bn. The exiting parties stand to realize a profit of Kshs 0.8 bn on the seven-year investment at an IRR of 5.4%.
Hillcrest International Schools is a group of schools that offers the British curriculum, International General Certificate of Secondary Education (IGCSE) and caters for children aged 18-months to young adults aged 18-years. GEMS offers global advisory and educational management and is the largest operator of kindergarten-to-grade-12 schools in the world. The buyout of Hillcrest will help the Dubai chain of schools to expand in the Kenyan market, adding to its Nairobi-based GEMS Cambridge International School. The investment is evidence of increasing investor interest in Kenya’s education sector. Other investors who have invested in the education sector include:
- Advtech Group, a private education provider, listed in the Johannesburg stock exchange, which opened a school under its Crawford Schools brand in Tatu City on 4th September 2018, offering pre-primary education focusing on the THRASS (Teaching, Handwriting, Reading and Spelling Skills) curriculum,
- Nova Pioneer, a South African educator, has set up a primary school and a high school in Tatu city offering the 8-4-4 curriculum,
- Centum Limited, an investment firm, in partnership with Sabis Education Network, has set up the Sabis International School in Runda,
- Cytonn Investments, through its education affiliate Cytonn Education Services, will provide education at all levels. From Early Childhood Development Education (ECDE) to tertiary education, beginning with a technical college-branded Cytonn College of Innovation and Entrepreneurship,
- Advtech Group, Schole (Mauritius) Limited, a London based education provider, and Caerus Capital, a leading international education consultancy group jointly acquired Makini Schools at an estimated value of ZAR 184.2 mn (Kshs 1.7 bn).
The investments are an indication of investors’ interest in the education sector in Sub-Saharan Africa, which is motivated by:
- Increasing demand for quality and affordable education, according to The Business of Education in Africa report by Caerus Capital, the Gross Enrollment Ratio (GER) has doubled over the last ten years, from 4.5% in 2006 to 8.5% in 2016,
- Support such as ease of approvals, offered to investors in the education sector by governments looking to meet Sustainable Development Goals (SDGs) targets of universal access to education.
Despite the recent slowdown in growth, we maintain a POSITIVE outlook on private equity investments in Africa as evidenced by the increasing investor interest, which is attributed to; (i) Economic growth, which is projected to improve in Africa’s most developed PE markets, (ii) the attractive valuations in Sub Saharan Africa’s private markets compared to its public markets, and, (iii) the attractive valuations in Sub Saharan Africa’s markets compared to global markets. Going forward, the increasing investor interest, stable macro-economic and political environment will continue to boost deal flow into African markets.
In 2018, the real estate sector recorded continued investment across all themes driven by;
- Political stability following the conclusion of the electioneering period in Q4’2017, hence increased activity across the sector,
- The continued positioning of Nairobi as a regional hub that has led to increased entry of multinationals creating demand for residential units, retail space, commercial offices and hospitality spaces,
- Kicking off of the affordable housing initiative as part of the Kenyan Government’s Big 4 Agenda, which has gained momentum with the launching of projects such as the Pangani Estate in Nairobi, and,
- An improving macroeconomic environment, with the country’s GDP growing by 6.0% in Q3’2018, higher than the 4.7% recorded in Q3’2017.
In terms of performance, however, the sector recorded an average total return of 11.2% in 2018, 2.9% points decline from 14.1% in 2017. This is attributable to a decline in effective demand for property amid the growing supply, evidenced by the 3.0% points decline in the residential sector occupancy rates, and an oversupply in the commercial sector, currently at 2.0 mn SQFT and 4.7 mn SQFT for the retail and commercial office sector, respectively. However, it is important to note that the development returns for investment grade real estate continue to average at above 20.0% p.a. For a detailed review of 2018 performance, see Cytonn Annual Markets Review 2018.
In 2019, we expect the key drivers of real estate to be as follows:
- Attractive Demographic Profile – Demographic trends such as rapid urbanization currently at 4.3% p.a. against global averages of 2.0%, an expanding middle class with increased purchasing power due to higher net disposable income, which increased to Kshs 7.1 tn in 2017 from Kshs 6.6 tn in 2016 and Kshs 5.7 tn in 2015, and rapid population growth rates currently at 2.5%, 1.3% points higher than global averages of 1.2%, will continue to drive real estate development as developers work towards serving the housing, entertainment and consumption needs, thus boosting development in the land, residential and retail themes;
- Sustained Infrastructural Development – There has been increased government investment in infrastructure, in order to boost the country’s economic growth and open up more areas for development. For example, the budget allocation towards infrastructural development has been growing by a 6-year CAGR of 7.7% to Kshs 611.4 bn in 2018/19, from Kshs 251.1 bn in 2013/14. In addition, areas such as Ruiru and Kitengela are mapped for connection to the main sewer, which will allow for higher density construction and boost real estate development; and
- Kenya as a Regional Hub – We expect increased Foreign Direct Investments (FDI) in Kenya, with the expansion of international firms such as South African retailer Shoprite to back up the trend. FDI in Kenya increased by 70.7% to Kshs 67.1 bn in 2017, from Kshs 39.3 bn in 2016, and Kshs 61.9 bn in 2015. Kenya was also named as the East Africa US strategy “anchor” country in the United States' Africa Policy 2018, and thus is expected to attract more international investors looking to venture into East Africa.
Despite the above drivers, the sector is expected to be constrained by the following factors in 2019:
- Inadequate and High Cost of Funds - Banks have reduced credit advancement to small and medium sized companies as a result of the interest rates cap that stands at 13.0% (CBR rate at 9.0%), hence private sector credit growth came in at 4.4% in October 2018, compared to a 5-year (2013-2018) average of 14.0%. Despite the capping of interest rates, the actual cost of credit is still high averaging at 18.0% due to additional administration fees, which then raise the cost of development, thus making development expensive;
- Inaccessibility and Unaffordability of Off-take financing/Mortgages - Access to mortgages in Kenya remains low mainly due to (i) low-income levels that cannot service a mortgage, (ii) relatively high property prices, (iii) high interest rates and deposit requirements which lock out many borrowers, (iv) exclusion of the informal sector due to insufficient credit risk information, and (v) lack of capital markets funding towards real estate purchases for end buyers. According to Central Bank of Kenya, there were only 26,187 active mortgage accounts in Kenya as at December 2017 against a total adult population of approximately 23 mn persons, thus low real estate uptake using mortgages;
- Increased Supply and Competition - The real estate sector has witnessed increased space supply over the last 5-years with the market recording surplus space, which is likely to constrain market returns in 2019;
- The commercial office sector has an oversupply of 5.3 mn SQFT and this is expected to grow to 5.7 mn SQFT in 2019, with completion of buildings such as Garden City Business Park along Thika Road and Global Trade Centre in Westlands,
- The retail sector has an oversupply of 2.0mn SQFT and this is expected to increase with the opening of malls under construction such as Crystal Rivers in Athi River and Mountain View Mall along Waiyaki way, and,
- Increased supply in the middle - high end residential sector (houses with prices above Kshs.7.5 mn) with a decreasing effective demand, hence recording 3.0% points decline in occupancy rates in 2018.
Key factors expected to shape the real estate sector in 2019 include;
- Affordable Housing Initiative - The Kenyan Government’s affordable housing initiative focused on delivering 500,000 units by end of 2022, with a price range of Kshs 0.6 mn – Kshs 3.0 mn, to address the large housing deficit of approximately 2.0 mn units, according to National Housing Corporation, is expected to push developers’ effort towards provision of more housing for the lower middle- and low-income earners’ segment. The government allocated Kshs 6.5 bn in the Kenya National Budget 2018/19 and an additional Kshs 21.0 bn in the supplementary Appropriation Bill No. 2 of 2018, in support of the initiative. In addition, the government has provided incentives such as 15% tax relief on developers who deliver 100 units p.a. and policy reviews in support of affordable housing initiative;
- Increased Traction in Mortgage Market – Subject to its successful launch, the Kenya Mortgage Refinancing Company is expected to increase mortgage uptake in Kenya. We expect that mortgage home buyers will access mortgages with long tenor, pay affordable instalments and thus it will reduce the financial burden for buyers thus scaling up the rate of housing uptake;
- Government Partnerships - The government is expected to enter into various partnerships such as Public Private Partnerships (PPPs), County Government & National Government partnerships and government & government partnerships in development and financing to support the real estate sector, mainly in the housing sector and in infrastructure to open up areas for development;
- Devolution - Devolution has led to increased population at County Government headquarters and neighboring towns through the relocation of County Government officials and businesses hence created demand for office space, retail space and residential units and thus increased real estate development. In addition, the government increased its budget allocation to county governments to support infrastructural development as well as the growth of other sectors including housing. In 2018, the government increased county budget allocation by 8.9% from Kshs 345.7bn in 2017/18 to Kshs 376.4 bn in 2018/19; and
- Sustainable Developments & Technology – Developers will adopt sustainable development practices such as green buildings and embrace incorporation of technology such as alternative building technology (ABT) and virtual reality (VR) as part of value addition to differentiate their real estate offering to remain competitive.
The table below summarizes our outlook on the various real estate themes and the possible impact on the business environment in 2019. With 3 themes having a positive outlook, 3 neutral and 2 having a negative theme, the general outlook for the sector in 2019 remains as NEUTRAL. The real estate sector is mainly constrained by high financing cost for both developers and off takers, and we expect the market to pick up should the interest rate cap be lifted, or should the government establish other financing methods such as tapping into capital markets and incentives to the mortgage market. The real estate sector has pockets of value such as housing for lower-middle to low-income earners in the residential sector, serviced apartments and Mixed-Use Developments (MUDs).
|
Thematic Performance Review and Outlook |
||||
|
Theme |
2018 Performance |
2019 Outlook |
Effect |
|
|
Residential |
· The sector recorded a decline in performance with average rental yields dropping marginally by 0.5% points, from 4.7% in 2017 to 4.2% in 2018 attributable to a decline in occupancy rates, which declined by 3.0% points from 84.0% in 2017 to 81.0% in 2018, attributable to increased stock in the market against minimal uptake |
· We expect occupancy and uptake rates to stagnate at 81.0% and 22.8%, respectively owing to continued supply. Additionally, the continued housing deficit in the lower middle to low end markets and expected improvement in the mortgage market are set to boost market uptake. Prices will remain largely flat · We expect select markets to continue exhibiting a positive performance supported by their appeal to homebuyers based on location and accessibility, availability for affordable land for development, as well as availability of key amenities |
Neutral |
|
|
Commercial office |
· The performance of commercial office sector improved slightly recording 0.2% points and 0.7% points y/y increase in average rental yields and occupancy rates, to 8.1% and 83.3% from 7.9% and 82.6%, respectively, in 2017 · Various developments were launched during the year including The Federation of Kenya Employers (FKE) 8-storey office building in Upper Hill and Zamara Umbrella Solutions a 16 and 30 floor twin tower in Westlands, respectively · There’s an oversupply in the sector with the Nairobi region having an oversupply of 5.3mn SQFT in 2018, that is forecasted to increase to 5.7mn SQFT in 2019 |
· We forecast a slight decline of the average rental yield to 8.0% from 8.1% as a result of the oversupply with the average occupancy rates expected to decrease by 1.3% points from 83.3% to 82.0% · We expect monthly rental charges to stagnate at Kshs. 102 per SQFT per Month, just as the market has been charging over the last three years, as the market absorbs the current vacant stock of 5.3 mn SQFT · The sector, however, has pockets of value in differentiated concepts such as serviced offices that attract yields of upto 13.4% in locations such as Westlands, as well as prime areas with low supply office spaces such as Gigiri and Karen recording a rental yield of 10.5% and 9.2% respectively |
Negative |
|
|
Retail |
· The performance of the retail sector softened in as a result of increased supply of retail space, and the tough operating environment characterized by low private sector credit growth, · Occupancy rates declined by 9.0% points, from 80.3% to 79.8% between 2017 and 2018 in Nairobi triggered by an increase in of mall space by 4.8% y/y from 6.2mn SQFT to 6.5mn SQFT in 2018. Notable malls opened in 2018 include Waterfront in Karen and Signature Mall in Mlolongo, · Rental yields declined from 9.6% in 2017 to 9.0% as a result of lower occupancy rates, occasioned by increased supply, · There was increased entry of international retailers such as Carrefour, Shoprite and Game as well as the expansion of local retailers such as Naivas |
· Returns are expected to soften as a result of increased supply. Occupancy rates are expected to decline by 2.9% points to 76.9% from 79.8% leading to reduced yields of 8.7% from 9.0% · However, we forecast an increase in international retailer foothold such as South African based Shoprite supermarket and The Game as they try to cash in to the increasing middle-income earners in Kenya · The opportunity is in county headquarters in some markets such as Mombasa and Mt. Kenya regions that have retail space demand of 0.3mn and 0.2mn SQFT, attractive yields at 8.3% and 9.9% and occupancy rates at 96.3% and 84.5%, respectively |
Neutral |
|
|
Mixed-use Developments (MUD) |
· MUDs recorded an average weighted rental yield of 8.0%, (8.5% for retail space accounting for 30.9% of MUD lettable area on average, 8.2% for office space accounting for 58.1% of MUD lettable area on average and 5.6% for residential space accounting for 41.3% of MUD lettable area on average) outperforming single themed developments market average at 7.5%. |
· The real estate sector is to embrace the concept of MUDs as investors diversify their real estate portfolios, given the thematic real estate space surplus · The MUDs sector is expected to record an increase in performance driven by convenience value they offer thus stable occupancies · The investment opportunity within the Nairobi Metropolitan Area is in areas such as Limuru road, Karen, Upperhill and Kilimani recording the highest rental yield returns of 9.7%, 9.4%, 8.7%, and 8.6%, respectively |
Positive |
|
|
Hospitality (Serviced Apartments) |
· In 2018, serviced apartments recorded improved performance in 2018 with the average rental yield coming in at 7.4%, which is 2.1% points higher than 5.3% recorded in 2017, attributable to the increased demand, which has triggered an increase in charge rates, as well as increased occupancy rates with an average of 80.0% in 2018, compared to 72.0% in 2017 |
· Given the country’s political stability, the continued marketing of Kenya as an experience destination and the improved air transport with several airlines that increased their flight frequencies in and out of the country, we expect the number of international arrivals to grow to approximately 2.6 mn in 2019, resulting in a greater demand for hospitality services · We thus expect, the occupancy rates in the serviced apartments sector to remain above 80.0% and resulting in a rental yield of above 7.0%, with the investment opportunity being in Kilimani and Westlands markets with rental yields of above 10.0% |
Positive |
|
|
Land |
· The Nairobi Metropolitan Area land prices recorded a 7- year CAGR of 13.7%, and a 3.3% y/y price change in 2018, compared to a 17.4% and 4.2%, respectively recorded in 2017, uncertainty surrounding statutory approvals particularly in light of the ongoing demolitions of allegedly legally approved buildings, thus decreased transactions in the land sector |
· We expect an annual capital appreciation of 4.9% in 2019, fuelled by the availability of development land, improving infrastructure and demographics · For 2019, the investment opportunity in the Nairobi Metropolitan Area land sector lies in Satellite Towns such as Ruaka, Utawala, Ruiru and Thika, supported by high capital appreciation of 16.2%, 17.5%, 4.7%, 7.7% y/y capital appreciation, respectively, in addition to other areas such as Kilimani, Karen and Kitisuru, which had rates of 10.7%, 8.2% and 10.5% y/y capital appreciation, respectively |
Positive |
|
|
Infrastructure |
· In 2018, the infrastructure sector recorded several activities among them; the launching of the construction of Western Bypass, and the dualling of Ngong Road Phase 2, aimed at opening up areas for development · In terms of budget allocation, the sector was allocated 611.4 bn in the 2017/2018 budget and 418.8 bn in the 2018/2019 |
· We expect reduced infrastructural activities in 2019 due to the reduced budget allocation from the previous year attributable to the government’s financial constraints, given the country’s public debt which currently stands at 56.4% of the GDP, in addition to the national revenue collection deficit of 38.0% as at June 2018 · Planned infrastructure development such as sewer connection in Ruiru and Kitengela, Water improvement programm and proposed light rail which will allow for higher density construction and boost real estate |
Neutral |
|
|
Listed Real Estate |
· Fahari I-REIT closed the year with a trading price of Kshs 10.95, a 4.8% rise from Kshs 10.45 at the beginning of 2018 and 47.4% decline its initial price of Kshs 20.8 in November 2015. The average share price in 2018 was Kshs 10.6, 6.0% lower than the average price of Kshs 11.3 in 2017 |
· Having opened the year with a trading price of Kshs 10.75, we expect the REIT to continue trading at low prices and in low volumes in 2019. · With the new acquisition, we expect growth in revenues and project 0.3% points increase in dividend yield to 6.8% from 2018 earnings (at a price of Kshs 10.25 per share as at 11th January 2019), from a 6.5% yield recorded from 2017 earnings |
Negative |
|
- Residential Sector
The residential sector’s performance slowed down in 2018 owing to increased supply of units, which dampened occupancy and annual uptake rates, resulting in softened annual residential market’s investor returns, which came in at 8.9% (price appreciation of 4.2%, rental yield of 4.7%) in 2018, in comparison to 10.3% in 2017 (price appreciation of 5.1%, rental yield of 5.2%). In 2019, we expect the sector’s performance to remain flat. We expect select markets to continue exhibiting a positive performance supported by their appeal to homebuyers based on location and accessibility, availability for affordable land for development, as well as availability of key amenities.
The table below summarizes the various factors that will affect the demand side of residential real estate.
Demand
Of the five factors, we expect to affect residential demand, two are positive, one is negative, and one is neutral, thus our outlook for residential demand this year is NEUTRAL with bias to positive.
|
Residential Demand |
||
|
Metric |
2019 Outlook |
Effect |
|
Demographics |
· Currently, the deficit in the Nairobi Metropolitan Area is expected to come in at 2.1 mn units in 2019, owing to a rapid population growth rate averaging at 2.6% p.a. for the last 5-years compared to a global average of 1.2% p.a. · This coupled by a relatively high urbanization rate at 4.3%, as per the World Bank, compared to the global average of 2.1%, will continue to sustain demand for more dwelling units with 70.7% of the demand being in the lower mid-end and low-end segments, who according to KNBS, earn below Kshs 50,000 per month |
Positive |
|
Infrastructure |
· In 2019, we expect the anticipated completion infrastructural projects such as parts of the ongoing Ngong Road expansion, Standard Gauge Railway Phase 2, water and sewer enhancements to boost demand for residential properties in these locations |
Positive |
|
Investor Returns |
· In 2018, the residential sector recorded a decline in investor returns to 8.9% from 10.3% in 2017 on account of increased supply amid reduced effective demand · We expect investors to focus on selected markets such as Kilimani, Riverside, Thindigua, and Runda Mumwe, which recorded attractive returns of 11.5%, 11.6%, 13.8% and 14.8%, respectively |
Neutral |
|
Purchasing Power |
· Average real earnings growth declined by 5.8% points to (2.9%) in 2017 from 2.9% in 2015 according to KNBS, implying a decline in purchasing power. With the expected growth of inflation in 2019 to an average of 5.4% from 3.8% in 2018, we expect real earnings to continue declining, thus, hampering effective demand for residential units |
Negative |
|
Access to Credit |
· Subject to the launch of the Kenya Mortgage Refinance Company (KMRC), set for February 2019, we expect growth in the local mortgage market where there are currently 26,187 mortgages out of a total adult population of 23.0 mn persons. The KMRC is expected to boost the local mortgage market by creating liquidity for primary lenders |
Neutral |
The table below summarizes the various factors that will influence the supply side of residential real estate in 2019. Of the five factors that we expect to shape residential supply, two are negative, one is neutral, whereas two are positive, and thus, our outlook is NEUTRAL.
|
Residential Supply Outlook |
||
|
Metric |
2019 Outlook |
Effect |
|
Developer Returns |
· In 2018, the residential market recorded slower uptake and occupancy of 22.8% and 81.0% compared to 2017 with 26.6% and 84.0%, respectively due to increased supply with reduced effective demand · However, we note that developer returns for institutional grade real estate remain high at above 20% p.a. Developers are likely to invest in research in order to identify market niches to ensure profitability of their projects |
Neutral |
|
Access to Credit |
· According to CBK Financial Stability Report, 73.1% of Non-performing loans in 2018 were from real estate, trade and manufacturing, highlighting developer’s financial constraints. Additionally, average private sector credit growth in 2018 came in at an average of 3.8% and is tipped to remain low in 2019 owing to the capping of interest rates. We, therefore, expect developers to continue experiencing barriers to adequate financial access, which is expected to affect housing supply in 2019 · However, the government is expected to off-take units under the affordable housing program, thus, allowing developers’ access construction financing |
Negative |
|
Development Costs |
· We expect land prices in 2019 to grow at 4.9%, 1.6% points higher than the 3.3% recorded in 2018. This, coupled with the expected rise in construction materials as a result of inflation is expected to curtail supply due to increase in construction costs |
Negative |
|
Infrastructure |
· In 2019, we expect the ongoing infrastructural projects such as the dualling of Ngong Road and the Western Bypass, and water and sewer improvement to boost new developments in these areas |
Positive |
|
Government Incentives |
· With the growing focus towards plugging the housing deficit, we expect to see more government incentives geared towards creating an enabling environment for home-buyers and developers such as the introduced 50.0% corporate tax cuts and scrapped levies, as well as statutory reforms aimed at improving the land sector’s efficiency thus cutting developers’ costs |
Positive |
Outlook:
Neutral with a positive bias outlook on demand and a neutral outlook on supply, our general outlook for the residential sector is NEUTRAL. We expect reduced developer activity in high and middle upper markets and, limited to undersupplied segments such as low-cost housing and selected markets with relatively high returns. The performance of the sector is likely to remain flat with occupancy rates and transaction rates stagnating.
|
Residential Sector Investment Opportunity in 2019 |
||||
|
Sector |
Segment |
Typology |
Locations |
Reasons |
|
Residential |
High-End |
Detached |
Kitisuru, Karen |
Annual returns at 8.9% and 8.8%, respectively against the high-end market average of 6.4%, and relatively high uptake averaging at 22.0% and 24.0%, respectively |
|
Upper Mid-End |
Detached |
Runda Mumwe |
Relatively high annual returns and annual uptake at 14.8% and 21.7% against upper mid-end market averages of 4.9% and 20.9%, respectively |
|
|
Apartments |
Riverside, Kilimani |
Relatively high annual returns of 11.8% and 11.9%, against upper mid-end market average of 10.9% |
||
|
Low-End |
Apartments |
Donholm, Thindigua |
Relatively high annual returns at 14.4% and 13.8% against lower mid-end market average of 11.9% and annual uptake of 25.0% and 24.6%, against lower mid-end market average of 23.4% |
|
|
Source: Cytonn Research Investment opportunities are in areas that continue to exhibit growing demand from homebuyers offering investors double digit returns and relatively quick uptake supported by availability for land for development, whereas demand is boosted by presence social amenities and relatively good infrastructure. |
||||
- Commercial Sector
In 2018, the commercial real estate sector recorded mixed performance with commercial office spaces recording a 0.2% points y/y increase in rental yields attributed to an improved macroeconomic environment, hence boosting economic activities, while the retail sector recorded 0.6% points decline in rental yields as a result of retail space oversupply, currently at 2.0 mn SQFT. In 2019, we expect a slowdown in performance mainly as a result of the surplus supply in the commercial office and retail theme, which have an oversupply of 5.3 mn SQFT and 2.0 mn SQFT, respectively. The sector, however, has pockets of value in differentiated concepts such as Mixed-Use Developments (MUD) with the right balance between the incorporated uses in order to achieve optimal returns and serviced offices that attract yields of 13.4%, in areas such as Westlands, as well as areas with a low supply of both retail and office spaces such as Gigiri in Nairobi and in County Government Headquarters in the Mt. Kenya region and Mombasa County recording a rental yield of 8.3% and 9.9%, respectively, in the retail sector.
- Commercial Office Sector
The commercial office sector performance in 2019 will be driven by i) Nairobi positioning itself as a regional and continental hub hence attracting multinationals who set up regional offices in Kenya thus increasing demand for office space, ii) growth of professional services and SMEs, with the formal employment growing at 4.0% in 2017 compared to 3.0% in 2016, iii) devolution that has created demand for office spaces in counties to cater for County Governments and businesses that are expanding to county headquarters, and iv) increasing foreign direct investments (FDI) recording 70.7% increase to Kshs 67.1 bn in 2017 from Kshs 39.3 bn in 2016, hence increased demand for offices, especially Grade A offices in key commercial hubs such as Westlands and Kilimani.
The main challenge that will affect the sector’s expected performance will be competition as a result of oversupply with the sector expected to have an oversupply of 5.7mn SQFT in 2019 a 7.5% increase from 2018’s oversupply of 5.3 mn SQFT.
The table below summarizes the performance for office from 2011 to 2018 and our forecast for 2019;
|
Summary of Commercial Office Returns in Nairobi Over Time |
|||||||||
|
Year |
FY'13 |
FY’15 |
FY’16 |
FY’17 |
FY'18 |
Annualized Change 2013-2018 |
2019F |
Reason for Forecast |
Outlook |
|
Occupancy (%) |
90.0% |
89.0% |
88.0% |
82.6% |
83.3% |
(1.5%) |
82.0% |
Despite the marginal increment in 2018, we do not foresee increase in occupancy given the current oversupply of 5.3mn SQFT in 2018 and expected to increase to 5.7mn in 2019, we therefore, expect occupancy rates to stagnate or decline slightly by 1.3% points to average at approximately 82.0% in 2019 |
Negative |
|
Asking Rents (Kshs/Sqft) |
95 |
97 |
103 |
101 |
102 |
1.4% |
102 |
Despite the 1.4% growth in asking prices over the last 5-years, we expect monthly rental charges to remain at Kshs. 102 per SQFT per month, just as the market has been charging over the last three-years, as the market absorbs the current stock |
Neutral |
|
Average Prices (Kshs/Sqft) |
12,433 |
12,776 |
13,003 |
12,649 |
12,573 |
0.2% |
12,485 |
Asking prices have been growing by 0.2% between 2013 and 2018, however there was a market price correction starting 2016 hence recording a 0.7% decline (2015-2018) due to the oversupply of office space. We therefore expect the prices to drop by 0.7% to average at Kshs 12,485 in 2019 |
Negative |
|
Average Rental Yields (%) |
8.3% |
8.1% |
8.4% |
7.9% |
8.1% |
(0.4%) |
8.0% |
We expect office yields to average at 8.0%, 0.1% points lower than 2018 average, in the Nairobi market mainly as a result of increase in supply and thus lower occupancy rates |
Negative |
|
We expect the performance of the commercial office theme to decline slightly in 2019 with average rent, price, occupancy and yields rates coming in at Kshs 102 per SQFT, Kshs 12,485 per SQFT, 82.0% and 8.0%, respectively, from Kshs 102 per SQFT, Kshs 12,573 per SQFT, 83.3% and 8.1%, respectively, in 2018 mainly due to the current office oversupply at 5.3mn SQFT and increasing supply with the expected opening of Garden City Business Park along Thika Road and Global Trade Centre in Westlands. There are pockets of value for investment in the sector in concepts with low supply and high returns such as Serviced offices, which have rental yields of 13.4% and a market share of 0.35%. |
|||||||||
Source: Cytonn Research
Our outlook for the commercial sector is NEGATIVE as the sector’s performance continues to be constrained by oversupply, with the Nairobi region expected to experience an oversupply of up to 5.7 mn SQFT in 2019. The sector however has pockets of value in differentiated concepts such as serviced offices that attract yields of 13.4% such as Westlands, as well as areas with low supply office spaces such as Gigiri and Karen.
- Retail Sector
The retail sector performance in 2019 will be driven by:
- The continued expansion of international retailers such as Carrefour, Shoprite and Game and local retailers such as Naivas, who will then increase retail space uptake,
- Positive demographics characterized by a high population growth rate of 2.5% p.a., urbanization rate of 4.3% and a rapidly expanding middle class who create demand for retail services, and
- Increasing purchasing power with GDP per Capita growing at a rate of 7.9% p.a. over the last 5-years, from Kshs. 113, 539 in 2013 to Kshs. 166,314 in 2017, hence high purchasing power that creates sustained demand for retail products.
The sector will, however, be constrained by the oversupply in the sector currently at 2.0 mn SQFT and the expected increase in supply as a result expected opening of malls in the pipeline such as Crystal Rivers Mall in Athi River and The Well in Karen.
The table below summarizes the performance of the retail sector starting 2016 and our outlook for 2019;
|
Nairobi’s Retail Sector Performance 2016-2019F |
|||||||
|
Item |
FY’16 |
FY’17 |
FY' 18 |
Annualized Change 2016-2018 |
2019F |
Reason for Forecast |
Outlook |
|
Asking Rents (Kshs/SQFT) |
186.9 |
185.2 |
178.2 |
(1.6%) |
175.4 |
We expect asking rents to soften, reducing by 1.6% to Kshs 175.4 from Kshs 178.2 as a result of the retail space oversupply currently at 2.0mn SQFT |
Negative |
|
Supply in Nairobi (mn SQFT) |
5.9 |
6.2 |
6.5 |
3.3% |
7.3 |
Supply of retail space has grown at an average rate of 3.3% p.a from 2016 to 2018 and is expected to increase by 12.3% to 7.3mn SQFT in 2019 due to opening of malls such as The Well in Karen and Mt. View mall along Waiyaki way that will add 78,000 SQFT and 91,000 SQFT, respectively. |
Negative |
|
Occupancy (%) |
89.30% |
80.30% |
79.80% |
(3.7%) |
76.9% |
Due to the current oversupply of retail space and expected opening of malls in the pipeline, we expect occupancy rates to decline by 2.9% points to 76.9% |
Negative |
|
Average Rental Yields |
10.00% |
9.60% |
9.00% |
(3.3%) |
8.7% |
Mainly as a result of increase in supply and thus lower occupancy rates, we expect retail yields in Nairobi to soften slightly by 0.3% points to an average of 8.7% |
Negative |
|
The performance of the retail sector is expected to soften, with asking rents, occupancy rates and yields declining by 1.6%, 2.9% points and 0.3% points, respectively, to average at Kshs. 175.4, 76.9% and 8.7% |
|||||||
Source: Cytonn Research
From the above table, retail operators’ performance outlook is negative; however, we expect the continued entry of international retailers and expansion of local retailers, who will cushion the market hence have a general NEUTRAL outlook for the sector. The opportunity is in county headquarters in some markets such as Mombasa and Mt. Kenya regions that have retail space demand of 0.3mn and 0.2mn SQFT, attractive yields at 8.3% and 9.9% and occupancy rates at 96.3% and 84.5%, respectively.
- Mixed Use Development (MUD) Sector
In 2018, MUDs encompassing office, retail and residential themes recorded an average weighted rental yield of 8.0% in 2018. In 2019, we expect to see increased Mixed Use Developments as investors diversify their real estate portfolios, given the real estate space surplus with office and retail theme recording an oversupply of 5.3 mn and 2.0 mn SQFT space, respectively in Nairobi Metropolitan Area. MUDs are suitable for developers and investors looking to diversify their real estate portfolio driven by the following advantages; i) operational synergies whereby one’s theme performance complements the others, ii) multiple revenue streams that help to diversify the risk of a project, for example in case uptake for one of the themes is low, the developer or property manager will continue to receive revenues from the other themes, iii) economies of scale achieved through effective use of space/land hence maximization of returns as well as shared infrastructure and facilities such as lifts, parking, and lobbies resulting in savings on construction and operational costs, and iv) greater efficiency for occupants where MUDs create an environment where occupants can live, work, play and invest all in one location, hence reducing time and cost incurred while commuting.
Based on the above advantages, our outlook for MUD is POSITIVE, therefore, a viable investment suitable for developers and investors looking to diversify their real estate portfolio. Key to note is that the success of a Mixed-Use Development significantly depends on how the right balance between the incorporated uses in a Mixed-Use Development in order to achieve optimal returns. The investment opportunity within the Nairobi Metropolitan Area is in areas such as Limuru Road, Karen, Upperhill and Kilimani recording the highest rental yield returns of 9.7%, 9.4%, 8.7%, and 8.6%, respectively.
- Hospitality Sector
In 2018, the hospitality sector registered improvement in performance, evidenced by the 2.1% points increase in the serviced apartments rental yield to 7.4%, from 5.3% recorded in 2017, attributable to increased demand, which has triggered an increase in charge rates, as well as increased occupancy rates with an average of 80.0% in 2018, compared to 72.0% in 2017. The improved performance was fueled by the stable political environment and improved security, making Nairobi an ideal destination for both business and holiday travelers, resulting to a 39.8% increase in international arrivals to 2.0 mn recorded in 2018, from 1.4 mn in 2017, according to Leading Economic Indicators October 2018.
In 2019, we expect the sector, the sector to record increased activities, driven by;
- Continued Marketing Efforts - Continued marketing of the country as a destination for experiences including the free visa on arrival for Africans countries, continues to enhance the growth of international arrivals. For 2019, we expect the marketing to continue enhancing tourism, with the allocation of Kshs 1.0 bn in the 2018/2019 national budget, similar to the amount allocated in the 2017/2018 budget aimed at to scaling up promotion of tourism,
- Improving Air Transport - 2018 recorded improved flight operations and systems making it easier and more convenient for travelers with several airlines increasing their frequencies in and out of the country. We expect this to result in increased arrivals in 2019, thus a rise in demand for hospitality services. Some this include, Kenya Airways which launched direct flights to the US from Kenya the airline will be operating daily flights to and from New York and Nairobi,
- Sustained Domestic Tourism - Domestic tourism continues to grow with Kenyans accounting for more than 50.0% of the total hotel bed nights in Kenya. According to Economic Survey 2018, Kenyans occupied 50.8% of the total beds in 2017, 54.2% in 2016 and 53.7% in 2015. We expect this to continue resulting in growth of demand for accommodation and conference services, and
- An Increase in International Arrivals - The number of tourist arrivals recorded a 39.8% increase in tourist arrivals from 1.4 mn 2017 to 2.0 mn in 2018, fueled by the return of political calm following the completion of the electioneering period in 2017. We expect the trend to continue given the political stability in the country, thus attracting tourists for both holiday and business.
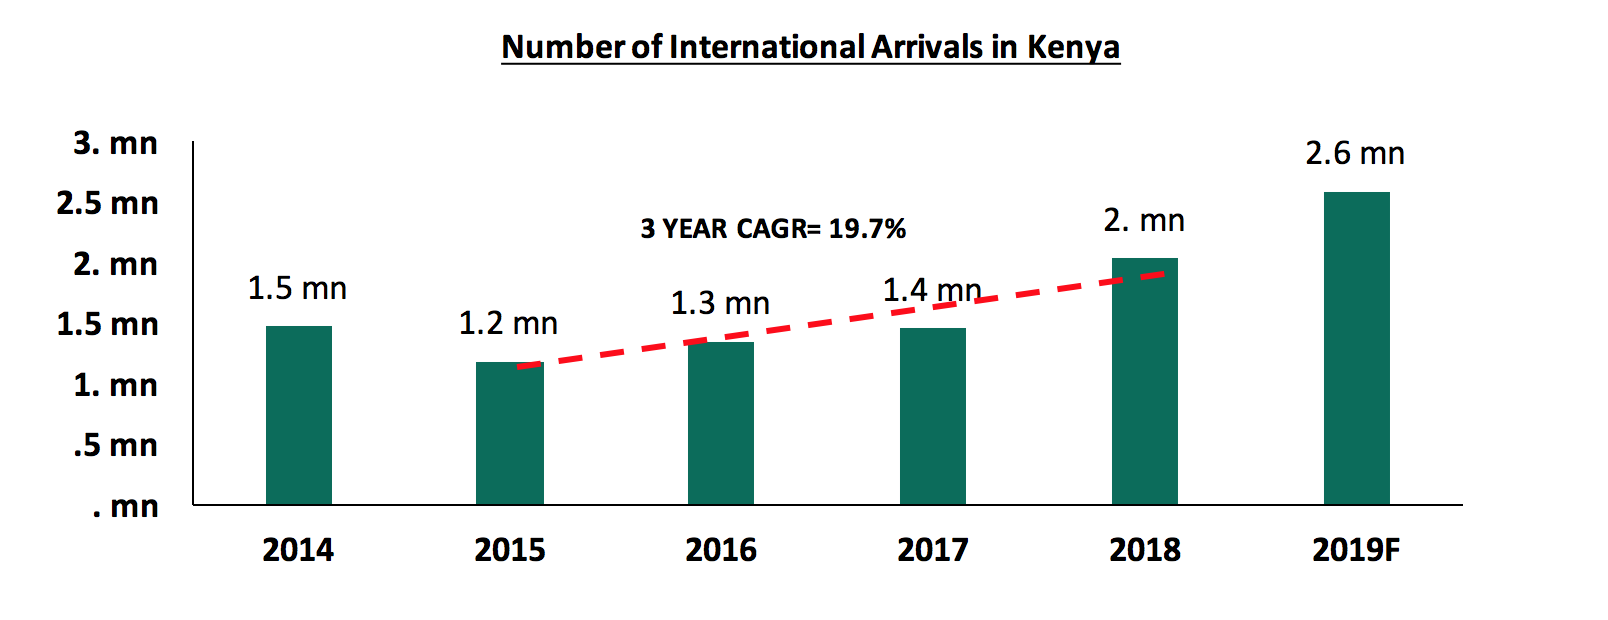
Source: KNBS, Cytonn Research 2018
The hospitality sector recorded a 5-year slump between 2011 and 2015 caused by insecurity and terrorism. However, the number of international arrivals into the country has been on the rise growing by a 3-year CAGR of 19.7% since 2015, and by an annual rate of 39.8% to 2.0 mn in 2018. For 2019, we expect the number of international arrivals to grow by an annual appreciation of 30.0% to approximately 2.6 mn, resulting in a greater demand for hospitality services, with the investment opportunity being in Kilimani and Westlands markets, which recorded relatively high rental yields of above 10.0%.
We therefore retain a POSITIVE outlook for the hospitality sector, as we expect continued demand for hospitality services thus the occupancy rates in the serviced apartments sector coming in above 80.0%, and a resultant rental yield of above 7.0%.
- Land
In 2018, the land sector recorded a slowdown in performance with an annual appreciation of 3.3% and a 7-year CAGR of 13.7%, compared to annual appreciation of 4.2% and a 7-year CAGR of 17.4%, respectively, in 2017, attributed to the uncertainty surrounding statutory approvals particularly in light of the demolitions of allegedly illegally approved buildings in 2018, thus decreased transactions in the land sector. In 2019, we expect the performance to remain positive, fueled by:
- investor demand for development land especially in satellite towns where infrastructure has been improving, in addition to land in these areas being relatively affordable and available in bulk,
- Kenya’s population growth rate at 2.5% p.a, rapid urbanization at 4.3% p.a, and the growing middle class, which has continued to create demand for development land. In addition, according to a Home Ownership Survey by Kenya Bankers Association, 68.0% of home ownership is mainly through building, and
- the improving infrastructure such as road networks as the Kenyan Government continues to intensify efforts to improve infrastructure in the country, evidenced by the significant 2018/2019 national budget allocation of Kshs 418.8 bn, which is 13.6% of the budget, to infrastructural development.
As a result, in 2019, we expect an annual capital appreciation of 4.9%, as the market slowly recovers from the 3.3% appreciation recorded in 2017/2018. Unserviced land in satellite towns such as Ruiru and Syokimau are expected to record the highest capital appreciation of 6.7%, attributable to high demand as developers and investors prefer to buy unserviced plots and service instead of paying a premium charged by land sellers for the services, facilities and amenities provided, the affordability compared to land in urban areas and the availability of land in bulk.
However, main challenges likely to face the sector include; i) a possible decline in land transactions attributed to the uncertainty surrounding statutory approvals following demolition of allegedly approved buildings in 2018, ii) relatively high land costs of up to Kshs 500 mn per acre in areas such as Upperhill, hence impacting on financial viability on returns to investors as rental charges remain flat, and iii) limited access to financing for developers and investors as the effective cost of credit remains high, averaging at 18.0%, despite the capping of interest rates.
The summary of the previous performance of the theme and 2019 outlook is as outlined below:
|
All values in Kshs unless stated otherwise |
|||||||||||
|
Summary of the Performance Review and Outlook |
|||||||||||
|
Location |
*Price 2011 |
*Price 2015 |
*Price 2016 |
*Price 2017 |
2018 |
2019f |
7-year CAGR |
% Price Change from 2011 |
Annual Capital Appreciation (2018) |
Annual Capital Appreciation (2019) f |
|
|
Satellite Towns - Unserviced Land |
9m |
16m |
21m |
22m |
23m |
24m |
14.1% |
3.5 |
5.7% |
6.7% |
|
|
Nairobi Suburbs - Low Rise Residential Areas |
56m |
91m |
106m |
109m |
86m |
91m |
6.5% |
2.6 |
4.6% |
5.3% |
|
|
Nairobi Suburbs - Commercial Areas |
156m |
377m |
458m |
478m |
493m |
517m |
17.8% |
3.3 |
5.4% |
4.9% |
|
|
Nairobi Suburbs - High Rise Residential Areas |
46m |
80m |
97m |
103m |
135m |
140m |
16.8% |
2.4 |
0.2% |
3.9% |
|
|
Satellite Towns - Site and Service Schemes |
6m |
13m |
14m |
15m |
14m |
15m |
13.3% |
3.5 |
0.6% |
3.5% |
|
|
Average |
13.7% |
3.1 |
3.3% |
4.9% |
|||||||
|
• In 2019, we expect the performance to remain positive, informed by the historical performance over 7-years, as from 2011 to 2018 |
|||||||||||
|
Source: Cytonn Research |
|||||||||||
The investment opportunity in the Nairobi Metropolitan Area land sector lies in Satellite Towns such as Ruaka, Utawala, Ruiru and Thika, supported by high capital appreciation of 16.2%, 17.5%, 4.7%, 7.7% y/y capital appreciation, respectively, in addition to other areas such as Kilimani, Karen and Kitisuru, which had rates of 10.7%, 8.2% and 10.5% y/y capital appreciation, respectively.
We retain a POSITIVE outlook for the land sector with a bias to satellite towns, with unserviced land prices expected to record a 6.7% annual appreciation in 2019, due to the high demand boosted by their affordability, availability of development land and the improving infrastructure in the areas.
- Infrastructure Sector
The infrastructure sector was vibrant in 2018 supported by significant investment by the Kenyan Government as part of its expansion plans in line with the Big Four Agenda. The budget allocation towards infrastructural development has been growing by a 6-year CAGR of 7.7% to Kshs 611.4 bn in 2018/19 from Kshs 251.1 bn in 2013/14. The increased allocation shows the government’s efforts aimed at transforming the country to middle-income status by 2030. In 2018, the infrastructure sector recorded several activities among them; the launching of the construction of Western Bypass, and the dualling of Ngong Road Phase 2.
For financial year 2018/19, Kshs 418.8 bn, which is 13.6% of the budget, was allocated to the infrastructure sector. The allocation was in a bid to increase the average Gross Domestic Product (GDP) rate from the 4.9% recorded in 2017, to 5.5% in 2018 as forecasted by the World Bank. However, the budget allocation towards infrastructure development was 31.5% lower than the Kshs 611.4 bn allocated for the financial year 2017/18 as shown below:
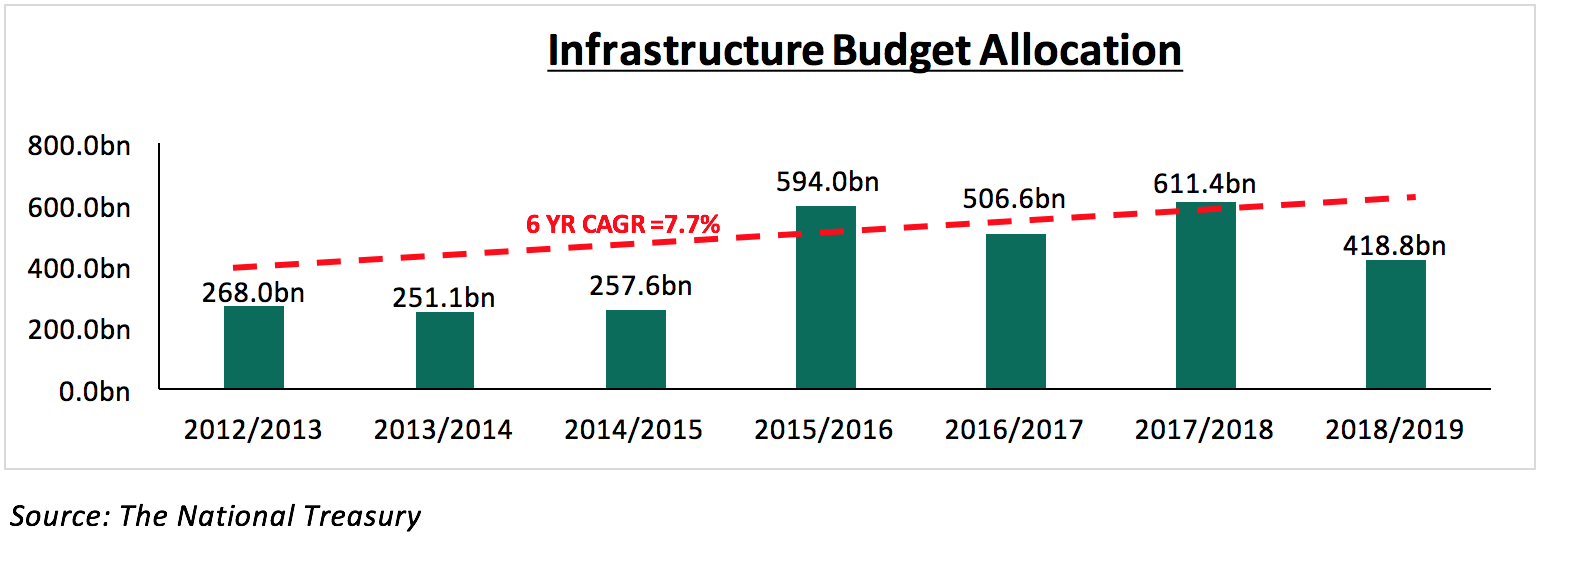
Our outlook for the infrastructural sector is NEUTRAL as we expect reduced infrastructural activities during H’1 2019 due to the reduced budget allocation from the previous year attributable to the government’s financial constraints, given the country’s public debt which currently stands at 56.4% of the GDP, in addition to the national revenue collection deficit of 38.0% as at June 2018. We however expect execution of the planned infrastructure development such as sewer connection in Ruiru and Kitengela, water improvement program and proposed light rail, which will allow for higher density construction and boost real estate.
Nairobi and Kiambu Counties offer the best real estate investment opportunity due to presence of a relatively adequate transport network and good water & sewerage coverage. In 2019, we expect the counties to remain attractive and real estate developers to align their projects with the ongoing infrastructural projects given the expected benefits including higher demand, price appreciation and savings on construction costs.
- Listed Real Estate Outlook
In 2018, the Fahari I-REIT closed the year with a trading price of Kshs 10.95, a 4.8% rise from Kshs 10.45 at the beginning of 2018 and 47.4% decline its initial price of Kshs 20.8 in November 2015. The average share price in 2018 was Kshs 10.6, 6.0% lower than the average price of Kshs 11.3 in 2017.
The REIT’s performance in 2018 was largely limited by a poor market sentiment with investors inclining towards brick and mortar real estate which offered higher yields for retail, office sector and government securities at 9.0%, 8.1% and 8.7% respectively in 2018, against an average yield of 5.7% earned from the REIT in H1’2018. The low yield is attributable to the poor performance of assets in its portfolio, e.g Greenspan Mall which has an occupancy of 74.0% compared to the market average at 79.8%, and also due to a large portion of revenues, at approximately 54.4% going into professional fees.
In May 2018, the REIT acquired an additional 3,780 SQM property, 67 Gitanga Place in Lavington, at Kshs 850.0 mn bringing the total share of assets invested in real estate to 90% and the total properties owned by the REIT to four the others being: (i) Greenspan Mall, (ii) Signature International Limited, and (iii) Bay Holdings Limited. The new acquisition is expected to generate an income of Kshs 73.8 mn annually and thus generate a rental yield of 8.7%.
Having opened the year with a trading price of Kshs 10.75, we expect the REIT to continue trading at low prices and in low volumes in 2019. With the new acquisition, we expect growth in revenues and project 0.3% points increase in dividend yield to 6.8% from 2018 earnings (at a price of Kshs 10.25 per share as at 11th January 2019), from a 6.5% yield recorded from 2017 earnings.
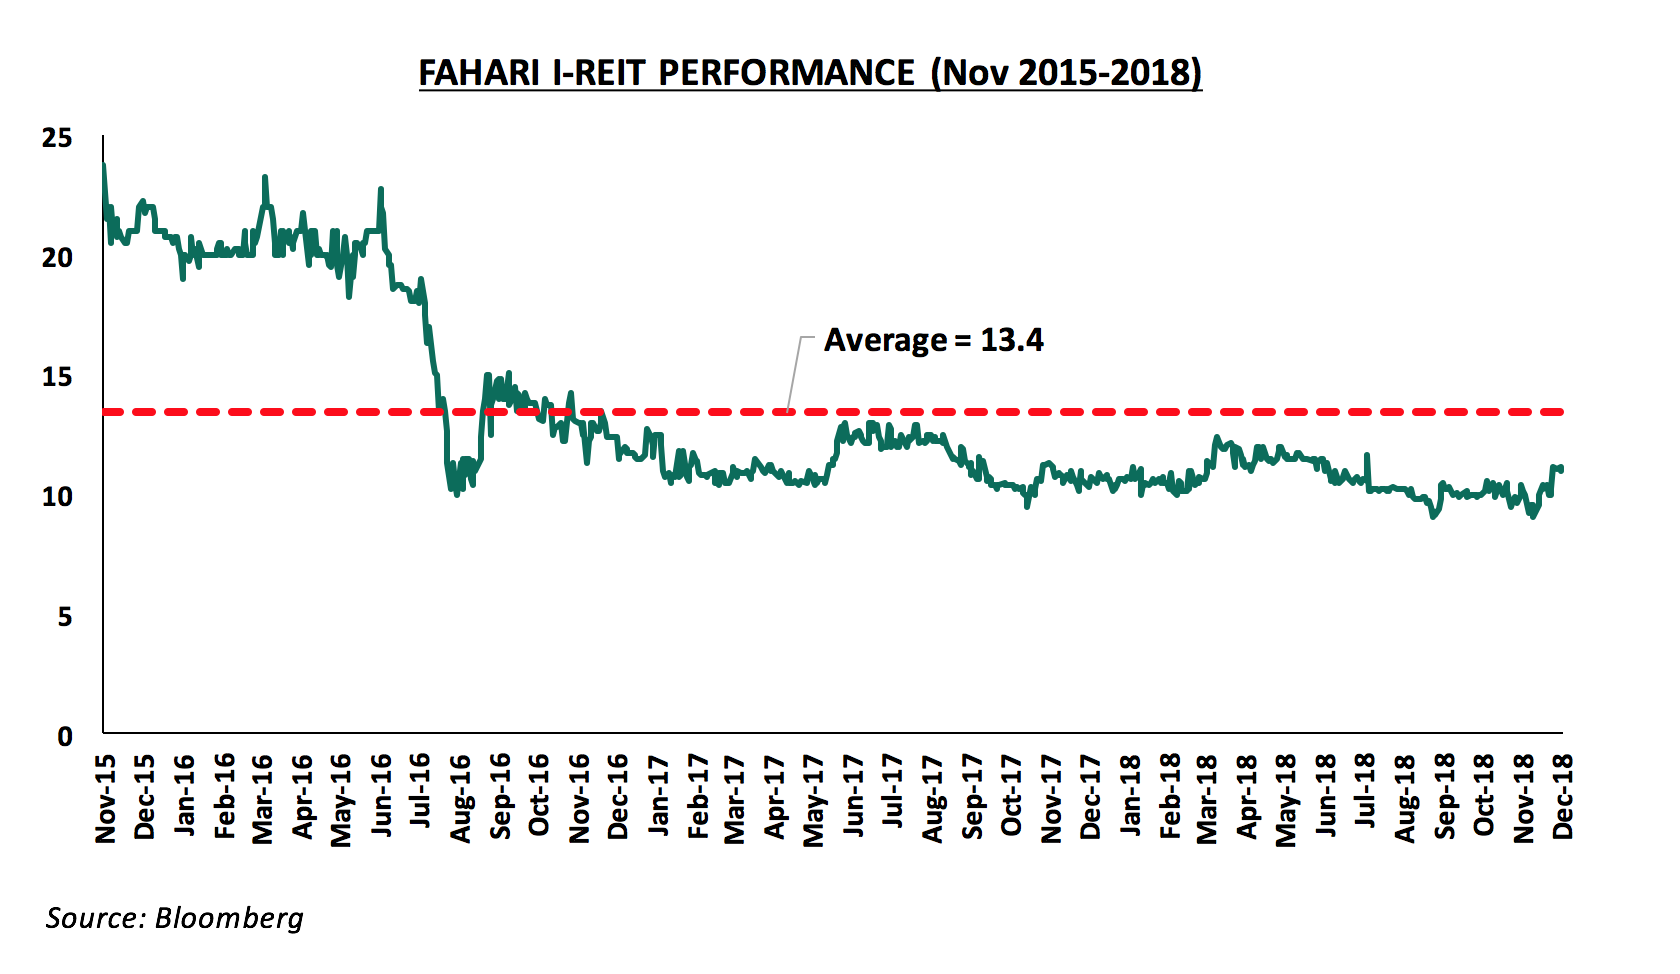
Our outlook for listed real estate is NEGATIVE as the performance is constrained by continued lack of investor appetite for the instrument and poor performance of the assets in its portfolio.
THE KEY AREAS OF OPPORTUNITIES BY THEME IN REAL ESTATE SECTOR
Based on returns, factors such as supply, demand, infrastructure, land prices and availability of social amenities the following are the ideal areas for investment;
|
The Key Areas of Opportunities by Theme in Real Estate Sector |
|||
|
Sector |
Themes |
Locations |
Reasons |
|
Residential Sector |
Detached Units |
Runda Mumwe, Juja, Kitisuru, and Karen |
Relatively high returns of approximately 14.8%, 10.3%, 8.9% and 8.8% respectively |
|
Apartments |
Riverside, Kilimani, Donholm/Komarock |
Relatively high returns of approximately 11.6%, 11.5& and 14.4% respectively, availability of amenities, infrastructural development |
|
|
Commercial Office Sector |
Grade A Offices |
Gigiri, Karen |
Relatively low supply, proximity to commercial hubs and high yields of 10.5% and 9.2%, respectively |
|
Serviced Offices |
Westlands |
Prime commercial hubs with high occupancy of 85.5% and yields of 15.8% |
|
|
Retail Sector |
Suburban Malls |
Counties such as Mombasa and Mt. Kenya Regions |
Mombasa and Mt. Kenya regions, record attractive yields at 8.3% and 9.9% and occupancy rates at 96.3% and 84.5%, respectively |
|
Mixed Use Developments (MUDs) |
MUD |
Limuru Road, Karen |
Affluent neighbourhoods with high rental yield return of 9.7% and 9.4%, respectively |
|
Hospitality Sector |
Serviced apartments |
Kilimani and Westlands |
Attractive rental yields of 10.9% and 10.6% respectively, easy access from Jomo Kenyatta International Airport (JKIA), proximity to business nodes such as Upperhill, and the good transport network thus ease of accessibility |
|
Land Sector |
Satellite towns |
Ruaka, Utawala, Ruiru and Thika |
The relatively high capital appreciation of above 10.0% y/y, the provision of trunk infrastructure such as road networks and the growing demand for development land |
|
Suburbs |
Kilimani, Karen and Kitisuru |
The relatively high capital appreciation of above 10.0% y/y, proximity to amenities |
|
Source: Cytonn Research 2018
Disclaimer: The Cytonn Weekly is a market commentary published by Cytonn Asset Managers Limited, “CAML”, which is regulated by the Capital Markets Authority. However, the views expressed in this publication are those of the writers where particulars are not warranted. This publication is meant for general information only, and is not a warranty, representation, advice or solicitation of any nature. Readers are advised in all circumstances to seek the advice of a registered investment advisor.

- Talk to us
- Kenya
- P.O Box 20695 - 00200, Nairobi, Kenya
- Cell +254709101200
- Tel +254709101200
- WhatsApp +254741676635
- United States
- +254709101200
- DOWNLOAD OUR APP
-


- Kenya
- 8th Floor, Pinetree Plaza, Kaburu Drive, Ngong Road, Nairobi, Kenya
- USA
- Suite 1150, 1775 Eye Street NW, USA, Washington DC 20006, USA
- Investments
- High Yield
- Private Equity
- Real Estate
- Real Estate
- RiverRun Estates
- Cytonn Towers
- The Ridge
- Taraji Heights
- The Alma