Cytonn Annual Markets Review - 2018
By Cytonn Research Team, Jan 6, 2019
Executive Summary
Global Markets Review
Global economic growth is expected to come in at 3.7% in 2018 as per data from the International Monetary Fund (IMF), similar to the 3.7% recorded in 2017, as growth in the US was countered by the negative effects of the trade conflicts between the US, China and Eurozone, as well as a weaker expected growth for some key emerging markets such as China and Brazil. Central Banks’ Policy stance in advanced economies adjusted towards economic tightening, with the US Federal Reserve raising the Federal Funds Rate four times in 2018, while the European Central Bank indicating a cease to the monthly bond purchases in December 2018, an end to the 3-year stimulus program;
Sub-Saharan Africa Region Review
Sub-Saharan Africa economic growth remained relatively strong in 2018 with preliminary data indicating that the region recorded a 2.7% GDP growth in 2018, better than the 2.3% recorded in 2017. Regional currencies depreciated in 2018 underpinned by capital outflows from emerging markets to advanced markets, following a tightening of monetary policy in the United States as well as the strengthening dollar, coupled with events in the global markets, which included the trade war between China and the USA;
Kenya Macro Economic Review
The Kenyan economy expanded by an average of 6.0% for the first three quarters of 2018 compared to an average of 4.7% in a similar period in 2017 driven by (i) recovery of agricultural sector, which recorded a growth of 5.3% due to improved weather conditions, (ii) improved business and consumer confidence, and (iii) increased output in the real estate, manufacturing and wholesale & retail trade sectors;
Fixed Income
During the year, yields on the 91-day, 182-day and 364-day T-bills declined by 80 bps, 160 bps and 120 bps to close at 7.3%, 9.0% and 10.0% in 2018 from 8.1%, 10.6% and 11.2% at the end of 2017, respectively. This is attributed to the low lending rates that have seen banks shy away from lending to the private sector and instead turn to the less risky government securities hence reducing the competition for government securities, coupled with the Central Bank of Kenya’s efforts to keep the rates low by rejecting expensive bids. The average subscription rates came in at 123.2% for T-Bills, and 75.8% for primary T-bond auctions. The yield curve experienced downward pressure during the year as the Kenyan Government contained rates by rejecting expensive bids in the auction market;
Equities
During the year, the market was on a downward trend, with NASI, NSE 25 and NSE 20 declining by 18.0%, 17.1% and 23.7%, respectively, as a result of declines in most large cap stocks. Listed banks recorded a 16.2% increase in their core earnings per share in Q3’2018 compared to a decline of 9.3% in Q3’2017. The growth in earnings can be attributable to improved operating efficiencies in the wake of the interest rate cap, with banks streamlining operations through digitization strategies. In 2018, 8 companies issued profit warnings as compared to last year’s 6, while 2 companies, namely Deacons and ARM Cement, were suspended from trading at the Nairobi Securities Exchange;
Private Equity
During the year, private equity activity was high as evidenced by increased deal activity by local and global investors including Kuramo Capital, AfricInvest, and Goldman Sachs, among others. In Financial Services sector, Kuramo Capital acquired a 90.9% stake in GenAfrica. In the Hospitality sector, Emerging Capital Partners (ECP) acquired a majority stake in Artcaffé Group. In the Fintech sector, Jumo, a mobile financial services platform, raised Kshs 6.6 bn. In the Education sector Makini School Limited was acquired for Kshs 1.5 bn, while in Real Estate Vantage Capital acquired an undisclosed stake in the Rosslyn Riviera Shopping Mall for Kshs 800.0 mn;
Real Estate
During the year, the real estate sector recorded continued investment across all themes driven by (i) the political stability following the conclusion of the electioneering period in Q4’2017 (ii) the continued positioning of Nairobi as a regional hub, leading to increased entry of multinationals thus creating demand for residential units, retail centres, commercial offices and hotels, (iii) the kicking off of the affordable housing initiative as part of the Kenyan Government’s Big 4 Agenda, which has gained momentum with the outlining of plans to launch projects, and (iv) the improving macroeconomic environment, with the country’s GDP growing by 6.0% in Q3’2018, higher than the 4.7% recorded in Q3’2017.
- Cytonn Asset Managers Limited (CAML), the regulated affiliate of Cytonn Investments, has been registered and authorized by the Retirement Benefits Authority (RBA) to manage retirement benefit scheme funds. This comes a few months after the Capital Markets Authority (CMA) licensed CAML in March 2018. Read the full press statement here You can also read the media story here
- Faith Maina, Investments Analyst, was on KTN to discuss the events that shaped 2018 as well as what Cytonn has to offer going to 2019. Watch Faith here
- The Ridge, a comprehensive lifestyle development at Ridgeways in Nairobi County, by Cytonn Real Estate, offers a live work play environment. To view show house images click here. The site is open to clients all week long.
- We continue to hold weekly workshops and site visits on how to build wealth through real estate investments. The weekly workshops and site visits target both investors looking to invest in real estate directly and those interested in high yield investment products to familiarize themselves with how we support our high yields. Watch progress videos and pictures of The Alma, Amara Ridge, The Ridge, and Taraji Heights. Key to note is that our cost of capital is priced off the loan markets, where all-in pricing ranges from 16.0% to 20.0%, and our yield on real estate developments ranges from 23.0% to 25.0%, hence our top-line gross spread is about 6.0%. If interested in attending the site visits, kindly register here;
- We continue to see very strong interest in our weekly Private Wealth Management Training (largely covering financial planning and structured products). The training is at no cost and is open only to pre-screened participants. We also continue to see institutions and investment groups interested in the training for their teams. The Cytonn Foundation, under its financial literacy pillar, runs the Wealth Management Training. If interested in our Private Wealth Management Training for your employees or investment group, please get in touch with us through wmt@cytonn.com. To view the Wealth Management Training topics, click here;
- For recent news about the company, see our news section here;
- We have 10 investment-ready projects, offering attractive development and buyer targeted returns of around 23.0% to 25.0% p.a. See further details here: Summary of Investment-Ready Projects;
- We continue to beef up the team with ongoing hires for Financial and Real Estate Advisors for our offices in Nairobi, Nakuru, Kisumu, and Nyeri. Visit the Careers Section on our website to apply;
- Cytonn Centre for Affordable Housing (CCFAH) is looking for a 2-acre land parcel for a joint venture in; Kiambu County (Ruiru, Kikuyu, and Lower Kabete), Nairobi County and its environs.
The parcel should be; (i) fronting a main road, or not more than 800 metres from the main road, and (ii) priced at Kshs 20mn per acre or below. For more information or leads email us at affordablehousing@cytonn.com
The year 2018 was characterized by a flat global growth as the growth in the US was weighed down by the negative effects of the trade conflicts between the US, China and Eurozone, as well as a weaker outlook for some key emerging markets such as China and Brazil, arising from country-specific factors such as (i) country-wide industrial action in Brazil, (ii) political uncertainty in Britain due to the Brexit vote, and (iii) country-wide protests in France, tighter financial conditions, and geopolitical tensions. According to IMF, global GDP growth in 2018 is expected to come in at 3.7%, similar to the growth registered in 2017, and higher than the 5-year average of 3.5%. The IMF downgraded their expectations for global growth this year from 3.9% in June 2018 to 3.7% in October 2018, citing that the trade tensions between the U.S. and trading partners have started to hit economic activity worldwide.
In terms of trade, the World Trade Organization (WTO) downgraded their outlook for world trade growth in 2018 to 3.9% from their 4.4% expectation in April 2018, citing a rise in trade tariffs targeting a variety of exports from large economies, mainly the US, China and the Eurozone. The uncertainty generated by the continuous trade conflicts has had the impact of reducing international trade. Monetary policy tightening in developed economies has also contributed to volatility in exchange rates, especially in emerging markets, thereby further negatively affecting international trade.
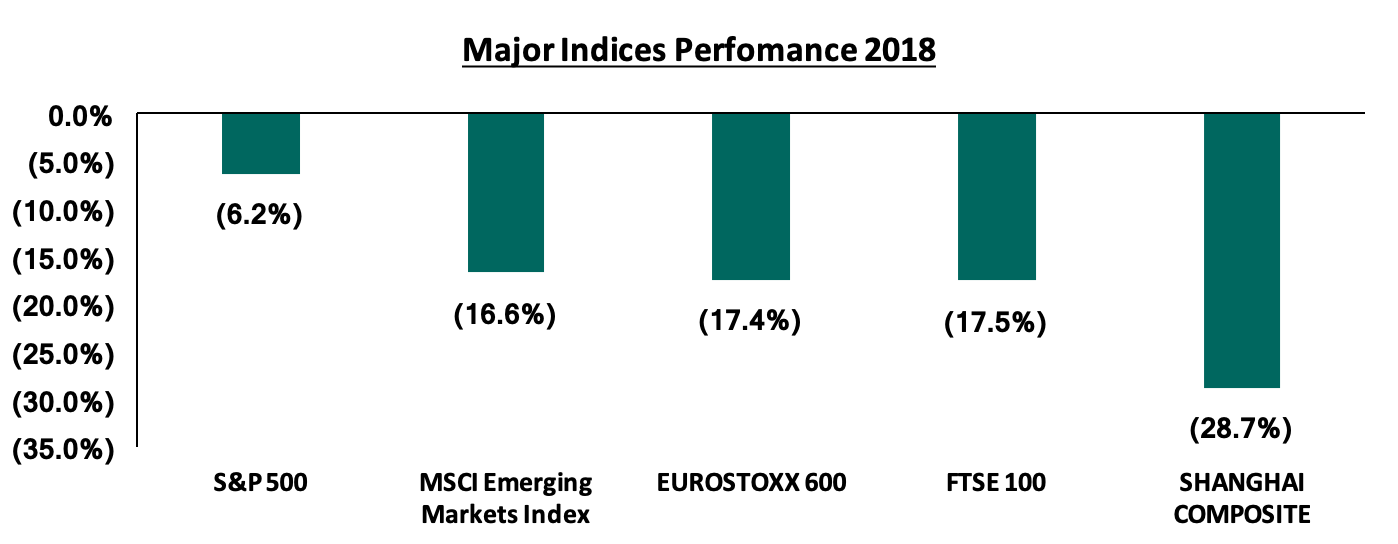
Global equity markets registered declines during the year, as shown in the chart below, as gains made during the first 9-months of the year were wiped-out by large declines in the fourth quarter of the year. The poor performance in the last quarter of the year was due to a slowdown in global economic growth prospects, following a persistence in trade conflict among major economies, increased geopolitical tensions and declining commodity prices, which dampened investor sentiment leading to sustained price declines.
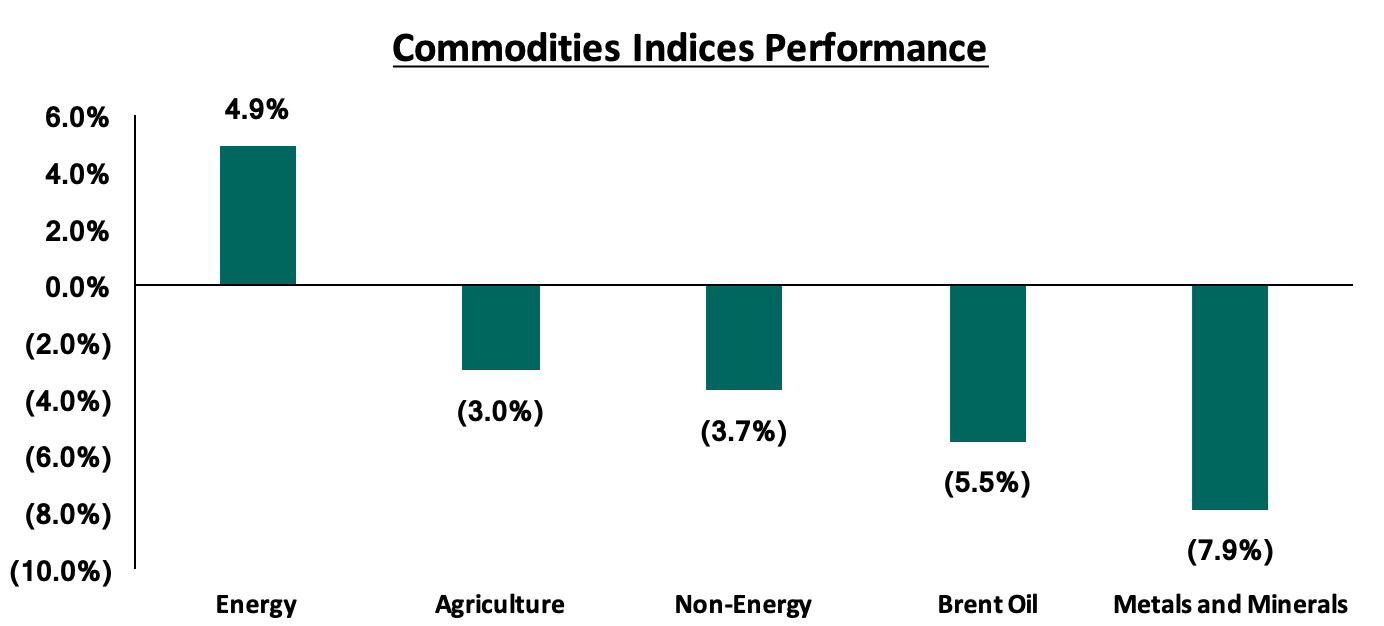
Global commodities registered declines in 2018, with agriculture, non-energy commodities, Brent oil and metals & minerals registering declines of 3.0%, 3.7%, 5.5%, and 7.9%, respectively, while energy gained by 4.9%, according to the World Bank Commodity Prices Index. The rise in energy prices was driven by gains in natural gas prices in US, Japan and Europe that rose 49.9%, 34.8%, and 15.8%, respectively, coupled with the 1.8% rise in crude oil prices. Below is a chart highlighting the performance of select commodity indices:
United States
The US economy continued to register strong growth with the growth for Q3’2018 coming in at 3.5%, slower than the 4.2% recorded in Q2’2018, but faster than the 2.8% recorded in Q3’2017. The growth has largely been attributed to the Trump administration’s USD 1.5 tn tax cut package, which has boosted consumer spending, and consequently supported business investment, as shown by the increased overall inventory accumulation. The labor market has remained strong, with Non-Farm Payroll (NFP) increasing by 155,000 in November 2018, and at an average monthly increase of 192,000 during the year. This has seen the unemployment rate remain at a 49-year low of 3.7%. Wage growth has also remained strong, coming in at a 0.9% q/q increase, and a 3.1% y/y increase, the highest since June 2009.
The Federal Reserve has continued implementing its tighter monetary policy, having started on a tightening cycle in December 2016. In 2018, the Fed implemented four hikes, of 25 bps each, in March, June, October and December, with the Federal Funds rate ending the year at a band of 2.25% - 2.50%, from a range of 1.25% - 1.5% at the beginning of the year. The rate hikes were driven by:
- A strong labor market, with an average of 192,000 new jobs added every month during the year and the unemployment rate at lows of 3.7% in December, compared to 5.0% unemployment rate that is considered full employment in the US economy,
- A relatively strong annual economic growth, which is projected to come in at 2.9% in 2018, higher than 2.3% recorded in 2017, driven by increased consumer spending, and,
- A desired rate of inflation in the economy. On a 12-month basis, both overall inflation and inflation for items other than food and energy have remained near the government’s preferred level of 2.0%, coming in at 2.2% in November 2018,
The stock market registered declines, with the S&P 500 declining by 6.2%, as 9.0% YTD gains to September 2018 were eroded during the fourth quarter of the year. The gains in the first 9 months of the year were supported by strong growth in corporate earnings, and expected implementation of pro-growth policies under the administration of President Trump, including tax reforms that have resulted in corporate tax rates falling to 21.0% from 35.0%, with the administration indicating the possibility of further tax declines. However, for the fourth quarter of the year, stock markets posted declines as increased concerns of a slower global economic growth, tighter monetary conditions, increased trade and geopolitical tensions, and the possibility of an economic recession in the US in 2019 dampened investor sentiment. In terms of valuations, the Cyclically Adjusted Price/Earnings (CAPE) ratio is currently at 29.0x, 72.6% above the historical average of 16.8x, indicating the market albeit on a declining trend, remains overvalued relative to historical levels.
Eurozone
Economic growth in the Eurozone slumped to a four year low in Q3’2018, as GDP expanded by 0.2%, slower than the 0.4% recorded in Q1’2018 and Q2’2018, and 0.7% in Q3’2017.The slowdown is due to:
- Reduced exports from the region, which contracted by 0.1% q/q from the 2.0% growth recorded in Q2’2018, owing to the cooling global trade,
- An increase in geopolitical tensions, which weighed on investment in the quarter, as fixed investment growth came in at 0.2%, significantly lower than the 1.5% recorded in Q2’2018, and,
- A slowdown in business activity, with the Eurozone’s Purchasing Managers Index (PMI) falling to a 49-month low of 51.3 in December 2018, from 60.6 in December 2017, indicating that growth of business activity in the euro area slowed to the weakest for over four years in December.
The region is expected to grow by 2.0% in 2018, compared to a 2.4% growth experienced in 2017, and a downward revision from the 2.2% expected growth rate as at June 2018 on slower expected growths in major economies such as Germany and France, of 1.9% and 1.6%, compared to earlier projections of 2.2% and 1.8%, respectively. The labor market recovery continued, with the unemployment rate dropping to 8.1% in October 2018, from 8.6% in December 2017. This, however, is still below the desired level of 5.0%
The European Central Bank (ECB) announced that it would stop its asset-bond buying program in December 2018. This is after the bank had accumulated EUR 2.6 tn in assets over nearly four-years, in a bid to stimulate the Eurozone’s economic recovery. The ECB reiterated that it would continue to reinvest the principal payments from maturing securities for an undefined extended period time, which should keep conditions accommodative. Throughout the year, the ECB left the refinancing rate at 0.0%, the marginal lending rate at 0.25% and deposit facility rate at -0.4%. Inflation remained stable during the year at 1.9% as at November 2018, within the target of 2.0%.
Eurozone stock markets were on a declining trend with The EuroStoxx 600 index declining by 17.4% during the year, driven by dampened investor sentiment owing to reduced global economic growth, and heightened geopolitical tensions, following civil unrest in France and increased uncertainty on Britain’s withdrawal from the EU (“Brexit”). In terms of valuations, the EuroStoxx 600 Index is currently trading at a P/E of 14.8x, 27.1% below its historical average of 20.3x, indicating markets are undervalued and are trading at cheap valuations relative to historical levels.
China
The World Bank expects China’s 2018 growth to come in at 6.6%, slightly lower than the 6.7% recorded in 2017. The economy recorded a 6.5% growth in Q3’2018, the lowest growth since Q1’2009, largely weighed down by reduced global trade owing to heightened geopolitical tensions and trade tensions. China and the US have been caught up in a trade war, with the US imposing a 10.0% tariff on goods worth USD 200.0 bn, and China imposing a further retaliatory 10.0% tariff on goods worth USD 60.0 bn, bringing the value of goods under imposed/proposed tariffs by China to USD 110.0 bn.
The government has adopted a more accommodative monetary policy as they reduced their pace in the campaign to reduce the government debt, amid concerns about the slowdown in investment, and negative impact of the trade war with the US. The central government is focusing on encouraging local governments to speed up spending of unused revenues and banks to ensure adequate financing for local government projects. The Chinese Government announced CNY 1.2 tn (USD 180.0 bn) in business tax cuts in addition to policies aimed at boosting infrastructure expenditure.
The stock market recorded a negative return during the year, with the Shanghai Composite declining by 28.7% in 2018, weighed down by the dampened investor sentiment owing to the prolonged trade tensions with the US, heightened geopolitical tensions, and an overall slower economic growth. In terms of valuations, the Shanghai Composite index is currently trading at a P/E of 11.6x, 24.7% lower than the historical average P/E of 15.4x, indicating the market is currently undervalued, and is currently trading at cheap valuations relative to historical levels.
According to the World Bank, Sub-Saharan Africa economic growth remained relatively strong in 2018 with preliminary data indicating that the region recorded a 2.7% GDP growth in 2018, a rise from 2.3% recorded in 2017. In East Africa, a rebound in growth was recorded in Rwanda, Uganda and Kenya, which grew by 7.7%, 6.8% and 6.0%, respectively, as at Q3’2018 driven by improved agricultural performance attributed to improved weather conditions. A slowdown was however recorded in Tanzania mainly underpinned by an unfavorable investment climate following President John Magufuli’s stringent policy changes. In Western Africa, several countries recorded growths of 6.0% and above which include Benin, Burkina Faso, Cote d’Ivoire, and Senegal. There was however subdued growth in other countries in the region such as Nigeria which recorded a growth of 1.5% in Q2’2018 compared to the economic growth rebound of 1.95% and 2.1% recorded in Q1’2018 and Q4’2017, respectively with the subdued growth being attributed to a decline in oil production, which was due to pipeline closures during the period. In the Southern Africa region, growth was subdued in South Africa and Angola, which are the two major economies in the region. Growth in Angola, the region’s second largest oil exporter was dampened by reduced oil output following the maturity of key oil fields. Subdued growth in South Africa was mainly driven by weakness in agriculture, mining, and construction which dragged the economy into a technical recession due to negative growth recorded in two subsequent quarters in Q1’2018 and Q2’2018 at -2.6% and -0.4%, respectively.
Currency Performance
Regional currencies registered a depreciating trend in 2018 with the major decliner being the Zambian Kwacha, which registered a 19.0% depreciation, attributed to negative investor sentiments on the country’s debt sustainability, following the country’s ballooning debt levels, projected to have hit 69.0% of GDP as at the end of 2018. The underperformances of the region’s currencies was also underpinned by:
- Capital outflows from emerging markets to advanced markets following tightening of monetary policy, which saw the Federal Reserve raise the benchmark interest rate 4 times during the year to close the year at a range of 2.25% - 2.5% in its final meeting in December, and,
- The strengthening dollar, coupled with events in the global markets, which included the trade war between China and the USA that put pressure on emerging market currencies.
Below is a table showing the performance of select African currencies, ranked by 2018 y/y change.
|
Select Sub Saharan Africa Currency Performance vs USD |
|||||
|
Currency |
Dec-16 |
Dec-17 |
Dec-18 |
2017 y/y change (%) |
2018 y/y change (%) |
|
Kenyan Shilling |
102.5 |
103.2 |
101.8 |
(0.7%) |
1.4% |
|
Nigerian Naira |
315.3 |
360.0 |
362.6 |
(14.2%) |
(0.7%) |
|
Malawian Kwacha |
727.5 |
725.5 |
736.8 |
0.3% |
(1.6%) |
|
Ugandan Shilling |
3596.5 |
3643.3 |
3708.5 |
(1.3%) |
(1.8%) |
|
Mauritius Rupee |
36.0 |
33.6 |
34.3 |
6.7% |
(2.2%) |
|
Tanzanian Shilling |
2181.0 |
2234.6 |
2298.7 |
(2.5%) |
(2.9%) |
|
Ghanaian Cedi |
4.2 |
4.5 |
4.9 |
(6.8%) |
(8.6%) |
|
Botswana Pula |
10.7 |
9.8 |
10.7 |
8.1% |
(9.0%) |
|
South African Rand |
13.7 |
12.4 |
14.3 |
9.9% |
(15.9%) |
|
Zambian Kwacha |
9.9 |
10.0 |
11.9 |
(0.4%) |
(19.0%) |
Of the currencies covered, the Kenya Shilling was the only currency which appreciated against the dollar in 2018.
African Eurobonds:
Yields on African Eurobonds rose in 2018 partly attributed to the aggressive tightening monetary policy regime adopted by the U.S Federal reserve, coupled with the China-U.S trade tensions, which dampened investor sentiment in emerging markets. Domestic country risks also exacerbated the rise in yields. As a result, most foreign investors began pulling out their capital in the wake of rising US treasury yields and a strong dollar, thereby increasing the risk profile of most emerging market economies.
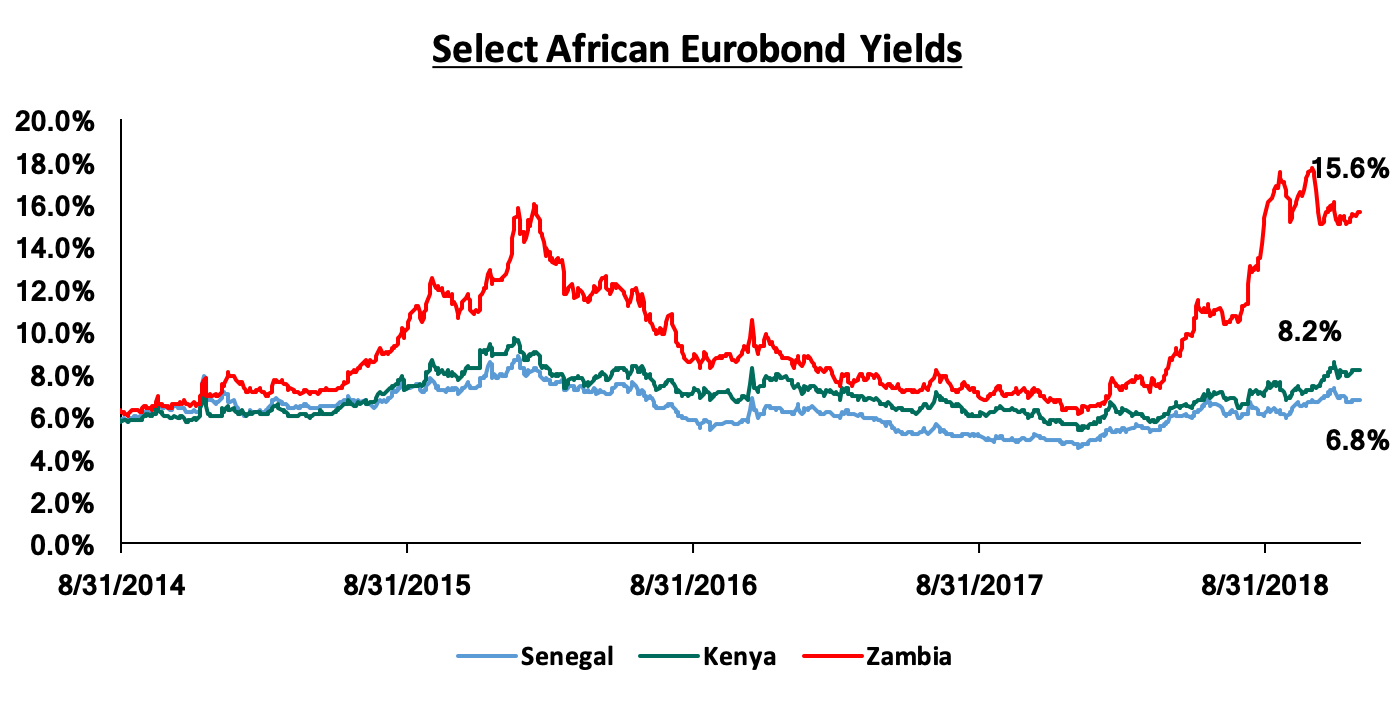
Appetite for government securities in Sub Saharan Africa remained strong in 2018, as risk-adjusted returns remained higher compared to those in developed economies. Eurobonds issued during the year included:
- Ghana, which issued a dual-tranche Eurobond in May 2018, raising a total of USD 2.0 bn in 10-year and 30-year instruments of USD 1.0 bn each. The issue, which was to raise funds for budgetary purposes and liability management, was 4.0x oversubscribed with USD 8.0 bn in bids received,
- Nigeria, which issued a triple-tranche debt note of USD 1.2 bn with a 7-year tenor, USD 1.0 bn with a 12-year tenor and USD 0.8 bn with a 30-year tenor in November 2018, with total bids received amounting to USD 9.5 bn translating to a 3.3x oversubscription.
- Senegal, which issued two bonds of USD 1.0 bn each, which were 8.0x oversubscribed with USD 9.3 bn in bids received. The stated plan was for new infrastructure development as well as refinancing some USD 150.0 mn of foreign debt, due in 2021, and,
- Kenya, which issued a USD 1.0 bn, 10-year tenor bond and another 30-year tenor bond of a similar amount; earmarked for infrastructural development and active debt management. The issue raised USD 14.0 bn from investors, thus an oversubscription by 7.0x.
Equities Market Performance
Most of the Sub-Saharan African (SSA) stock markets recorded negative returns in 2018, erasing the gains made in Q1’2018. The region experienced capital outflows as profit-taking investors exited the markets to realize the gains made in various sectors as at Q1’2018, such as oil and gas that had been boosted by a global rally in crude oil prices, and the financial services sector. The price correction due to the capital outflows coupled with the depreciating currencies resulted in most exchanges registering a decline in performance. Below is a summary of the performance of key exchanges:
|
Equities Market Performance (Dollarized*) & Price to Earnings (P/E) |
||||||
|
Country |
Current Price to Earnings (P/E) |
Dec-16 |
Dec-17 |
Dec-18 |
2017 y/y change (%) |
2018 y/y change (%) |
|
Malawi |
- |
18.3 |
29.8 |
39.8 |
62.5% |
33.6% |
|
Rwanda |
- |
0.2 |
0.2 |
0.1 |
1.0% |
(5.5%) |
|
Ghana |
- |
395.6 |
569.7 |
510.8 |
44.0% |
(10.3%) |
|
Kenya |
10.8x |
1.3 |
1.7 |
1.4 |
27.5% |
(16.9%) |
|
Zambia |
12.1x |
421.7 |
532.1 |
441.1 |
26.2% |
(17.1%) |
|
Tanzania |
11.8x |
1.0 |
1.1 |
0.9 |
6.6% |
(17.1%) |
|
Nigeria |
7.9x |
85.3 |
106.2 |
86.5 |
24.5% |
(18.6%) |
|
Uganda |
- |
0.4 |
0.6 |
0.4 |
35.0% |
(20.9%) |
|
South Africa |
14.5x |
3688.1 |
4802.6 |
3667.1 |
30.2% |
(23.6%) |
|
BRVM |
8.0x |
0.5 |
0.4 |
0.3 |
(4.2%) |
(32.5%) |
|
*The index values are dollarized for ease of comparison |
||||||
The Sub-Saharan Africa region is expected to perform well supported by increased public spending on infrastructural development owing to the high demand for basic needs. Key risks remain difficult business conditions and poor infrastructure, reliance on commodity exports, political tension in some countries and debt sustainability due to high levels of public debt in most economies in the region. Stock markets valuations remain attractive for long-term investors. The improved regional economic growth prospects remain key towards enhancing investor sentiment and attracting investment inflows into the region.
Economic Growth:
The country's Gross Domestic Product (GDP), adjusted for inflation, increased in 2018 having expanded by 5.7% in Q1’2018, 6.3% in Q2’2018 and 6.0% in Q3’2018 to record an average growth of 6.0% for the 3 quarters compared to an average growth of 4.7% over the same period in 2017. The improved growth has been against a backdrop of a stable macroeconomic environment, driven by:
- A recovery in agriculture, which saw the sector record an average growth of 5.3% for the first 3 quarters of 2018, due to improved weather conditions. In terms of sectoral contribution, agriculture remained the highest contributor averaging 22.4% over the same period,
- Improved business and consumer confidence, evidenced by the Stanbic Bank’s Monthly Purchasing Managers Index (PMI), which averaged 54.3 in the 11-months to November 2018, a rise from 46.0, recorded in a similar period in 2017. Key to note, a PMI reading of above 50 indicates improvements in the business environment, while a reading below 50 indicates a worsening outlook. The improvement in the business environment has also been facilitated by the improved ease of doing business, which saw Kenya’s rank improve by 19 positions to #61 from #80 as per the World Bank Doing Business Report 2019 as highlighted in our Analysis of Kenya’s Doing Business Environment. This was mainly driven by improvements in protection of minority investors, access to credit, improved property registration and insolvency resolution, and,
- Increased output in the real estate, manufacturing, and wholesale & retail trade sectors, which grew by 5.8%, 3.2% and 6.8%, respectively, and favorable weather conditions that positively affected output from agricultural and hydroelectricity activities.
Analysis by sector showed that there was accelerated growth in the manufacturing sector, though its contribution to GDP recorded an average of 10.0% in the first 3 quarters of 2018. This is despite the Kenyan Government singling it out as one of the key pillars to drive the economy in the Big 4 Agenda. The sector’s contribution is still way below the government’s target of increasing it to 15.0% of GDP by 2022, which is expected to increase manufacturing sector jobs by more than 800,000 per annum over the next four years.
Kenya Shilling:
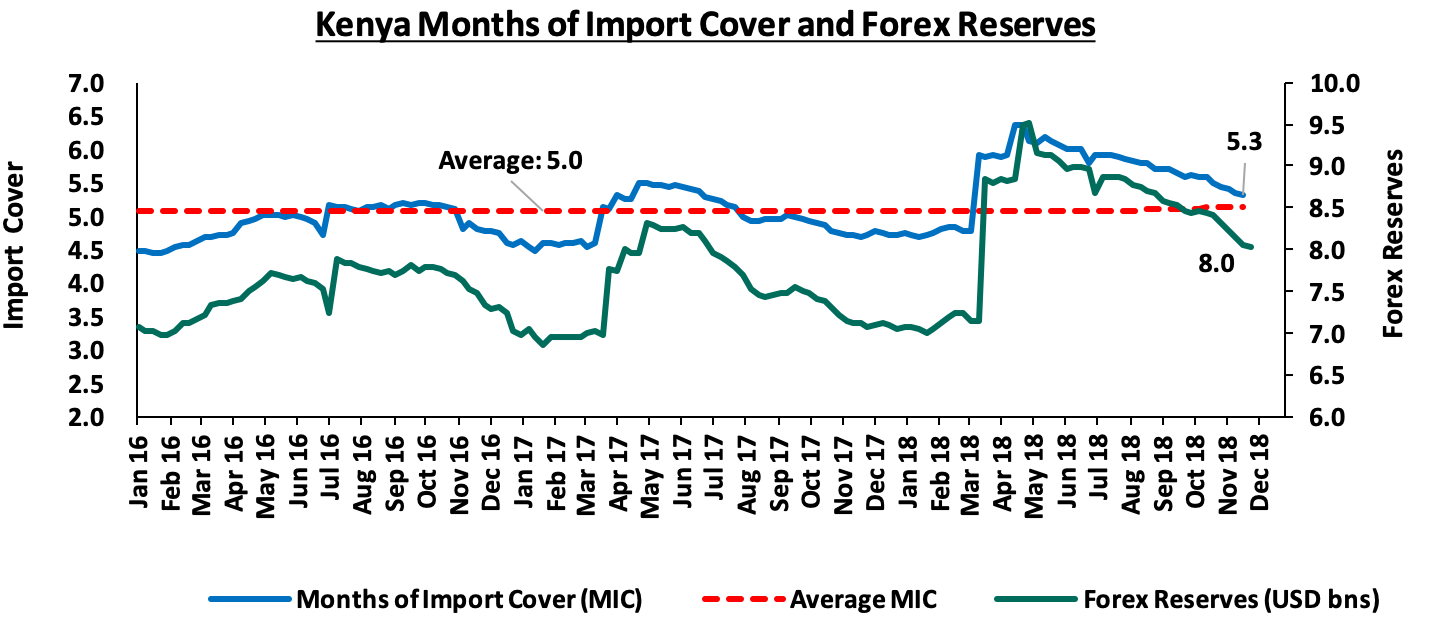
The Kenya Shilling gained 1.4% against the US Dollar to close at 101.8 in 2018 compared to 103.2 at the end of 2017; the Kenya Shilling was the only major African currency, which appreciated against the dollar. In our view, the shilling should remain relatively stable to the dollar in the short term, supported by:
- The narrowing in the current account deficit to 5.3% in the 12 months to September 2018, compared to 6.5% in September 2017. The narrowing of the current account deficit is largely due to increased exports of tea and horticulture, increased diaspora remittances, strong receipts from tourism, and lower imports of food and SGR-related equipment relative to 2017.
- Inflows from principal exports, which include coffee, tea, and horticulture, which increased by 5.2% for the first 9 months of 2018 to Kshs. 209.0 bn from Kshs. 199.0 bn over the same period in 2017,
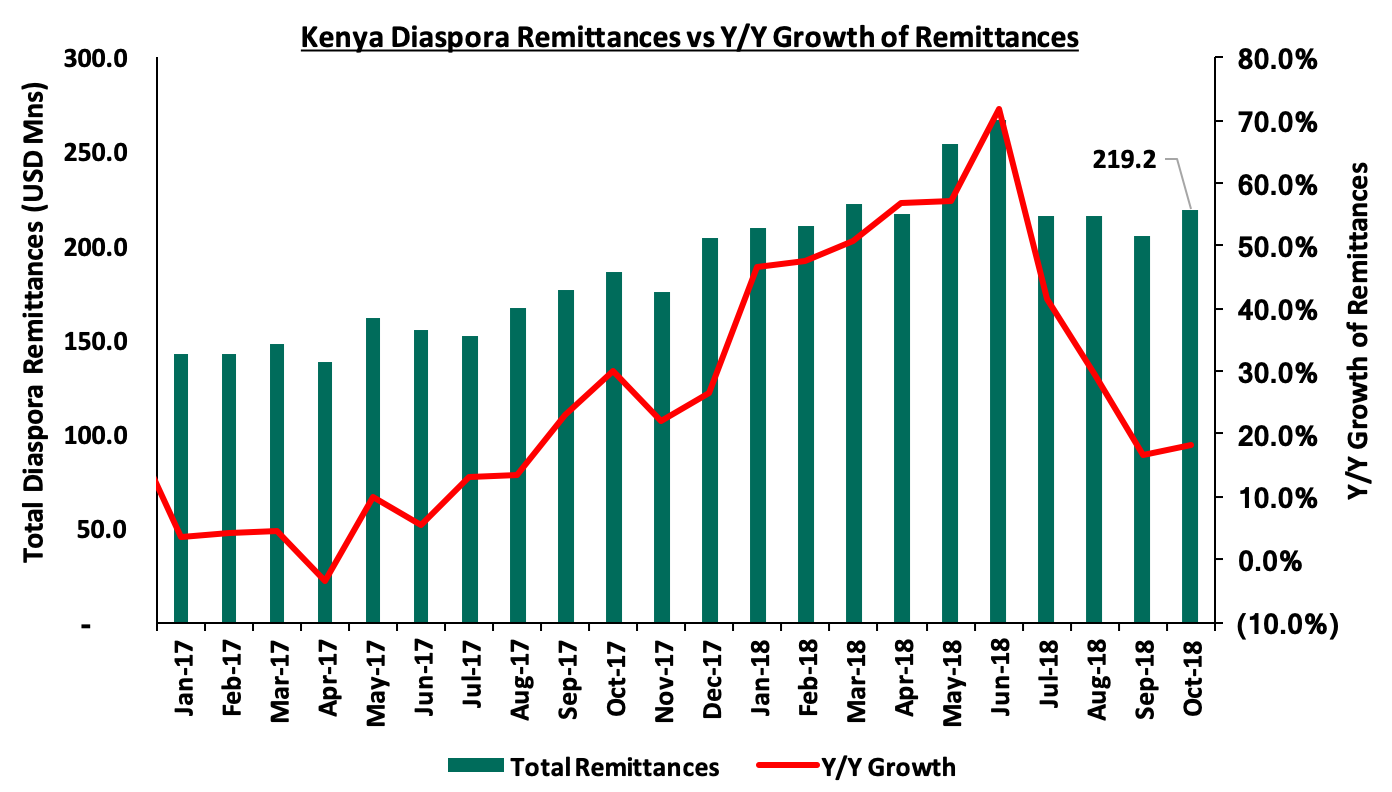
- Improving diaspora remittances, which increased by 42.5% to USD 2.2 bn during the first 10 months of 2018 from USD 1.6 bn during the same period in 2017, with the largest contributor being North America at USD 1.2 bn attributed to; (a) recovery of the global economy, (b) increased uptake of financial products by the diaspora due to financial services firms, particularly banks, targeting the diaspora, and (c) new partnerships between international money remittance providers and local commercial banks making the process more convenient, and,
- High forex reserves, which currently stand at USD 8.0 bn (5.3 months of import cover) continue to provide adequate cover, and a buffer against short-term shocks in the foreign exchange market.
Inflation:
The inflation rate for the month of December 2018 rose to 5.7% from 5.6% recorded in November bringing the 2018 average to 4.7% compared to the 2017 average of 8.0%. Going forward, overall inflation is expected to remain within the target range (of 2.5%- 7.5%) in the near term, mainly due to expected lower food prices as a result of favorable weather conditions, the decline in international oil prices, and the recent downward revision in electricity tariffs. The recent excise tax adjustment on voice calls and internet services is expected to have a marginal impact on inflation.
Monetary Policy:
The Monetary Policy Committee lowered the Central Bank Rate (CBR) twice, in the 6 meetings held in 2018 in order to support economic activity, citing that economic output was below its potential level, and there was room for further accommodative monetary policy. During their meeting in March 2018, the MPC lowered the CBR to 9.5% from the earlier 10.0% that had been set in September 2016. The MPC later lowered the CBR by another 50 bps during their July 2018 meeting to 9.0%, from the 9.5% set in March 2018.
2018 Highlights:
- The Kenyan National Treasury released the fiscal year 2018/19 national budget in June 2018. Below were some of the key highlights
Amounts in Kshs trillions unless stated otherwise
|
Comparison of 2017/18 and 2018/19 Fiscal Year Budgets |
|||||
|
|
2018/19 |
% change 2017/18 to 2018/19 |
2017/18 |
% change 2016/17 to 2017/18 |
2016/17 |
|
Revenue |
1.9 |
14.5% |
1.7 |
9.6% |
1.5 |
|
Recurrent expenditure |
1.5 |
7.7% |
1.4 |
13.3% |
1.2 |
|
Development expenditure |
0.6 |
7.8% |
0.6 |
(27.3%) |
0.8 |
|
County governments |
0.4 |
7.3% |
0.4 |
16.4% |
0.3 |
|
Total expenditure |
2.5 |
7.7% |
2.3 |
(0.2%) |
2.3 |
|
Deficit as % of GDP |
(5.7%) |
1.5% |
(7.2%) |
1.9% |
(9.1%) |
|
Net foreign borrowing |
0.3 |
(11.2%) |
0.3 |
(30.3%) |
0.5 |
|
Net domestic borrowing |
0.3 |
(8.6%) |
0.3 |
(14.7%) |
0.3 |
|
Total borrowing |
0.6 |
10.0% |
0.6 |
(23.6%) |
0.8 |
Key take-outs from the table:
- Total expenditure in the fiscal year 2018/2019 was set to increase by 7.7%, to Kshs 2.5 tn from Kshs 2.3 tn in the fiscal year 2017/18,
- Development expenditure was set to increase at a slightly faster rate than recurrent expenditure; with the latter increasing by 7.8% to Kshs 1.5 tn from Kshs 1.4 tn, while development expenditure increased by 7.8% to Kshs 625.0 bn from Kshs 579.6 bn in FY 2017/18,
- The budget deficit was projected to decline to 5.7% of GDP from an estimated 7.2% of GDP in the FY 2017/18; this in line with the International Monetary Fund’s (IMF’s) recommendation, in a bid to reduce Kenya’s public debt requirements,
- The total borrowing requirement to plug in the deficit declined to Kshs 558.9 bn from Kshs 620.8 bn, in a bid to reduce Kenya’s public debt burden which was estimated at 55.6% of GDP as at 2017 by the IMF, 5.6% above the East African Community (EAC) Monetary Union Protocol, the World Bank Country Policy and Institutional Assessment Index, and the IMF threshold of 50.0%, but well below the 74.0% mark considered a signal for debt unsustainability, and,
- Debt financing of the 2018/19 budget was split 51:49 between foreign and domestic borrowing, with the foreign and domestic debt being estimated at Kshs 287.0 billion (equivalent to 3.0% of GDP) and Kshs 271.9 billion (equivalent to 2.8% of GDP), respectively.
- The National Assembly convened for special parliamentary sittings held on 18th September and 20th September to discuss the President’s reservations against the Finance Bill through his memorandum. All the proposals as per the President’s memorandum were tabled in parliament and passed despite a chaotic sitting, after which the president assented to the Finance Bill 2018 on 21st September 2018. We covered a detailed analysis of this in our Cytonn Weekly #36/2018,
- The International Monetary Fund (IMF) paid a visit to Kenya where discussions were held with the Kenyan Government on the second review under a precautionary Stand-By Arrangement (SBA), which was extended to Kenya on 14th March 2016. For more information, see our Cytonn Weekly #30/2018. The second review however was not completed, leading to the expiry of the precautionary stand-by facility granted to Kenya on 14th September 2018,
- According to the Stanbic Bank’s Monthly Purchasing Manager’s Index (PMI), the business environment in the country slowed to a year low in November 2018. The seasonally adjusted PMI dropped to 53.1 in November from 54.0 in October. The index score has however improved generally during the year to average at 54.3 in the 11-months to November 2018, a rise from 46.0, recorded in a similar period in 2017. A PMI reading of above 50 indicates improvements in the business environment, while a reading below 50 indicates a worsening outlook. Firms reported growth in value of outputs due to the continued rise in new orders, which rose for the 9th consecutive month. This was despite high input costs attributed to raw material shortages. In response to increased output requirements, firms also raised their staffing levels during the month though at a modest rate. The private sector has remained resilient as the PMI is still above 50.
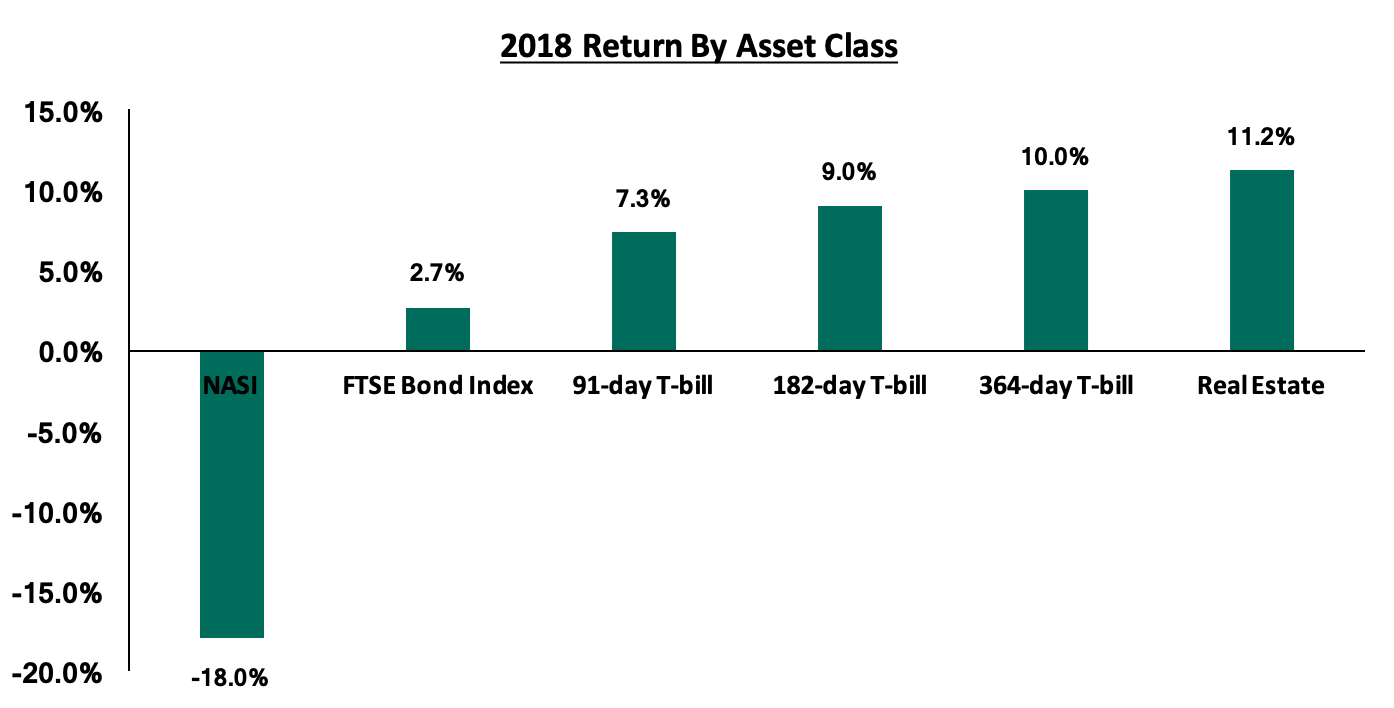
The graph below shows the summary of returns by asset class in 2018 (T- Bonds, T-Bills and Equities). The best performing asset in 2018 was Real Estate with returns of 11.2% followed by government bills with the 364-day, 182-day, and 91-day T-bills recording yields of 10.0%, 9.0% and 7.0% respectively. Investors continue to diversify their portfolio following the poor performance in the equities market as evidenced by the decline in NASI of 18%;
The table below shows the macro-economic indicators that we track, indicating our expectations for each variable at the beginning of 2018 versus the actual experience
|
Macro-Economic Indicators |
2018 Expectations at Beginning of Year |
Outlook - Beginning of Year |
2018 Experience |
Effect |
|
Government Borrowing |
We expected the government to come under pressure to borrow as it was well behind both domestic and foreign borrowing targets for FY 2017/18, and KRA was unlikely to meet its collection target due to expected suppressed corporate earnings in 2017 |
Negative |
i. The government surpassed its domestic borrowing target for the 2017/18 fiscal year, having borrowed Kshs 390.2 bn against a target of 297.6 bn |
Positive |
|
Exchange Rate |
Currency was projected to range between Kshs 102.0 and Kshs 107.0 against the USD in 2018. With the possible widening of the current account deficit being a possible point of concern, we expected the CBK to continue to support the Shilling in the short term through its sufficient reserves of USD 8.1 bn (equivalent to 5.3-months of import cover) |
Neutral |
The Kenya Shilling gained 1.4% against the US Dollar to close at 101.8 in 2018 compared to 103.2 at the end of 2017, and ranging between 100.0 and 103.4. |
Positive |
|
Interest Rates |
We expected upward pressure on interest rates, especially in the first half of the year, as the government fell behind its borrowing targets for the fiscal year. However, with the Banking (Amendment) Act, 2015, we did not expect much action by MPC with the CBR which had remained at 10.0% throughout 2017 |
Neutral |
The Monetary Policy Committee lowered the Central Bank Rate (CBR) twice, in the 6 meetings held in order to support economic activity; During their meeting in March 2018, the MPC lowered the CBR to 9.5% from the earlier 10.0% that had been set in September 2016. The MPC later lowered the CBR by another 50 bps during their July 2018 meeting to 9.0%, from the 9.5% set in March 2018 In their last meeting on 27th November 2018 they retained the CBR at 9.0 citing that inflation expectations remained well anchored within the target range, and that the economy was operating close to its potential |
Neutral |
|
Inflation |
Inflation was expected to average 7.5% compared to 8.0% last year |
Positive |
The inflation rate for the month of December 2018 rose to 5.7% from 5.6% recorded in November bringing the 2018 average to 4.7% (in line with the government’s target of 2.5% to 7.5%) compared to the 2017 average of 8.0%. |
Positive |
|
GDP |
GDP growth was projected to come in at between 5.4% - 5.6% |
Positive |
Kenya’s economy expanded in 2018 by 5.7% in Q1’2018, 6.3% in Q2’2018 and 6.0% in Q3’2018 to record an average growth of 6.0% for the 3 quarters compared to an average growth of 4.7% over the same period in 2017 |
Positive |
|
Investor Sentiment |
Investor sentiment expected to improve in 2018 given the now settling operating environment after conclusion of the 2017 elections |
Positive |
The Kenya Eurobond yields have been increasing, with the yields on the 2014 Eurobond issue rising by 220 bps and 230 bps YTD for the 5-year and 10-year Eurobonds, while the yields on the 10-year and 30-year Eurobonds issued in 2018 have risen by 170 bps and 150 bps, respectively, since the issue date. There has also been increased sell-offs by foreign equity investors amid fears of global economic slowdown, coupled with rising US Treasury yields. |
Neutral |
|
Security |
Security was expected to be maintained in 2018, especially given that the elections were concluded and the USA lifted its travel warning for Kenya, placing it in the 2nd highest tier of its new 4-level advisory program, indicating positive sentiments on security from the international community |
Positive |
The political climate in the country has eased, compared to 2017 with security maintained and business picking up. Kenya now has direct flights to and from the USA, a signal of improving security in the country |
Positive |
Out of the seven metrics that we track, five had a positive effect while two had a neutral effect, compared to the beginning of the year where four had a positive outlook, two had a neutral outlook and one factor had a negative outlook. In conclusion, macroeconomic fundamentals remained positive during the year because of an improved business environment created through political goodwill and improved security in the country.
T-Bills & T-Bonds Primary Auction:
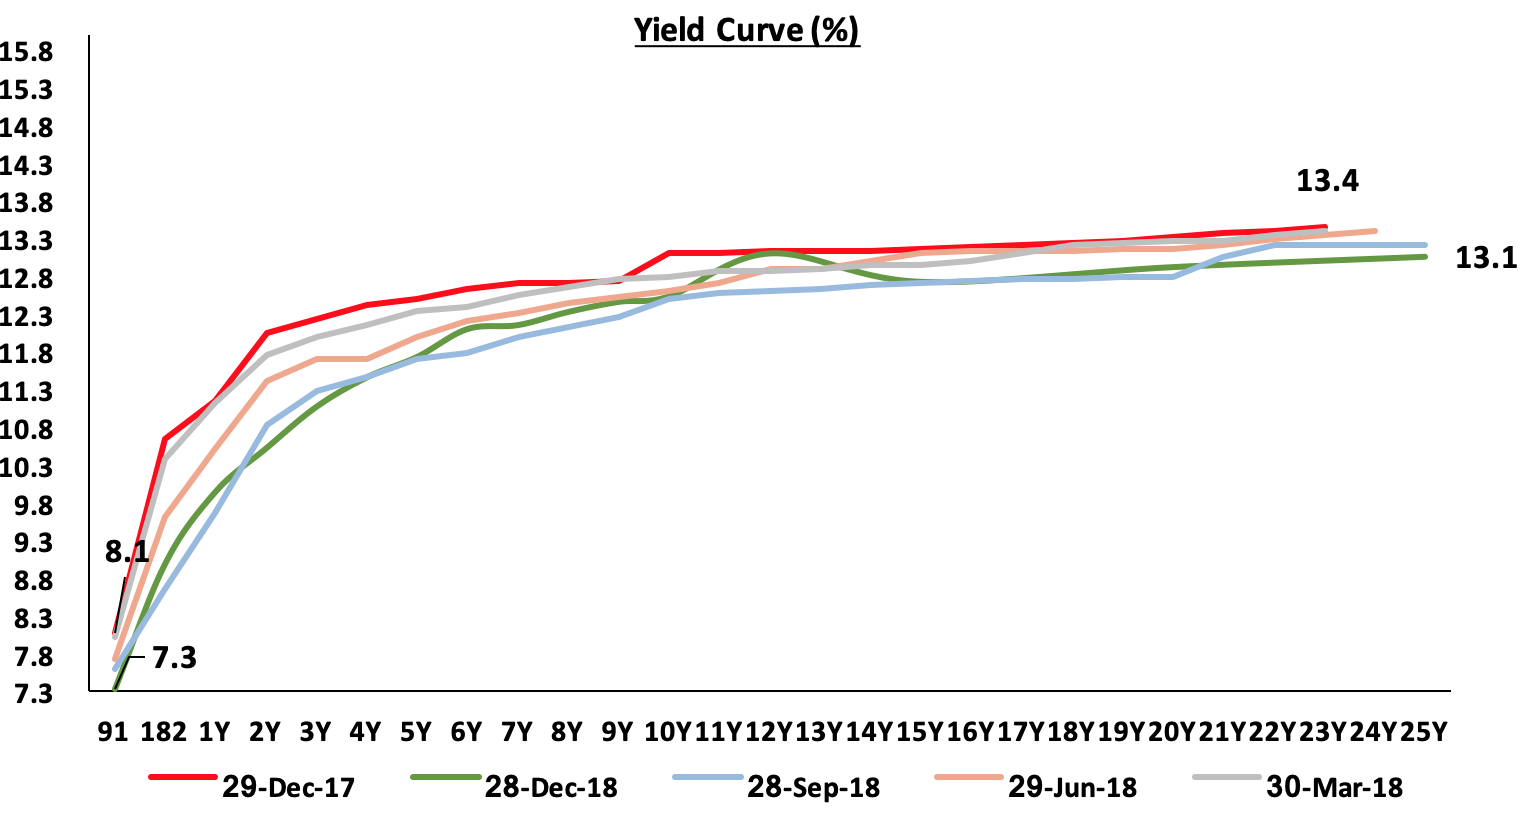
During the year 2018, T-bills auction recorded an oversubscription with the average subscription rate coming in at 123.2% compared to an average of 110.5% in 2017. The yield on the 91-day, 182-day and 364-day T-bills declined by 80 bps, 160 bps and 120 bps to close at 7.3%, 9.0% and 10.0% in 2018 from 8.1%, 10.6% and 11.2% at the end of 2017, respectively. This is mainly attributed to the Central Bank of Kenya’s (CBK’s) efforts to keep rates low by rejecting expensive bids. Following the enactment of the Banking (Amendment) Act, 2015, banks have preferred to lend to the less risky government as opposed to the riskier private sector.
Primary T-bond auctions in 2018 were undersubscribed with the subscription rate averaging 75.8% lower than the average subscription rate for 2017, which came in at 100.2%. This was mainly attributed to efforts by the government to raise its debt maturity profile to reduce the potential rollover risks in the medium term, by issuing longer-dated papers, which recorded lackluster performance due to uncertainties in the interest rates environment with the proposal of repealing the interest rate cap having been tabled in parliament through the Finance Bill 2018. The continued issuing of longer-term papers also led to saturation of long-end offers, leading to a relatively flat yield curve on the long-end. The average acceptance rate for 2018 came in at 73.0%, as the market adjusted to the efforts of the CBK to maintain the rates at low levels, with tap sales being a common method used by the CBK throughout the year to tame expensive bids and keep interest rates at low levels.
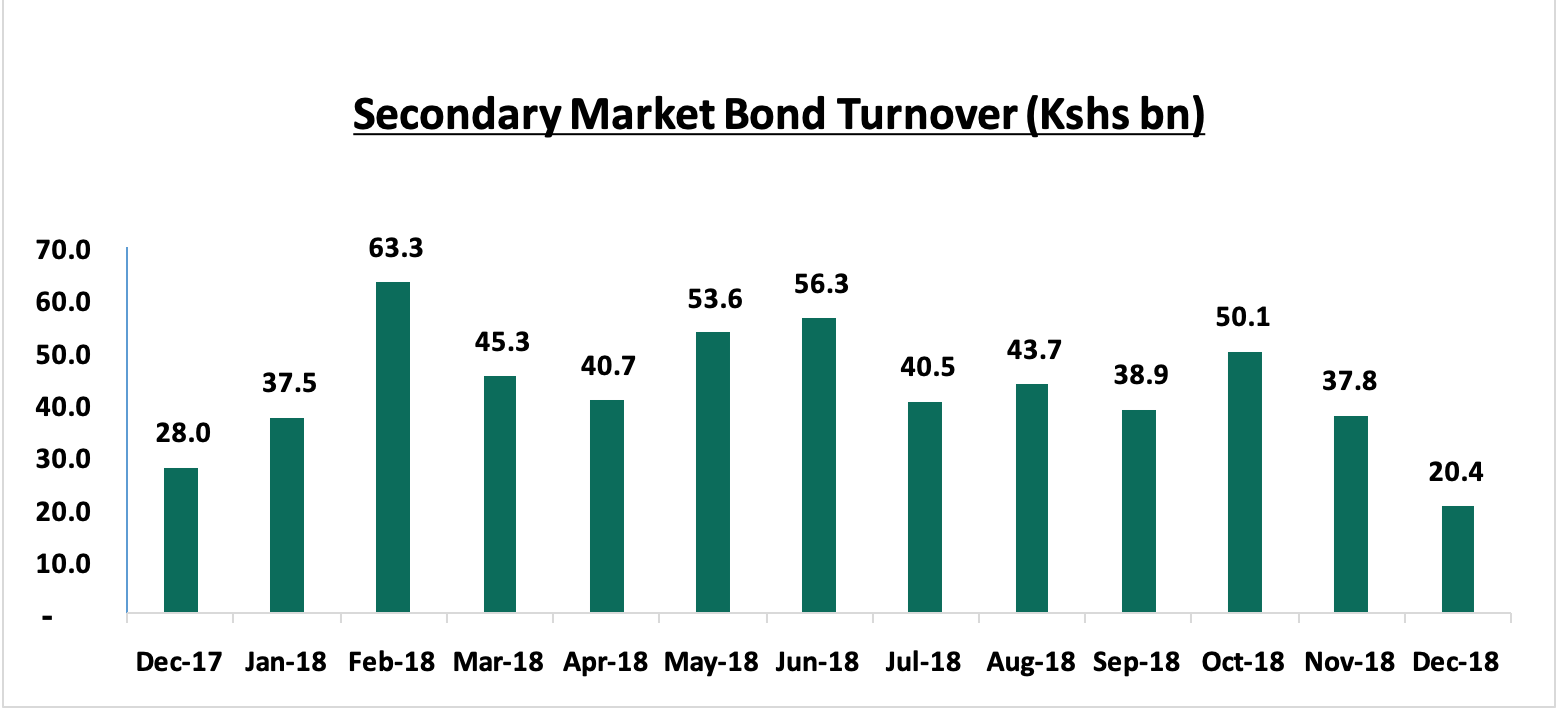
Secondary Bond Market Activity:
The NSE FTSE bond index recorded a 2.7% gain in 2018 with the secondary bond market recording increased activity with the turnover having increased by 26.1% to Kshs 528.2 bn from Kshs 419.0 bn in 2017, as the local institutional investors increased their allocation to treasury bonds as a result of poor performance of the equities market, which declined by 18.0%.
The graph below shows the evolution of the yield curve during the year, with yields declining, given that the government was only accepting reasonable bids in the auction market resulting into a downward pressure on yields in the secondary market.
Liquidity:
During the year, liquidity levels remained stable and well distributed in the market as indicated by the decline in the average interbank rate to 5.2% in 2018 from 6.4% in 2017, coupled with the 5.5% decline in the average volumes traded in the interbank market to Kshs 16.1 bn in 2018 from Kshs 17.0 bn recorded in 2017.
Kenya Eurobonds:
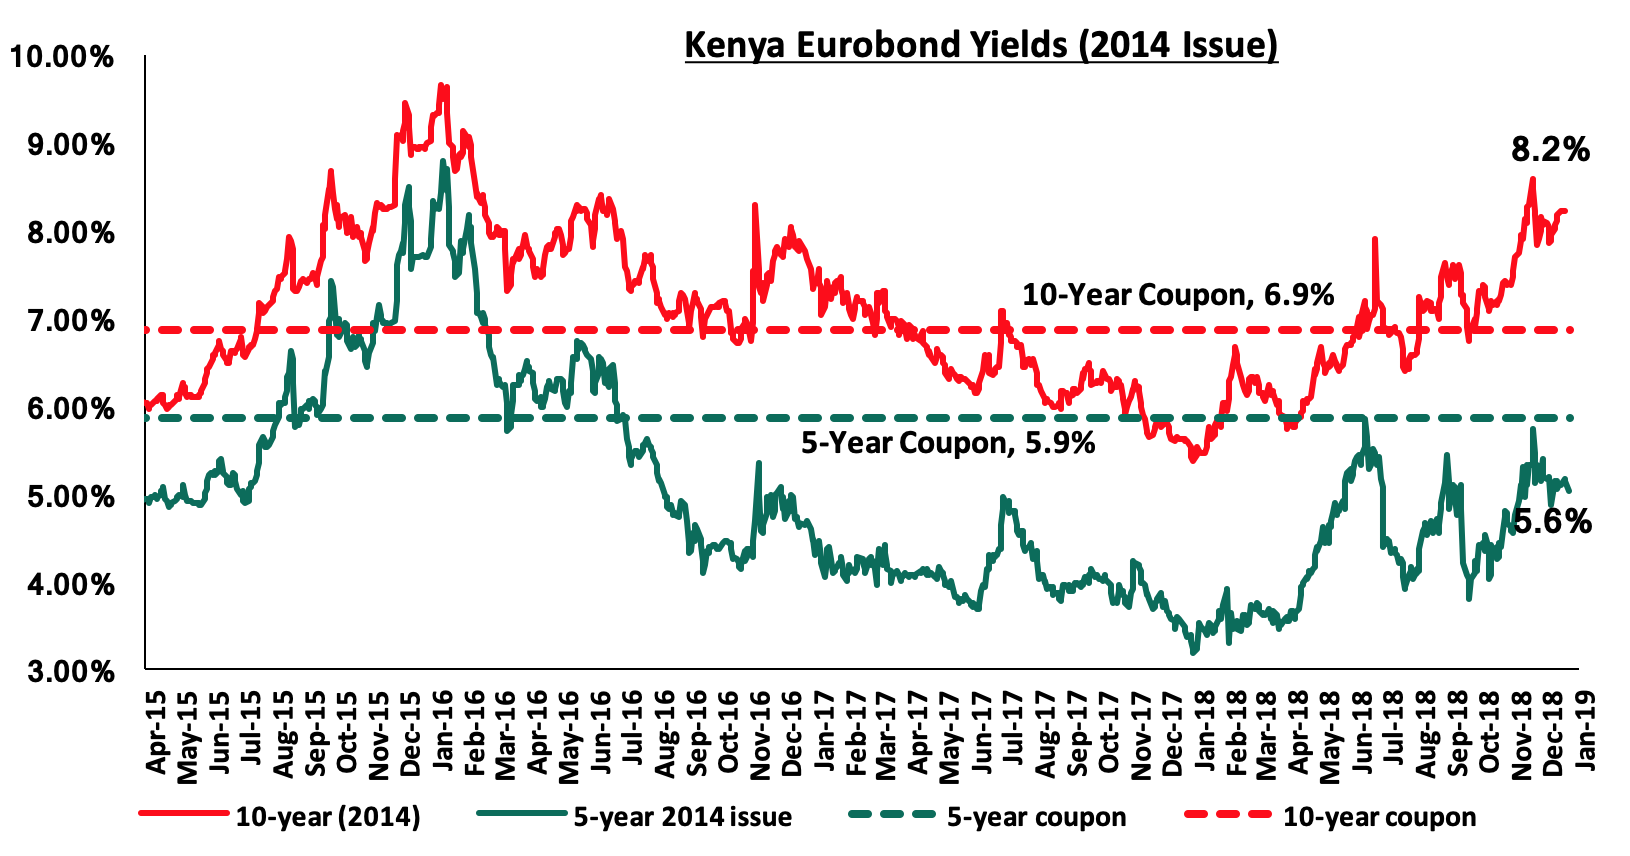
According to Bloomberg, yields on the 5-year and the 10-year Eurobond issued in 2014 increased by 2.2% points and 3.2% points to close at 5.6% and 8.2% at the end of 2018, from 3.4% and 5.0% at the end of 2017, respectively; the significant increase in yields during the year was due to;
- A higher country risk perception by investors, partly attributed to the International Monetary Fund (IMF) raising the risk of Kenya’s debt distress from low to moderate on October, resulting in investors demanding a higher return for the risk, and,
- The aggressive tightening monetary policy regime adopted by the U.S Federal reserve, that saw the Federal reserve raise the benchmark interest rate 4 times during the year, exacerbated the rise in yields as most foreign investors began pulling out their capital in the wake of rising US treasury yields and a strong dollar.
Since the mid-January 2016 peak, yields on the Kenya Eurobonds have declined by 3.8% points and 1.4% points for the 5-year and 10-year Eurobonds, respectively, due to the relatively stable macroeconomic conditions in the country. Key to note is that these bonds have 6-months and 5.5-years to maturity for the 5-year and 10-year, respectively.
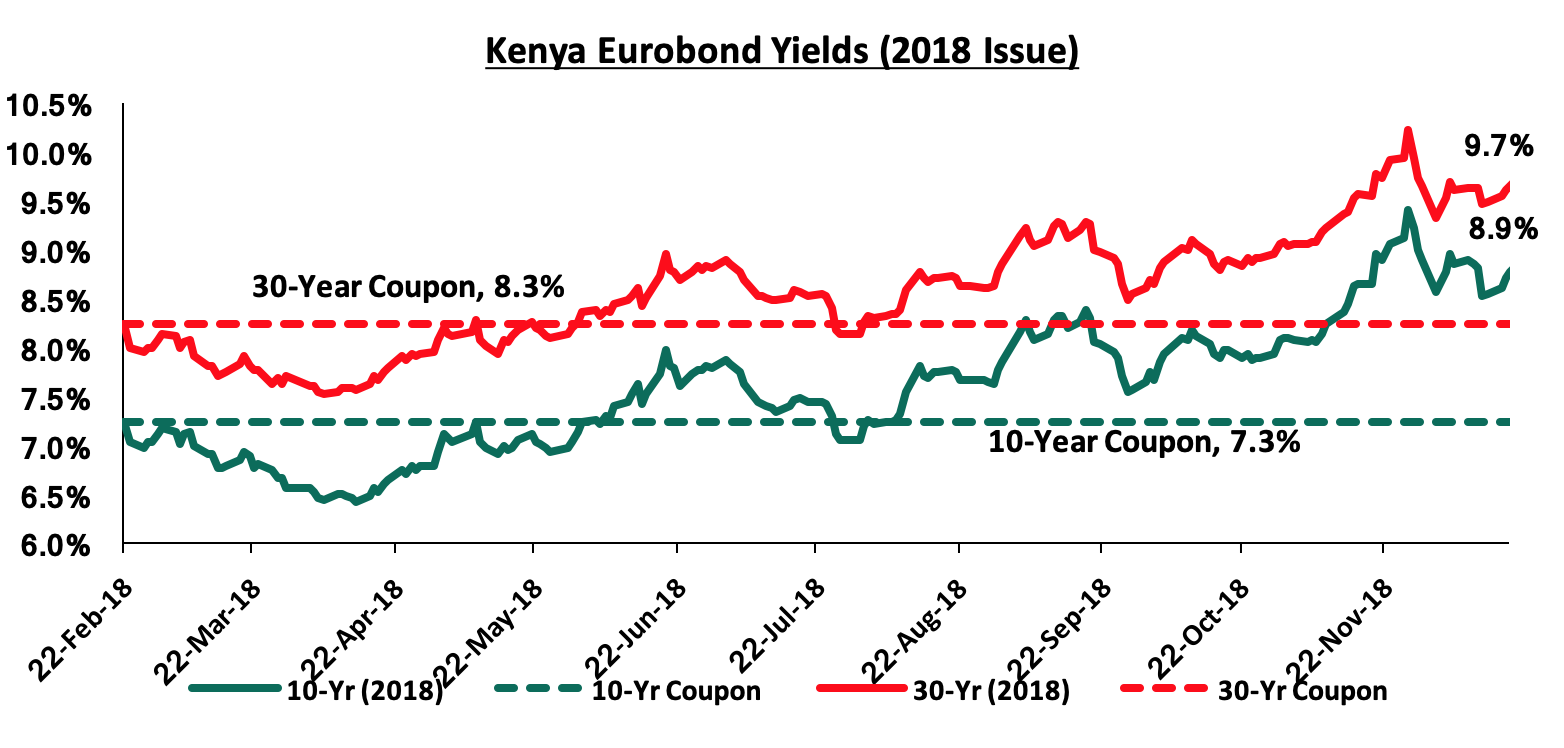
For the February 2018 Eurobond issue, the yields on the 10-year Eurobond and the 30-year Eurobond have increased by 1.7% points and 1.5% points to close the year at 8.9% and 9.7% from a yield of 7.3% and 8.3% when they were issued in February 2018, respectively.
Rates in the fixed income market have remained relatively stable despite the government being 30.3% behind its pro-rated domestic borrowing target for the current financial year, having borrowed Kshs 91.1 bn against a pro-rated target of Kshs 130.7 bn. The 2018/19 budget had given a domestic borrowing target of Kshs 271.9 bn, 8.6% lower than the 2017/2018 fiscal year’s target of Kshs 297.6 bn, which may result in reduced pressure on domestic borrowing. With the rate cap still in place, we maintain our expectation of stability in the interest rate environment. With the expectation of a relatively stable interest rate environment, our view is that investors should be biased towards medium-term fixed-income instruments
Market Performance
During the year, the Kenyan equities market was on a downward trend, with NASI, NSE 25 and NSE 20 declining by 18.0%, 17.1% and 23.7%, respectively. Since the peak in February 2015, NASI and NSE 20 are down 20.9% and 48.4%, respectively. The only large cap gainer during the year was Barclays Bank, which gained 14.1%, while the largest losers were East Africa Breweries (EABL), Bamburi Cement, Diamond Trust Bank (DTB), NIC Group and Safaricom, which lost 26.6%, 26.4%, 18.5%, 17.6% and 17.0% during the year, respectively. Key to note is that Safaricom continues to be a key part of Kenyan equities portfolios, accounting for 42.4% of Nairobi Stock Exchange (NSE’s) market capitalization, and has dominated on both the market turnover and in determining the direction of the market given its weight and liquidity in the Nairobi Securities Exchange.
Equity turnover during the year rose by 2.3% to USD 1,723.8 mn from USD 1,684.4 mn in FY’2017. Foreign investors turned net sellers with a net outflow of USD 425.6 mn compared to net outflows of USD 113.7 mn recorded in FY’2017. The foreign investor outflows during the year can be attributed to negative investor sentiment, as international investors exited the broader emerging markets due to the expectation of rising US interest rates, coupled with the strengthening US Dollar.
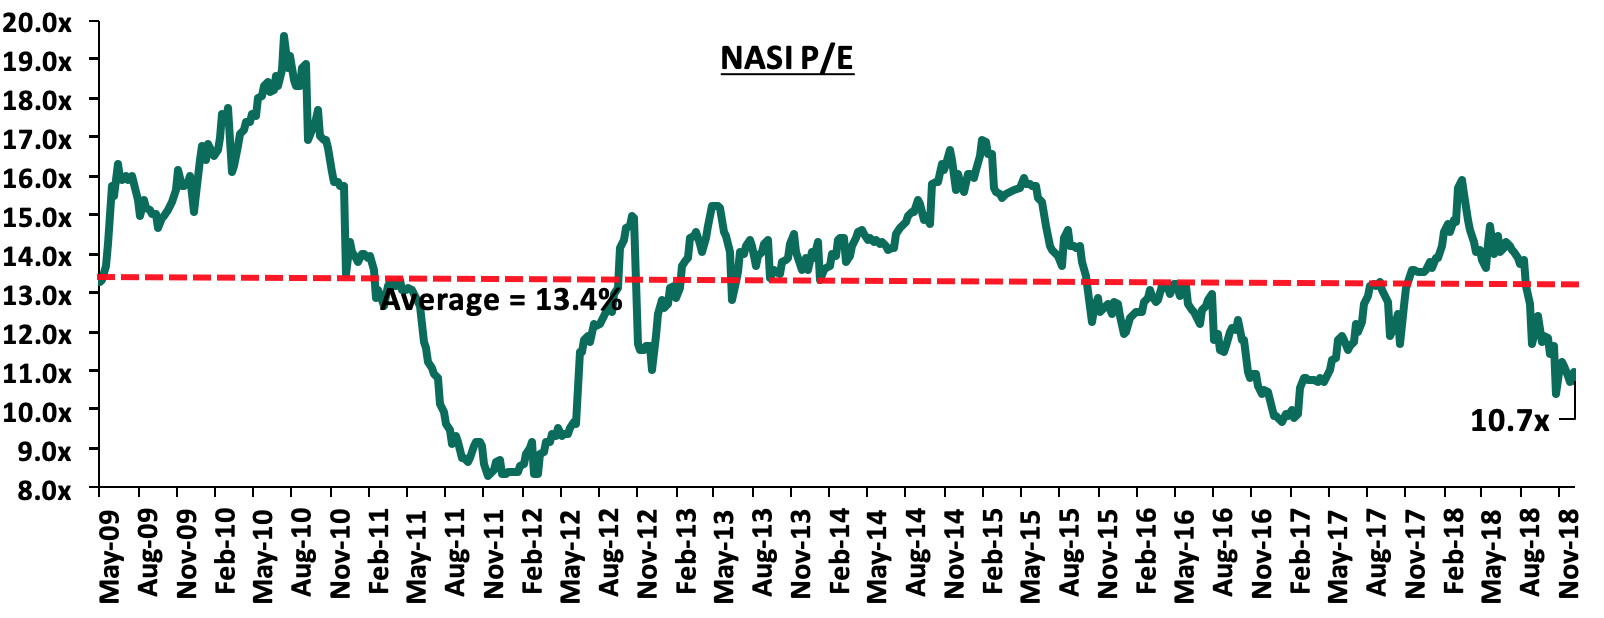
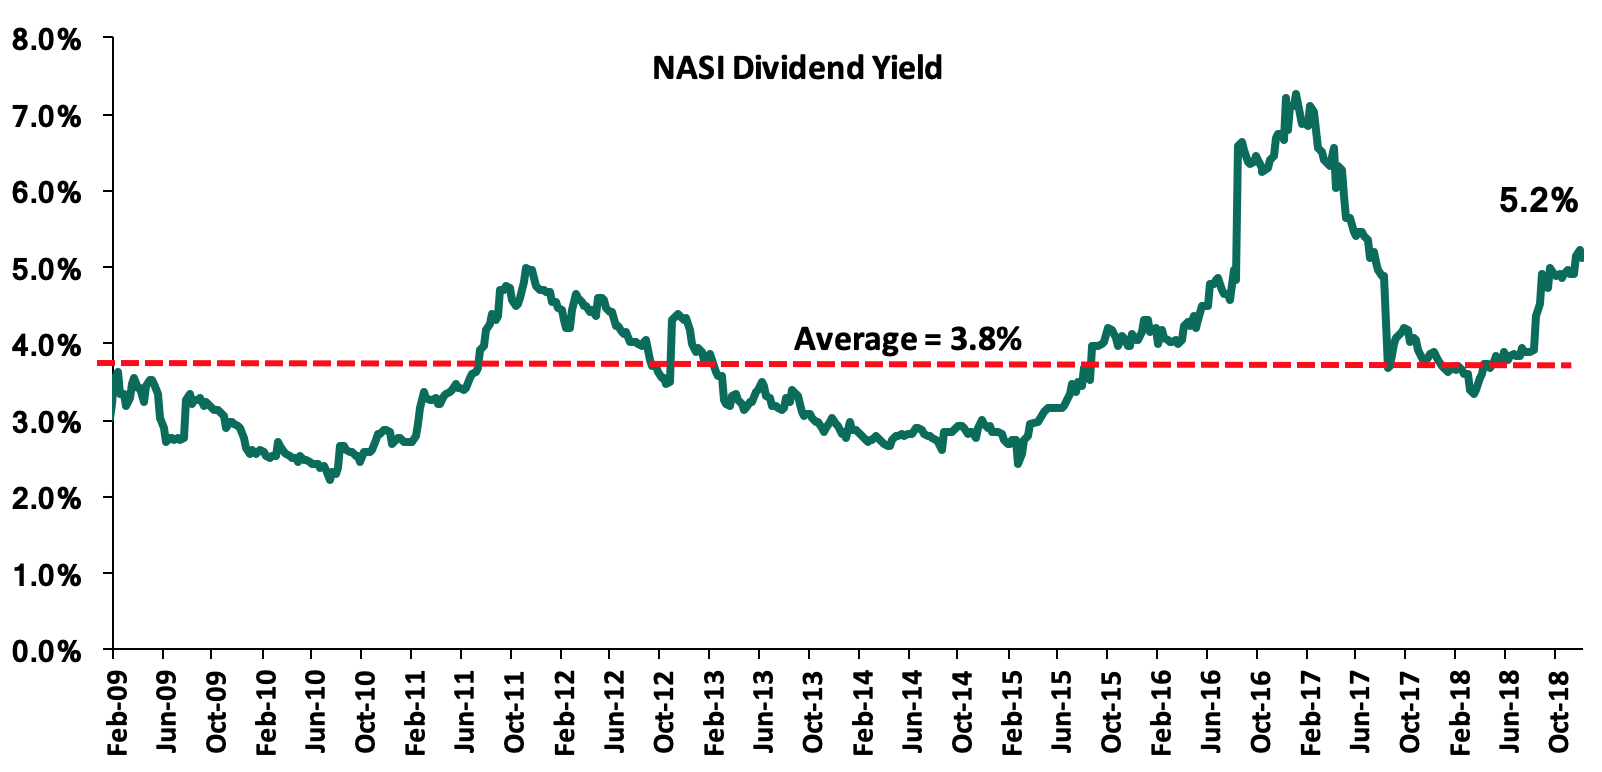
The market is currently trading at a price to earnings ratio (P/E) of 10.7x, 19.9% below the historical average of 13.4x, and a dividend yield of 5.2%, above the historical average of 3.8%. The current P/E valuation of 11.0x is 9.6% above the most recent trough valuation of 9.8x experienced in the first week of February 2017, and 29.2% above the previous trough valuation of 8.3x experienced in December 2011. The charts below indicate the historical P/E and dividend yields of the market.
Banking Sector Earnings
During the year, Kenyan listed banks released their Q3’2018 results recording an average increase in core earnings per share of 16.2%, compared to an average decline of 9.3% in Q3’2017, owing to the improved efficiency because of digitization strategies employed by banks in streamlining operations. Only NIC Group and HF Group recorded a decline in core earnings per share, with NIC reporting a 3.3% decline while HF Group recorded a loss per share of Kshs 0.9 from a core EPS of 0.5 in Q3’2017. The table below highlights the performance of the banking sector using several metrics, and the key take-outs of the performance. The table below highlights the performance of the banking sector, showing the performance using several metrics, and they the key take-outs of the performance.
|
Bank |
Core EPS Growth |
Interest Income Growth |
Interest Expense Growth |
Net Interest Income Growth |
Net Interest Margin |
Non-Funded Income (NFI) Growth |
NFI to Total Operating Income |
Growth in Total Fees & Commissions |
Deposit Growth |
Growth In Govt Securities |
CIR |
Loan Growth |
LDR |
Return on Average Equity |
|
NBK |
303.2% |
(10.5%) |
(11.5%) |
(10.0%) |
6.6% |
(16.3%) |
26.8% |
(18.7%) |
(4.7%) |
3.2% |
91.8% |
(17.1%) |
51.7% |
3.2% |
|
Stanbic Bank |
46.7% |
13.3% |
19.7% |
9.7% |
4.9% |
19.6% |
47.0% |
9.3% |
20.3% |
16.7% |
57.9% |
16.3% |
77.8% |
14.3% |
|
SCBK |
33.9% |
4.8% |
2.1% |
5.9% |
8.5% |
9.7% |
32.6% |
31.2% |
(8.0%) |
(6.1%) |
57.2% |
(2.8%) |
50.6% |
18.6% |
|
KCB Group |
19.7% |
5.1% |
16.0% |
1.8% |
8.5% |
2.6% |
33.1% |
(7.9%) |
6.2% |
15.3% |
52.8% |
3.8% |
82.6% |
21.7% |
|
I&M Holdings |
18.3% |
3.3% |
16.8% |
(4.9%) |
6.7% |
38.4% |
35.1% |
30.1% |
27.6% |
8.0% |
51.7% |
8.6% |
78.1% |
17.2% |
|
DTBK |
10.0% |
3.0% |
3.0% |
2.9% |
6.1% |
6.3% |
21.7% |
7.4% |
6.5% |
17.7% |
56.9% |
0.7% |
70.0% |
13.3% |
|
Co-op Bank |
8.2% |
3.5% |
0.7% |
4.7% |
8.3% |
4.3% |
32.7% |
(29.7%) |
2.5% |
16.9% |
55.1% |
(2.0%) |
85.9% |
17.6% |
|
Equity Group |
8.1% |
8.6% |
13.5% |
7.2% |
8.5% |
(6.7%) |
40.0% |
(1.7%) |
9.1% |
24.1% |
54.6% |
8.6% |
71.7% |
22.2% |
|
Barclays Bank |
2.0% |
7.7% |
30.1% |
2.1% |
9.1% |
14.0% |
30.8% |
5.5% |
9.9% |
29.5% |
65.9% |
6.7% |
81.0% |
16.5% |
|
NIC Group |
(3.3%) |
5.5% |
22.2% |
(5.9%) |
5.8% |
7.2% |
30.9% |
5.7% |
10.3% |
16.2% |
60.6% |
(3.1%) |
79.3% |
12.1% |
|
HF Group |
N/A |
(14.1%) |
(11.7%) |
(17.8%) |
4.6% |
(7.2%) |
25.0% |
(30.9%) |
3.1% |
429.5% |
113.5% |
(11.3%) |
90.7% |
(3.3%) |
|
Weighted Average Q3'2018* |
16.2% |
6.1% |
12.5% |
3.8% |
8.0% |
5.9% |
34.5% |
0.6% |
7.4% |
17.8% |
56.3% |
4.2% |
75.3% |
18.8% |
|
Weighted Average Q3'2017* |
(9.3%) |
(5.8%) |
(0.5%) |
(7.3%) |
8.5% |
10.9% |
33.3% |
10.5% |
13.8% |
10.3% |
59.4% |
6.1% |
77.7% |
17.5% |
*Market cap weighted as at 30th November 2018/2017 respectively
Key highlights from the table above include:
- Average deposit growth came in at 7.4%, weaker than the 13.8% growth recorded in Q3’2017. Despite the slower deposit growth, interest expenses increased by 12.5%, indicating banks have been mobilizing expensive deposits, as well as taking up borrowed funds from international financial institutions, thereby driving up the interest expense,
- Average loan growth was anemic at 4.2%, lower than 6.1% recorded in Q3’2017, indicating slower credit extension in the economy, due to sustained effects of the interest rate cap,
- Investment in government securities recorded a growth of 17.8% y/y, which was faster compared to the loan growth at 4.2%, and faster than 10.3% increase recorded in Q3’2017. This indicates that banks’ continued preference towards government securities, which offer better risk-adjusted returns,
- Non-funded Income grew by 5.9% y/y, slower than 10.9% recorded in Q3’2017. The growth in NFI was weighed down as total fee and commission growth was flat, growing by 0.6%, slower than the 10.5% growth recorded in Q3’2017. The growth in fee and commission income continued to be subdued by the slow loan growth, and,
- The average Net Interest Margin in the banking sector currently stands at 8.0%, down from the 8.5% recorded in Q3’2017, despite the Net Interest Income increasing by 3.8% y/y. The decline was mainly due to the faster 17.8% increase in allocation to relatively lower yielding government securities,
For a comprehensive analysis on the Kenya Listed Banks performance, see our Cytonn Q3’2018 Banking Sector Report
Other Key Results
Safaricom Limited released H1’2019 results, recording core earnings per share growth of 20.2% to Kshs 0.8 from Kshs 0.6 in H1’2018. The earnings growth was supported by a 7.7% growth in service revenue (M-PESA, messaging, mobile data and fixed service) to Kshs 118.2 bn from Kshs 109.7 bn in H1’2018 due to increased usage of non-voice services, particularly M-PESA services, coupled with a 3.5% decline in direct costs to Kshs 4.3 bn from Kshs 4.5 bn in H1’2018.
This year, 8 companies issued profit warnings to investors compared to 6 companies in 2017, despite the improving macro-economic environment in 2018. Companies are required to issue profit warnings if they project a more than 25% decline in profits year-on-year. They are namely Deacons, UAP Holdings, Bamburi, Sameer Africa, HF Group, Britam Holdings, KPLC and Sanlam:
- Bamburi attributed the shortfall in profits to difficult market conditions and escalating energy prices in Kenya and Uganda, as well as increasing costs of power in the country,
- UAP Holdings attributed the drop to dwindling investment income due to the poor performance of the equities market in H2’2018, coupled with low rental yields and occupancy rates on property in Kenya and South Sudan, leading to adverse valuations on property. The drop was also on the back of one-off redundancy costs associated with staff re-organisation efforts,
- Sameer Africa was affected by severe stock shortages due to production bottlenecks experienced by some its major offshore trading partners,
- In HF Group’s case, downward revisions of the Central Bank Rate (CBR) affected interest income, while a tough operating environment in 2017 occasioned a deterioration in asset quality, hence affecting business performance. The Group also undertook a redundancy exercise in tandem with implementation of its Digital Strategy, in which it incurred a one-off redundancy cost,
- Deacons, a fashion retailer, attributes its expected loss to reduced traffic to malls where 98% of its stores, due to non-performance of major anchor tenants such as Nakumatt, coupled with the loss of revenue arising from discontinued operations and diminished operating margins which have contributed to cash flow constraints,
- Britam’s expected decline is attributable to the downward equity markets trend that reduced returns from equity investments, and a challenging operating environment,
- KPLC attributed the expected decline in profits to a challenging economic environment, poor hydrological conditions and the protracted electioneering period in 2017,
- Sanlam attributes the expected decline in profits to the 100% impairment of Kshs 1.1 bn corporate bonds placed in currently distressed local enterprises as well as effects of the interest rate capping such as restricted access to bank credit
Listings, De-listings and Suspensions
On November 30, 2018, Rwandese firm BK Group Plc (Bank of Kigali) cross-listed its shares on the Nairobi Securities Exchange (NSE), becoming the first Rwandese company to tap into the Kenyan capital market. Established in 1966, BK Group is Rwanda’s largest lender in assets with operations across banking, insurance and investments. BK Group raised Kshs 7.0 bn from the exercise, which was to be used to capitalize subsidiaries in the bank’s expansion drive.
During the year, the Nairobi Securities Exchange (NSE) suspended the following companies from trading on the bourse:
- Deacons (East Africa), with the suspension period to last 40 days from November 19th 2018, following the invocation of the Insolvency Act as the company ran into financial distress, and,
- ARM Cement, effective August 30, 2018, following its placement under administration after it became insolvent and was unable to meet its obligations to creditors.
Legislations and other Developments
The year 2018 saw enactment of a number of legislations and other developments that affected the equities market and investor sentiment, namely:
- The National Assembly voted to retain the cap on loans in the Finance Act 2018, effectively retaining the 4.0% cap above the Central Bank Rate (CBR) on interest chargeable on loans. However, the 70.0% of the CBR floor on interest payable on deposits was scrapped, effectively enabling banks to reduce interest payable on customer deposits. With the removal of the same, banks have adjusted accordingly, with various players indicating a lowering of their interest expense requirements, and a possible improvement in the Net Interest Margin, whose benefits will be fully realized in 2019. Regulation in the sector centered on consumer protection and promoting prudence in the financial services sector,
- Draft Financial Markets Conduct Bill 2018: The National Treasury completed the Draft Financial Markets Conduct Bill that sought to create effective financial consumer protection, make credit more accessible and consequently support financial innovation and competition. The Bill’s main objectives thus are (i) to ensure better conduct by banks and other lenders in terms of extending credit to retail financial customers, and (ii) to provide consumer protection, mainly for retail customers by ensuring their credit contracts are clear and well understood in terms of interest, fees, charges and costs on credit facilities, thereby removing the opacity that has been existent in loan pricing. For more information, see our Draft Financial Markets Conduct Bill, 2018 Note ,
- Banking Sector Charter: The Central Bank of Kenya proposed to introduce a Banking Sector Charter that will guide service provision in the sector. The Charter aims to instill discipline in the banking sector in order to make it responsive to the needs of the banked population. It is expected to facilitate a market-driven transformation of the Kenyan banking sector, thereby considerably improving the quality of service provided, and increasing access to affordable financial services for the unbanked and under-served population,
- IFRS 9 Implementation: With the implementation of IFRS 9, which took effect from 1st January 2018, banks total capital position relative to their risk-weighted assets declined by an average of 0.4%. The implementation of IFRS 9 forced banks to review their business models, strategic objectives and credit policies. Thus, banks adopted stringent lending policies, and consequently skewed lending towards collateral based lending as opposed to unsecured lending. To avoid the high provisioning levels that would be required, banks unwillingness to lend to the private sector and more specifically to SMEs is likely to persist, and
- Large Cash Transactions Restrictions by Kenya Bankers Association: The KBA, in a circular, directed bank managers to ensure customers also provide supporting evidence for their source of cash when depositing and its use while withdrawing. Bank customers planning to withdraw or deposit Kshs 10.0 mn and above in cash will now be required to give a three-day notice and get clearance from their respective branch managers.
- The Nairobi Securities Exchange (NSE) launched Ibuka, an incubation and acceleration program aimed at addressing the recent lack of listings at the NSE. The program has attracted Expression of Interest from 13 companies including Tuskys Supermarket, while 10 other companies have shown a keen interest in participating. The program, in our view, is a great initiative that will go a long way in increasing the number of listings in the NSE as it will sensitize companies on the importance of listing and prepare them for the process.
- Kenya Commercial Bank (KCB) will acquire some prime Imperial Bank branches following a takeover of the collapsed lender’s loan book. Imperial Bank had 27 branches when it went into receivership. Financial details of the takeover are however yet to be made public. Depositors now have access to approximately 12.7% of deposit balances through KCB’s deposit recovery process, assisted by the Kenya Deposit Insurance Corporation (KDIC). Imperial Bank went in to receivership on October 13th, 2015, with Kshs 58.0 bn in customer deposits and 52,398 deposit accounts, and operations in Kenya and Uganda. We expect consolidation in the sector, as smaller banks with depleted capital positions and not serving a particular niche are acquired as their performance deteriorates due to the sustained effects of the Banking (Amendment) Act 2015.
In 2018, Kenya’s operating environment was characterized by improving macro-economic conditions owing to a recovery in agriculture due to improved rainfall as well as low inflation and improved investor confidence. However, despite the economic recovery in 2018, the market has slumped and brought the market P/E below its’ historical average of 13.4x to 10.7x, below the most recent peak of 15.9x in April, showing that pockets of value still exist. We remain neutral on equities for investors with short-term investment horizon, but are positive for investors with a long-term investment horizon.
During the year, private equity activity was high as evidenced by increased deal activity by local and global investors including Kuramo Capital, AfricInvest, and Goldman Sachs, among others. We highlight major Private Equity deals, Mergers and Acquisition, Quoted Private Equity and Fundraising deals under the Financial Services, Hospitality, Financial Technology (FinTech), Education, and Real Estate Sectors in 2018. We also highlight fundraising activities by Private Equity firms and key Private Equity reports in the year;
Financial Services Sector
Entry:
- Kuramo Capital, a New York based investment management firm focused on alternative investments in frontier and emerging markets acquired a stake of 90.9% in GenAfrica Asset Managers Ltd from the management and staff of GenAfrica Asset Managers and Centum Investments who held 17.5% and 73.4%, respectively. Kuramo earlier in the year also completed a transaction to acquire a minority stake in Kenyan investment bank, Sterling Capital, for an undisclosed amount. For more information, see our Cytonn Weekly #32/2018,
- Mauritius based SBM Holdings, a banking institution with headquarters in Port Louis, Mauritius, through its subsidiary SBM Kenya Limited, acquired certain assets and liabilities of Chase Bank. SBM Kenya, assumed 75% of the value of the deposits and took control of 62 branches and employees. SBM has injected Kshs 2.6 bn in Chase Bank and is planning to inject a further Kshs 6.0 bn to revive the bank. For more information, see our Cytonn Weekly #30/2018,
- AfricInvest, a private equity and venture capital firm based in Tunisia with a focus on agribusiness, financial services, healthcare, education and commercial sectors, completed a transaction to buy a 14.3% stake in Britam, a diversified financial services group that is listed on the Nairobi Securities Exchange, for Kshs 5.7 bn. For more information, see our Cytonn Weekly #21/2018. Following the transaction, Swiss Re, a reinsurance company based in Zurich, Switzerland, also acquired a 13.8% stake in Britam for Kshs 4.8 bn. For more information, see our Cytonn Weekly #24/2018,
- Old Mutual, a UK based international financial services group providing investment and savings, insurance, asset management and retirement solutions, increased its stake in UAP - Old Mutual Holdings from 60.7% to 66.7%, in a deal to purchase a 6.0% stake in UAP-Old Mutual for GBP 24.0 mn (Kshs 3.1 bn) from Chairman Joe Wanjui and Director James Muguiyi. For more information, see our Cytonn Weekly #32/2018,
- Badoer Investments Limited, a Dubai-based investment firm, bought a 15.6% stake in Sumac Microfinance Bank for Kshs 100.0 mn (USD 1.0 mn). For more information, see our Cytonn Weekly #29/2018,
- European financial services company Allianz Group agreed to acquire 8.0% in African reinsurer Africa Re for EUR 69.0 mn (Kshs 8.14 bn), effectively valuing the firm at Kshs 101.8 bn (EUR 862.5 mn). For more information, see our Cytonn Weekly #23/2018, Sanlam Kenya, a financial services company, invested an additional Kshs 121.7 mn in equity in Sanlam General, formally Gateway Insurance. The investment, however, left their ownership unchanged at 67.6% as the minority shareholders also made an additional investment of Kshs 66.5 mn. For more information, see our Cytonn Weekly #19/2018, and,
- Fonds Européen de Financement Solidaire (Fefisol), a Luxembourg-based private equity (PE) firm, invested Kshs 100.0 mn in Kenya’s Musoni Microfinance Limited for an undisclosed stake. For more information, see our Cytonn Weekly #7/2018
See below the summary of acquisitions in the Financial Services sector;
|
No. |
Entity Acquired |
Acquirer |
Investment Type |
Investment Stake |
Investment Amount (Kshs bns) |
Date |
|
1. |
Sterling Capital |
Kuramo Capital |
Equity |
Undisclosed |
Undisclosed |
Jan-18 |
|
2. |
Musoni Microfinance LTD |
Fonds Européen de Financement Solidaire (Fefisol) |
Equity |
Undisclosed |
0.1 |
Feb-18 |
|
3. |
GenAfrica Asset Managers |
Kuramo Capital |
Equity |
90.8% |
Undisclosed |
Mar-18 |
|
4. |
Africa Re |
Allianz Group |
Equity |
8.0% |
8.1 |
May-18 |
|
5. |
Britam |
AfricInvest |
Equity |
14.3% |
5.7 |
May-18 |
|
6. |
UAP-Old Mutual Holdings |
Old Mutual |
Equity |
6.0% |
3.1 |
Jun-18 |
|
7. |
Britam |
Swiss Re |
Equity |
13.8% |
4.8 |
Jun-18 |
|
8. |
Sanlam General |
Sanlam Kenya |
Rights Issue |
N/A |
0.10% |
Jun-18 |
|
9. |
Sumac Microfinance Bank |
Badoer Investments Limited |
Equity |
15.6% |
0.1 |
Jul-18 |
|
10. |
Chase Bank |
SBM Kenya Limited |
Equity |
Undisclosed |
Undisclosed |
Jul-18 |
Exit:
- Filimbi Limited, an investment vehicle owned by Peter Munga and Jane Njuguna, sold 39.5 mn shares of Britam Holdings, a diversified financial services group with operations in Kenya, Tanzania, South Sudan, Uganda, Rwanda, Malawi and Mozambique. This reduced its stake in the investment company to 18.9 mn shares, worth Kshs 187.5 mn, at the current market price of Kshs 9.9 per share and representing 7.8% of shareholding, from 58.4 mn shares held previously. For more information, see our Cytonn Weekly #39/2018, and,
- Centum Investments exited its 33.0% stake in Platcorp Holdings Limited, the holding company of Platinum Credit, in two transactions. The first 8.0%, through a partial exit to an undisclosed investor for Kshs 432.0 mn, and the remaining 25.0% to Suzerain Investment Holdings Limited, for an undisclosed amount. The divestment from Platcorp is set to earn Centum about Kshs 1.3 bn, based on the stakes valuation in their 2017 annual report, 62.5% above their initial investment of Kshs 0.8 bn in December 2012. For more information, see our Cytonn Weekly #12/2018.
See below the summary of exits in the Financial Services sector;
|
No. |
Entity Exited |
Exiting Investor |
Investment Stake |
Exit Amount (Kshs bns) |
Date |
|
1. |
Platcorp Holdings Limited |
Centum Investments |
33.0% |
1.3 |
Mar-18 |
|
2. |
Britam |
Filimbi Limited |
1.6% |
0.4 |
Aug-18 |
Fundraising
- Sumac Microfinance Bank raised Kshs 534.9 mn in 2018 through debt comprising of Kshs 204.9 from US-based Social Investment Managers & Advisors, Kshs 153.0 mn from Mexican fund manager Triple Jump, Kshs 102.0 mn from the Regional MSME Investment Fund for Sub-Saharan Africa, Kshs 45.0 mn from the Development Bank of Kenya and Kshs 30.0 mn from the Micro Enterprise Support Programme Trust. For more information, see our Cytonn Weekly #29/2018,
- Musoni, a Kenyan microfinance institution, issued out Kshs 2.0 bn in debt notes with a tenor of 2-3-years and offering investors a chance to roll over funds instead of cashing in at maturity. The issue of the debt notes is to take place in four tranches of Kshs 500.0 mn each. For more information, see our Cytonn Weekly #26/2018, and,
- TransCentury, a Kenyan-based investment firm, with a focus in infrastructure, rolled over USD 3.5 mn (Kshs 360.2 mn) worth of short-term loans by 1-year. The loan was taken from Kuramo Capital, a New York-based investment management firm focused on alternative investments in frontier and emerging markets. For more information, see our Cytonn Weekly #44/2018.
See below the summary of fundraising in the Financial Services sector;
|
No. |
Funded Entity |
Investor |
Form of Funding |
Amount (Kshs bns) |
Date |
|
1. |
Musoni Microfinance Ltd |
Various Investors through debt notes |
Debt |
2.0 |
Feb-18 |
|
2. |
TransCentury |
Kuramo |
Debt Rollover |
0.3 |
Nov-18 |
|
3. |
Sumac Microfinance Bank |
Social Investment Managers & Advisors, Triple Jump, Regional MSME Investment Fund, Development Bank of Kenya and Micro Enterprise Support Programme Trust |
Debt |
0.5 |
Dec-18 |
Investors have continued to show interest in the financial services sector in 2018, motivated by attractive valuations, growth of financial inclusion and regulation that requires institutions to increase their capital requirements across the sector.
Hospitality Sector
Entry:
- South-African based private equity fund Uqalo invested Kshs 404.0 mn (USD 4.0 mn) to acquire an undisclosed stake in Kenyan fast food chain Big Square. For more information, see our Cytonn Weekly #10/2018, and,
- Emerging Capital Partners (ECP), a US based private equity firm has acquired a majority stake in Artcaffé Group, a Kenyan based hospitality chain. The stake acquired as well as the amount were undisclosed. For more information, see our Cytonn Weekly #49/2018.
See below the summary of acquisitions in the Hospitality sector:
|
No.. |
Entity Acquired |
Acquirer |
Investment Type |
Investment Stake |
Investment Amount (Kshs bns) |
Date |
|
1. |
Big Square |
Uqalo |
Equity |
Undisclosed |
0.4 |
Mar-18 |
|
2. |
Artcaffé Group |
Emerging Capital Partners (ECP) |
Equity |
Undisclosed |
Undisclosed |
Dec-18 |
The increased interest by investors in the hospitality sector in Kenya in 2018 was supported by (i) the growing middle class with increasing disposable income, and (ii) the continued growth of the sector in the country in the past years. The food and services sector produced a total of Kshs 16.2 bn in Gross Income in 2016, a 4.5% increase from Kshs 15.5 bn recorded in 2015.
Fintech Sector
Fundraising:
- Jumo, an emerging market technology start-up that offers credit to individuals, small businesses and banks through their mobile application, raised a total of USD 64.5 mn (Kshs 6.6 bn) in equity investments 2018. The investments was from various investors comprising of USD 12.5 mn (Kshs 1.3 bn) from London based Odey Asset Management and USD 52.0 mn from Goldman Sachs, Proparco (the private sector financing arm of the French Development Agency AFD), Finnfund, Vostok Emerging Finance, Gemcorp Capital and LeapFrog Investments. For more information, see our Cytonn Weekly #49/2018,
- BitPesa, a Kenyan digital currency exchange and payments company, secured USD 5.0 mn (Kshs 512.8 mn) in funding from Sompo Holdings, a Japanese insurance group for an undisclosed stake. For more information, see our Cytonn Monthly - November,
- PayPal Holdings Inc, a California-based technology company that offers digital and mobile payments solutions to customers worldwide, made a strategic investment in Tala, a California based financial technology start-up that lends to underserved consumers in emerging markets, for an undisclosed amount. Tala’s also raised Kshs 6.5 bn (USD 64.8 mn) in Series C financing, comprised of Kshs 5.0 bn (USD 49.9 mn) in equity funding and Kshs 1.5 bn (USD 15.0 mn) debt, led by Revolution Growth. For more information see our Cytonn Weekly #16/2018,
- German investment firm, GreenTec Capital Partners, invested an undisclosed amount for an undisclosed stake in Bismart Insurance, a Kenyan insurance aggregator start-up. Bismart also received seed capital of Kshs 1.0 mn (USD 10,000.0) from Standard Chartered’s Women in Tech Program. For more information, see our Cytonn Weekly #28/2018,
- Branch International, a mobile-based microfinance institution headquartered in California, with operations in Kenya, Tanzania and Nigeria, raised Kshs 350.0 mn (USD 3.5 mn) in capital investment based on its second issued commercial paper in the Kenyan market. Branch International also raised USD 70.0 mn (Kshs 7.2 bn) in Series B funding, which combined USD 50.0 mn (Kshs 5.1 bn) in debt and USD 20.0 mn (Kshs 2.0 bn) in equity. California-based Trinity Ventures led the funding round. Other investors include CreditEase Fintech Investment Fund, Victory Park, IFC, and Andreessen Horowitz. For more information, see our Cytonn Weekly #27/2018,
- Cellulant, a leading Pan-African digital payments service provider that prompts, collects, settles and reconciles payments in real time, raised Kshs 4.8 bn (USD 47.5 mn) in Series C funding from a consortium of investors led by: Texas Pacific Group (TPG) and Satya Capital, for an undisclosed stake. For more information, see our Cytonn Weekly #20/2018,
- Africa’s Talking, a Kenyan based mobile tech company that provides a platform for businesses and developers to integrate mobile communication and payment services to their applications raised a total of Kshs 860.0 mn (USD 8.6 mn). The investment was from Orange Digital Ventures along with Social Capital who invested a combined Kshs 260.0 mn (USD 2.6 mn) and the International Finance Corporation (IFC) who invested Kshs 600 mn (USD 6.0 mn) for an undisclosed stake. For more information, see our Cytonn Weekly #17/2018, and,
- Lendable, a FinTech platform based in Kenya and the US, secured a Kshs 45.3 mn (USD 0.45 mn) convertible grant from the Dutch Government’s Micro and Small Enterprise Fund (MASSIF), managed by FMO, the Dutch Development Bank. For more information, see our Cytonn Monthly – August 2018.
See below the summary of fundraising in the Fintech sector;
|
No. |
Funded Entity |
Investor |
Form of Funding |
Investment Amount (Kshs bns) |
Date |
|
1. |
Tala |
Revolution Growth |
Equity and Debt |
6.5 |
Apr-18 |
|
2. |
Branch International |
Trinity Ventures, CreditEase Fintech Investment Fund, Victory Park, IFC, and Andreessen Horowitz |
Equity and Debt |
7.2 |
Apr-18 |
|
3. |
Africa’s Talking |
Orange Digital Ventures ,Social Capital and International Finance Corporation (IFC) |
Equity |
0.9 |
Apr-18 |
|
4. |
Cellulant |
Texas Pacific Group (TPG) and Satya Capital |
Equity |
4.8 |
May-18 |
|
5. |
Bitpesa |
Sompo Holdings |
Equity |
0.5 |
Jun-18 |
|
6. |
Bismart Insurance |
GreenTec Capital Partners |
Equity |
Undisclosed |
Jul-18 |
|
7. |
Branch International |
Commercial Paper |
Debt |
0.4 |
Jul-18 |
|
8. |
Lendable |
Netherlands Development Finance Company |
Convertible Debt |
0.05 |
Aug-18 |
|
9. |
Jumo |
Odey Asset Management, Goldman Sachs, Proparco, Finnfund, Vostok Emerging Finance, Gemcorp Capital and LeapFrog Investments |
Equity |
6.6 |
Sep-18 |
|
10. |
Tala |
Paypal |
Equity |
Undisclosed |
Oct-18 |
Fintech lending and Microfinance institutions in general have been a major attraction for investors in Kenya and Sub-Saharan Africa. Lack of access to finance is a major issue for entrepreneurs and MSMEs across Africa. According to the IMF, there are 44.2 mn MSMEs in Sub-Saharan Africa with a potential demand for USD 404.0 bn in financing. The current volume of financing in Sub-Saharan Africa is estimated at USD 70.0 bn signifying a huge financing gap of USD 331.0 bn. Microfinance institutions and Fintech companies aim to bridge this gap by offering convenient access to credit.
Education Sector
Entry:
- Fanisi Capital, a private equity and venture capital firm that focuses on healthcare, education, consumer goods, and agriculture, agreed to invest Kshs 400.0 mn in Kitengela International School (KISC), with an initial injection of Kshs 205.0 mn for an undisclosed stake. For more information, see our Cytonn Weekly #35/2018, and,
- Kenya Based Makini School Limited was acquired through a Joint Venture between Schole (Mauritius) Limited, a subsidiary of Schole Limited, which is a London-based education provider, Caerus Capital, a leading international education consultancy group, and Advtech Group for ZAR 184.2 mn (Kshs 1.5 bn) for a 100% stake. For more information, see our Cytonn Weekly #34/2018.
See below the summary of acquisitions in the Education sector;
|
Acquirer |
Entity Acquired |
Investment Type |
Investment Stake |
Investment Amount (Kshs bns) |
Date |
|
Schole Limited, Caerus Capital, and Advtech Group |
Makini School Limited |
Equity |
100.0% |
1.5 |
Apr-18 |
|
Fanisi Capital |
Kitengela International School (KISC) |
Equity |
Undisclosed |
0.4 |
Sep-18 |
Fundraising:
- UNICAF, the largest online higher education platform in Africa, announced a USD 28.0 mn (Kshs 2.9 bn) Series B financing. The new investment round is led by Goldman Sachs, with other participants in the round being existing investors, including the UK Government's Development Finance Institution, CDC Group, leading higher education fund, University Ventures, and the Educational Excellence Corporation Ltd (EDEX), the Founder of the University of Nicosia and UNICAF. For more information, see our Cytonn Weekly #45/2018, and,
- Dubai Investments, a private equity company listed on the Dubai Financial Market stock exchange, announced an investment of USD 20.0 mn (Kshs 2.0 bn) in the consortium set to build a chain of Sabis-branded private schools in Africa. The consortium was previously made up of Centum Investment Company, Investbridge Capital, and Sabis Education Network. Prior to the investment, 40.0% of the consortium was owned by Centum, 40% by Investbridge and 20.0% by Sabis. The value of the investment by each party and the new shareholding after the investment by Dubai Investments is undisclosed. The consortium, which is investing through the holding company Africa Crest Education (ACE). For more information, see our Cytonn Weekly #7/2018.
See below the summary of fundraising in the Education sector;
|
Funder |
Funded Entity |
Investment Type |
Investment Stake |
Investment Amount (Kshs bns) |
Date |
|
Dubai Investments |
Africa Crest Education (ACE) |
Equity |
Undisclosed |
2.0 |
Feb-18 |
|
Goldman Sachs, CDC Group, University Ventures, and Educational Excellence Corporation Ltd (EDEX), |
UNICAF |
Equity and Debt |
Undisclosed |
2.9 |
Nov-18 |
The increased interest in investment in the education sector in Sub-Saharan Africa, is motivated by (i) increasing demand for quality and affordable education, with the Gross Enrolment Ratio (GER) having doubled in the last 10-years to 8.5% in 2016 from 4.5% in 2006 according to a report, “The Business of Education in Africa” by Caerus Capital, and (ii) support, such as ease of approvals, offered to investors in the education sector by governments looking to meet Sustainable Development Goals (SDGs) targets of universal access to tertiary education.
Real Estate Sector
Entry:
- South African-based Vantage Capital, Africa’s largest mezzanine fund manager with funds in excess of Kshs 50.0 bn invested in projects across Africa, acquired an undisclosed stake in the Rosslyn Riviera Shopping Mall for USD 8.0 mn (Kshs 800.0 mn). The Kshs 2.9 bn mall located along Limuru Road sits on a 4.5-acre piece of land and measures approximately 116,000 SQFT. For more information, see our Cytonn Weekly #17/2018, and,
- UK headquartered construction and management consultant, Turner and Townsend, acquired a 79.5% majority stake in Kenyan based Mentor Management Limited (MML), a project management company, from private Equity firm Actis for an undisclosed amount. The management team of MML retained the minority stake. For more information, see our Cytonn Weekly #6/2018.
See below the summary of acquisitions in the Real Estate sector;
|
Acquirer |
Entity Acquired |
Investment Type |
Investment Stake |
Investment Amount (Kshs bns) |
Date |
|
Vantage Capital |
Rosslyn Riviera Shopping Mall |
Equity |
Undisclosed |
0.8 |
Apr-18 |
|
Turner and Townsend |
Mentor Management Limited |
Equity |
79.5% |
Undisclosed |
Sep-18 |
We expect that Investors will continue to show interest in Kenya’s real estate and construction industry, which is on the rise driven by (i) a high urbanization rate of 4.4% against the global average of 2.1%, leading to a rise in demand for housing, (ii) an expanding middle class with increased disposable income, with the country’s disposable income having increased to Kshs 8.1 tn in 2017 from Kshs 7.4 tn in 2016 as per Kenya National Bureau of Statistic’s Economic Survey 2018 (iii) Kenya’s housing deficit of approximately 2.0 mn units with an increasing annual shortfall of 200,000 units, and (iv) a better operating environment for developers, characterised by tax relief of 15.0% for developers developing more than 100 affordable housing units per annum.
Fundraising Activity by Private Equity Firms
- Ascent Capital, a private equity firm based in Kenya, is seeking to raise USD 120.0 mn (Kshs 12.3 bn) in its second fund, targeted to close in Q3’2019. The funds raised are expected to be invested in mid-size companies in the East African region, particularly Rwanda and Tanzania. Investors expected to invest in the fund include the European Investment Bank, with the EIB looking to inject USD 25.0 mn (Kshs 2.6 bn) into the fund. The fund is also looking to raise capital from Development Finance Institutions (DFI’s) and pension funds, who were among the biggest contributors in their first fund, which closed in 2015. For more information, see our Cytonn Weekly #48/2018,
- Catalyst Principal Partners, a Kenyan private equity firm specializing in growth, emerging growth, expansion, buyout, recapitalization, acquisition, replacement capital, and pre-IPO investments in medium-sized companies, raised USD 155.0 mn (Kshs 15.9 bn) in its second round of funding. The capital was mainly from local pension funds and international investors. The capital raised will target USD 7.5 mn - USD 22.5 mn range of investments, targeting companies in Kenya, Uganda, Tanzania, Ethiopia, Zambia, Rwanda and the Democratic Republic of Congo. For more information, see our Cytonn Weekly #43/2018,
- Centum Investment Group is seeking raise between Kshs 40.0 bn and Kshs 50.0 bn in a fresh private equity fund as the company aims to cut finance costs from expensive borrowings. On the fund, Kshs 30.0 bn to Kshs 35.0 bn of this amount will be sourced from high net worth individuals and institutions such as pension schemes, with the additional Kshs 10.0 bn to Kshs 15.0 bn coming from its internal revenue source. The fund will be largely deployed in mature cash generative businesses and marketable securities such as government securities and equities. For more information, see our Cytonn Monthly - November, and,
- AfricInvest, a leading Pan-African private equity firm with a focus on agribusiness, financial services, healthcare, education and commercial sectors, announced the second close of the Financial Inclusion Vehicle (FIVE), a platform for investing in financial services in Africa. The close brought in an aggregate commitment of EUR 31.0 mn (Kshs 3.6 bn), bringing the total commitments to EUR 61.0 mn (Kshs 7.1 bn), with the first close having brought in EUR 30.0 mn (Kshs 3.5 bn). The second close brought in Norfund (the Norwegian Development Finance Institution), IFU, (the Danish investment fund for investing in Developing Countries), and the Central Bank of Kenya Pension Fund. For more information, see our Cytonn Weekly #39/2018.
In terms of fundraising, Fintech ranked the highest both in deal activity and transaction value, having raised Kshs 27.0 bn of the total value of reported fundraising deals, which came in at Kshs 32.7 bn, with 10 transactions out of a total of 15 in the year.
|
2018 Private Equity Fundraising Activity by Sector |
||
|
Sector |
Funding Raised (Kshs bns) |
Entities Funded |
|
Fintech |
27.0 |
10 |
|
Financial Services |
2.8 |
3 |
|
Education |
4.9 |
2 |
|
Real Estate |
None Disclosed |
|
|
Hospitality |
None Disclosed |
|
|
Total |
34.7 |
15 |
Reports
- The African Private Equity and Venture Capital Association (AVCA) and PwC released a report on private equity-backed IPOs (exit of private equity firms from companies through means of an Initial Public Offer) in the African region. This study spanned a period of 8-years from 2010 to 2017, and sought to analyse the growing trend of companies that have had PE backed IPOs. In the period from 2010 to 2017, there was a total of 187 IPOs, with 28 in 2017, a 17.0% increase from the 24 IPOs in 2016. However, most IPOs in the region have been non-private equity backed, with private equity backed IPOs over the period constituting 14.3% of total IPOs, compared to an average of 39.0% and 36.0% for the United States and the United Kingdom, respectively. For more information, see our Cytonn Weekly #38/2018,
- Data released by the Retirement Benefits Authority (RBA) showed that investments in alternative assets by pension schemes in Kenya gained traction, with the inclusion of Private Equity & Venture Capital and REITs as separate classes in the regulations with Private Equity constituting 0.04% of the Kshs 1.2 tn total assets under management. Over one year to June 2018, pension funds increased their investments in Private Equity by 68.0% to Kshs 0.4 bn in June 2017 from Kshs 0.3 bn in June 2016. Over the six months to June 2018, pension funds’ investment in Private Equity grew by 31.3% to Kshs 0.4 bn in June 2018 from Kshs 0.3 bn in December 2017, with the number of pensions, which have invested in PE firms growing to thirteen from two in 2015. This highlights the growing appetite for investments in the Private Equity sector as investors seek higher returns. For more information, see our Cytonn Weekly #40/2018, and,
- African Private Equity and Venture Capital Association (AVCA) released the African Private Equity Data Tracker brief for H1’2018, which presents the African Continent’s private equity (‘PE’) activity for the first half of the year. According to the report, the total value of reported African private equity deals in H1’2018 was USD 0.9 bn, a 10.0% drop from USD 1.0 bn reported in H1’2017. In terms of the share of deal value, the utilities sector was the largest sector in H1’2018, coming in at USD 0.3 bn or 37.0% of total value of deals, up from only USD 30.0 mn (3.0% of total value of deals) in H1’2017. For more information, see our Cytonn Weekly #41/2018
Despite the recent slowdown in growth, we maintain a positive outlook on private equity investments in Africa as evidenced by the increasing investor interest, which is attributed to; (i) economic growth, which is projected to improve in Africa’s most developed PE markets, (ii) attractive valuations in Sub Saharan Africa’s private markets compared to its public markets, and (iii) attractive valuations in Sub Saharan Africa’s markets compared to global markets. Going forward, the increasing investor interest, stable macro-economic and political environment will continue to boost deal flow into African markets.
In 2018, the real estate sector recorded continued investment across all themes driven by;
- political stability following the conclusion of the electioneering period in Q1’2018,
- the continued positioning of Nairobi as a regional hub that has led to increased entry of multinationals creating demand for residential units, retail centres, commercial offices and hotels,
- the kicking off of the affordable housing initiative as part of the Kenyan Government’s Big 4 Agenda, which has gained momentum with the launching of projects such as the Pangani Estate in Nairobi, and,
- the improving macroeconomic environment, with the country’s GDP growing by 6.0% in Q3’2018, higher than the 4.7% recorded in Q3’2017.
In terms of performance, the sector recorded rental yields of 8.1%, in the commercial office, 9.0% in retail and 4.7% in residential, 8.0% in mixed use developments (MUDs) and 7.4% in serviced apartments, resulting to an average rental yield for the real estate market of 7.4%, compared to an average of 8.0% in 2017. Capital appreciation for existing properties came in at 3.8% in 2018, from 6.5% in 2017, resulting in an 11.2% real estate market return, compared to 14.1% in 2017, thus a 2.9% points decline. We attribute this to a decline in demand for property despite the growing supply, evidenced by the 3.0% decline in the residential sector occupancy rates, and the increased supply of mall space in the retail sector recording a growth of 4.8% y/y in Nairobi to 6.5 mn SQFT in 2018 from 6.2 mn SQFT in 2017. However, it is important to note that development returns for investment grade real estate is still estimated to be approximately 23.0% to 25.0% p.a.
|
Annual Real Estate Returns Summary Table, for Existing Properties |
|||
|
2017 |
2018 |
Change |
|
|
Average Rental Yield |
7.6% |
7.4% |
(0.2%) |
|
Average Capital Appreciation |
6.5% |
3.8% |
(2.7%) |
|
Total |
14.1% |
11.2% |
(2.9%) |
|
|||
Source: Cytonn Research
- Residential Sector - The sector recorded a decline in performance with average rental yields dropping marginally by 0.5% points, attributable to a decline in occupancy rates which reduced by 3.0% points on average, from 84.0% in 2017, to 81.0% in 2018, attributable to increased stock in the market against minimal uptake. Overall, apartments performed better than detached units, with average annual uptake of 26.6% compared to detached units’ 20.5%, and average returns of 11.4%, compared to detached units returns of 8.9%. This is attributable to the growth in demand for apartments due to their affordability especially as loans remain out of reach for a majority of aspiring homebuyers,
- Commercial Office Sector - The commercial office sector performance in Nairobi improved, albeit marginally, with the asking rents increasing by 1.3% from Kshs 101.0 per SQFT in 2017 to Kshs 102.3 per SQFT in 2018. The occupancy rates increased by 0.7% points from 82.6% in 2017 to 83.3% in 2018, resulting in 0.2% points increase in rental yields from 7.9% in 2017 to 8.1% in 2018. The slight improvement is attributed to the political stability that has led to increased economic activities and the continued positioning of Nairobi as a regional hub that has led to increased entry of multinationals,
- Retail Sector - The retail sector performance softened in 2018, with occupancy rates decreasing by 0.4% points from 80.3% in 2017 to 79.9% in 2018. The rents decreased by 3.8% from Kshs 185.3 per SQFT in 2017 to Kshs 178.2 per SQFT in 2018, resulting in a 0.6%-point decrease in rental yields from 9.6% in 2017 to 9.0% in 2018. The decline in performance is attributed to increased supply of mall space, growing by 4.8% y/y in Nairobi to 6.5mn SQFT in 2018 from 6.2mn SQFT in 2017 through the opening of malls such as the Waterfront in Karen and Signature Mall in Mlolongo, resulting in an oversupply of 2.0mn SQFT,
- Mixed Use Development Sector (MUD) - MUDs encompassing office, retail and residential themes recorded an average weighted rental yield of 8.0%, outperforming single themed real estate market average of 7.4%, hence, a viable investment suitable for developers and investors looking to diversify their real estate portfolio,
- Hospitality Sector - Serviced apartments recorded improved performance in 2018, with the average rental yield coming in at 7.4%, which is 2.1% points higher than 5.3% recorded in 2017, and this we attribute to the increased demand, which has triggered an increase in charge rates, as well as increased occupancy rates with an average of 80.0% in 2018, compared to 72.0% in 2017. We attribute the improved performance to the stable political environment and improved security, making Nairobi an ideal destination for both business and holiday travelers,
- Land Sector - The Nairobi Metropolitan Area land prices recorded a 7- year CAGR of 13.7%, and a 3.8% y/y price increase in 2018, driven mainly by (i) provision of trunk infrastructure such as road networks, and (ii) the growing demand for development land especially in the satellite towns such as Ruiru and Syokimau driven by their affordability compared to land in the urban areas,
- Infrastructure Sector - In 2018, the infrastructure sector recorded increased government investment. According to KNBS Economic Survey 2018, the total expenditure on roads has increased by 54.9% over a 4-year period to Kshs 198.4 bn in 2017/18, from Kshs 89.5 bn in 2013/14. The government continues to increase its investments in order to boost the country’s economic growth through: (i) revenue generation, (ii) increased employment opportunities, (iii) betterment of services and facilities, and (iv) improving the ease of doing business in Kenya, and,
- Statutory Reviews - During the year, several statutory reviews were made or proposed, all in line to promote efficiency in the property sector and to facilitate the government’s affordable housing agenda.
- Residential Sector
During the year, the residential sector saw increased focus towards the affordable housing initiative as part of the Big 4 Agenda. Out of the seven Nairobi Urban Regeneration Projects, Pangani Estate was launched towards end of the year. The project will see 1,000 units delivered to the market, and we expect other projects (listed below) to follow suit before the end of 2019.
|
The Nairobi Urban Redevelopment Plan |
||||
|
Estate |
Acreage |
Number of Units |
Contract Sum (Kshs) |
Developers |
|
Jevanjee |
7.6 |
1,500 |
9.1 bn |
Jabavu Village Ltd |
|
Ngong Road Phase I |
21.5 |
2,520 |
24.0 bn |
Erdemann |
|
Ngong Road Phase II |
Lordship Africa |
|||
|
New Ngara |
4.1 |
1,500 |
9.0 bn |
KCB |
|
*Pangani |
5.2 |
1,000 |
5.2 bn |
Technofin |
|
Uhuru Estates |
7.5 |
- |
3.5 bn |
Stanlib Group |
|
Old Ngara |
5.2 |
1,050 |
7.0 bn |
Kiewa Group |
|
Suna Road |
5.0 |
1,050 |
3.5 bn |
Directline Assurance Limited |
|
||||
Source: Online
The year witnessed more efforts towards delivering affordable housing, with policies and financing initiatives geared towards making it a reality. On construction, the value of approved residential buildings by the Nairobi City County took a downturn with the total value for the first ten months coming in at Kshs 105.3 bn, 16.7% lower than the Kshs 126.5 bn recorded for the first 10-months of 2017. The slowdown is attributed to several factors, including the uncertainty surrounding statutory approvals particularly in light of the ongoing demolitions of legally approved buildings and a slowdown in the overall spending power.
Performance
In terms of performance, the sector recorded a decline in performance with average rental yields dropping marginally by 0.5% points, attributable to a decline in occupancy rates, which reduced by 3.0% points from 84.0% in 2017 to 81.0% in 2018, attributable to increased stock in the market against minimal uptake. Overall, apartments performed better than detached units with average annual uptake of 26.6% compared to detached units’ 20.5%, and average returns of 11.4%, compared to detached units 8.9%. This is attributable to the growth in demand for apartments due to their affordability especially as loans remain out of reach for a majority of aspiring homebuyers.
|
Performance Summary Table |
||||
|
|
2016 |
2017 |
2018 |
Y/Y Change |
|
Annual Uptake |
25.5% |
26.3% |
22.8% |
(3.5%) |
|
Occupancy |
83.2% |
84.0% |
81.0% |
(3.0%) |
|
Rental Yield |
4.9% |
5.2% |
4.7% |
(0.5%) |
|
Price Appreciation |
7.9% |
5.1% |
4.2% |
(0.9%) |
|
Total Returns |
12.9% |
10.3% |
8.9% |
(1.4%) |
|
||||
Source: Cytonn Research
- Detached Units
- High-End
The high-end market registered average price appreciation of 2.9%, 1.3% points lower than the residential market average of 4.2%. This is attributable to increased supply and sluggish demand for the same evidenced by the relatively low annual uptake rate of 20.7%, in comparison to the residential market’s average of 22.8%.
(All Values in Kshs Unless Stated Otherwise)
|
Top 5: High-End |
|||||||
|
Row Labels |
Average Price per SQM |
Average Annual Uptake |
Average Rent per SQM |
Average Occupancy |
Average Rental Yield |
Average y/y Price Appreciation |
Average Total Returns |
|
Kitisuru |
184,097.5 |
834.9 |
22.0% |
71.7% |
4.8% |
4.1% |
8.9% |
|
Karen |
192,053.7 |
790.9 |
24.2% |
73.8% |
4.1% |
4.7% |
8.8% |
|
Runda |
211,486.5 |
810.5 |
19.8% |
57.7% |
2.9% |
5.5% |
8.4% |
|
Lower Kabete |
174,350.4 |
438.9 |
21.8% |
89.5% |
2.8% |
4.2% |
7.0% |
|
Roselyn |
175,737.1 |
754.7 |
15.9% |
71.3% |
3.3% |
(4.2%) |
(0.9%) |
|
Average |
187,545.0 |
726.0 |
20.7% |
72.8% |
3.6% |
2.9% |
6.4% |
|
|||||||
Source: Cytonn Research
- Upper Mid-End
The upper mid-end sector registered the lowest price appreciation in the market for detached units with 0.3%, in comparison to high-end and lower mid-end markets with 2.9% and 3.4%, respectively. This is attributable to the increased densification of majority of the areas such as Lavington, Loresho and Ridgeways, thus making detached units in these areas less appealing to homebuyers.
All values in Kshs Unless Stated Otherwise
|
Top 5: Upper Mid-End |
|||||||
|
Location |
Average Price per SQM |
Average Rent per SQM |
Average Annual Uptake |
Average Occupancy |
Average Rental Yield |
Average Price Appreciation |
Average Total Returns |
|
Runda Mumwe |
149,421.3 |
633.6 |
21.7% |
65.4% |
4.8% |
10.0% |
14.8% |
|
Lavington |
178,683.4 |
750.2 |
22.5% |
80.7% |
4.2% |
2.3% |
6.5% |
|
Ridgeways |
147,325.1 |
730.9 |
20.7% |
67.2% |
4.0% |
(0.9%) |
3.1% |
|
Loresho |
147,536.1 |
612.7 |
20.1% |
83.5% |
4.1% |
(1.6%) |
2.5% |
|
Lang’ata |
171,812.3 |
728.4 |
19.7% |
75.0% |
5.7% |
(8.0%) |
(2.3%) |
|
Average |
158,955.6 |
691.2 |
20.9% |
74.3% |
4.6% |
0.3% |
4.9% |
|
|||||||
Source: Cytonn Research
- Lower Mid-End
The lower mid-end segment registered the highest total returns for detached units with 7.9% on average, attributable to the constantly growing demand for affordable housing units. Juja and Ngong had the highest average total returns with 10.3% and 8.1%, respectively. This is as the areas are increasingly attracting investors due to availability for land for development, which boosts demand for properties due to affordability.
All values in Kshs Unless Stated Otherwise
|
Top 5: Lower Mid-End |
|||||||
|
Location |
Average Price per SQM |
Average Rent per SQM |
Average Uptake |
Average Occupancy |
Average Rental Yield |
Average y/y Price Appreciation |
Average Total Returns |
|
Juja |
54,239.8 |
241.1 |
20.4% |
61.9% |
4.7% |
5.6% |
10.3% |
|
Ngong |
66,161.7 |
238.7 |
21.8% |
81.0% |
5.2% |
2.9% |
8.1% |
|
Ruiru |
85,750.1 |
360.0 |
19.0% |
94.2% |
4.7% |
3.1% |
7.8% |
|
Athi River |
94,665.2 |
317.8 |
20.7% |
72.2% |
3.7% |
3.0% |
6.7% |
|
Donholm & Komarock |
88,233.0 |
352.4 |
19.8% |
64.1% |
4.3% |
2.1% |
6.4% |
|
Average |
77,810.0 |
302.0 |
20.3% |
74.7% |
4.5% |
3.4% |
7.9% |
|
|||||||
Source: Cytonn Research
- Apartments
- Upper Mid-End
The upper mid-end segment notably registered the highest annual uptake with 26.6% and average occupancy rates of 89.3% in comparison to the residential market average of 22.8% and 81.0%, respectively. This is as middle-income neighborhoods such as Westlands and Kilimani continue to attract demand from the increasingly growing middle income class.
(All Values in Kshs Unless Stated Otherwise)
|
Top 5: Upper Mid-End |
|||||||
|
Row Labels |
Average Price per SQM |
Average Rent per SQM |
Average of Annual Uptake |
Average Occupancy |
Average Rental Yield |
Average Price Appreciation |
Average Total Returns |
|
Riverside |
175,085.2 |
763.8 |
24.7% |
88.9% |
4.4% |
7.1% |
11.6% |
|
Kilimani |
127,423.8 |
721.8 |
29.7% |
90.3% |
5.7% |
5.7% |
11.5% |
|
Westlands |
135,041.3 |
757.5 |
27.9% |
87.5% |
5.7% |
4.7% |
10.3% |
|
Loresho |
115,289.5 |
573.5 |
24.0% |
90.4% |
5.4% |
4.8% |
10.3% |
|
Spring Valley |
147,453.1 |
552.9 |
22.5% |
63.6% |
3.4% |
6.5% |
9.9% |
|
Average |
138,209.9 |
704.2 |
26.6% |
89.3% |
5.3% |
5.6% |
10.9% |
|
|||||||
Source: Cytonn Research
- Lower Mid-End
The lower mid-end segment registered higher average rental yields with 6.8% in comparison to the upper mid-end segment with 5.6%. This is as the areas are preferable to majority of Nairobi’s population consisting of young families and the working-class due to their affordability and infrastructural improvements that have rendered them increasingly convenient, hence the growing uptake. Donholm and Ruaka had the highest occupancy rates at 100.0% and 95.6%, respectively, indicating high levels of demand.
(All Values in Kshs Unless Stated Otherwise)
|
Top 5: Lower Mid-End |
||||||||
|
Location |
Average Price per SQM |
Average Rent per SQM |
Average Annual Uptake |
Average Occupancy |
Average Rental Yield |
Average Price Appreciation |
Average Total Returns |
|
|
Donholm & Komarock |
81,015.5 |
402.1 |
25.0% |
100.0% |
6.0% |
8.4% |
14.4% |
|
|
Thindigua |
97,510.2 |
502.5 |
24.6% |
81.9% |
4.1% |
9.6% |
13.8% |
|
|
Ruaka |
96,606.2 |
444.8 |
23.3% |
95.6% |
5.3% |
6.4% |
11.7% |
|
|
Athi River |
68,490.1 |
359.3 |
23.6% |
73.1% |
4.4% |
6.2% |
10.6% |
|
|
Rongai |
59,695.5 |
345.2 |
20.3% |
83.3% |
5.5% |
3.6% |
9.1% |
|
|
Average |
80,663.5 |
410.8 |
23.4% |
86.8% |
5.1% |
6.8% |
11.9% |
|
|
||||||||
The sector recorded a decline in both activity and performance during the year and thus the investment opportunity is in select areas that offer high and stable returns such as Runda Mumwe for detached units, Kilimani for upper mid-end apartments, and Donholm/Komarock, Thindigua for lower mid-end apartments.Source: Cytonn Research
Notable projects in the upper mid-end markets launched during the year are as shown below:
|
Upper Mid-End and High-End Projects Launched in 2018 |
|||
|
Developer |
Location |
Acreage |
No. of Units |
|
Hass Consult |
Redhill |
22 |
450 |
|
Capitaland |
Mang'u Juja |
25 |
1,500 |
|
Centum Investments |
Two Rivers |
- |
196 |
|
Krishna Estates Limited |
Thindigua |
2 |
224 |
|
Cool Breeze Limited |
Mombasa Road |
2.3 |
524 |
|
Erdemann Developers Ltd |
Ngara Estate |
5.7 |
1,632 |
|
CIC Group |
Ruiru – Kamiti Road |
90 |
417 |
|
Lordship Africa |
Upperhill |
0.8 |
239 |
|
Total |
5,182 |
||
Generally, we expect the current performance of the sector to persist in 2019 with certain areas in the upper mid-end and lower mid-end segments that continue to exhibit growing demand from homebuyers offering investors double digit returns.
- Commercial Real Estate Sector
In 2018, the commercial real estate sector recorded mixed performance with commercial office spaces recording a 0.2% points y/y increase in rental yield attributed to an improved macroeconomic environment, hence boosting economic activities, while the retail sector, recorded 0.6% points decline in rental yields as a result of retail space oversupply, currently at 2.0 mn SQFT. The sector however has pockets of value in differentiated concepts such as Mixed-Use Developments (MUD) with the right balance between the incorporated uses in order to achieve optimal returns. Below is a summary of commercial office, retail and MUD themes:
- Commercial Offices
In 2018, the commercial office sector recorded an improvement in performance recording 0.2% points and 0.7% points y/y increase in average rental yields and occupancy rates, to 8.1% and 83.3% from 7.9% and 82.6%, respectively, in 2017. The positive performance is largely driven by:
- Political stability that has led to increased economic activities,
- The positioning of Nairobi as a regional hub and thus increased entrance of multinationals such as French Based Pharmaceutical firm Sanofi that opened its regional office in Nairobi, AA Japan, a Japanese used vehicle auto dealer that set up its first office in the city in 2018, and Nippon Express, a Japanese logistics firms that opened its first African office in Nairobi in 2018, thus increasing demand for office space, and,
- Improving macroeconomic environment, with the GDP growing at 6.0% in Q3’2018, higher than the 4.7% recorded in Q3’2017, and expected to close at 5.6% for the year 2018.
Asking rents increased marginally by 1.3% to an average of Kshs 102.3 per SQFT from Kshs 101.0 per SQFT in 2017, while asking prices dropped by 0.6% to Kshs 12,573 in 2018 from Kshs 12,649 in 2017. We attribute the slow rise in rents and the drop in prices to the oversupply of 4.7 mn SQFT office space as at 2017, as per Cytonn Commercial Office Report 2018, which has created a bargaining chip for firms forcing developers to reduce or maintain prices and rents in order to remain competitive and attract occupants to their office spaces.
The table below highlights the performance of the commercial office sector in Nairobi over time:
All values in Kshs unless stated otherwise
|
Summary of Commercial Office Returns in Nairobi Over Time |
||||||
|
Year |
*FY’15 |
*FY’16 |
*FY’17 |
FY’18 |
∆ Y/Y 2016/17 |
∆ Y/Y 2017/18 |
|
Occupancy (%) |
89.0% |
88.0% |
82.6% |
83.3% |
(5.4%) points |
0.7% points |
|
Asking Rents (Kshs/Sqft) |
97 |
103 |
101 |
102 |
(1.9%) |
1.3% |
|
Average Prices (Kshs/Sqft) |
12,776 |
13,003 |
12,649 |
12,573 |
(2.7%) |
(0.6%) |
|
Average Rental Yields (%) |
8.1% |
8.4% |
7.9% |
8.1% |
(0.5%) points |
0.2% points |
|
*Restated rental yields including average market occupancy rates for FY’15, FY’16, and FY’17. The average rental yield for offices published in our previous reports assumed 100% occupancy rates
|
||||||
Source: Cytonn Research 2018
In terms of submarket analysis in Nairobi, Gigiri, Karen and Westlands were the best performing nodes in 2018 as a result of their superior locations hosting multinational companies and offering quality Grade A offices, enabling them to charge premium on rentals. These areas attracted yields of 10.5%, 9.2% and 9.0%, respectively. Thika Road and Mombasa Road had the lowest returns recording average rental yields of 6.7% and 5.8%, respectively. This is attributable to poor quality offices, which are mostly Grade Cs, and poor location characterized by traffic jam that have made these areas unattractive to firms.
All values in Kshs unless stated otherwise
|
Nairobi Commercial Office Submarket Performance 2017-2018 |
|||||||||||
|
Location |
Price Kshs/ SQFT FY 2018 |
Rent Kshs/SQFT FY 2018 |
Occupancy FY 2018(%) |
Rental Yield (%) FY 2018 |
Price Kshs/ SQFT FY 2017 |
Rent Kshs/SQFT FY 2017 |
Occupancy FY 2017(%) |
Restated Rental Yield (%) FY 2017 |
∆ in Rent Y/Y |
∆ in Occupancy Y/Y (% points) |
∆ in Rental Yields Y/Y (% points) |
|
Gigiri |
13,833.3 |
141.0 |
88.3% |
10.5% |
13,750.0 |
138.3 |
81.4% |
9.8% |
1.9% |
6.9% |
0.7% |
|
Karen |
13,666.0 |
118.0 |
88.6% |
9.2% |
13,167.0 |
113.0 |
89.2% |
9.2% |
4.4% |
(0.6%) |
0.0% |
|
Westlands |
12,050.0 |
109.7 |
82.1% |
9.0% |
12,872.0 |
103.0 |
88.5% |
8.5% |
6.5% |
(6.4%) |
0.5% |
|
Parklands |
12,493.8 |
102.1 |
86.0% |
8.4% |
12,729.0 |
103.0 |
85.7% |
8.3% |
(0.9%) |
0.3% |
0.0% |
|
Kilimani |
13,525.2 |
98.9 |
88.3% |
8.0% |
12,901.0 |
101.0 |
84.5% |
7.9% |
(2.1%) |
3.8% |
0.1% |
|
Upperhill |
12,559.5 |
99.8 |
80.7% |
7.9% |
12,995.0 |
99.0 |
82.0% |
7.5% |
0.8% |
(1.3%) |
0.4% |
|
Nairobi CBD |
12,424.8 |
88.8 |
88.3% |
7.6% |
12,286.0 |
88.0 |
84.1% |
7.2% |
0.9% |
4.2% |
0.4% |
|
Thika Road |
12,516.7 |
86.3 |
81.5% |
6.7% |
11,500.0 |
82.0 |
73.6% |
6.3% |
5.3% |
7.9% |
0.4% |
|
Msa Road |
11,400.0 |
78.8 |
65.6% |
5.8% |
11,641.0 |
82.0 |
74.2% |
6.3% |
(4.0%) |
(8.6%) |
(0.5%) |
|
Average |
12,572.9 |
102.3 |
83.3% |
8.1% |
12,649.0 |
101.0 |
82.6% |
7.9% |
1.3% |
0.7% |
0.2% |
|
*Restated rental yields including average market occupancy rates for FY 2017. The average rental yield for offices published in our previous reports assumed 100% occupancy rate |
|||||||||||
|
|||||||||||
|
|||||||||||
|
|||||||||||
Source: Cytonn Research 2018
The main highlights for the commercial office sector for 2018 include the opening of Prism Towers, a 33–storey building of 133m in height in Upperhill, developed by Kings Developers Ltd with a total of 250,000 SQFT of lettable office space. The Federation of Kenya Employers (FKE) and Zamara Umbrella Solutions, a retirement and benefit fund, announced of plans to build an 8-storey office building in Upper Hill and, a 16 and 30 floor twin tower in Westlands, respectively. The supply of office space is expected to continue increasing in the next 5-years with various office blocks under construction such as Garden City Business Park along Thika Road, Global Trade Centre in Westlands and Pinnacle Towers in Upperhill.
We remain cautiously optimistic on the performance of commercial office space in Nairobi, this is as despite the marginal increase in returns, and occupancy, the sector has an oversupply of 4.7mn SQFT, and thus investors are likely to face challenges on exit, when selling and renting. We are of the opinion that investments in the commercial office space should be aimed towards long term gains as we anticipate the current stock in the market will be taken up in the next 3 to 5-years. We however recommend investments in differentiated concepts such as serviced offices, which have low supply with a market share of just 0.35% of commercial office stock and high returns with average rental yields of 13.4%, compared to a market average of 8.1%.
- Retail Sector
The Nairobi Metropolitan Area retail market softened in 2018, recording average rental yields of 9.0% from 9.6% in 2017 and average occupancy rates of 79.8% from 80.3% in 2017. The decline in performance is attributed to:
- Increased supply of mall space, growing by 4.8% y/y in Nairobi to 6.5 mn SQFT in 2018 from 6.2 mn SQFT in 2017 through the opening of malls such as the Waterfront in Karen and Signature Mall in Mlolongo - with an oversupply of 2.0 mn SQFT, and,
- Tough operating environment characterized by low private sector credit growth, which averaged at 4.4% as at October 2018, compared to a 5-year average of 14.0% (2013-2018).
The performance of the retail sector in Nairobi over time is as shown below;
All values in Kshs unless stated otherwise
|
Retail Sector Performance 2016-2018 |
|||||
|
Item |
2016 |
2017 |
2018 |
∆ Y/Y 2017 |
∆ Y/Y 2018 |
|
Average Asking Rents (Kshs/SQFT) |
186.9 |
185.3 |
178.2 |
(0.9%) |
(3.8%) |
|
Average Occupancy (%) |
89.3% |
80.3% |
79.8% |
(9.0%) points |
(0.4%) points |
|
Average Rental Yields |
10.0% |
9.6% |
9.0% |
(0.4%) points |
(0.6%) points |
|
|||||
Source: Cytonn Research 2018
In terms of submarket analysis in Nairobi, Westlands, Karen and Kilimani were the best performing retail suburbs with average rental yields of 12.2%, 11.0% and 10.7%, respectively, as a result of being affluent neighborhoods with high consumer purchasing power and thus investors are willing to pay higher rents for retail space in the area. The worst performing nodes are the Nairobi Satellite Towns and Eastland’s recording average rental yields of 6.7% and 6.8%, respectively, attributable to low rental charges as a result of competition from informal retail space. Ngong Road, Nairobi Eastland’s and Kilimani, recorded the largest increase in rental yields y/y of 1.0%, 0.7% and 0.4% points, respectively, attributable to a 7.0%, 3.1% and 10.0% points increase in occupancy levels, for Ngong Road, Nairobi Eastland’s and Kilimani, respectively. The increase in occupancy rates is attributable to prudent methods employed by developers, such as targeting international retailers as anchor tenants, these include; Carrefour, The Game and Shoprite. Kiambu Road, Westlands and Nairobi Satellite Towns, recorded the largest y/y decline in rental yields of 2.4%, 1.3% and 0.9% points, respectively, attributable to a 40,000-SQFT, 232,340-SQFT and 134,760-SQFT increase in retail space supply.
All values in Kshs unless stated otherwise
|
Summary of Nairobi’s Retail Market Performance 2017-2018 |
|||||||||
|
Location |
Rent Kshs/SQFT 2018 |
Occupancy Rate 2018 |
Rental Yield 2018 |
Rent Kshs/SQFT 2017 |
Occupancy Rate 2017 |
Rental Yield 2017 |
∆ Y/Y in Rental Charges |
∆ Y/Y in Occupancy Rates (%points) |
∆ Y/Y in Rental Yields (% points) |
|
Westlands |
219.2 |
88.2% |
12.2% |
234.7 |
91.0% |
13.5% |
(6.6%) |
(2.8%) |
(1.3%) |
|
Karen |
224.9 |
88.8% |
11.0% |
206.2 |
96.3% |
11.2% |
9.1% |
(7.6%) |
(0.3%) |
|
Kilimani |
167.1 |
97.0% |
10.7% |
181.0 |
87.0% |
10.3% |
(7.7%) |
10.0% |
0.4% |
|
Ngong Road |
175.4 |
88.8% |
9.7% |
170.7 |
81.8% |
8.7% |
2.7% |
7.0% |
1.0% |
|
Thika road |
177.3 |
75.5% |
8.3% |
199.2 |
75.3% |
8.7% |
(11.0%) |
0.3% |
(0.4%) |
|
Kiambu Road |
182.8 |
69.5% |
8.1% |
216.1 |
78.2% |
10.6% |
(15.4%) |
(8.7%) |
(2.4%) |
|
Mombasa road |
161.5 |
72.4% |
7.9% |
180.4 |
68.8% |
8.3% |
(10.4%) |
3.7% |
(0.5%) |
|
Eastland’s |
153.3 |
64.8% |
6.8% |
148.9 |
61.8% |
6.1% |
3.0% |
3.1% |
0.7% |
|
Satellite Towns |
142.1 |
73.7% |
6.7% |
130.1 |
82.5% |
7.7% |
9.2% |
(8.8%) |
(0.9%) |
|
Average |
178.2 |
79.8% |
9.0% |
185.3 |
80.3% |
9.6% |
(3.8%) |
(0.4%) |
(0.6%) |
|
|||||||||
|
|||||||||
|
|||||||||
|
|||||||||
Source: Cytonn Research 2018
The main highlights for the retail sector for 2018 include;
- Signature mall in Mlolongo and the Waterfront mall in Karen formally opened their doors, with both malls adding 240,000 sqft and 250,000 sqft of space to the sector, respectively,
- Entry of the international retailers into the Kenyan market that included South African retailer, Shoprite, Spanish fashion house Mango and German fashion house Hugo Boss opening stores at the Westgate Mall in Westlands, Nairobi, and
- The expansion strategies by local retailers such as Naivas Supermarket opening 3 shops at Mwembe Tayari Mall, Freedom Height Mall in Lang’ata and Kitengela bringing the total stores in Kenya to 46 and Java house opening 2 restaurants at Engen service station in Parklands & at Shell service station in Lavington, bringing its total stores in Kenya to 62.
We expect reduced development activity of malls supply in 2019 due to the current oversupply of 2.0mn SQFT. However, our outlook for the sector is positive as the sector continues to attract both local and international retailers driven by (i) a conducive macro-economic environment, with an average GDP growth of above 5.0% over the last 5-years and (ii) a low retail penetration rate of 35.0% that serves as an incentive for formal retailers.
- Mixed Use Development (MUD) Sector
MUDs encompassing office, retail and residential themes recorded an average rental yield of 8.0% in 2018. MUDs in the Limuru Road and Karen nodes are the best performing, recording a rental yield of 9.6% and 9.4%, respectively. The performance is attributable to the fact that these developments are located in high-end neighbourhoods (Karen, Runda, Rosslyn, Kitisuru, among others) hosting Nairobi’s middle-end and high-end population, with higher purchasing power and who are thus willing to pay a premium for class and amenities provided. Areas characterized by traffic congestion and a low-income population with low purchasing power such as Mombasa road and Eastland’s, are the worst performing nodes recording average rental yields of 5.7% and 5.4%, respectively. For more details see our Nairobi Metropolitan Area Mixed Use Developments Report-2018.
The performance of the key nodes in the Nairobi Metropolitan Area is as summarized below:
All values in Kshs unless stated otherwise
|
Nairobi’s Mixed-Use Developments Market Performance by Nodes 2018 |
||||||||||||||||
|
Development Composition % |
Retail Performance |
Office Performance |
Residential Performance |
|||||||||||||
|
Location |
Retail % |
Office % |
Resi. % |
Price Kshs / SQFT |
Rent Kshs /SQFT |
Occup. (%) |
Rental Yield (%) |
Price Kshs / SQFT |
Rent Kshs/SQFT |
Occup. %) |
Rental Yield (%) |
Price Kshs /SQM |
Rent Kshs /SQM |
AnnualUptake % |
Rental Yield % |
Average MUD yield |
|
Limuru Rd |
60.0% |
20.0% |
19.0% |
23,975.0 |
277.0 |
80.0% |
11.1% |
13,500.0 |
103.0 |
70.0% |
6.4% |
177,935 |
1,259 |
25.0% |
8.5% |
9.6% |
|
Karen |
51.0% |
48.0% |
5.0% |
23,333.0 |
186.0 |
99.0% |
9.4% |
13,409.0 |
120.0 |
87.0% |
9.3% |
215,983 |
821 |
27.0% |
4.6% |
9.4% |
|
UpperHill |
10.0% |
90.0% |
15,903.0 |
147.0 |
72.0% |
7.7% |
13,095.0 |
113.0 |
86.0% |
8.8% |
8.7% |
|||||
|
Kilimani |
25.0% |
75.0% |
19,571.0 |
168.0 |
87.0% |
9.1% |
12,875.0 |
102.0 |
82.0% |
7.7% |
8.6% |
|||||
|
Thika Rd |
36.0% |
14.0% |
50.0% |
35,000.0 |
297.0 |
95.0% |
9.7% |
12,500.0 |
111.0 |
90.0% |
9.6% |
161,849.0 |
756.0 |
20.0% |
5.6% |
7.6% |
|
Westland |
27.0% |
58.0% |
59.0% |
16,399.0 |
179.0 |
65.0% |
8.1% |
12,845.0 |
113.0 |
76.0% |
8.1% |
201,274.0 |
636.0 |
31.0% |
3.8% |
7.0% |
|
Msa Rd |
51.0% |
10.0% |
39.0% |
20,000.0 |
180.0 |
50.0% |
5.4% |
13,200.0 |
96.0 |
75.0% |
6.5% |
171,304.0 |
843.0 |
5.9% |
5.7% |
|
|
Eastland’s |
25.0% |
75.0% |
20,000.0 |
132.0 |
76.0% |
6.0% |
81,717.0 |
351.0 |
20.0% |
5.1% |
5.4% |
|||||
|
Average |
58.1% |
30.9% |
41.3% |
19,663.5 |
181.2 |
76.9% |
8.5% |
13,014.6 |
110.3 |
81.1% |
8.2% |
168,343.5 |
777.5 |
24.5% |
5.6% |
8.0% |
|
||||||||||||||||
|
||||||||||||||||
|
||||||||||||||||
Source: Cytonn Research 2018
The main highlights for the MUD sector for 2018 include;
- Kiloran Development Group, a UK-based developer with an operational office in Nairobi together with ALL Design, a British architectural firm, announced plans of putting up a Mixed-Use Development (MUD) named, “The Beacon”, to be located off Uhuru Highway towards Bunyala Road roundabout. The MUD will be consisting of 261,563 SQFT of retail space and 45,208 SQFT of Grade A office space, and,
- Jesus House of Praise International Church launched plans to build a 30-floor commercial property in Meru County located 1.6 km from Meru Town along the Meru-Embu-Nairobi Highway (size and other details undisclosed). The development will comprise of office spaces, retail complex, serviced apartments, hotel, church and conference halls.
We retain a positive outlook for the sector, with MUD recording an average weighted rental yield of 8.0%, outperforming single themed real estate market average at 7.4%. MUDs are, therefore, a viable investment suitable for developers and investors looking to diversify their real estate portfolio, given that some themes such as office and retail are oversupplied with 4.7mn and 2.0mn SQFT space, respectively, in Nairobi Metropolitan Area.
- Hospitality Sector
In 2018, the hospitality sector in Kenya recorded increased investment driven by demand for hospitality services from both local and international guests, with the number of international arrivals growing by 7.8% between January and September 2018 to 776.4 mn persons, compared to 720.4 mn during the same period in 2017 according to Leading Economic Indicator October 2018. According to the KNBS Economic Survey 2018, following a 5-year slump between 2011 and 2015 that was because of insecurity and terrorism, the number of international arrivals into the country has been on the rise growing by 13.5% from 1.2 mn in 2015 to 1.3 mn in 2016 and by 8.0% to 1.4 mn in 2017. Mirroring this growth, the total number of hotel bed nights grew by 9.5% from 5.9 mn in 2015 to 6.4 mn in 2016 and by 11.3% to 7.2 mn in 2017. We attribute the growth primarily to the marketing efforts by the government and improved security.
With this promising growth, hoteliers continued to expand their brands and as a result, in 2018, the sector recorded significant hotel openings and acquisitions including:
|
Hotels Opened in 2018 |
|||||
|
Name of Hotel |
Brand |
Location |
Star Rating |
No of Hotel Rooms |
Month Opened |
|
City Lodge Hotel |
City Lodge Hotel Group |
Kiambu Road |
3 |
171 |
January 2018 |
|
Tamarind Hotel |
Tamarind Group |
Lang’ata Road |
3 |
162 |
March 2018 |
|
Trademark Hotel |
|
Kiambu Road |
5 |
215 |
April 2018 |
|
Movenpick Hotel |
Movenpick Hotel & Resorts |
Westlands |
5 |
128 |
April 2018 |
|
Hilton Garden Inn |
Hilton Group |
Mombasa Road |
5 |
171 |
October 2018 |
|
Nyali Golf View Residences (serviced apartments) |
|
Mombasa |
|
65 |
November 2018 |
|
Total |
912 |
|
|||
Source: Cytonn Research
During the year, a few hotels also embarked on rebranding, aiming at leveraging on international brands and gaining competitive advantage in the wake of stiff competition in the sector:
|
Hotels Rebranded in 2018 |
||||||
|
Name of Hotel |
Current Brand |
Location |
Star Rating |
No of Hotel Rooms |
Month Rebranded |
Former Brand |
|
Crowne Plaza |
Inter-Continental |
Mombasa Road |
4 |
144 |
May 2018 |
Lazizi Premiere |
|
Double Tree by Hilton |
Hilton Group |
Ngong’ Road |
4 |
109 |
February 2018 |
Amber Hotel |
|
Total |
253 |
|
|
|||
Source: Cytonn Research
In addition, during the year, several hotel brands announced plans to enter the Kenyan hospitality market, adding approximately 785 keys to the existing number in the pipeline, as shown below:
|
Hotel Projects Launched in 2018 |
|||||
|
Name of Hotel |
Brand |
Location |
Star Rating |
No of rooms |
Year of Completion |
|
Nairobi Institute of Business Studies Hotel (NIBS) |
Undisclosed |
Kileleshwa |
5 |
72 |
2019 |
|
PrideInn Hotel |
PrideInn Hotels |
Mombasa |
3 |
40 |
Undisclosed |
|
Mediview Limited |
|
Limuru Road |
5 |
200 |
Undisclosed |
|
Undisclosed |
Hyatt Hotels |
Westlands |
5 |
173 |
2020 |
|
Rotana Hotel |
Rotana Hotel & Resorts |
Upperhill |
5 |
200 |
2022 |
|
Arjaan Hotel Apartments |
Rotana Hotel & Resorts |
Upperhill |
|
100 |
2022 |
|
Total |
785 |
|
|||
Source: Cytonn Research
The activities above are a clear indication of the attractiveness of the sector for investment and will result in (i) better accommodation and service standards, as hotels rebrand and other brands set foothold in the market, in the wake of stiff competition from global brands such as Radisson Blu, Mariott and now Movenpick, and (ii) increased room capacity to meet the growing demand for accommodation as seen in the increase in tourist arrivals between January and September 2018 to 776.4 mn, compared to 720.4 mn during the same period in 2017, according to the Leading Economic Indicator October 2018.
In terms of performance in 2018, we tracked the performance of serviced apartments in 7 nodes in Nairobi Metropolitan area. From our research, serviced apartments recorded improved performance in 2018 with the average rental yield coming in at 7.4%, which is 2.1% points higher than 5.3% recorded in 2017, and this we attribute to the increased demand, which has triggered an increase in charge rates, as well as increased occupancy rates with an average of 80.0% in 2018, compared to 72.0% in 2017. We attribute the improved performance to the stable political environment and improved security, making Nairobi an ideal destination for both business and holiday travelers.
The serviced apartments performance was as follows:
All values in Kshs unless stated otherwise
|
Serviced Apartments Performance in 2018 |
|||||||
|
Node |
Occupancy 2017 |
Occupancy 2018 |
Monthly Charge per SM 2018 |
Devt Cost per SM |
Rental Yield 2017 |
Rental Yield 2018 |
∆ in Rental Yield |
|
Kilimani |
74.0% |
86.0% |
3,567 |
202,662 |
7.2% |
10.9% |
3.7% |
|
Westlands& Parklands |
78.0% |
76.0% |
4,044 |
209,902 |
7.3% |
10.6% |
3.3% |
|
Limuru Road |
80.0% |
84.0% |
3,685 |
231,715 |
4.5% |
9.7% |
5.2% |
|
Kileleshwa& Lavington |
70.0% |
83.0% |
2,686 |
206,132 |
7.0% |
7.8% |
0.8% |
|
Nairobi CBD |
70.0% |
74.0% |
2,374 |
224,571 |
4.2% |
5.7% |
1.5% |
|
Upperhill |
60.0% |
2,580 |
209,902 |
6.6% |
5.3% |
-1.3% |
|
|
Msa Road |
64.0% |
85.0% |
1,642 |
200,757 |
3.1% |
5.0% |
1.9% |
|
Thika Road |
69.0% |
90.0% |
1,361 |
200,757 |
2.6% |
4.4% |
1.8% |
|
Average |
72.0% |
80.0% |
2,742 |
210,800 |
5.3% |
7.4% |
2.1% |
|
|||||||
Source: Cytonn Research
- Kilimani area was the best performing node in 2018, recording high occupancy rates of 86.0%, and a rental yield of 10.9%, and this we attribute to its easy access from Jomo Kenyatta International Airport (JKIA), proximity to business nodes such as Westlands and Upperhill, and the good transport network thus ease of accessibility,
- Thika Road node (Muthaiga North, Mirema and Garden Estate) recorded the lowest rental yield at 4.4%, and this we attribute to its unpopularity, given the distance from main commercial zones, the lack of modern and quality serviced apartments, in addition to not being mapped within the UN Blue Zone, thus not attractive to expatriates due to security concerns,
- The investment opportunity lies in Kilimani and Westlands, which were the best performing areas with average rental yields of above 10.0%. For more details on supply and performance of the serviced apartments sector, see the Serviced Apartments Research Report 2018.
The main challenges that continue to face the sector include: (i) negative publicity of some parts of Kenya such as Mandera, Wajir, Lamu and Eastleigh in Nairobi due to instances of terrorist attacks and thus hampering tourism in these areas, and, (ii) slow infrastructural development and delays in the completion of the same which continues to cripple the opening up of areas for development and access. For instance, the expansion of the JKIA runway, which is yet to kick off, and was intended to meet the needs of the increasing number of passengers passing through Kenya’s main airport and attract global airlines.
We project further growth in the hospitality sector in 2019 fueled by (i) political stability and improved security, (ii) improved flight operations and systems making it easier and more convenient for travelers, (iii) positive reviews from travel advisories such as Global Traveler(GT) who crowned Kenya as the best travel destination in the world, and named Kenya Airways as the third best airline in Africa , and (iv) improved hotel standards with the entry of global hotel brands while existing hotels refurbish their developments.
- Land Sector
During the year 2018, land continued to attract investors and developers, supported by the political stability, which has led to increased economic activities. The Nairobi Metropolitan Area land prices recorded a 7- year CAGR of 13.7%, and a 3.8% y/y price change in 2018. The land performance was positively driven mainly by, (i) provision of trunk infrastructure such as road network, (ii) the growing demand for development land especially in the satellite towns such as Ruiru and Syokimau due to their affordability compared to land in the urban areas. However, the key challenge facing the land sector was the uncertainty surrounding statutory approvals particularly in light of the ongoing demolitions of legally approved buildings, thus decreased transactions in the land sector.
The summary below shows the performance of the theme in 2018:
All values in Kshs unless stated otherwise
|
Nairobi Metropolitan Report Performance 2018 |
||||||
|
Location |
*Price in 2011 |
*Price in 2017 |
*Price in 2018 |
7 YR CAGR |
% Price change from 2011 |
Annual Capital appreciation |
|
Nairobi Suburbs - Low Rise Residential Areas |
56.0 mn |
82.4 mn |
89.4 mn |
6.9% |
2.6 |
9.2% |
|
Unserviced land |
9.0 mn |
20.4 mn |
22.7 mn |
14.1% |
3.5 |
5.7% |
|
Nairobi Suburbs - Commercial Areas |
156.0 mn |
470.7 mn |
492.6 mn |
17.9% |
3.3 |
5.4% |
|
Serviced land |
6.0 mn |
14.4 mn |
14.3 mn |
13.2% |
3.5 |
0.6% |
|
Nairobi Suburbs - High rise residential Areas |
46.0 mn |
134.6 mn |
135.0 mn |
16.6% |
2.4 |
0.2% |
|
Average |
66.0 mn |
175.5 mn |
182.8 mn |
13.7% |
3.0 |
3.8% |
|
||||||
Source: Cytonn Research
The key highlights are as follows:
- Land prices in commercial zones such as Kilimani, Nairobi CBD, Westlands and Upperhill recorded a 7-year CAGR of 17.9%, and a 5.5% y/y capital appreciation in 2018, attributable to the high plot ratios allowing for densification of developments. This has thus resulted in high demand for land in these areas due to attractive returns on investment after development, proximity to amenities such as shopping malls and the Jomo Kenyatta International Airport (JKIA), scarcity of development land in addition to the good road network in the areas making them easily accessible. Kilimani was the best performing commercial node, recording a 10.7% y/y capital appreciation, and we attribute this to the high demand for development in the area, as it is a growing commercial zone,
- Unserviced land prices in satellite towns such as Ruaka, Utawala and Juja recorded a 7-year CAGR of 14.1% and a 5.7% y/y capital appreciation in 2018, attributed to the increased demand for property driven by (i) the relatively low prices thus preferred for development, and (ii) the improved infrastructure such as the road network, for instance the dualing of the Northern bypass which on completion is expected to opened up the areas in Ruaka for development. On the other hand, serviced land recorded a 13.2% 7 year CAGR, 0.9% points lower than the 14.1% recorded by unserviced land prices, and we attribute the drop in prices to decreased demand for site and service schemes as developers and investors prefer to buy unserviced plots and service instead of paying a premium as developers double the price the land for the services, facilities and amenities provided,
- Land prices in high rise residential areas such as Kileleshwa, Kasarani and Kilimani recorded a 7-year CAGR of 16.6% and 0.2% y/y capital appreciation, attributed to low demand for development land in the area due to the high population in the areas thus strained infrastructure and amenities, in addition to hosting low income earners with low purchasing power thus investors are not able to charge more for the housing units, resulting in low returns and thus the stagnation of land prices, and,
- Land prices in low-rise residential areas such as Kitisuru, Runda and Karen recorded a 6.9% 7-year CAGR, which is 9.7% points lower than that of high-rise residential areas, and we attribute the scenario to the limiting plot ratios on land, thus reducing the return on investment for investors in these areas.
In conclusion, the investment opportunity in the Nairobi Metropolitan Area land sector lies in Satellite Towns such as Ruaka, Utawala, Ruiru and Thika, evidenced by high capital appreciation of 16.2%, 17.5%, 4.7%, 7.7% y/y capital appreciation, respectively, in addition to other areas such as Kilimani, Karen and Kitisuru, which had rates of 10.7%, 10.3% and 10.5% y/y capital appreciation, respectively.
We retain a positive outlook for the land sector backed by (i) improved infrastructure that exposes areas for investment, (ii) political calm in the country, and (iii) the focus of the Kenyan Governments Big 4 agenda on the provision of affordable housing.
- Infrastructure Sector
During the year, we saw continued government investment in the infrastructural sector and its impact on the country’s macroeconomic growth. According to KNBS Economic Survey 2018, total expenditure on roads has increased by 54.9% over a 4-year period to Kshs 198.4 bn in 2017/18, from Kshs 89.5 bn in 2013/14. The government continues to increase its investments in order to boost the country’s economic growth through (i) revenue generation, (ii) increased employment opportunities, (iii) betterment of services and facilities, and (iv) improving the ease of doing business in Kenya.
Below is a table highlighting notable infrastructural projects in the Nairobi Metropolitan Area in 2018:
|
Infrastructural Projects in the Nairobi Metropolitan Area in 2018 |
||||||
|
|
Name of project |
Type |
Length (Kms) |
County |
Project Value |
Progress |
|
1 |
Ngong Road Expansion (Phase 1) – dualing of road from the Kenya National Library to the junction at Kilimani Ring Road |
Road |
2.57 km |
Nairobi |
Kshs 2.3 bn |
Completed in Q1’2018 |
|
2 |
Four link roads that is set to connect the Garissa Highway to the upcoming Thika Bypass |
Road |
2 km, 3 km, 3 km and 8 km |
Kiambu |
Kshs 1.5bn |
Commenced in February 2018 |
|
3 |
Construction of phase 2A of the Standard Gauge Railway (SGR) traversing through the Nairobi National Park |
Railway |
120 km |
Nairobi, Kajiado, Nakuru, Kiambu, Naivasha and Narok, |
Kshs 150.0 bn |
Commenced in March 2018 |
|
4 |
Ngong Road Expansion (Phase 2) |
Road |
2.4 km |
Nairobi |
Kshs 2.2 bn |
Commissioned in March 2018 |
|
5 |
Superhighway linking Jomo Kenyatta International Airport to Rironi area in Limuru along the Nakuru- Nairobi highway |
Road |
43.5 km |
Kiambu |
Kshs 59.0 bn |
Designs commenced February 2018, project to commence in Q1’2019 |
Source: KenHA, KERRA, KURA
Other projects launched in 2018 in the rest of the country include:
- Eldoret Southern Bypass - (20 km) in Uasin Gishu County
- Dongo-Kundu Bypass (11 km) – Phase 2 & 3 in Mombasa County
- Lamu – Isiolo Road (530 km) in Lamu/Isiolo County
- Gilgil to Njoro Road (23 km) in Nakuru County
- Upgrade of Kimbimbi-Karoti – Kajiji Roads, Pi – Mumbi Roads (217 km) in Kirinyaga County
- Extension of the Olkaria 1 Units 4 & 5 Geothermal Power
- Dualing of the Salgaa-Mau Summit Highway (22 km)
- Miritini passenger terminus to Mombasa CBD train station (22 km) in Mombasa County
- Expansion of the Mombasa Port Second Container Terminal
Infrastructural development will play a key role in economic growth by enhancing connectivity and creating a better operating environment for individuals and businesses. It will open up previously inaccessible areas improving connectivity and thus lead to increased demand for property resulting in an increase in property prices.
In terms of infrastructure supply in the Nairobi Metropolitan Area, according to Cytonn Research, Nairobi and Kiambu Counties offers the best investment opportunity due to presence of relatively good coverage of all infrastructure sub-sectors, in comparison to other counties. For more information and analysis, see Nairobi Metropolitan Area Infrastructure Report 2018.
In conclusion, the presence and quality of infrastructure, that is, transportation and utilities, is one of the most important factors influencing real estate investments, and the country’s economy as a whole. We, therefore, expect the infrastructural development to remain a top priority for the government in line with its Big Four Agenda to improve the housing deficit and scale up the manufacturing sector.
- Statutory Reviews
During the year, several statutory reviews were made or proposed, all in line to promote efficiency in the property sector and to facilitate the government’s affordable housing agenda.
The following are the key reviews;
- Signing into law the amendment of the Stamp Duty Act to exempt first time homebuyers under the affordable housing from paying stamp duty, thus reducing their financial burden, Cytonn Weekly #28/2018
- Signing into law an amendment to the Income Tax Act stating that homebuyers under the affordable housing plan are eligible to a 15 % relief on their gross monthly earnings, but not exceeding Kshs 108,000 annually, Cytonn Weekly #28/2018
- Amendment of the Employment Act 2012, allowing the government to fund raise through National Housing Development fund, by introducing a 1.5% levy that would be deducted from the wages of formal industry workers with a similar amount remitted by their employers. In December 2018, the high court suspended implementation of the levy pending the hearing and determination of the application made by the Central Organization of Trade Unions (COTU), Cytonn Weekly #49/2018
- The Kenyan Parliament approved regulations set to facilitate the implementation of 7 new land laws, which among other items outline the mandates of various parties, including the Ministry of Lands, the National Land Commission and the County Governments. These regulations include a) The Land (Extension and Renewal of Leases) Rules, 2017; b) The Land (Conversion of Land) Rules, 2017; c) The Land (Assessment of Just Compensation) Rules, 2017; d) The Land (Allocation of Public Land) Regulation, 2017; e) The Land Registration (General) Regulations, 2017; f) The Land Registration (Registration Units) Order, 2017 and g) The Land Regulations, 2017. The regulations are meant to establish procedures for land-related transactions promoting efficiency and reducing cost on both developers and the end-user in the real estate sector,
- Launch of the Sessional Paper No. 1 of 2017 National Land Use Policy (NLUP), aimed at curbing land grabbing and poor land management, Cytonn Weekly #24/2018
- Listed Real Estate Sector
During the year, Stanlib Fahari I-REIT acquired 67 Gitanga Place office building in Lavington at Kshs 850.0 mn in compliance with the Capital Market’s Authority’s (CMA) requirement for listed REITs to invest a minimum of 75.0% of assets in income-generating real estate. The acquisition of 67 Gitanga road office block thus raised their real estate assets share in the fund to 90.0%, from 67.0% invested in Greenspan Mall, Signature International Limited, and Bay Holdings Ltd. The newly acquired property is expected to generate a net income of Kshs. 73.8Mn p.a, translating to an 8.7% rental yield.
On performance, Stanlib Fahari I-REIT released their H1’18 earnings, and the key highlights were as follows;
- The instrument registered a 16.3% y/y decline in earnings to Kshs 0.36 from Kshs 0.43 per unit in H1’2017, driven by a 7.7% decline in operating income, which outpaced the 0.9% decline in operating expenses to Kshs 111.5 mn from Kshs 112.5 mn in H1’2017,
- 65.9% of expenses were attributed to fund-operating expenses, mainly acquisition fees for the new property; while property expenses that include maintenance of tenants and properties, filling vacancies, marketing, and public relations accounted for 34.1% of the total operating expenses,
- Rental income declined by 2.1% y/y to Kshs 135.1 mn from Kshs 138.0 mn in H1’2017 attributable to a temporary increase in vacancies, coupled with some tenants bargaining for reduced rentals upon the renewal of leases. For example, the Greenspan Mall had an occupancy of 74.0% in H1’2018, which is 5.5% points lower than the Nairobi retail market average at 79.5%
Stanlib Fahari I-REIT closed at a price of Kshs 10.9 as at 31st December, 2018, and a projected FY’2018 dividend yield of 5.7%, assuming the dividend payout ratio remains at 91.0%, similar to the FY’2017 payout. For a more comprehensive analysis, see our Stanlib Fahari I- REIT Earnings Note
On the bourse, Stanlib’s Fahari I-REIT value declined by 5.9% y/y trading at an average of Ksh 10.6 in 2018 compared to Kshs 11.3 in 2017. The REIT closed at a price of Kshs 10.9 per unit, 45.5% lower than its listing price of Kshs 20.0 in November 2015. The prices of the instrument have remained low due to (i) opacity of the exact returns from the underlying assets, (ii) the negative sentiments currently engulfing the sector given the poor performance of Fahari and Fusion REIT (FRED), (iii) inadequate investor knowledge, and (iv) lack of institutional support for REITs. We expect the REIT to continue trading at low prices and in low volumes in 2019. Below is the Fahari REIT Performance for 2018:
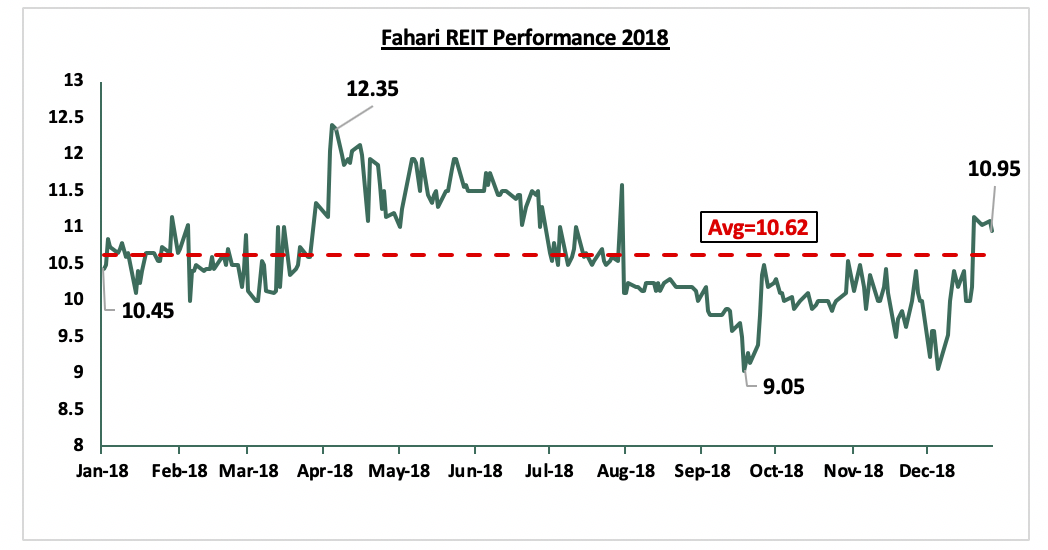
We retain a negative outlook for the listed real estate sector mainly due to market structures and poor market sentiment, however, attempts by key real estate industry players in the region such as East Africa Forum for Structured products and REITs Association of Kenya to improve the market sentiment on REITs and other alternative investments and need for capital by developers is expected to drive uptake of the REIT.
In 2018, the real estate sector recorded continued investment across all themes mainly driven by the political stability following the conclusion of the electioneering period in Q1’2018. We continue this to result in increased economic activities going forward and thus improved performance in the real estate sector.
Disclaimer: The Cytonn Weekly is a market commentary published by Cytonn Asset Managers Limited, “CAML”, which is regulated by the Capital Markets Authority. However, the views expressed in this publication are those of the writers where particulars are not warranted. This publication, which is in compliance with Section 2 of the Capital Markets Authority Act Cap 485A, is meant for general information only, and is not a warranty, representation, advice or solicitation of any nature. Readers are advised in all circumstances to seek the advice of a registered investment advisor.

- Talk to us
- Kenya
- P.O Box 20695 - 00200, Nairobi, Kenya
- Cell +254709101200
- Tel +254709101200
- WhatsApp +254741676635
- United States
- +254709101200
- DOWNLOAD OUR APP
-


- Kenya
- 8th Floor, Pinetree Plaza, Kaburu Drive, Ngong Road, Nairobi, Kenya
- USA
- Suite 1150, 1775 Eye Street NW, USA, Washington DC 20006, USA
- Investments
- High Yield
- Private Equity
- Real Estate
- Real Estate
- RiverRun Estates
- Cytonn Towers
- The Ridge
- Taraji Heights
- The Alma