Cytonn Annual Markets Review - 2017
By Cytonn Research Team, Dec 31, 2017
Executive Summary
Global Markets Review
The global economy is expected to record improved growth in 2017 as the US and China retain their growth momentum and the economic recovery in the Eurozone gathers pace. Central Banks’ Policy stance in advanced economies was biased towards economic tightening, with the US Federal Reserve raising the Federal Funds Rate three times in 2017, and the European Central Bank halving their monthly bond purchases and signalling an end to their 3-year old stimulus package in 2018. The ECB committed to purchasing EUR 60.0 bn of government and corporate bonds monthly, which started in March 2015;
Sub Saharan Africa Region Review
Sub-Saharan Africa economic growth remained relatively strong in 2017 compared to 2016 with the region’s GDP growth averaging 2.4% for the first three quarters of 2017 compared to the annual growth of 1.4% in 2016, mainly driven by commodity exporting countries as commodity prices recovered in global markets. Regional currencies registered mixed performance in 2017, with a number of currencies gaining against the dollar. Most of the equities markets recorded gains during the year, highlighting improved investor sentiment owing to improving macroeconomic conditions and a relatively stable political landscape in the continent;
Kenya Macro Economic Review
The Kenyan economy expanded by an average of 4.7% for the first three quarters of 2017 compared to an average of 5.7% in a similar period in 2016, mainly as a result of subdued growth in the agricultural sector following the 2016/17 drought and a slowdown in the growth of the financial intermediation sector brought on by slowing private sector credit growth to an average of 2.4% for the first 10 months of the year compared to the five-year average of 14.4%;
Fixed Income
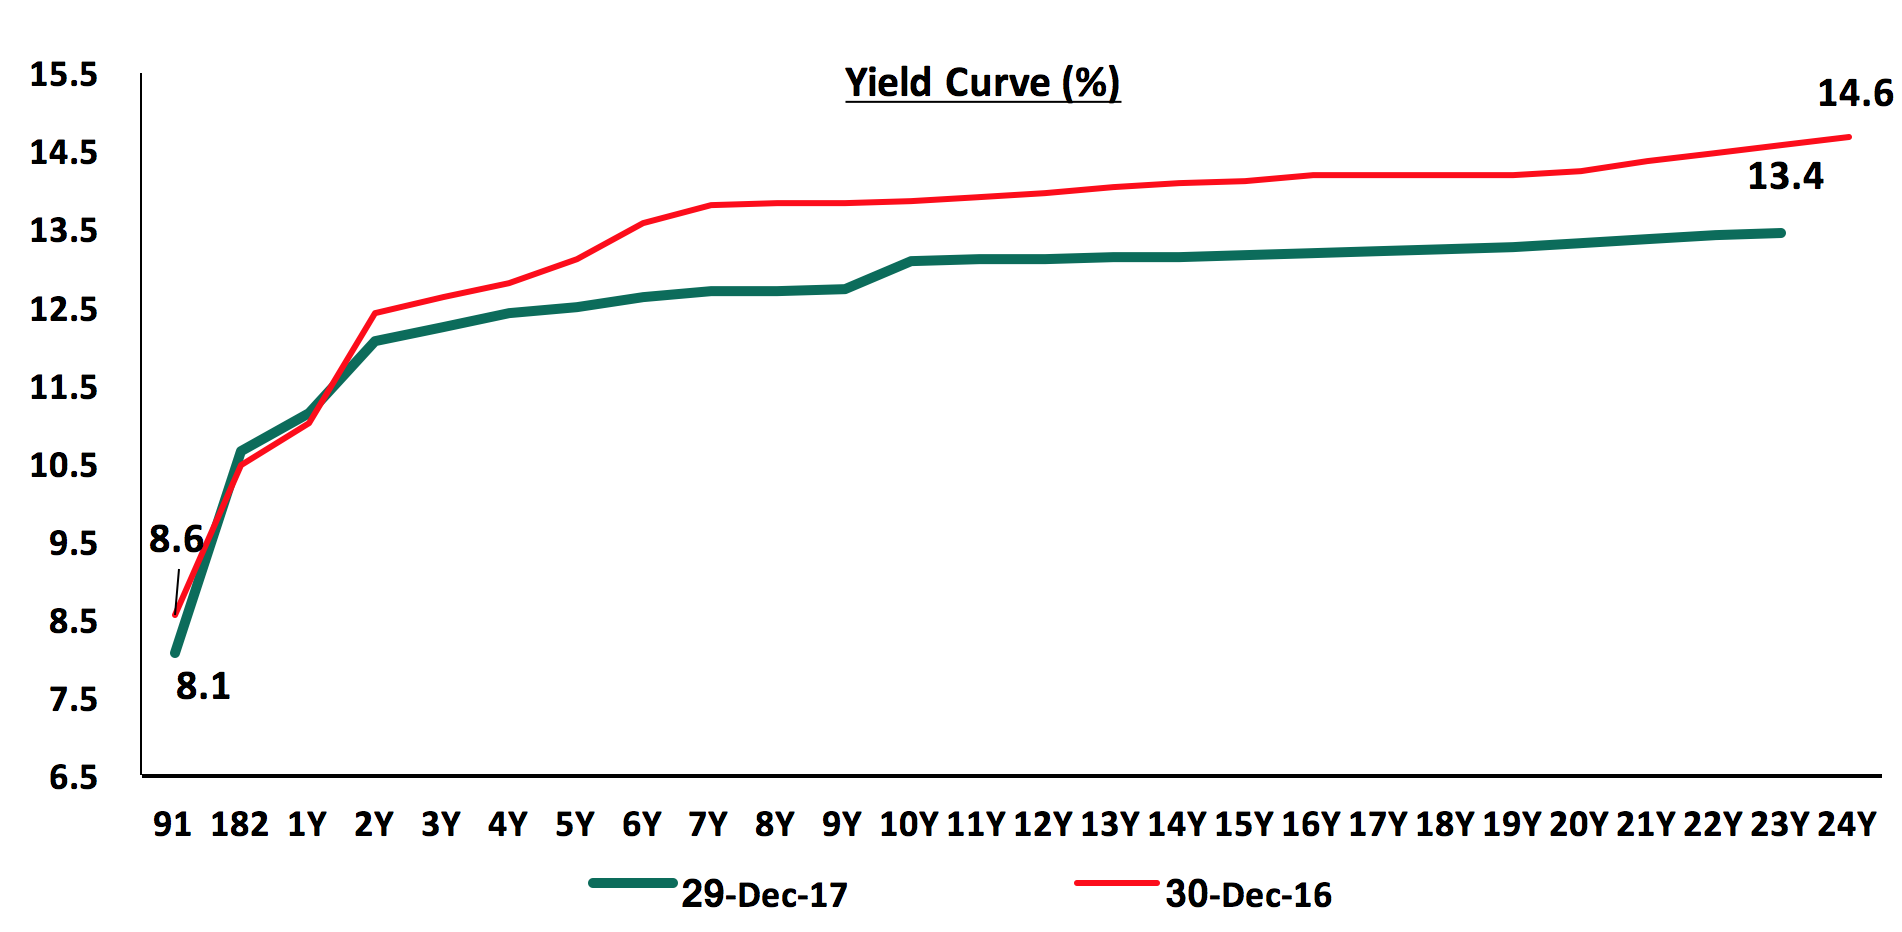
In 2017, the yield on the 91-day T-bill declined by 50 bps to 8.1% from 8.6%. Yields on the 182 and 364-day papers increased by 10 bps and 20 bps to 10.6% and 11.2% from 10.5% and 11.0% at the end of 2016, respectively. The yield curve experienced downward pressure during the year as the government contained rates by rejecting expensive bids;
Equities
During the year, the market recorded very strong performance with NASI, NSE 25 and NSE 20 gaining by 28.4%, 21.3% and 16.5%, respectively, as a result of gains in large cap stocks. The earnings growth for the year is expected to be low with the listed banks recording an 8.2% decline in their core earnings per share in Q3’2017 compared to a growth of 14.1% in Q3’2016. The decline in earnings can be attributable to the tough operating environment as a result of the interest rate cap and the prolonged political uncertainty in the country that affected the business environment. Safaricom continues to be a key part of Kenyan equities portfolios, accounting for 44.0% of Nairobi Stock Exchange (NSE’s) market capitalization and has dominated in determining the direction of the market given its weight, liquidity and the free float shares. In H1’2018, Safaricom recorded core earnings per share (EPS) growth of 9.0% to Kshs 0.65 from Kshs 0.6 in H1’2017;
Private Equity
During the year, private equity activity was high as evidenced by increased deal activity by local and global investors including Abraaj Group, IFC, and Actis, among others. We highlight major Private Equity deals, Mergers and Acquisition, Quoted Private Equity and fundraising deals under the Financial Services, Hospitality, Education, Real Estate and Technology Sectors in 2017;
Real Estate
The real estate sector recorded slower performance in 2017 with average total returns for real estate operators of 14.5% in 2017 compared to 25.8% in 2016 as a result of slower capital appreciation which came in at 6.5% in 2016 from 18.0% in 2017 as a result of capping out of land prices in some suburbs such as Upperhill, Westlands and Kilimani. In terms of themes, retail recorded average rental yields of 9.6% in 2016 compared to 10.0% in 2017, commercial office recorded average rental yields of 9.2% compared to 9.4% in 2016 and residential real estate recorded average rental yields of 5.2% compared to 4.9% in 2016.
The year 2017 was characterized by an upswing in global economic growth, with growth in the US and China gaining momentum and the recovery in the Eurozone gathering pace. Global GDP growth in 2017 is expected to come in at 3.6%, higher than the 3.2% registered in 2016. A resurgence in global demand, with notable pickups in investment, trade, and industrial production, coupled with stronger business and consumer confidence being the key factors supporting the global growth. The Central Banks reversed trend, gradually removing the accommodative policies that were used to support the economic recovery since the 2008 global financial crisis.
In terms of trade, the World Trade Organization (WTO) upgraded their outlook for world trade growth in 2017 to 3.6% from their 2.4% expectation in April 2017, citing a resurgence in Asian trade flows as intra-regional shipments picked up, and as import demand in North America recovered after stalling in 2016. This is an improvement from the 1.3% recorded in 2016, defying expectations of a slowdown in trade following the anti-globalisation campaigns witnessed in major global economies such as the US.
Global equity markets registered gains driven by improved investor sentiment due to better than expected corporate earnings, improved global economic growth outlook and improvement in commodity prices. The MSCI Emerging index performed better than other global indices, rising 34.3%, while the Shanghai Composite lagged with a return of 13.6%.

Global commodity prices have registered gains in 2017, with crude oil, metals & minerals, and energy registering gains of 15.7%, 13.5%, and 11.5%, respectively, while agriculture experienced a decline of 2.1%, according to the World Bank Commodity Prices Index. The rise in energy prices was driven by gains in Brent crude oil prices that rose 15.7% to USD 63 per barrel, supported by a sustained cap on oil production by OPEC countries and Russia, despite increased US shale oil output. Below is a chart highlighting the performance of select commodity prices, with 15.7%, 13.5%, 11.5%, 2.4% and (2.1%) returns for Brent oil, energy, metals & minerals, non-energy and agriculture performance, respectively.

United States
The Fed has been on a tightening cycle, having started in December 2016 with a 25 bps interest rate increase, and followed this with 25 bps hikes each in March, June and December. The Federal Funds rate ended the year at 1.25% - 1.50%, from a range of 0.5% - 0.75% at the beginning of the year. The increase was driven by:
- a strong labour market, with an average of 174,000 new jobs added every month during the year and the unemployment rate at lows of 4.1% in December, compared to 5.0% unemployment rate that is considered full employment in the US economy, and
- relatively strong annual economic growth, which came in at 2.3% in Q3’2017, and expectations for 2017 growth is at 2.2% compared to 1.6% in 2016, driven by increased consumer spending.
The stock market performance registered gains, with the S&P 500 rising 19.8%, supported by strong growth in corporate earnings and expected implementation of pro-growth policies under the administration of President Trump, including tax reforms that will result in corporate tax rates falling to 21% from 35%. In terms of valuations, the Cyclically Adjusted Price/Earnings (CAPE) ratio is currently near historical highs at 32.5x, far above the historical average of 16.8x, indicating an overvaluation of the market.
Eurozone
Recovery in the Eurozone improved in 2017 with the region expected to grow by 2.2% in 2017 compared to 1.7% growth experienced in 2016. The labour market recovery also continued, with the unemployment rate dropping to 8.8% in October 2017 from 9.8% in December 2016.
The European Central Bank (ECB) maintained the base lending rate at 0.0%, and the rates on the marginal lending facility and deposit facility at 0.25% and (0.40%), respectively, throughout the year. As the economy recovers, the ECB plans to reduce their quantitative easing programme by reducing the monthly bond buying program to EUR 30.0 bn from EUR 60.0 bn as from January 2018, with the option to extend the stimulus package beyond September 2018. Inflation remained low during the year at 1.5% compared to a target of 2.0%, thus warranting the continuation of loose monetary policy.
Euro zone stock markets were on a positive trend with The Stoxx 600 index gaining 21.9% during the year, driven mainly by solid corporate earnings growth and margin expansion due to higher Eurozone and international growth. In terms of valuations, the Stoxx 600 Index is currently trading at a P/E of 20.8x, slightly higher than its historical average of 20.3x.
The manufacturing sector recorded a strong growth, with the Eurozone’s Flash PMI rising to a 79-month high of 60.0 in November 2017, with multi-year highs seen for all the main indicators of output, demand, employment and inflation, further supporting the Eurozone’s economic recovery.
China
The IMF expects China’s 2017 growth to come in at 6.8%, a tad higher than the 6.7% recorded in 2016, amid a rebound in global trade and rising household incomes. This is also higher than the Chinese Government’s expectation of a 6.5% growth for 2017. However, despite this strong growth, China’s increasing debt levels and dependency on credit to fuel growth continues to pose a major financial stability threat to the global economy, and could be the catalyst for the next global crisis.
To curb this financial stability risk, Chinese authorities have undertaken a number of policy and regulatory measures aimed at reducing macroeconomic imbalances without an adverse impact on growth, among them:
- Refinancing government debt with cheaper debt, which will ease the cost of servicing the debt,
- Introduction of debt-to-equity swaps in a bid to trim China’s corporate debt loads, and
- A slow down on accumulation of new debt
The stock market recorded positive returns during the year, with the Shanghai Composite advancing 11.7% in 2017, supported by MSCI’s potential inclusion of 222 large cap Chinese A shares in the MSCI World Index and easing liquidity concerns. In terms of valuations, the Shanghai Composite index is currently trading at a P/E of 16.8x, slightly lower than the historical P/E of 17.0x
Sub-Saharan Africa economic growth remained relatively strong in 2017 with the region’s average GDP growth for the first three quarters of 2017 coming in at 2.4%, mainly driven by improvements in commodity exporting countries, which benefitted from recovery in global commodity prices and stronger global growth that resulted into increased commodity demand. According to the International Monetary Fund (IMF) October’s World Economic Outlook Update for 2017, Sub-Saharan Africa (SSA) is expected to grow at a rate of 2.6% in 2017, from a two-decade low of 1.4% in 2016. This is primarily due to recovery of Nigeria, brought about by a recovery in oil production, recovery of oil prices and growth in the agricultural sector. South Africa continues to drag down growth with 2017 GDP growth being downgraded to 0.7% from 1.0% previously by the IMF, citing the political uncertainty that has led to decreased investor confidence in the country. East Africa is still expected to be the fastest growing region, with an expected GDP growth rate of 5.4% in 2017, owing to growth of 6.5%, 5.2%, 5.0% and 4.4%, in Tanzania, Rwanda, Kenya and Uganda, respectively. In Western Africa, Ghana is expected to grow by 7.9% (Bank of Ghana estimate), while Nigeria’s 2017 GDP growth expectation is at 0.8%.
Currency Performance
Regional currencies registered mixed performance in 2017, with the South African Rand emerging the top gainer at 10.3% against the US dollar as the currency rallied towards the end of the year when Cyril Ramaphosa took the leadership position of the country’s ruling party, African National Congress (ANC). ANC has been the ruling party in South Africa for the last 23 years, and it is likely that the party’s leader will be elected as the president in their 2019 elections. Ramaphosa’s win is considered positive as his policies are more business friendly and pro-economic growth. The Nigerian Naira was the worst performer, shedding 14.2% as depreciation continued after the 2016 devaluation. Despite the political uncertainty witnessed in Kenya due to the long election period, the shilling remained stable, only losing 0.7 % as foreign inflows and the Central Bank’s activity supported the currency.
Below is a table showing the performance of select African currencies, ranked by 2017 y/y change.
|
Select Sub Saharan Africa Currency Performance vs USD |
|||||
|
Currency |
Dec-15 |
Dec-16 |
Dec-17 |
2016 y/y change (%) |
2017 y/y change (%) |
|
South African Rand |
15.5 |
13.7 |
12.3 |
11.2% |
10.3% |
|
Botswana Pula |
11.2 |
10.7 |
9.8 |
4.8% |
8.1% |
|
Mauritius Rupee |
35.9 |
36.0 |
33.6 |
(0.3%) |
6.7% |
|
Malawian Kwacha |
667.8 |
727.5 |
725.7 |
(8.9%) |
0.2% |
|
Zambian Kwacha |
11.0 |
9.9 |
10.0 |
9.7% |
(0%) |
|
Kenyan Shilling |
102.3 |
102.5 |
103.2 |
(0.2%) |
(0.7%) |
|
Ugandan Shilling |
3372.0 |
3596.5 |
3641.2 |
(6.7%) |
(1.2%) |
|
Tanzanian Shilling |
2160.0 |
2181.0 |
2234.6 |
(1.0%) |
(2.5%) |
|
Ghanaian Cedi |
3.8 |
4.2 |
4.5 |
(11.3%) |
(6.6%) |
|
Nigerian Naira |
199.3 |
315.3 |
360.0 |
(58.2%) |
(14.2%) |
|
A negative change in the currency indicates a depreciation in the currency against the dollar while a positive change indicates a gain in the currency against the dollar |
|||||
African Eurobonds
Yields on African Eurobonds continued to decline, shedding 2.3% points on average in 2017, highlighting the improved investor sentiment due to improving macro-economic conditions and a relatively stable political landscape. Zambia, Ghana and Kenya yields for their 10-year Eurobonds declined to close at 6.4%, 5.7% and 5.6% from 8.8%, 8.1% and 7.7% respectively at the beginning of the year.
During the year, there was high appetite for frontier market government securities in Sub Saharan Africa as risk adjusted returns remained higher compared to those in developed economies. Eurobond issued during the year included:
- Nigeria issued a 15-year Eurobond in February to raise USD 1.0 bn and two Eurobonds of 10 years and 30 years in mid-November to raise USD 3.0 bn for budgetary support. The bonds were oversubscribed, with subscription rates of more than 7.0x and more than 4.0x for the February and November issues, respectively. The yield on the February issue came in at 7.9% while for the 10-year and 30-year November issues came in at 6.5% and 7.6%, respectively,
- Senegal issued its fourth Eurobond, a new 16-year Eurobond, recording a subscription rate of more than 8.0x and a yield of 6.3% as investors relied on stability in the political scene and economic growth of the country.
Equities Market Performance
Most of the SSA stock markets recorded positive returns in 2017 attributed to improved corporate earnings following resurgent economic growth in commodity exporting countries and an increase in long-term investor interest following cheap valuations on most stocks in these countries. The Malawian market recorded the highest gains of 62.5% and the only market that lost was the West African regional stock exchange BRVM, which lost 4.4%. Malawi closed the year as the cheapest market by P/E, at 11.4x with Tanzania a close second at 11.8x. Ghana was the most expensive market at 31.1x P/E. Below is a summary of the performance of key exchanges:
|
Equities Market Performance (Dollarized*) & Price to Earnings (P/E) |
||||||
|
Country |
Current Price to Earnings (P/E) |
Dec-15 |
Dec-16 |
Dec-17 |
2016 y/y change (%) |
2017 y/y change (%) |
|
Malawi |
11.4x |
21.8 |
18.3 |
29.8 |
(16.0%) |
62.5% |
|
Ghana |
31.1x |
523.6 |
395.6 |
570.1 |
(24.5%) |
44.1% |
|
Uganda |
- |
0.5 |
0.4 |
0.5 |
(21.8%) |
34.3% |
|
South Africa |
20.3x |
3273.4 |
3688.1 |
4817.2 |
12.7% |
30.6% |
|
Kenya |
13.5x |
1.4 |
1.3 |
1.7 |
(8.5%) |
27.6% |
|
Zambia |
13.4x |
521.3 |
421.7 |
534.8 |
(19.1%) |
26.8% |
|
Nigeria |
12.8x |
143.7 |
85.3 |
106.2 |
(40.6%) |
24.5% |
|
Tanzania |
11.8x |
1.1 |
1.0 |
1.1 |
(6.7%) |
6.6% |
|
Rwanda |
- |
0.2 |
0.2 |
0.2 |
(12.0%) |
2.6% |
|
BRVM |
28.5x |
0.5 |
0.5 |
0.4 |
(6.7%) |
(4.4%) |
|
*The index values are dollarized for ease of comparison |
||||||
The Sub-Saharan Africa region is expected to perform well supported by increased public spending on infrastructural development supported by the high demand for basic needs. Key risks remain reliance on commodity prices and political tension in some countries. Stock markets valuations remain attractive for long-term investors. The improved regional economic growth prospects remain key towards enhancing investor sentiment and attracting investment inflows into the region.
The Kenyan economy remained resilient in 2017 despite recording a decline in growth compared to last year. KNBS data indicated that the economy expanded by an average of 4.7% for the first three quarters of 2017 compared to an average of 5.7% in a similar period in 2016. This slowdown was due to (i) slower growth in the agricultural sector at 3.1% as compared to a growth of 3.8% recorded in Q3’2016, due to the effects of the 2016/17 drought, and (ii) a slowdown in the growth of the financial intermediation sector, which expanded by 2.4%, down from 7.1% recorded in Q3’2016. Some of the key sectors that supported growth are tourism and transport that grew by 13.4% and 8.2%, respectively. The Kenya National Treasury, World Bank and IMF cut their 2017 GDP growth projections to 5.5%, 4.9% and 5.0% from 6.0%, 6.0% and 5.7%, respectively, at the beginning of the year. Reasons cited for the revision include:
- slower growth of the agricultural sector which grew by (1.1%), 1.4% and 3.1% in Q1, Q2 and Q3 of 2017, compared to 4.0%, 7.1% and 3.8% in Q1, Q2 and Q3 of 2016 following the prolonged 2016/17 drought,
- the interest rate cap, which led to a reduction in corporate earnings for commercial banks with EPS growth for Q3’2017 at (8.2%), compared to 15.1% in Q3’2016,
- political uncertainty during the year, and
- low private sector credit growth which averaged 2.4% in the first 10 months to October 2017 compared to a 5-year average of 14.4%.
Kenya’s Kshs 2.3 tn Budget for the current fiscal year 2017/18 was released, with a 72:28 split between recurrent and development expenditure. The budget, which increased by 2.4% from the 2016/17 Budget, focused on job creation, encouraged investments into the country through tax incentives, and improvement of living standards of the low income population through an increase in the lowest monthly taxable income to Kshs 13,489 from Kshs 11,135, as detailed in our Cytonn Q1’2017 Quarterly Markets Review. According to the Quarterly Economic and Budget Review for the first quarter of the Fiscal Year (FY) 2017/18, the Kenyan Government had only borrowed 43.8% of its first quarter foreign borrowing target, having borrowed Kshs 7.5 bn of the targeted Kshs 17.0 bn. The government signed a new 8-year commercial loan of Kshs 77.0 bn from the Eastern and Southern Africa Trade and Development Bank (TDB), formerly PTA Bank, at 6.7% above the 6-month London Interbank Offer Rate (Libor), currently at 0.6% to pay off debt holders of the 2015 syndicated loan, who declined to extend maturity. The government exceeded the first quarter of the FY’2017/18 spending targets for both recurrent and development expenditure at 102.4% and 102.9% absorption rates having spent Kshs 299.9 bn and Kshs 90.7 bn respectively. The total revenue collections for that quarter stood at Kshs 345.6 bn compared to the target of Kshs 388.0 bn, indicating that 89.1% of the target was met. The higher absorption rates coupled with lower revenue collection could lead to excessive demand for borrowing by the government, and yet they have not met their borrowing targets, meaning that there could be increased upward pressure on interest rates.
At the beginning of the year, we expected the Kenya Shilling to come under pressure due to (i) to expected strengthening of the dollar due to expectations of three Fed rate-hikes in 2017, and (ii) continued importation of capital goods for infrastructure and real estate investments, which was expected to have a negative effect on the current account position. However, the Shilling has remained resilient in 2017, only depreciating by 0.7% against the USD during the year to close at Kshs 103.2 from Kshs 102.5 at the beginning of the year, supported by (i) weakening of the USD in the global markets as indicated by the US Dollar Index, which shed 9.9% in 2017, and (ii) the CBK’s intervention activities, as they had sufficient forex reserves, which closed the year at USD 7.1 bn (equivalent to 4.7 months of import cover).
Inflation in 2017 has been characterized by rising food inflation in H1’2017 brought on by the drought, causing inflation to hit a high of 11.7% in May driven by food inflation. Towards the tail end of the year, inflation declined, hitting 4.5% in December driven by declining food prices, despite pressure from rising fuel prices. 2017 average inflation came in at 8.0% which is above the government annual target of 2.5% - 7.5%.
The graph below shows the summary of returns by asset class in 2017 (T- Bonds, T-Bills and Equities). The best performing asset in 2017 was equities, with NASI gaining 28.4% compared to (8.5%) in 2016, and the least returning was the 91-day T-bill at 8.4% p.a. The FTSE Bond Index improved significantly, gaining 16.5% from (0.2%) in 2016. Clearly, investors who did not have diversified and balanced portfolios, with exposures to equities and bonds, registered under-performance in 2017. The positive thing to note however is that all asset classes gained despite the political unrest witnessed during the year.
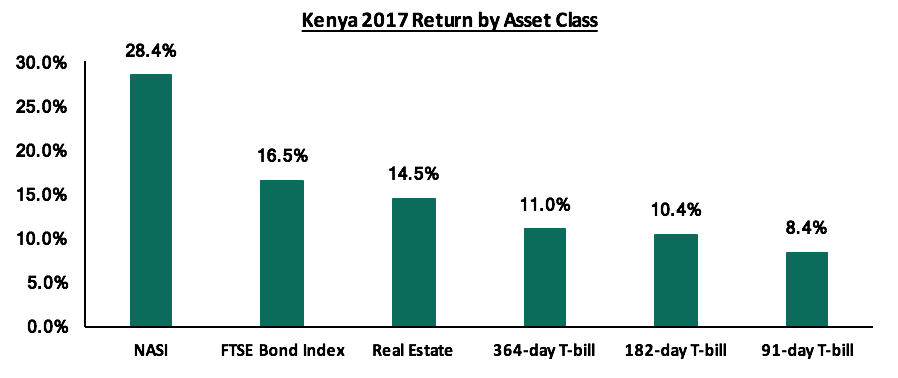
The NASI return is in Kshs and the T-bill returns are an annual average for 2017
The table below summarizes the seven macro-economic indicators that we track, the expectations at the beginning of the year, the actual 2017 experience and the impact of the same on the operating environment:
|
Macro-Economic Indicators |
2017 Expectations |
2017 Experience |
Effect |
|
GDP |
GDP growth of 5.4% - 5.7% in 2017 |
GDP growth for Q2’2017 came in at 5.0%, compared to 6.3% in Q2’2016, slowed down by a 1.7% decline in growth in agriculture, and financial intermediation that slowed to a growth of 4.3% from 8.1% recorded in Q2’2016. The World Bank has also cut the projections for 2018 and 2019 to 5.5% and 5.8% from 5.8% and 6.1% previously. Cytonn Investments revised downward their GDP growth expectations from 5.4% - 5.7% to between 4.7% - 5.2% |
Neutral |
|
Interest Rates |
A stable outlook on interest rates in 2017, with the CBR maintained at 10.0% |
The CBK has maintained the CBR at 10.0%, while remaining disciplined in the auction market and rejecting expensive bids, following the capping of interest rates |
Neutral |
|
Inflation |
Expected to average above the 2.5% - 7.5% government target |
Inflation declined to 4.5% in the month of December from 7.0% in January after touching a high of 11.7% in May. For 2017 it averaged 8.0%, on account of a decline in food prices brought about by improved weather conditions |
Neutral |
|
Currency |
Shilling to depreciate against major currencies |
The shilling has depreciated by 0.7% against the dollar YTD, following a relatively peaceful election period |
Positive |
|
Corporate Earnings |
Corporate earnings growth of 8.0% in 2017 due to lower earnings for commercial banks attributed to the cap on interest rates |
Banks have recorded a weighted average decline in core EPS of 8.2% in Q3’2017, compared to an average growth of 15.1% in Q3’2016. Non-Financial companies performed better, with Safaricom recording an EPS growth of 9.0% in H1’2018 |
Neutral |
|
Investor Sentiment |
Foreign investors to demand higher premiums due to political risks posed by elections and economic risk due to the planned rate hikes by the US Fed |
Investor sentiment has been positive, with foreign investors entering the market in search of attractive valuations, amid a relatively peaceful election period |
Positive |
|
Security |
Expect the government to put initiatives in place to ensure improved security. However, the 2017 election remains a challenge |
Despite political unrest in Q3, security has remained tight following the conclusion of the election period and going forward we expect the government to put in place strong measures to ensure there are no security threats facing the country |
Neutral |
During the year, T-bills auction recorded an oversubscription, with the subscription level coming in at 110.5% on average for 2017, lower than an average of 149.6% recorded in 2016. In 2017, the yield on the 91-day T-bill declined by 50 bps to 8.1% from 8.6%. Yields on the 182 and 364-day papers increased by 10 bps and 20 bps to 10.6% and 11.2% from 10.5% and 11.0% at the end of 2016, respectively. Yields on government securities remained relatively stable, mainly due to the Central Bank of Kenya’s (CBK’s) efforts to keep rates low by rejecting expensive bids. Following the enactment of the Banking (Amendment) Act, 2015, banks have preferred to lend to the less risky government as opposed to the riskier private sector. The government is behind its domestic borrowing target for the current fiscal year, having borrowed Kshs 87.9 bn, against a target of Kshs 205.1 bn (assuming a pro-rated borrowing target throughout the financial year of Kshs 410.2 bn budgeted for the full financial year as per the Cabinet-approved 2017 Budget Review and Outlook Paper (“BROP”).
Primary T-bond auctions in 2017 were oversubscribed on average, with the subscription rate averaging 100.2% due to the high liquidity in the money market. This is lower than the average subscription rate for 2016, which came in at 145.1%. The average acceptance rate for 2017 came in at 74.2%, as the market adjusted to the efforts of the CBK to maintain the rates at low levels, with tap sales being a common method used by the CBK throughout the year to tame expensive bids and maintain interest rates at low levels.
Despite the stable interest rate environment, there was decreased activity in the secondary bonds market as local institutional investors opted for the equities market, which gained 28.4% compared to the FTSE Bond Index, which gained 16.5% on a YTD basis. Bond turnover at the NSE declined by 2.2% to Kshs 419.0 bn in 2017 from Kshs 428.3 bn in 2016.
The graph below shows the evolution of the yield curve during the year, with yields declining for the medium to longer dated papers, given that the government was only accepting reasonable bids in the auction market resulting into a downward pressure on yields in the secondary market .
During the year, the money market was characterized by (i) high liquidity with an overall net liquidity injection of Kshs 168.6 bn, which was skewed towards the larger banks, and (ii) Central Bank of Kenya (CBK) actively participating in the money market through Kshs 486.2 bn worth of reverse repos in a bid to support small banks, by ensuring equitable liquidity redistribution in the interbank market. This was evidenced by the decline in average interbank rate which closed at 8.1% from 8.2% on 30th December 2016.
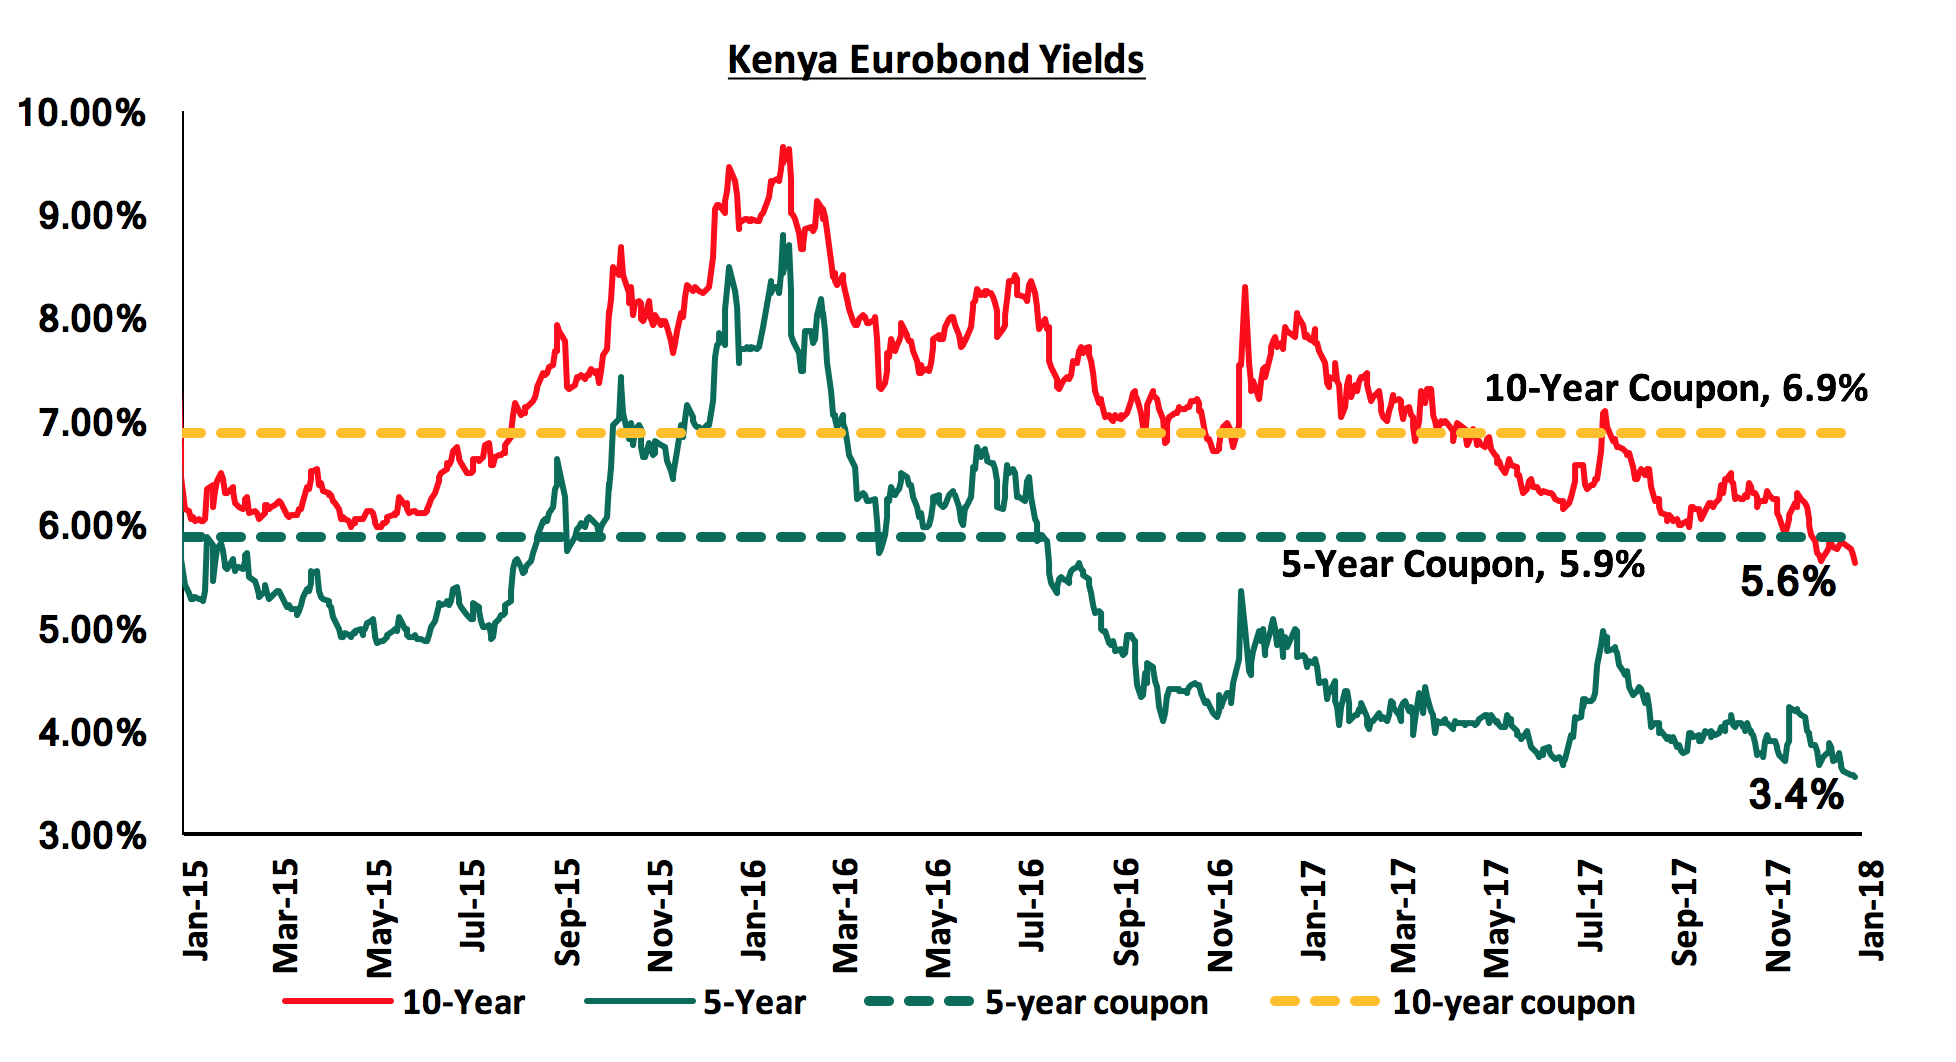
According to Bloomberg, yields on the 5-year and 10-year Eurobonds declined by 1.3% and 2.2%, respectively during the year. Since the mid-January 2016 peak, yields on the Kenya Eurobonds have declined by 5.4% points and 4.1% points for the 5-year and 10-year Eurobonds, respectively, due to the relatively stable macroeconomic conditions in the country. The declining Eurobond yields and stable rating by Standard & Poor (S&P) during the year, are indications that Kenya’s macro-economic environment remains stable and hence an attractive investment destination. However, concerns from Moody’s and the International Monetary Fund (IMF) around Kenya’s rising debt to GDP levels may see Kenya receive a sovereign credit rating downgrade.
Rates in the fixed income market have remained stable, and we expect this to continue in the short-term as the government rejects expensive bids despite being behind their borrowing target. However, a budget deficit that is likely to result from depressed revenue collection creates uncertainty in the interest rates environment as any additional borrowing in the domestic market to plug the deficit could lead to upward pressures on interest rates. Our view is that investors should be biased towards short-to medium-term fixed income instruments to reduce duration risk. What stood out during the year was Kenya’s rising debt to GDP level with the IMF and Moody’s Credit Rating Agency having raised concerns around this.
During the year, the Kenyan equities market was on an upward trend, with NASI, NSE 25 and NSE 20 gaining by 28.4%, 21.3% and 16.5%, respectively. Since the peak in February 2015, NASI and NSE 20 are down 3.6% and 32.5%, respectively. The top five large cap stock gainers during the year were DTB, KCB Group, Safaricom, Equity Group and Co-op which gained 62.7%, 48.7%, 39.7%, 32.5% and 21.2%, respectively. Key to note is that Safaricom continues to be a key part of Kenyan equities portfolios, accounting for 44.0% of Nairobi Stock Exchange (NSE’s) market capitalization, and has dominated on both the market turnover and also in determining the direction of the market given its weight, liquidity and the free float shares. See our Cytonn Weekly #50/2017 for a detailed analysis on the evolution of Safaricom’s share price and market capitalisation and its effect on the performance of the NSE and portfolio construction decisions.
Equity turnover during the year rose by 14.1% to USD 1,644.0 mn from USD 1,440.7 mn in FY’2016. Foreign investors turned net sellers with net outflow of USD 88.5 mn compared to net inflows of USD 86.9 mn recorded in FY’2016. The foreign investor outflows during the year can be attributed to negative investor sentiment, as a result of political uncertainty during the election period, which saw investors take profit following the stock market rally.
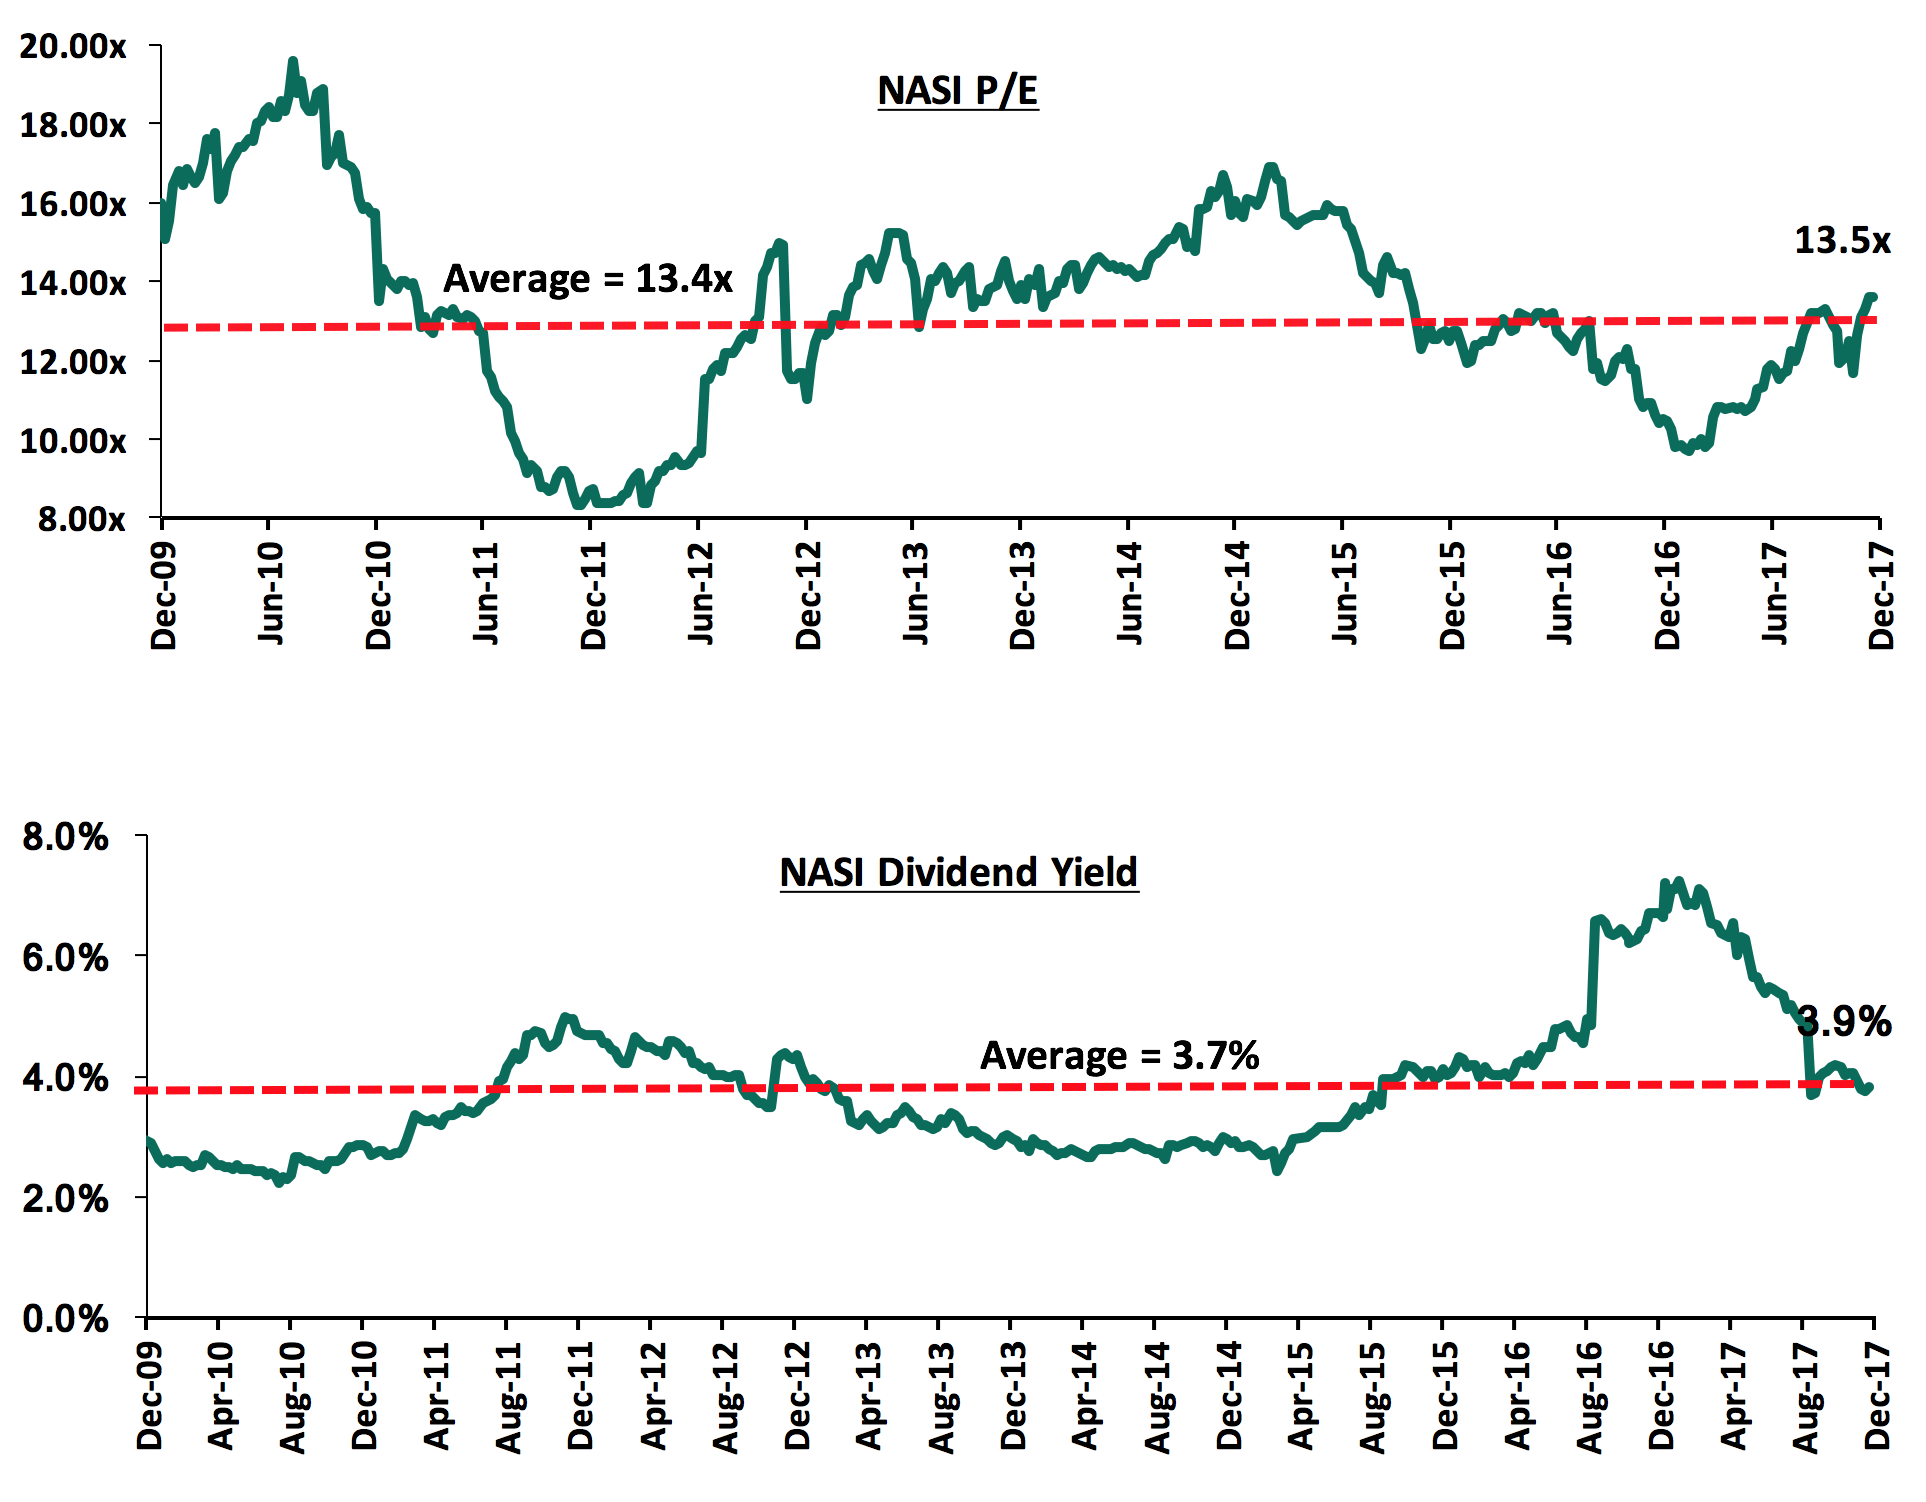
The market is currently trading at a price to earnings ratio (P/E) of 13.5x, slightly above the historical average of 13.4x, and a dividend yield of 3.9%, compared to a historical average of 3.7%, having started the year at 10.3x and 6.8% for P/E and dividend Yield, respectively. The charts below indicate the historical P/E and dividend yields of the market.
Corporate Earnings
During the year, Kenyan listed banks released their Q3’2017 results recording an average decline in core earnings per share of 8.2%, compared to an average growth of 15.1% in Q3’2016, owing to the tough operating environment as a result of the interest rate capping and prolonged political uncertainty in the country that affected the business environment. Only Stanbic Bank and KCB Group recorded growth in core earnings per share of 19.7% and 5.0%, respectively. Key to note is that the EPS growth by Stanbic Bank and KCB Group was supported largely by (i) an improvement in the hyper-inflationary environment in South Sudan that saw an adjustment in the expensing of the exceptional items for Stanbic Bank, and (ii) the restatement of the Q3’2016 earnings for KCB Group, which can be considered a one-off item. Other key highlights from the Q3’2017 performance include:
- Average deposit growth came in at 12.9%. However, despite the average deposits having grown, the interest expense paid on deposits recorded a negative growth of 1.0% on average, indicating that banks grew deposits but opening less interest earning accounts and possibly transferring some existing interest earning accounts to transaction accounts,
- Average loan growth was recorded at 6.3%, however interest income decreased by 6.1%, showing the effects of the rate caps,
- Investment in government securities grew by 15.2% outpacing loan growth of 6.3%, showing increased lending to the government by banks as they avoid the risky borrowers, and
- Non-funded income rose by 10.4%, which included a Fee and Commissions growth of 14.6%. This shows that banks charged more fee income to improve their total yield on loans above the rate cap maximum.
For a comprehensive analysis on the Kenya Listed Banks performance, see our Cytonn Q3’2017 Banking Sector Report
The listed insurance companies released their H1’2017 results, recording an average decline of 5.6% in core earnings per share, from an average gain of 69.4% in H1’2016. Jubilee Holdings and Liberty Holdings recorded impressive growth, but the overall performance was weighed down by Britam Holdings, which was the worst hit by the change in valuation methodology on the long-term insurance claims. The change in the valuation methodology to the Gross Premium Valuation from the Net Premium Valuation, as per the IRA requirements had a one-off effect of reducing Britam’s claims in H1’2016, due to the decline in Long-Term Insurance Liabilities by Kshs 2.2 bn in the period and hence the normalization in net insurance benefits and claims in H1’2017. The sector experienced marginal improvement in operational efficiency with the expense ratio declining to 54.3% from 55.5% in H1’2016 despite the loss ratio rising to 72.7% from 66.5% indicating increased claims in the industry. This resulted to the industry average combined ratio increasing to 127.0% from 122.0% in H1’2016 indicating that insurance companies are not profitable from their core business, and thus need to diversify to alternative revenue streams in order to boost their profitability. For more information on insurance sector H1’2017 performance, please see our Cytonn H1’2017 Insurance Report
Other key results
Safaricom Limited released H1’2018 results, recording a normalized EBITDA growth of 14.4% to Kshs 54.3 bn from Kshs 47.5 bn in H1’2017, after adjusting for a one-off item in 2016 of Kshs 3.4 bn. Core earnings per share (EPS) grew by 9.0% to Kshs 0.65 from Kshs 0.6 in H1’2017. The earnings growth was supported by a 12.0% growth in service revenue (M-PESA, messaging, mobile data, fixed service) to Kshs 109.7 bn from Kshs 98.0 bn in H1’2017 due to growth in active users and increased usage of non-voice services.
This year, 6 listed companies and 1 non-listed bank gave profit warnings to investors compared 11 companies in 2016. Companies are required to issue profit warnings if they project a more than 25% decline in profits year over year. They are namely Standard Chartered Bank, Deacons, Standard Group, Bamburi, BOC Kenya, Flame Tree and Family Bank:
- Standard Chartered Bank and Family Bank both attributed the losses to the effects of interest rate cap coupled with a slowdown in economic activity in the country,
- Standard Group attributed the drop to a the prolonged and disruptive election period. This is despite the expectations that most of the mainstream media houses would record booming business during election years given the demand for advertising space majorly by politicians,
- Bamburi attributed its drop to a weaker performance of the business in Kenya resulting from contraction of the cement market, partly due to poor private sector credit growth, drought conditions together with the effects of the pre and post-election periods as well as lower volumes to the Group's export markets,
- BOC Kenya attributed the drop to a lower level of sales due to depressed business activity and a credit adjustment made in prior year following a review of the methodology adopted by the Company in estimating stock obsolescence allowances,
- Deacons, a fashion retailer, attributes its expected loss to the extended electioneering period and non-performance and closure of some branches of major anchor tenants in several shopping malls such as Nakumatt Supermarket which reduced traffic, and
- Flame Tree’s expected decline is attributable to the challenging trading environment and write offs made on receivables. More companies, in comparison to the previous year, issued profit warnings mainly due to a harsher macro-economic environment mainly due to a prolonged electioneering period that did not provide a conducive environment for business.
Listings and Delistings
During the year, the Nairobi Securities Exchange (NSE) delisted the following companies:
- Baumann Limited over failure to adhere to regulatory requirements. Baumann was an investment firm with dealings in property, construction equipment and agriculture which had been suspended from trading at the NSE on May, 2008 for failing to meet listing conditions and full disclosure of operations and financials,
- Hutchings Biemer over failure to adhere to regulatory requirements. Hutchings was a dealer in furniture and had been suspended on February, 2001 due to non-compliance with the continuing disclosure obligations
- Vehicle dealer Marshalls East Africa: Marshalls reverted to private ownership after Global Ltd, the firm’s top shareholder with a stake of 13.9% decided to buy out retail shareholders
Legislations and other developments
The year 2017 saw enactment of a number of legislations and other developments that affected the equities market and investor sentiment, namely:
- Risk Based Supervision: All banks and mortgage finance institutions were required to formulate their own ICAAP (Internal Capital Adequacy Assessment Process), and provide comprehensive reports on their revised business models, that ensures that overall internal capital levels that are adequate and consistent with their strategies, business plans, risk profiles and operating environments
- Financial Services Authority (FSA) Bill 2017: The bill seeks to create the Financial Services Authority, a body that will consolidate and take over the functions of the Capital Markets Authority (CMA), the Insurance Regulatory Authority (IRA), the Retirement Benefits Authority (RBA) and the SACCOs Societies Regulatory Authority (SASRA). This is to provide a consolidated supervisory body for the entire non-banking financial services sector to eliminate regulatory gaps
- Movable Property Security Rights law 2017: The law facilitates use of movable assets as collateral for credit facilities. This law will (i) enhance the ability to access credit using movable assets, and (ii) provide an opportunity for banks to create a niche, especially in the SME and private household loans segment
- The Companies (General) (Amendment) Regulations, 2017: Requires that companies listed on the Nairobi Securities Exchange (NSE) to publish in their annual reports a breakdown of directors’ pay, in a bid to increase transparency and strengthen corporate governance
- Licencing of new commercial banks, following the temporary lifting of the moratorium: The banking sector has also experienced setting up new operations following the temporary lifting of the moratorium to license new banks, which has seen the licensing of Dubai Islamic Bank Limited (DIB) and Mayfair Bank Ltd.
- Chase Bank and Imperial Bank sale of majority stake: The Central Bank of Kenya (CBK) shortlisted potential investors in Chase Bank, and received a Non-binding offer for Chase Bank from SBM Holdings and it is expected that the proposed transaction will be concluded by the end of 2017. CBK has also shortlisted investors who expressed interest in taking an equity stake in Imperial Bank and they are expected to submit their formal proposals by January 15, 2018
In 2017, Kenya’s operating environment was characterised by harsh macro-economic conditions owing to prolonged electioneering period as well as drought making it unfavourable for business operation. However, despite the lower earnings growth prospects for 2017, the market has rallied and brought the market P/E back to its’ historical average of 13.6x but still below the most recent peak of 16.9x at the beginning of the year showing that pockets of value exist. We remain neutral on equities for investors with short-term investment horizon, but are positive for investors with a long-term investment horizon.
Private equity activity was high during the year. We highlight the major Private Equity deals, Mergers and Acquisition, Quoted Private Equity and fundraising deals in the region this year under the Financial Services, Hospitality, Education, Real Estate and Technology Sectors;
Financial Services Sector
Entry:
- The International Finance Corporation (IFC) acquired a 10.4% stake in insurance firm Britam Holdings. The transaction saw IFC inject Kshs 3.6 bn for an allocation of an additional 224.2 mn ordinary shares bringing the total to 2.2 bn outstanding shares, at a subscription price of Kshs 15.9 per share, a 58.5% premium to the previous closing price of Kshs 10.0 per share. The transaction was valued at P/B of 1.5x. The acquisition involved IFC indirectly acquiring 5.1% stake in Housing Finance Group, in which Britam owns a 48.8% stake. For more information on this, see our note International Finance Corporation invests in Britam
- Africinvest III, a special purpose vehicle (SPV) managed by Africinvest Capital Partners Management II, acquired a 14.3% equity stake in Britam Holdings Ltd. The transaction saw Africinvest III inject Kshs 5.7 bn for an allocation of 360.9 mn new ordinary shares at a subscription price of Kshs 15.9 per share, a 6.0% premium to the then market price of Kshs 15.0 per share. The transaction was valued at P/B of 1.4x For more information on this, see our note Africinvest III invests in Britam
- Diamond Trust Bank acquired 100% of Habib Bank Limited (HBL) Kenya through a share swap agreement, with the issuance of 13.3 mn new DTB ordinary shares to HBL, at a price per share of Kshs 137.4, amounting to Kshs 1.8 bn. The transaction was valued at a P/B of 0.8x. For more information on this, see our note Diamond Trust Bank Kenya Limited Acquires Habib Bank Limited Kenya
- South Africa’s insurance group Sanlam Group, through its subsidiary Sanlam Emerging Markets acquired a 75.0% stake in PineBridge Investments East Africa Limited in Kenya for an undisclosed amount. Following the acquisition, PineBridge was rebranded to Sanlam Investments East Africa Limited.
- Sanlam Kenya acquired an additional 12.0% stake in Gateway Insurance for Kshs 213.7 mn, bringing its total investment into the firm to Kshs 914.3 mn. It first acquired a 51.0% stake in the firm in 2015 for Kshs 561.0 mn, effectively valuing it at Kshs 1.8 bn, and later raised its stake in the firm to 56.0% following an additional injection of Kshs 139.6 mn. The transaction was valued at a P/B of 1.1x.
- Capitalworks, a Johannesburg-based private equity firm acquired the African operations of the UK-based multinational firm, Aon for an undisclosed amount. The transaction effectively saw Aon sub-Saharan Africa rebrand to Minet Group.
Exits:
- The government of Rwanda exited I&M Bank, Rwanda, through an IPO, where it held 99.0 mn shares representing a 19.8% stake. The shares were offered at a price of USD 0.1085 per share. The IPO was oversubscribed, as investors applied for 206,893,000 shares, representing a 209% subscription rate.
- Barclays Plc, through a series of transactions has reduced their stake in Barclays Africa from the initial 62.3% stake to a current holding of 14.8%. The share sale began in May 2016, when Barclays Plc. sold 12.2% of its shares to bring its stake in Barclays Africa to 50.1%. In May 2017, Barclays Plc sold 26.7% of shares in Barclays Africa, further reducing their shareholding to 23.4%. Barclays Plc further contributed amounts equivalent to 1.5% of its share capital towards a broad-based black economic empowerment scheme by Barclays Africa. The last share sale of 7.0% in December 2017 saw Barclays Plc’s stake in Barclays Africa stand at 14.8%, from where they will not be looking to divest further shareholding.
We expect that Investors will continue to show interest in the financial service sector, motivated by attractive valuations, coupled with increased capital requirements across the sector.
Technology Sector
- Kenyan IT multinational Craft Silicon acquired an undisclosed stake in restaurants listing portal EatOut for Kshs 51.5 mn (USD 0.5 mn). This was the second major backing of a local tech company by Craft Silicon. Craft Silicon is a founder-shareholder of Little, a cab hailing mobile application service, which is also backed by local telco giant Safaricom.
- Vodacom Tanzania, floated 560,000,100 new ordinary shares at Tshs 850 (USD 0.4), representing a 25.0% stake of the company post-listing. The IPO was fully subscribed after extending the deadline twice and opening the IPO to foreign investors. The IPO raised the target Tshs 476.0 bn (USD213.0 mn). Vodacom Tanzania was initially owned by Vodacom Group Limited and Mirambo Limited, who owned a 65% and 35% stake, respectively. Post listing, Vodacom Group Limited, Mirambo Limited and the public now hold, 48.7%, 26.2% and 25.0% stake, respectively. The share is currently trading at Tshs 850, having hit a high of Tshs 900 and a low of Tshs 750 since its listing in August 2017
Fundraising:
- Direct Pay Online received USD 5.0 mn (Kshs 519.0 mn) funding from Apis Partners, a London based private equity firm that focuses on financial services and growth market investment,
- Sendy, an on-mobile logistics company has received Kshs 207.6 mn (USD 2.0 mn) in equity investment from Dutch impact fund DOB Equity and CFAO Group, a multinational firm that is a fully owned subsidiary of Toyota Tsusho Corporation, for an undisclosed equity stake,
- Liquid Telecom raised Kshs 72.6 bn (USD 700.0 mn) through a bond issue with 8.5% interest per annum. In November, the firm floated a tap sale of the same bond and raised an additional Kshs 18.7 bn (USD 180.0 mn). The company, which has a presence in 13 African countries including Kenya, intends to use the funds to repay a Kshs 14.9 bn (USD 145 mn) loan.
The technology sector in Sub-Saharan Africa continues to attract investors whose interest is catalyzed by the rising need for tech products as more businesses seek to enhance efficiency and reduce costs. The rising number of tech hubs in Africa, which support the growth of tech startups by providing mentorship has also provided a platform through which investors can easily identify opportunities to invest in, with the successful capital raises an indication of investor appetite for businesses in the technology sector and a positive outlook on the future performance.
Hospitality Sector
- The Abraaj Group, a Dubai-based private equity investor acquired a 100% stake in Kenya’s Java House Group (Java) after it emerged the top bidder among a group of institutional investors including Actis, headquartered in London, Washington-based Carlyle Group and San Francisco-based TPG, who were all looking to acquire the food chain. The transaction, whose value was undisclosed, led to Washington-based Emerging Capital Partners (ECP) giving up their 90.0% stake in the business and the food chain’s founder Kevin Ashley his 10.0% stake.
- Simba Corporation, the parent company of Villa Rosa Kempinski, acquired a 35.0% stake in Hemngways Holdings Limited, the company that owns Hemingways Watamu, Ol Seki Hemingways Mara, and Hemingways Nairobi, for an undisclosed amount.
- Travel giant, Thomas Cook India Group, a travel company listed on the Bombay Stock Exchange, bought out Nairobi-based safari operator, Private Safaris for an undisclosed amount. Private Safaris is part of Kuoni’s Destination Management Specialists (DMS), which is one of Kuoni Group’s core activities.
The hospitality sector has continued to attract investors as a result of the recovery in the sector. The recovery has mainly been driven by (i) improved security in the country, (ii) aggressive marketing by the government, which has helped restore confidence among key international markets such as Europe and USA, (iii) International conferences held in Nairobi during the year such as the Africa Renewable Energy Leaders’ Summit, and Aid and Development Africa Summit Expo, and iv) incentives by the government such as the introduction of liberal entry for all African visitors into Kenya, removal of VAT charges on national park fees and the scrapping of visa fees for children under the age of 16-years.According to the Kenya National Bureau of Statistics, between January and September 2017, the number of international visitor arrivals increased by 10.3% at Jomo Kenyatta International Airport to 650,119 from 589,458 in the same period in 2016 and by 7.1% at Mombasa’s Moi International Airport to 70,257 from 65,600, indicating the growing demand in the sector.
Education Sector
- Actis, a London based private equity firm, launched the first African private higher education network, Honoris United Universities, bringing together the leading tertiary education institutions in North and Southern Africa. Actis is expected to spend at least USD 275.0 mn to acquire leading universities across nine African countries, which include Tunisia, Morocco, South Africa, Namibia, Mauritius, Botswana and Zimbabwe.
- Vumela Enterprise Development Fund, a fund managed by FNB Business Banking and Edge Growth, acquired an undisclosed stake in Nova Pioneer, an independent school network in South Africa offering pre-school through secondary education for students from ages 3 through 19. The transaction involved investment of USD 1.1 mn (Kshs 115.9 mn) in Nova Pioneer, which is part of the Nova Pioneer Education Group, which currently offers a primary and secondary school education in four Schools, all based in Johannesburg and is affiliated to Nova Pioneer Kenya that offers two secondary schools and a primary school.
We expect to see an increase in investment in the education sector in Sub-Saharan Africa, as investors are driven by (i) increasing demand for quality and affordable education, and (ii) support, such as ease of approvals, offered to investors in the education sector by governments looking to meet Sustainable Development Goals (SDGs) targets of universal access to tertiary education.
Real Estate Sector
- Cytonn Investments Private Equity division acquired 25.0% stake in Superior Homes Kenya Limited (SHK). SHK is the developer of the 160-acre Greenpark development on Mombasa Road. Cytonn expects to couple the capabilities of its development affiliate, Cytonn Real Estate, in land acquisition, sales and distribution and fundraising, with Superior Homes’ strong record in developing master-planned satellite communities to develop more neighborhoods such as Greenpark,
- Mace, a UK-based global construction and consultancy firm, acquired an undisclosed significant stake in Kenya’s quantity surveying firm YMR. YMR, which has worked on projects such as Two Rivers, Garden City and the Hub Karen, is headquartered in Kenya and has operations in Uganda, Tanzania, Rwanda, Burundi, Sudan, Ethiopia, Mauritius, Djibouti and Seychelles. The acquisition will see the business operate under the brand name MaceYMR.
We expect continued investments in the real estate sector by private equity investors driven by (i) the projected economic growth in Sub Sahara Africa, which is expected to be better compared to global markets in the long-term, and (ii) the continued growth of the real estate and construction industry in the region. In Kenya the real estate sector’s contribution to GDP over the last 7 years has grown from 12.6% in 2010 to 13.6% in 2016.
Private equity investments in Africa continues to remain robust as evidenced by the increase in the number of deals and the growing number of successful exits. The PE market in the year 2017 remained bullish recording increasing investor interest attributed to (i) rapid urbanization, a resilient and adapting middle class and increased consumerism, (ii) the attractive valuations in Sub Saharan Africa’s private markets, and (iii) better long-term economic projections in Sub Sahara Africa compared to global markets. We remain bullish on PE as an asset class in Sub-Sahara Africa.
In 2017, the real estate sector experienced a slow-down due to political uncertainty brought about by the extended electioneering period, oversupply in some segments such as the commercial office, and credit constrains due to the interest rate cap that led to reduced lending to the private sector, which resulted to slower credit to private sector growth of 2.4% as at October 2017 from a five year CAGR of 14.4%. This was evident with the KNBS Leading Economic Indicators October issue noting that the value of building approvals in Nairobi between January and July 2017 declined by 18.4% to Kshs 149.5 bn from Kshs 183.2 bn during the same period in 2016. Looking at performance, the sector recorded rental yields of 9.2% in commercial office, 9.6% in retail and 5.2% in residential sector, resulting to an average rental yield for the real estate market of 8.0%, compared to 7.8% in 2016. Capital appreciation came in at 6.5% in 2017 from 18.0% in 2016, the real estate sector therefore recorded a total returns of 14.5% in 2017 compared to returns of 25.8% in 2016, showing a slow-down in real estate operators’ returns. Development returns however, still remain high at on average more than 25.0%, given that real estate is a long term investment with a capital appreciation of 17.4% over the last 6 years
|
Annual Real Estate Returns Summary Table |
|||
|
|
2016 |
2017 |
Change |
|
Average Rental Yield |
7.8% |
8.0% |
0.2% |
|
Average Capital Appreciation |
18.0% |
6.5% |
(11.5%) |
|
Total |
25.8% |
14.5% |
(11.3%) |
|
· The slowdown in performance was a result of a steep decline in capital appreciation brought about by stagnated land prices in areas like Upperhill, Westlands, Kilimani among others, where prices are capping out · Development returns in the sector however remain high at on average more than 25.0% p.a driven by price appreciations of the units under development, profit margins and as real estate is a long term investment with a capital appreciation of 17.4% over the last 6 years |
|||
Residential: The residential sector recorded lower returns to investors with total returns of 10.3% in 2017, 2.6% points lower than the 12.9% total returns recorded in 2016. This was as a result of a 2.8% points decline in capital appreciation as rental yield increased by 0.3% points to 5.2% in 2017 from 4.9% indicating that the demand was for rentals as investors and home buyers in general adopted a wait and see approach during the electioneering period.
Commercial Sector (Office and Retail): The performance of commercial real estate softened in both office and retail with commercial office in recording 0.2% points and 2.0%, declines in occupancy rates, yields, respectively attributable to the slowdown in economic activities as a result of the elections and increased supply of commercial office space in the city which has an oversupply of 3.2mn SQFT of office space. The retail sector also as a result of increased supply, which grew by 41.0% y/y softened with rental yields in Nairobi averaging at 9.6% from 10.0% in 2016.
Hospitality: The hospitality sector depicted signs of recovery following the slump between 2011 and 2015 that was caused by insecurity and terrorist attacks. The recovery has been driven by improved security, aggressive marketing by the government among other government measures aimed at reviving the sector. However, the sector recorded a decline in performance with average daily rate coming in at 11,789 from 12,270 in 2016, a 3.9% decline. This was due to the political headwinds witnessed this year which saw the hotels’ occupancy rates decline as well by 4.6% points to 50.7% from 55.3% in 2016.
Land: The land sector continued to record a positive performance across various locations despite the political uncertainty with the Nairobi Metropolitan area recording a growth of 6.5% in 2017 resulting to a 6-years CAGR of 17.4%. However, areas like Muthaiga, Riverside and Ruai recorded a decline in appreciation attributed to a price correction, resulting in slower y/y capital appreciation of 6.5% in 2017 from 18.0% in 2016
Below is a detailed analysis of different real estate themes that we cover;
- Residential Sector
The residential sector recorded mixed performance with increased activity in the mid and low end markets, and a decline in activity and performance in the high end segment. The sector was heavily affected by the heated political landscape exacerbated by a tough economic environment especially from the interest rates cap law. This is evidenced by the decline in not only transaction volumes, but also in development activity over the year. As a result, the performance of the sector also slowed down with investor total returns dropping by 2.6% points to an average of 10.3% from last year’s 12.9%, attributable to the decline in transaction volumes, which resulted to lower capital appreciation.
The performance summary is as shown below:
|
Performance Summary Table - Residential (2016/2017) |
|||
|
2016 |
2017 |
Y/Y Change |
|
|
Uptake |
84.3% |
86.7% |
+2.4% |
|
Occupancy |
83.2% |
84.0% |
+0.8% |
|
Rental Yield |
4.9% |
5.2% |
+0.3% |
|
Price Appreciation |
7.9% |
5.1% |
(2.8%) |
|
Total Returns |
12.9% |
10.3% |
(2.6%) |
|
· Rental yields increased marginally y/y, attributable to the increase in average occupancy rates showing sustained demand for rental properties · Uptake increased this year to 86.7%, a 2.4% points increase simply attributable to the increased sales recorded for projects completed before this year · The total returns to investors however declined by 2.6% points from last year’s average of 12.9%, attributable to slow price appreciation rates this year as a result of the electioneering period and a slightly shaky macroeconomic environment which resulted in reduced demand |
|||
Source: Cytonn Research December 2017
In the sub-markets, the upper middle end segment recorded the highest returns to investors of 11.3%, followed by the lower end segment with 9.6%, and the high end market had the lowest performance with total returns to investors of 8.0%.
|
A: Lower Mid End |
|||||
|
Performance Summary for Lower Mid End |
|||||
|
Location |
Uptake (sales) |
Occupancy Rate |
Rental Yield |
Capital Appreciation |
Total Returns |
|
Komarock |
96.0% |
95.8% |
6.6% |
6.6% |
13.2% |
|
Donholm |
88.2% |
88.4% |
4.7% |
6.7% |
11.4% |
|
Athi River |
67.2% |
66.9% |
4.6% |
4.2% |
8.1% |
|
Kitengela |
69.4% |
73.8% |
3.6% |
10.9% |
8.0% |
|
Imara Daima |
83.4% |
81.0% |
5.2% |
4.5% |
7.4% |
|
Average |
80.8% |
81.2% |
4.9% |
6.6% |
9.6% |
|
· Donholm and Komarock were the best performing areas with average total returns of 11.4% and 13.2%, respectively due to high uptake and occupancy rates a result of affordability brought about by spatial arbitrage as well as the ongoing infrastructural development such as Outer Ring road · Kitengela however had the highest capital appreciation at 10.9%. in terms of uptake, Komarock and Imara Daima had the highest with 96.0% and 83.4%, respectively, attributable to an increased investor appetite for satellite towns |
|||||
Source: Cytonn Research December 2017
|
B: Upper Mid End |
|||||
|
Performance Summary for Upper Mid End |
|||||
|
Location |
Uptake (sales) |
Occupancy Rate |
Rental Yield |
Capital Appreciation |
Total Returns |
|
Kileleshwa |
91.3% |
96.1% |
10.7% |
7.7% |
18.3% |
|
Riverside |
82.4% |
91.2% |
5.9% |
5.1% |
10.9% |
|
Lavington |
96.3% |
90.2% |
5.5% |
5.2% |
10.7% |
|
Parklands |
92.8% |
83.2% |
5.7% |
4.3% |
9.8% |
|
Kilimani |
84.1% |
70.7% |
5.1% |
5.3% |
10.4% |
|
Spring Valley |
87.1% |
87.8% |
4.3% |
3.2% |
7.5% |
|
Average |
89.0% |
86.5% |
6.2% |
5.1% |
11.3% |
|
· Kileleshwa and Riverside had the best returns to investors at 10.9% and 18.3%, respectively, attributable to high capital appreciation rates, as a result of their close proximity to CBD creating sustainable rental demand |
|||||
|
|
|||||
Source: Cytonn Research December 2017
|
C: High End |
|||||
|
Performance Summary for High End |
|||||
|
Location |
Uptake (sales) |
Occupancy Rate |
Rental Yield |
Capital Appreciation |
Total Returns |
|
Karen |
94.0% |
71.0% |
4.7% |
8.5% |
12.7% |
|
Runda |
84.0% |
79.4% |
5.2% |
3.7% |
8.9% |
|
Kitisuru |
89.5% |
87.0% |
4.4% |
2.0% |
6.4% |
|
Loresho |
84.8% |
4.3% |
1.6% |
5.9% |
|
|
Lower Kabete |
94.6% |
87.6% |
3.3% |
2.5% |
5.8% |
|
Average |
89.4% |
81.3% |
4.4% |
3.7% |
8.0% |
|
· Karen was the best performing market in the high end segment with 12.7% returns a high capital appreciation as it has relatively lower land price compared to the other high end areas with an acre in Karen selling for Kshs 52mn on average against an average of Kshs 70-100mn an acre in other high end areas · Generally the high end segment recorded low capital appreciation rates compared to other areas with an average of 3.7%, a factor attributable to the increased surplus in the high end market which has led to price stagnation and also high costs of land in these areas |
|||||
Source: Cytonn Research December 2017
Investors continued to cash in on the sector with some of major projects launched this year including Cytonn Investments’ ‘The Ridge’, a 10-acre luxurious development comprising of residential and serviced apartments in Ridgeways, ‘RiverRun’, a master planned community seated on a 100 acres in Ruiru, ‘Cytonn Towers’, a comprehensive mixed-use project in Kilimani ,Uriithi Housing Cooperative’s Osten Terrace and Panorama Gardens in Kangundo Road and Thika, respectively, and Tatu Waters by Tatu City’s developers, Reandeavor in Ruiru. On the statutory front, the government introduced a tax incentive whereby developers constructing more than 100 houses annually will receive a 15.0% tax reduction and we thus expect an increase in development of affordable housing in the country.
Generally, we expect the residential market to pick up in 2018 with (i) better performance continuing to be recorded in the mid and low mid end segments as investor appetite for the same continues in a bid to curtail the housing deficit , while also (ii) gaining impetus further from the expected government’s affordable housing initiative and (iii) Probable increase in credit to the private sector, if the interest rates cap law is revised, which is set to encourage more activity from the developers’ side. We expect a drastic turn around for the high end market especially with the proposed review of zoning regulations for some of the exclusive Nairobi suburbs such as Spring Valley, Kyuna, Loresho, Lavington and Dagoretti, to make them high density areas, a factor that is bound to lead to the said regions experiencing increased development and thus, immediate land price hikes.
- Commercial Sector
In 2017, the performance of commercial real estate was affected by the tough economic and operating environment characterized by reduced credit supply and an extended electioneering period as well as an oversupply in the commercial office theme in the Nairobi Metropolitan region. Below is a summary of commercial office and retail themes:
- Commercial Office
In 2017, the performance of commercial office theme in Nairobi softened with rental yields, and occupancy rates declining by 0.2% points and 3.4% points, respectively. The low performance can be attributed to:
- An oversupply in the sector with Nairobi having an oversupply of 3.2mn SQFT which is expected to increase by 21.9% in 2018 to 3.9mn SQFT,
- the reduced economic activities as a result of the extended electioneering period
Asking rents declined by 2.0% to Kshs 101 from Kshs 103 per sqft y/y as a result of the increase in supply decreasing occupancy rates by 3.4%y/y.
|
Summary of Commercial Office Returns in Nairobi Over Time |
||||||||||||
|
Year |
FY’15 |
FY’16 |
Q1’17 |
H1’17 |
Q3’17 |
∆ Q4 (2017) |
FY’17 |
∆ Q1 (2017) |
∆ H1 (2017) |
∆ Q3 (2017) |
∆ Q4 (2017) |
∆ Y/Y 2016/17 |
|
Occupancy (%) |
89% |
88% |
86% |
86% |
84% |
82.4% |
84.6% |
(1.8%) |
(0.4%) |
(1.9%) |
(1.6%) |
(3.4%) |
|
Asking Rents (Kshs/Sqft) |
97 |
103 |
102 |
100 |
101 |
101 |
101 |
(0.6%) |
(2.3%) |
1.0% |
0.0% |
(2.0%) |
|
Average Prices (Kshs/Sqft) |
12,776 |
13,003 |
13,211 |
13,103 |
13,055 |
12,864 |
13,058 |
1.6% |
(0.8%) |
(0.4%) |
(1.5%) |
0.4% |
|
Average Rental Yields (%) |
9.3% |
9.4% |
9.0% |
9.2% |
9.1% |
9.3% |
9.2% |
(4.8%) |
2.8% |
(0.1%) |
0.2% |
(0.2%) |
|
Commercial office market softened y/y between 2016 and 2017 with occupancy rates and yields declining by 3.4% points, 0.2% points, respectively attributable to the slowdown in economic activities as a result of the elections and increased supply of commercial office space in the city which increased by a 6-year CAGR of 34.0% |
||||||||||||
Source: Cytonn Research
In terms of submarket analysis in Nairobi, Karen, Parklands and Westlands were the best performers in 2017 as a result of their superior locations, enabling them to charge premium on rentals. The areas attracted yields of 10.3%, 9.8% and 9.5%, respectively. Nairobi CBD and Mombasa Road had the lowest returns recording average rental yields of 8.4% and 8.5%, respectively. This is attributable to poor quality offices, which are mostly Grade C’s, and poor location with the CBD being characterized by congestion and insufficient parking spaces and Mombasa Road being affected by traffic jams.
|
(All Prices in Kshs unless stated otherwise) |
||||||||||
|
Nairobi Commercial Office Submarket Performance 2016 -2017 |
||||||||||
|
Area |
Price/SQFT 2017 |
Rent/SQFT 2016 |
Rent/SQFT 2017 |
Occupancy (%) 2016 |
Occupancy (%) 2017 |
Rental Yields (%) 2016 |
Rental Yields (%) 2017 |
∆ Rent Y/Y |
∆ Occupancy Y/Y |
∆ Rental Yields Y/Y |
|
Karen |
14,583 |
107 |
125 |
90.0% |
91.1% |
9.7% |
10.3% |
16.5% |
1.1% |
0.6% |
|
Parklands |
12,571 |
102 |
104 |
80.0% |
84.8% |
10.0% |
9.8% |
2.0% |
4.8% |
(0.2%) |
|
Westlands |
12,861 |
102 |
106 |
92.1% |
86.4% |
9.2% |
9.5% |
3.6% |
(5.7%) |
0.3% |
|
Kilimani |
13,017 |
99 |
101 |
90.5% |
85.4% |
9.3% |
9.4% |
1.7% |
(5.1%) |
0.1% |
|
UpperHill |
12,733 |
102 |
98 |
89.8% |
79.8% |
9.0% |
8.9% |
(3.9%) |
(10.0%) |
(0.1%) |
|
Msa Road |
11,646 |
80 |
81 |
86.1% |
75.0% |
8.5% |
8.5% |
0.9% |
(11.1%) |
0.0% |
|
Nairobi CBD |
12,250 |
92 |
90 |
92.7% |
77.3% |
9.0% |
8.4% |
(2.7%) |
(15.4%) |
(0.6%) |
|
Average |
12,809 |
98 |
100 |
88.7% |
82.8% |
9.2% |
9.3% |
2.6% |
(5.9%) |
0.0% |
|
· Karen, Parklands and Westlands were the best performing offices markets recording average rental yields of 10.3%, 9.8% and 9.5%, respectively due to superior locations. · Nairobi CBD and Mombasa Road were the worst performing markets due to poor quality offices and congestion. Notably the CBD recorded a 15.4% decline in occupancy rates from 92.7% to 77.3% due to exit of corporates such as Ecobank to more prime business districts in Westlands |
||||||||||
Source: Cytonn Research
Highlights for the office sector in 2017 include the opening of a grade-A 54,000 sqft green building in Milimani dubbed ‘Vienna Court’ and the 25-storey FCB Mirhab in Kilimani. The supply of office space is expected to continue increasing in the next 5-years with the launching of developments such as Pinnacle Towers in Upperhill and Cytonn Towers in Kilimani and Kasarani Investment Holdings Ltd development expected to begin construction of a business park comprising of 600,000 sqft of office space, a hospital, hotel and a residential village adjacent to the Garden City Mall along Thika Road, in November 2017.
We expect the slowdown in performance to continue in the short to medium term mainly as a result of the oversupply of office space which was 3.2mn sqft in 2017 and expected to grow by 21.0% to 3.9mn sqft in 2018. The is an opportunity in Grade A office space which are undersupplied accounting for only 10.0% of office space in Nairobi. In terms of returns grade A offices and serviced offices still have high returns with rental yields of 10.0% and 13.4%, respectively compared to 9.2% for conventional office space.
- Retail Sector
Like the office market, the retail market softened in 2017, recording average rental yields of 8.3% from 8.7% in 2016 and average occupancy rates of 80.6% from 82.9% in 2016.in Key urban centres such as Nairobi, Kisumu, Eldoret and Mombasa. In Nairobi, the returns also softened with rental yields declining by 0.4% points from 10.0% in 2016 to 9.6% in 2017, with occupancy rates declining by 9.0% points from 89.3% in 2016 to 80.3% in 2017 in Nairobi. The constrained performance was attributed to:
- a tough operating environment characterized by reduced credit supply from 8.6% in 2016 to a 10-month average of 1.6% in 2017,
- the wait and see attitude adopted by investors due to the 2017 general elections,
- internal challenges facing retailers on supply chain management and financing specifically Uchumi and Nakumatt, and
- increased supply of mall space, that increased by 41.6% y/y in Nairobi alone to 5.6mn SQFT in 2017 from 3.9mn SQFT in 2016 through the opening of malls like Southfield Mall in Embakasi.
|
Kenya’s Retail Sector Performance 2016-2017 |
|||
|
Item |
FY’ 2016 |
FY’ 2017 |
∆ Y/Y |
|
Asking Rents (Kshs/SQFT) |
154.9 |
141.0 |
(9.0%) |
|
Occupancy (%) |
82.9% |
80.2% |
(2.7%) |
|
Average Rental Yields (%) |
8.7% |
8.3% |
(0.4%) |
|
The average rental yields declined by 0.4% points, from 8.7% last year while occupancy rates reduced by 2.7% points to 80.2% from 82.9% in 2016, attributable to increased supply in some submarkets like Nairobi which recorded a 41.6% increase in supply and a tough economic environment lowering retailers returns hence a reduction in expansion measures by retailers |
|||
Nairobi submarkets performance softened across all nodes in 2017, rental yields declined by 0.4% y/y to 9.6% from 10.0% as a result of decreased occupancy rates that fell to an average of 80.3% from an average 89.3% in 2016, that was occasioned by increased supply. Westlands and Karen were the best performing submarkets. High rental yields for Westlands are as a result of proximity to the CBD and high rental rates, while Karen posted high yields due to its prime rents, affluent population and lower competition. The worst performing node was the Nairobi Eastlands, with yields of 6.1% and highest decline in occupancy rates by 23.3% points from 85.0% to 61.8% due to increased retail space with Southfield Mall adding 220,000sqft of lettable space.
|
Summary of Nairobi’s Retail Market Performance 2016-2017 |
||||||||
|
Location |
Rent Kshs/SQFT 2017 |
Occupancy 2017 |
Rental Yield 2017 |
Occupancy 2016 |
Rental Yield 2016 |
% Change in Occupancy Y/Y |
% Change in Yield Y/Y |
Reason for Negative/Positive Change in Yield/Occupancy |
|
Westlands |
234.7 |
91.0% |
13.5% |
92.0% |
12.3% |
(1.0%) |
1.2% |
10.4% increase in rental rates y/y |
|
Karen |
206.2 |
96.3% |
11.2% |
96.3% |
12.5% |
0.0% |
(1.2%) |
9.8% decline in rental rates y/y |
|
Kiambu & Limuru Road |
216.1 |
78.2% |
10.6% |
90.0% |
10.1% |
(11.8%) |
0.4% |
277.4% increase in supply hence decline in occupancy rates |
|
Kilimani, Kileleshwa & Lavington |
181.0 |
87.0% |
10.3% |
86.0% |
10.6% |
1.0% |
(0.3%) |
Relative change in occupancy for some malls |
|
Thika Road |
199.2 |
75.3% |
8.7% |
89.3% |
10.0% |
(14.0%) |
(1.3%) |
16.5% increase in supply hence decline in occupancy rates |
|
Ngong Road |
170.7 |
81.8% |
8.7% |
93.3% |
9.7% |
(11.6%) |
(0.9%) |
Decline in occupancy due to competition from Karen and Kilimani |
|
Mombasa Road |
180.4 |
68.8% |
8.3% |
83.3% |
8.2% |
(14.6%) |
0.1% |
188.5% increase in supply |
|
Satellite Towns |
130.1 |
82.5% |
7.7% |
88.3% |
9.3% |
(5.8%) |
(1.6%) |
Drastic decline in occupancy rates due to a 29.1% increase in supply |
|
Nairobi Eastlands |
148.9 |
61.8% |
6.1% |
85.0% |
7.5% |
(23.3%) |
(1.4%) |
Decline in occupancy rates due to a 45.2% increase in supply |
|
Average |
185.2 |
80.3% |
9.6% |
89.3% |
10.0% |
(9.0%) |
(0.4%) |
|
|
· Performance softened across all nodes with yields declining by 0.4% points y/y as a result of increased supply which increased by 41.6% y/y leading a 9.0% points decline in occupancy levels y/y · Westlands and Karen were the best performing submarkets, with a yields of 13.5% and 11.2%, respectively, with Karen having the highest average occupancy rates of 96.3%. This is due to the fact that they are high end neighborhoods hosting most of Nairobi’s middle end and high end populations |
||||||||
Source: Cytonn Research
Regional Retail Performance
Similar to Nairobi, performance across select key urban cities in Kenya softened with Mt. Kenya Region having the highest declines with occupancy and rental yields declining by 10.0% and 1.0%, respectively. Mombasa recorded a slight increase in occupancy rates of 6.1% resulting in a 0.1% points increase in yields to 7.3% from 7.2% in 2016. Eldoret’s performance remained largely unchanged though it was still the worst performing node with average rental yields of 6.6% mainly due to low rental rates as shown below:
|
Summary of Retail Market Performance in Key Urban Cities in Kenya 2016-2017 |
|||||||
|
Location |
Rent Kshs/SQFT 2017 |
Occupancy 2017 |
Rental Yield 2017 |
Occupancy 2016 |
Yield 2016 |
Change in Occupancy Y/Y |
Change in Yield Y/Y |
|
Nairobi |
185.2 |
80.3% |
9.6% |
89.3% |
10.0% |
(9.0%) |
(0.4%) |
|
Kisumu |
150.2 |
75.0% |
9.1% |
75.0% |
9.4% |
(0.0%) |
(0.3%) |
|
Mt Kenya |
136.0 |
80.0% |
9.1% |
90.0% |
10.1% |
(10.0%) |
(1.0%) |
|
Mombasa |
130.3 |
82.8% |
7.3% |
76.7% |
7.2% |
6.1% |
0.1% |
|
Eldoret |
96.0 |
83.3% |
6.6% |
83.3% |
6.6% |
0.0% |
0.0% |
|
Average |
140.7 |
80.2% |
8.3% |
82.9% |
8.7% |
(2.7%) |
(0.4%) |
|
· Despite the decline in performance, Nairobi was still the best performing region, with average yields of 9.6% and occupancy rates of 80.2% on average, this is attributable to higher rents charged by malls in the City due to higher quality of retail spaces supplied · Eldoret had the lowest yield of 6.6%, which is due to the low rental rates charged within that market of on average Kshs 96 per SQFT , 44.2% lower than the market average of Kshs 172 per SQFT, this is however likely to change in the future following the development of high quality malls in the Town such as the newly opened Rupa Mall and the upcoming Highway Mall |
|||||||
Source: Cytonn Research
The main highlights for the retail sector for 2017 include the adoption of expansion strategies by both local and international retailers that included LC Waikiki and Woolworths opening stores at the Hub, Karen, plans by Java House to take up 2,800 sqft of space at Crystal rivers mall, Athi River with operations scheduled to kick off in early 2018 and Carrefour the French based retailer that is scheduled to open a fourth outlet in January 2018 at the Junction Mall, where the retailer will cover 5,000 SQM of prime retail space. Paradigm shifts in the retail sector were witnessed with the closure of several Nakumatt branches due to insolvency and cash-flow challenges leading to increased foothold of international retailers such as Carrefour and Souk Bazaar taking up space previously occupied by the former leading retailer. In terms of expansion, Rosslyn Riviera Mall, Two Rivers Mall and the newly expanded Village Market formally opened their doors, with the malls adding 116,00 SQFT 700,000 SQFT and 230,000 SQFT of space to the sector, respectively. However, in a bid to effect operational efficiency, renowned retail store Tuskys shut down its operations in one of its CBD stores, Tuskys Beba Beba, following a recent closure of its Sheikh Karume Branch.
We expect reduced development activity of malls in 2018 due to the current large supply. However, our outlook for the sector in 2018 is positive as the sector continues to attract both local and international retailers driven by i) a conducive macro-economic environment, with an average GDP growth of above 5.0% over the last 5-years, ii) a low retail penetration rate of 35.0% that serves as an incentive for formal retailers compared to a formal retail penetration of 60.0% in South Africa , and iii) closure of spaces occupied by underperforming retail chains such as Uchumi and Nakumatt, hence opening up an opportunity for other retailers in the Kenyan market.
- Hospitality Sector
In 2017, the hospitality sector depicted signs of recovery following the slump between 2011 and 2015 that was caused by insecurity and terrorist attacks. The recovery has been driven by:
- improved security,
- aggressive marketing, which has helped restore confidence among key international markets such as Europe and USA,
- international conferences held in Nairobi during the year such as the Africa Renewable Energy Leaders’ Summit, and Aid and Development Africa Summit Expo, and
- government incentives such as the introduction of liberal entry for all African visitors into Kenya, removal of VAT charges on national park fees and the scrapping of visa fees for children under the age of 16-years.
However, during the year, the sector struggled due to:
- concerns over security during the elections period and the recent political impasse over the presidential elections, which led to either cancelled or postponement of visits by tourists into the country, and
- increased supply of hotel rooms and serviced apartments, which has resulted in a large bed capacity and thus reducing growth in room occupancy.
Despite the challenges, we have seen growth of hotels and serviced apartments in Nairobi with the opening and breaking ground of facilities during the year, an indication of attractive investment opportunities in the sector.
Below are tables showing some of the hotels opened and launched during the year;
|
Opened in 2017 |
||
|
Hotel |
Location |
No. of Rooms |
|
The Lazizi Premiere |
Mombasa Road, JKIA |
144 |
|
Park Inn by Radisson |
Westlands |
140 |
|
Four Points by Sheraton, JKIA |
Mombasa Road, JKIA |
172 |
|
Total |
|
456 |
|
Launched in 2017 |
|||
|
Hotel |
Location |
Opening Date |
No. of Rooms |
|
Nairobi Serena(Expansion) |
Nairobi |
2018 |
40 |
|
Ole Sereni(Expansion) |
Mombasa Road |
2018 |
154 |
|
Cytonn Towers |
Kilimani |
2020 |
180 |
|
Pinnacle |
Lavington |
2020 |
255 |
|
Total |
|
|
629 |
According to the KNBS Leading Economic Indicators October Issue, the number of tourist arrivals during the period between January and September 2017 at Jomo Kenyatta International Airport and Moi International Airport increased by 10.0% to 720,376 persons from 655,058 during the same period, compared to a 17.8% increase from 2015 to 2016, indicating slow demand for hotel services.
Below is a summary of the performance of the hotels by rating;
|
Hotel Performance |
|||||||||
|
|
ADR 2016(Ksh) |
ADR 2017(Ksh) |
%∆ |
RevPAR 2016(Ksh) |
RevPAR 2017(Ksh) |
%∆ |
Occupancy 2016 |
Occupancy 2017 |
%∆ |
|
3star |
7,574 |
7,672 |
1.3% |
4,149 |
3,793 |
(8.6%) |
54.8% |
49.4% |
(5.4%) |
|
4star |
13,418 |
12,164 |
(9.3%) |
8,260 |
6,872 |
16.8% |
61.3% |
56.5% |
(4.8%) |
|
5star |
15,818 |
15,530 |
(1.8%) |
7,863 |
7,148 |
(9.1%) |
49.7% |
46.0% |
(3.7%) |
|
Average |
12,270 |
11,789 |
(3.9%) |
6,757 |
5,938 |
(12.1%) |
55.3% |
50.7% |
(4.6%) |
|
· Occupancy in both 2016 and 2017 was highest in 4 star hotels at 61.3% and 56.5%, respectively, indicating the growing demand for accommodation in 4-star hotels compared to the 3 and 5-star, which have lower occupancy levels · The average occupancy decreased from 55.3% in 2016 to 50.7% in 2017, and this we attribute to 2017 being an electioneering year hence putting off guests for fear of political disturbance |
|||||||||
Source: Cytonn Research, STR
In the serviced apartments segment, Westlands/Parklands was the best performing area with yields of 7.3% compared to the market average of 5.8% as it charges the highest rates per square metre and had high occupancy at 77.8% in 2017 as shown in the table below;
|
Serviced Offices Performance in Nairobi |
||||||
|
Node |
Market Share |
Monthly Charge per SM |
Devt Cost per SM |
Occupancy 2016 |
Occupancy 2017 |
Rental Yield |
|
Westlands/Parklands |
40.4% |
2,519 |
209,092 |
84.6% |
77.8% |
7.3% |
|
Kilimani |
25.9% |
2,592 |
202,662 |
78.0% |
74.0% |
7.2% |
|
Kileleshwa/Lavington |
7.3% |
2,369 |
206,132 |
85.0% |
70.0% |
7.0% |
|
Upperhill |
7.4% |
2,333 |
206,711 |
6.6% |
||
|
Limuru Rd |
1.8% |
1,686 |
231,715 |
86.7% |
80.0% |
4.5% |
|
Nairobi CBD |
8.3% |
1,684 |
224,571 |
78.0% |
70.0% |
4.2% |
|
Mombasa Rd |
5.8% |
1,367 |
200,757 |
64.0% |
3.1% |
|
|
Thika rd (Muthaiga North) |
3.1% |
910 |
200,757 |
78.5% |
69.0% |
2.6% |
|
Average |
1,949 |
210,300 |
81.8% |
72.1% |
5.8% |
|
Source: Cytonn Research
We expect the serviced apartments market to grow with the launch of a number of developments such the Britam Serviced Apartments in Kilimani, Cytonn Serviced Apartments in Westlands, Cytonn Towers in Kilimani, The Ridge in Ridgeways and Pinnacle Towers in Upperhill. The Pinnacle Towers will be operated by the Hilton Group.
The opportunity in the hospitality sector lies in 4-star hotels in Nairobi as they are the best performing with occupancy of 56.5% in 2017. On location, Upperhill, Kilimani and Kiambu/Limuru Rd are the most viable for hotel investment. For the serviced apartments, the opportunity lies in areas such as Upperhill, Lavington and Kileleshwa, where supply is relatively low. For more details on supply and performance in the hospitality sector, see the Cytonn Hospitality Report 2017.
We expect the hospitality sector to recover in 2018 supported by increased international arrivals due to sustained demand for business and tourism travel, increased government incentives, increased marketing efforts by the government & the industry players and a stable macroeconomic environment.
- Land
In the year 2017, land continued to attract developers and investors, informed by the positive performance recorded across various locations despite the political uncertainty brought about by the extended electioneering period. Nairobi Metropolitan area, recorded an appreciation of 6.5% in 2017 leading to a 6-year CAGR of 17.4%. Satellite Towns such as Utawala, Juja, Athi River, Ongata Rongai and Ruiru recorded the highest capital appreciation of 18.5%. Land prices in Nairobi reported an increase in asking price with only Riverside, Old Muthaiga and Ruai witnessing a land price correction with prices dropping by (0.5%), (7.2%) and (5.8%), respectively, over the same period.
The land performance was positively affected mainly by the relaxation of zoning regulations in areas such as Spring Valley and Kilimani, and improved infrastructure such as sewer lines and road network.
The summary of the performance of the theme in the year 2017 is as outlined below:
All values in Kshs unless stated otherwise
|
Summary of Price change over 6 years in Nairobi Metropolitan Area |
||||||
|
Location |
*Price in 2011 |
*Price in 2016 |
*Price in 2017 |
6-year CAGR |
% Price change from 2011 |
2017 Annual Capital appreciation |
|
Satellite Towns - Unserviced Land |
9m |
21m |
22m |
18.5% |
2.88 |
7.8% |
|
Nairobi Suburbs - High Rise Residential Areas |
46m |
97m |
103m |
15.7% |
2.44 |
7.6% |
|
Satellite Towns - Site and service schemes |
6m |
14m |
15m |
18.9% |
3.2 |
6.3% |
|
Nairobi Suburbs - Low Rise Residential Areas |
56m |
106m |
109m |
13.1% |
2.11 |
6.0% |
|
Nairobi Suburbs - Commercial Areas |
156m |
458m |
478m |
20.7% |
3.1 |
4.4% |
|
Average |
17.4% |
2.75 |
6.5% |
|||
|
*Asking prices of land are per acre |
||||||
Source: Cytonn Research
The key highlights are as follows;
- Land prices in commercial zones such as Kilimani, Nairobi CBD, Westlands and Upperhill recorded a 6-year CAGR of 20.7%, attributable to the high plot ratios allowing for densification of developments, hence high demand due to attractive returns on investment after development and also due to the increased migration of firms to commercial nodes away from the CBD creating demand in areas such as Westlands, Upperhill and Kilimani,
- Land prices in high rise residential zones such as Kahawa, Githurai, Kasarani, Embakasi and Dagoretti recorded a 6-year CAGR of 15.7%, also attributable to the premium associated with high plot ratios allowing for land use maximization,
- Land prices in areas allowed for low rise residential houses such as Karen, Kitisuru and Runda recorded a 6-year CAGR of 13.1%. This is lower than other areas i.e. zoned for high rise residential and commercial zones, which can be associated to limiting plot ratios on land, reducing the return on investment on land,
- Unserviced land prices in Nairobi satellite towns such as Athi River, Juja, Ngong’ and Rongai recorded a 6-year CAGR of 18.5% due to improved infrastructure opening up the areas for development while serviced land in these areas recorded a 6-year CAGR of 18.9%, attributable to the value add attributable to the amenities provided.
Overall, in the Nairobi Metropolitan area, Satellite Towns and areas such as Kilimani, Ridgeways, Karen, Ongata Rongai and Juja present the best investment opportunity, supported by high capital appreciation, zoning regulations relaxation and increased investment in infrastructure including roads and sewerage.
The land sector continued to record investments in 2017 with various transactions such as Rendeavour, the group behind Tatu City, expanding the master plan by buying an additional 2,500-acres of land adjacent to the master plan. Initially on 2,500-acres, the new master plan will now be 5,000-acres. Uriithi Housing handed over a 1,200-land project in Malindi to its members who bought the land as a joint investment initiative and E-Farm Housing Co-operative Society deepened its investment portfolio with the acquisition of 300-acres of land in Embu as part of its growth and diversification plan targeting investors who want to invest in agribusiness. The society also endeavours to provide 5,000 low-cost houses in Konza, Juja, Nanyuki, with a target price of Kshs 1.0 mn for a one-bedroom unit.
In conclusion, the outlook for the land sector remains positive backed by: i) improved demographics evidenced by the growth of middle income population who have an increasing purchasing power indicating sustained demand, ii) high returns with land prices growing at a 6-year CAGR of 17.4% iii) an enabling macro-economic environment shown by the waiver of land title search fees, iv) improved infrastructure that exposes areas for investment and v) the relaxation of zoning regulations that facilitates optimal land use.
- Listed Real Estate Sector
During the year, Stanlib Fahari I-REIT released their H1’17 earnings, registering a 220.8% growth in earnings per unit to Kshs 0.43 per unit from Kshs 0.13 per unit in H1’2016 attributable to a 30.0% decline in operating expenses to Kshs 112.5 mn from Kshs 160.8 mn in H1’2016 and a 14.2% increase in rental income to Kshs 138.0 mn from Kshs 120.9 mn in H1’2016 from the 3 real estate assets they own; Greenspan Mall, Bay Holdings and Signature International Properties. The decline in expenses was because of the one-off set up and listing costs such as promotional and marketing expenses incurred in H1’2016. In addition, the I-REIT had no debt in H1’2017, thus no financing costs compared to the previous period, which had Kshs 23.0 mn in financing costs. The I-REIT manager did not recommend the distribution of an interim dividend. From our projections, the I-REIT had a 5.9% dividend yield at market price as at 11th August, assuming a 92% pay-out from its distributable earnings, similar to the 2016 dividend pay-out. For a more comprehensive analysis, see our Stanlib Fahari Reit Earnings Note.
On the bourse, Stanlib’s Fahari I-REIT price declined by 13.4% year to date closing the market at Kshs 10.3 down from Kshs 11.9 at the beginning of the year and shedding 50.5% from its listing price of Kshs 20.8 in November 2015. In addition, Fahari I-REIT is trading at a discount of 47.8% to its Net Asset Value per share, which currently stands at Kshs 19.75 as per H1’2017 reporting. The prices for the instrument have remained low averaging at Kshs 11.3 in 2017 largely due to:
- opacity of exact returns from the underlying assets,
- poor dividend yield of 5.9% as at 11th August assuming a 92% pay-out ratio from distributable earnings compared to government securities such as T- bills yields which are currently at 8.1%, 10.6% and 11.2% for the 91-day, 182-day and 364-day papers, respectively and market average yields of 2% and 9.6% for office and retail sectors, respectively and
- conservative investors preferring to invest in brick and mortar real estate, equities and other securities on the stock exchange that they are conversant with, which also resulted in undersubscription of Fusion D-REIT in 2016.
- poor market sentiment given this was the first REIT and it has left investors with losses and then the second REIT attempt, Fusion DREIT, failed

To boost the Listed Real Estate sector, the Capital Markets Authority (CMA), in July 2017, backed the exemption of REITs from Value Added Tax (VAT), which accrues to both rent and professional services, in addition to exemption from stamp duty and capital gains tax. The regulator hopes that this incentive will spur interest in the product that opens up the property market to retail investors. In our view, REIT managers also need to align their interests with those of investors to ensure higher earnings, thus boost investor appetite for the product. There is a need for the industry to accept alternative financing to real estate such as REITs and other forms of structured products to reduce reliance on bank funding which currently forms the bulk of real estate finance. Players in the industry have started working towards this with the formation of the East African Forum for Structured Products (EAFSP) by promoters and issuers of structured products with the aim of educating the investment community and developers on structured products and alternative investments thus facilitate uptake of structured products and alternative investments in general.
In 2017, Kenya’s real estate sector was set back by the effects on the elections. We remain cautiously optimistic on its performance going forward. The increased focus by institutional developers in the sector indicates growth but competition is expected to be stiff as clients and investors demand for quality developments.
- Including this final report, the Annual Markets Review, we produced 52 reports in 2017. The Cytonn Report continues to be a fair, rigorous, objective and analytical report solely focused on informing the investor. We look forward to another successful year of analysing the markets in 2018. We will publish our Cytonn Annual Market Outlook at the end of January, 2018. Don’t miss it and Happy New Year!
- We continue to showcase our real estate developments through weekly site visits. Watch progress videos and pictures of The Alma, Amara Ridge, The Ridge, and Taraji Heights. The site visits target both investors looking to invest in real estate directly and those interested in high yield investment products to familiarize themselves with how we support our high yields. Key to note is that our cost of capital is priced off the loan markets where all-in pricing ranges from 16.0% to 20.0% and our yield on real estate developments ranges from 23.0% to 25.0%, hence our top-line gross spread is about 6.0%. If interested in attending the site visits, kindly register here
- We continue to see very strong interest in our Private Wealth Management training (largely covering financial planning and structured products), which is at no cost, and is held bi-weekly, but is open only to pre-screened participants. We also continue to see institutions and investment groups interested in the trainings for their teams. The Wealth Management Trainings are run by the Cytonn Foundation under its financial literacy pillar, and if interested in the training for your employees or investment group please get in touch with us through clientservices@cytonn.com or book through this link Wealth Management Training. To view the wealth management training topics click here
- For recent news about the company, see our news section here
- We have 10 investment-ready projects, offering attractive development and buyer targeted returns of around 23.0% to 25.0% p.a. See further details here: Summary of investment-ready projects
- To invest in any of our current or upcoming real estate projects, please visit Cytonn Real Estate
- Cytonn Towers, where we are only selling residential units in the first phase of residential apartments, is currently about 20.0% sold. See Cytonn Towers
- The Alma, which is 55.0% sold. See The Alma
- Amara Ridge has currently 100.0% uptake. See Amara Ridge
- Situ Village is currently 22.0% sold. See Situ Village
- The Ridge (Phase 1) is currently 31.0% sold. See The Ridge
- Taraji Heights is currently 14.0% sold. See Taraji Heights
- RiverRun Estates (Phase 1) is currently 11.0% sold. See RiverRun Estates
- With over 10 investment ready projects worth over Kshs 82.0 billon of project value, we shall be very selective on new real estate projects going forward, only focusing on Joint Ventures and real estate opportunities with deep value. We are increasingly focused on private equity deals. Should you have any deals in banking, insurance, education, hospitality and technology sectors, kindly email a teaser to PE@cytonn.com
- We continue to beef up the team with ongoing hires for a Senior Manager, Hospitality and Hospitality Business Manager, among others. Visit our website Careers at Cytonn to apply.

- Talk to us
- Kenya
- P.O Box 20695 - 00200, Nairobi, Kenya
- Cell +254709101200
- Tel +254709101200
- WhatsApp +254741676635
- United States
- +254709101200
- DOWNLOAD OUR APP
-


- Kenya
- 8th Floor, Pinetree Plaza, Kaburu Drive, Ngong Road, Nairobi, Kenya
- USA
- Suite 1150, 1775 Eye Street NW, USA, Washington DC 20006, USA
- Investments
- High Yield
- Private Equity
- Real Estate
- Real Estate
- RiverRun Estates
- Cytonn Towers
- The Ridge
- Taraji Heights
- The Alma