Cytonn Monthly-April 2021
By Research Team, May 2, 2021
Executive Summary
Fixed Income
During the month of April, T-bill auctions recorded an undersubscription, with the subscription averaging 89.1%, down from 111.5% recorded in March due to tight liquidity in the money market. The highest subscription rate was in the 364-day paper, which came in at 91.1%, a decrease from 157.2% recorded the previous month. The subscription for the 91-day and 182-day papers declined to 54.6% and 20.6%, respectively, from 100.6% and 60.1% in March;
The primary bond market was active with the government initially offering an infrastructure bond IFB1/2021/018 which was 147.6% subscribed, having received bids of Kshs 88.6 bn compared to Kshs 60.0 bn offered. There are still two bonds opened, FXD2/2019/15 and FXD1/2021/25 with tenors of 13 years and 25 years respectively whose offer period ends on 4th May 2021;
During the week, T-bills were oversubscribed, with the overall subscription rate coming in at 125.0%, up from 59.8% recorded the previous week. Investors continued their preference for the 364-day paper which recorded the highest subscription rate of 245.4%, an increase from 86.9% recorded the previous week. The subscription on the 182-day increased to 37.5% from 20.1% recorded the previous week, while the subscription for the 91-day paper declined to 42.7%, from 91.5% recorded the previous week. The inflation rate for April declined to 5.8%, from the 5.9% recorded in March due to a higher base effect despite the overall increase in the prices across the entire basket;
Equities
During the month of April, the equities market was on an upward trajectory, with NASI, NSE 20 and NSE 25 gaining by 6.6%, 1.1% and 4.1%, respectively. The equities market performance was driven by gains recorded by large cap stocks such as Safaricom, Bamburi, EABL and Diamond Trust Bank Kenya (DTB-K), which gained by 11.3%, 9.6%, 7.4%, and 4.0%, respectively. The gains were however weighed down by losses recorded by stocks such as Co-operative Bank, Standard Chartered Bank and BAT, which declined by 7.6%, 5.5%, and 4.5%, respectively. During the month, the Central Bank of Kenya released the Quarterly Economic Report for Q4’2020, highlighting that the banking sector’s total assets grew by 2.9% to Kshs 5.4 tn, from Kshs 5.3 tn recorded in Q3’2020;
Real Estate
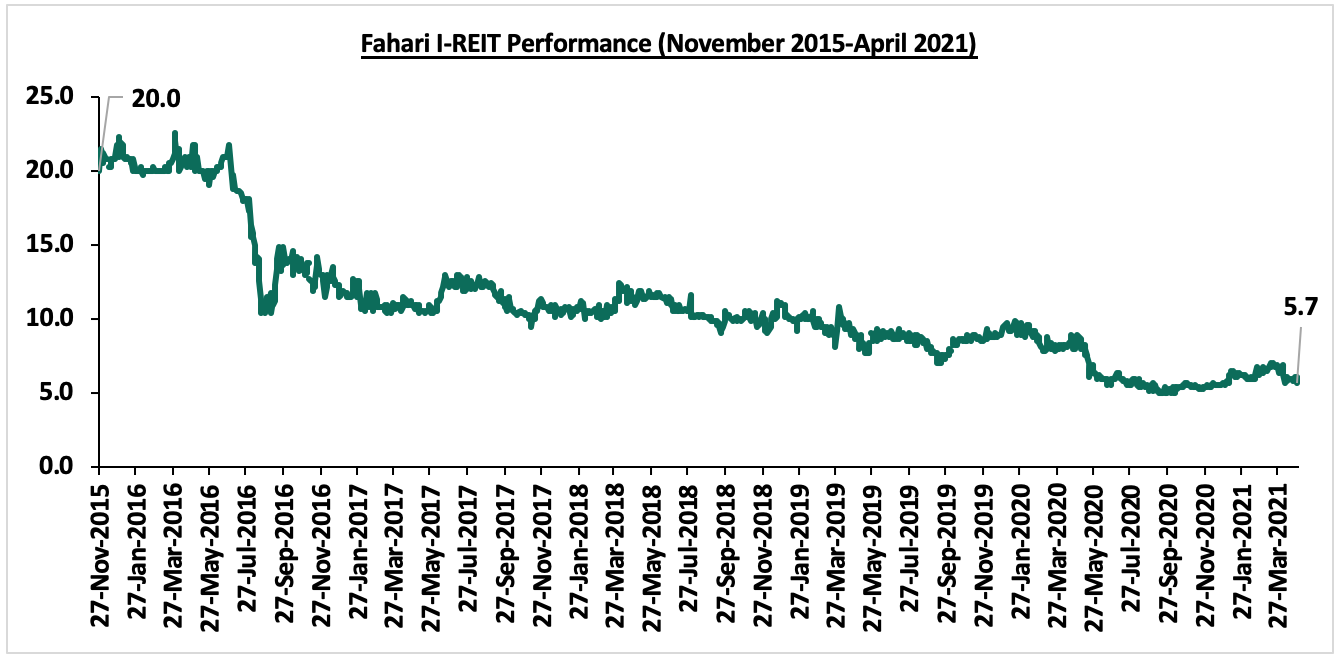
In the Central Bank of Kenya’s (CBK), Quarterly Economic Review October-December 2020 report, the real estate sector recorded a 6.4% increase in the gross non-performing loans in Q4’2020 to Kshs 61.4 bn from Kshs 57.7 bn in Q3’2020. In the residential sector, property developer Buxton Point Apartment Limited began demolitions at Buxton Estate, located in Mombasa County, to pave way for 1,860 affordable housing units. In the retail sector, French retailer Carrefour Supermarket opened a new store in Nairobi Garden City Mall along Thika Road taking up space that was vacated by Shoprite Supermarket. Naivas Supermarket also opened a new outlet in Nakuru while Artcaffe Group, a restaurant chain based in Kenya, announced plans to open four new outlets within the Nairobi Metropolitan Area. In the hospitality sector, the United States of America (USA) retained the highest travel advisory after the Centers for Disease Control (CDC) issued a Level Four Travel Health Advisory. The Kenyan government and the United Kingdom (UK) announced plans to form a joint committee to review the travel restrictions that triggered a tit-for-tat travel blockade between UK and Kenya over rising Covid-19 risk levels. In the infrastructure sector, the Government of Kenya, through the State Department of infrastructure released Kshs 3.1 bn to complete tarmacking of the 192.0 km Kabati-Migwani-Mbondoni road in Kitui. In the land sector, President Uhuru Kenyatta officially launched the National Land Information Management System (NLIMS) marking the culmination of years of digitization of land records in Kenya. In listed real estate, the Fahari I-REIT closed the month at Kshs 5.7 per share, trading at an average of Kshs 6.0 during the month, a 28.5% loss of value from Kshs 8.4 recorded during the same period in 2020;
Investment Updates:
- Weekly Rates:
- Cytonn Money Market Fund closed the week at a yield of 10.52%. To invest, just dial *809#;
- Cytonn High Yield Fund closed the week at a yield of 14.49% p.a. To invest, email us at sales@cytonn.comand to withdraw the interest you just dial *809#;
- Justin Mwangi, an investment analyst at Cytonn Investments, had an interview with CNBC Africa to discuss how NSE performed in the first quarter of 2021, watch Justin here;
- We continue to offer Wealth Management Training daily, from 9:00 am to 11:00 am, through our Cytonn Foundation. The training aims to grow financial literacy among the general public. To register for any of our Wealth Management Training, click here;
- If interested in our Private Wealth Management Training for your employees or investment group, please get in touch with us through wmt@cytonn.com;
- Cytonn Insurance Agency acts as an intermediary for those looking to secure their assets and loved ones’ future through insurance namely Motor, Medical, Life, Property, WIBA, Credit, Fire and Burglary insurance covers. For assistance, please get in touch with us through insuranceagency@cytonn.com;
Real Estate Updates:
- For an exclusive tour of Cytonn’s real estate developments, visit: Sharp Investor's Tour, and for more information, email us at sales@cytonn.com;
- Phase 3 of The Alma by Cytonn is now ready for occupancy. To rent please email properties@cytonn.com;
- We have 10 investment-ready projects, offering attractive development and buyer targeted returns. See further details here: Summary of Investment-ready Projects;
Hospitality Updates:
- We currently have promotions for Daycations and Staycations, visit com/offers for details or email us at sales@cysuites.com;
For recent news about the group, see our news section here.
Money Markets, T-Bills & T-Bonds Primary Auction:
During the month of April, T-bill auctions recorded an undersubscription, with the overall subscription rate coming in at 89.1%, down from 111.5% recorded in March. The 364-day paper despite having the most demand saw a decline in its subscription rate to 90.1%, a decrease from 157.2% recorded the previous month. The subscription rate for the 91-day and 182-day papers declined to 54.6% and 20.6%, respectively, from 100.6% and 60.1% recorded in March. The yields on the 364-day, 182-day and 91-day papers rose by 21.5 bps, 9.9 bps and 5.2 bps to 9.5%, 8.0% and 7.1%, respectively. Consequently, the government accepted a total of Kshs 72.1 bn, out of the Kshs 85.6 bn worth of bids received as they sought to contain rates.
During the week, T-bills were oversubscribed, with the overall subscription rate coming in at 125.0%, up from 59.8% recorded the previous week. Investors continued their preference for the 364-day paper which recorded the highest subscription rate at 245.4%, an increase from 86.9% recorded the previous week, as the paper has an attractive rate of 9.5%, which is higher than the rate for most bank placements. The subscription on the 182-day increased to 37.5% from 20.1% recorded the previous week, while the subscription for the 91-day paper declined to 42.7% from 91.5% recorded the previous week. The yields on 364-day, 182-day and 91-day papers rose by 1.4 bps, 6.4 bps and 2.4 bps, respectively, to 9.5%, 8.0% and 7.1%. The government continued rejecting expensive bids by accepting 67.8% of the bids received, amounting to Kshs 20.3 bn, out of the Kshs 30.0 bn worth of bids received.
During the month, the Primary Bond Market recorded an oversubscription with the IFB1/2021/018 infrastructure bond, having the overall subscription rate at 147.6%. The increased appetite for the bond was mainly due to its tax-free status and its attractive yield as the bond had a weighted yield of 12.7% comparable to a Yield to Maturity of 13.2%, on a normal bond with the assumption of a 10.0% withholding tax for a bond with the same effective tenor. The bond had a tenor of 18.0 years and a coupon rate of 12.7%. The government was looking to raise Kshs 60.0 bn, they received bids worth Kshs 88.6 bn, and accepted only Kshs 81.9 bn, translating to an acceptance rate of 92.5%. The Central Bank of Kenya also re-opened a previously issued bond, FXD2/2019/15 with an effective tenor of 13.0 years.
The government has also opened bidding for two more bonds FXD2/2019/15 and FXD1/2021/25 with tenors of 13 years and 25 years respectively whose offer period ends on 4th May 2020. The coupon on rate on the 15 years is 12.8% while that of the 25 years is market determined. We recommended bidding of the two bonds at 13.0%-13.1% and 13.8%-13.9% for each bond respectively.
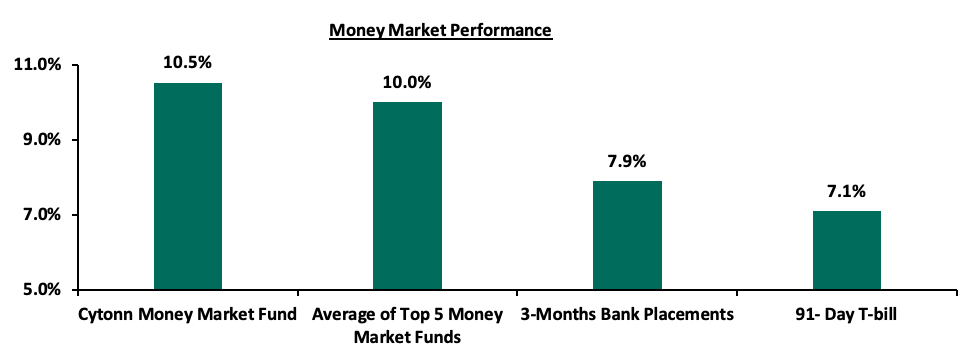
In the money markets, 3-month bank placements ended the week at 7.9% (based on what we have been offered by various banks), while the yield on the 91-day T-bill increased by 2.4 bps to 7.1%. The average yield of the Top 5 Money Market Funds remained unchanged at 10.0%. Similarly, the yield on the Cytonn Money Market Fund remained unchanged at 10.5%. The table below shows the Money Market Fund Yields for Kenyan fund managers as published on 30th April 2021:
|
Money Market Fund Yield for Fund Managers as published on 30th April 2021 |
|||
|
Rank |
Fund Manager |
Daily Yield |
Effective Annual Rate |
|
1 |
Cytonn Money Market Fund |
10.01% |
10.52% |
|
2 |
Nabo Africa Money Market Fund |
9.50% |
9.93% |
|
3 |
Zimele Money Market Fund |
9.56% |
9.91% |
|
4 |
Alphafrica Kaisha Money Market Fund |
9.41% |
9.82% |
|
5 |
GenCapHela Imara Money Market Fund |
9.37% |
9.82% |
|
6 |
Madison Money Market Fund |
9.12% |
9.54% |
|
7 |
CIC Money Market Fund |
8.95% |
9.27% |
|
8 |
Sanlam Money Market Fund |
8.98% |
9.22% |
|
9 |
Dry Associates Money Market Fund |
8.64% |
8.99% |
|
10 |
Co-op Money Market Fund |
8.39% |
8.75% |
|
11 |
British-American Money Market Fund |
8.39% |
8.72% |
|
12 |
Apollo Money Market Fund |
8.43% |
8.50% |
|
13 |
ICEA Lion Money Market Fund |
8.03% |
8.36% |
|
14 |
NCBA Money Market Fund |
8.02% |
8.32% |
|
15 |
Old Mutual Money Market Fund |
6.82% |
7.04% |
|
16 |
AA Kenya Shillings Fund |
5.45% |
5.59% |
Secondary Bond Market:
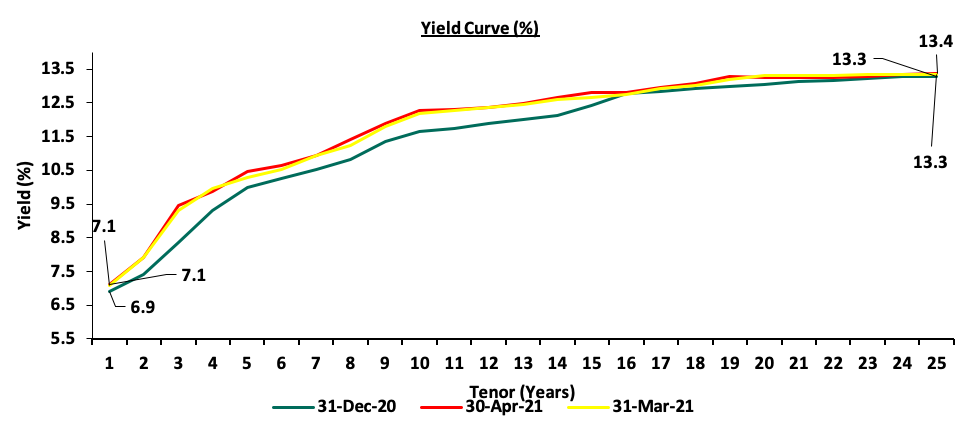
In the month of April, the yields on government securities in the secondary market remained relatively stable, while the bond turnover declined by 10.4% to Kshs 61.3 bn, from Kshs 66.2 bn recorded in March. The FTSE NSE bond index declined by 0.3%, to close the month at 96.8, bringing the YTD performance to a decline of 1.3%.
The chart below is the yield curve movement during the period;
Liquidity:
Liquidity in the money markets remained volatile as we saw an increase in the interbank rate to a high of 5.8% but ended the month at an average of 5.1%, a 0.1% points decline from the March average rate of 5.2%. During the week, liquidity in the money market improved, with the average interbank rate declining to 5.2%, from 5.6% recorded the previous week, attributable to government payments which offset tax remittances. The average interbank volumes decreased by 47.9% to Kshs 6.4 bn, from Kshs 12.2 bn recorded the previous week. According to the Central Bank of Kenya’s weekly bulletin, released on 30th April 2021, commercial banks’ excess reserves came in at Kshs 13.0 bn in relation to the 4.25% Cash Reserve Ratio.
Kenya Eurobonds:
During the month, the yields on all Eurobonds were on a downward trajectory. The yield on the 10-year Eurobond issued in September 2014 declined to 3.2% from 3.6% in March. The yields on the 10 year and the 30-year Eurobond issued in 2018 declined to 5.7% and 7.7%, from 6.3% and 8.0%, respectively. Additionally, the yields on the 2019 issued dual-tranche Eurobond with 7-years and 12-years declined to 5.0% and 6.7% in April, from 5.6% and 7.1%, respectively in March.
During the week, the yields on Eurobonds recorded mixed performance, with the yields on the 10-year Eurobond issued in June 2014 and the 10-year bond issued in 2018 remaining unchanged at 3.2% and 5.7%, respectively while the yields on the 30-year bond issued in 2018, the 7-year bond and the 12-year bond issued in 2019 rose to 7.7%, 5.0% and 6.7% from 7.6%, 4.9% and 6.6%, respectively.
|
Kenya Eurobond Performance |
|||||
|
|
2014 |
2018 |
2019 |
||
|
Date |
10-year issue |
10-year issue |
30-year issue |
7-year issue |
12-year issue |
|
31-Dec-2020 |
3.9% |
5.2% |
7.0% |
4.9% |
5.9% |
|
31-March-2021 |
3.6% |
6.3% |
8.0% |
5.6% |
7.1% |
|
23-April-2021 |
3.2% |
5.7% |
7.6% |
4.9% |
6.6% |
|
26-April-2021 |
3.2% |
5.7% |
7.6% |
5.0% |
6.7% |
|
27-April-2021 |
3.2% |
5.7% |
7.6% |
5.0% |
6.7% |
|
28-Aprilr-2021 |
3.3% |
5.8% |
7.7% |
5.0% |
6.7% |
|
29-Aprilr-2021 |
3.2% |
5.7% |
7.7% |
5.0% |
6.7% |
|
30-April-2021 |
3.2% |
5.7% |
7.7% |
5.0% |
6.7% |
|
Weekly Change |
0.0% |
0.0% |
0.1% |
0.1% |
0.1% |
|
Monthly Change |
(0.4%) |
(0.6%) |
(0.3%) |
(0.6%) |
(0.4%) |
|
YTD Change |
(0.7%) |
0.5% |
0.7% |
0.1% |
0.9% |
Source: Reuters
Kenya Shilling:
During the month, the Kenya Shilling appreciated by 1.8% against the US Dollar to close the month at Kshs 107.8, from Kshs 109.8 recorded at the end of March 2021, mostly attributable to the lackluster dollar demand from general importers. During the week, the Kenyan shilling appreciated against the US dollar by 0.6% to Kshs 107.8 from Kshs 108.5 recorded the previous week. On a YTD basis, the shilling has appreciated by 1.2% against the dollar, in comparison to the 7.7% depreciation recorded in 2020. We expect the shilling to remain under pressure in 2021 as a result of:
- Rising uncertainties in the global market due to the Coronavirus pandemic, which has seen investors continue to prefer holding their investments in dollars and other hard currencies and commodities, and,
- Continued strengthening of the US Dollar against major currencies as evidenced by a YTD gain of 2.1% in the ICE U.S. Dollar Index as compared to a 6.7% decline in 2020. The ICE U.S. Dollar Index is a benchmark index that measures the international value of the US Dollar where investors can monitor the value of the US Dollar relative to a basket of six other world currencies.
The shilling is however expected to be supported by:
- The Forex reserves, currently at USD 7.7 bn (equivalent to 4.7-months of import cover), which is above the statutory requirement of maintaining at least 4.0-months of import cover, and the EAC region’s convergence criteria of 4.5-months of import cover,
- The improving current account position which narrowed to 4.8% of GDP in the 12 months to December 2020 compared to 5.8% of GDP during a similar period in 2019, and,
- Improving diaspora remittances evidenced by a 27.1% y/y increase to USD 290.8 mn in March 2021, from USD 228.8 mn recorded over the same period in 2020, has cushioned the shilling against further depreciation.
Weekly Highlights:
Inflation
The y/y inflation for the month of April declined to 5.8%, from the 5.9% recorded in March despite witnessing a 0.4% points increase to 0.8% month on month. This was the first decline since September. The decline can be attributable to the higher base effect. From the table below its clear that the transport index has had the greatest increase on a year on year but for the month of April, the food prices were the highest as the fuel prices were held stable.
|
Major Inflation Changes – April 2021 |
|||
|
Broad Commodity Group |
Price change m/m (April-21/March -21) |
Price change y/y (April-21/Aprily-20) |
Reason |
|
Food & Non-Alcoholic Beverages |
1.7% |
6.4% |
The m/m increase was mainly contributed by increases in prices of tomatoes, cabbages and potatoes among other food items |
|
Housing, Water, Electricity, Gas and other Fuel |
0.4% |
3.9% |
The m/m increase was as a result of increase in the cost of charcoal and house rent |
|
Transport Cost |
0.3% |
17.2% |
The m/m marginal increase was mainly on account of unchanged prices of diesel and petrol |
|
Overall Inflation |
0.8% |
5.8% |
The m/m decline was due to a slower growth of 0.3% in transport cost as compared to the 2.3% increase seen in March 2021 |
Going forward, we expect the inflation rate to remain within the government’s set range of 2.5% - 7.5% despite the high fuel prices. Food prices are likely to remain low due to favorable rainfall received.
Monthly Highlights
- Stanbic Bank released the Monthly Purchasing Managers’ Index (PMI) for March 2021, which came in at 53.2, an increase from the 51.4 recorded in December 2020. The reading was the lowest decline recorded in nine months since the economy started to rebound from the initial effects of the COVID-19 pandemic in July 2020. This is largely attributable to marginal growth in private sector companies as rising workforce numbers helped to reduce backlogs of work and a slowdown in new order growth as cash flow issues occasioned by the pandemic limited customer spending. For more information, see our Cytonn Weekly #14/2021,
- The International Monetary Fund approved a USD 2.3 bn (Kshs 255.9 bn) three-year disbursing programme under the Extended Credit Facility (ECF) and the Extended Fund Facility (EFF) aimed at assisting Kenya in dealing with funding shortages caused by Covid-19, funding structural reforms, and addressing the urgent need to reduce Kenya's debt vulnerabilities. For more information, see our, Cytonn Weekly #14/2021,
- The Energy and Petroleum Regulatory Authority (EPRA) released their monthly statement on the maximum wholesale and retail prices for fuel prices in Kenya effective 15th April 2021 to 14th May 2021 indicating that Super Petrol, diesel and kerosene prices remained unchanged at Kshs 122.8, Kshs 107.7, and 97.9 per litre, respectively. Notably, this is the first time they have kept petrol prices unchanged since it began reviewing retail fuel prices on a monthly basis in 2010. For more information, see our Cytonn Weekly #15/2021, and,
- The National Treasury gazetted the revenue and net expenditures for the first nine months of FY’2021/2021, closing on 31st March 2021 highlighting that the Total revenue collected as at the end of March 2021 amounted to Kshs 1.9 tn, equivalent to 63.6% of the revised annual target of Kshs 2.9 tn. Cumulatively, Tax revenues amounted to Kshs 1.0 tn, equivalent to 70.6% of the annual target of Kshs 1.5 tn. For more information, see our Cytonn Weekly #15/2021.
Rates in the fixed income market have remained relatively stable due to the high liquidity in the money markets, coupled with the discipline by the Central Bank as they reject expensive bids. The government is 20.5% ahead of its prorated borrowing target of Kshs 527.7 bn having borrowed Kshs 557.3 bn. In our view, due to the current subdued economic performance brought about by the effects of the COVID-19 pandemic, the government will record a shortfall in revenue collection with the target having been set at Kshs 1.9 tn for FY’2020/2021, thus leading to a larger budget deficit than the projected 7.5% of GDP. The high deficit and the lower credit rating from S&P Global to 'B' from 'B+' will mean that the government might be forced to borrow more from the domestic market which will ultimately create uncertainty in the interest rate environment. In our view, investors should be biased towards short-term fixed income securities to reduce duration risk.
Markets Performance
During the month of April, the equities market was on an upward trajectory, with NASI, NSE 20 and NSE 25 gaining by 6.6%, 1.1% and 4.1%, respectively. The equities market performance was driven by gains recorded by large cap stocks such as Safaricom, Bamburi, EABL and Diamond Trust Bank Kenya (DTB-K), which gained by 11.3%, 9.6%, 7.4%, and 4.0%, respectively. The gains were however weighed down by losses recorded by stocks such as Co-operative Bank, Standard Chartered Bank and BAT, which declined by 7.6%, 5.5%, and 4.5%, respectively.
During the week, the equities market recorded mixed performance, with NASI and NSE 25 gaining 2.1% and 1.1%, respectively, while NSE 20 declined 1.1%, taking their YTD performance to gains of 11.3% and 7.8% for NASI and NSE 25, respectively, with NSE 20 declining marginally by 0.3%. The equities market performance was mainly driven by gains recorded by large-cap stocks such as BAT, Safaricom and Co-operative Bank of 4.6%, 4.0%, and 2.5%, respectively. The gains were however weighed down by losses recorded by large-cap stocks such as Standard Chartered Bank, KCB Group, and Diamond Trust Bank Kenya (DTB-K) which declined by 5.0%, 3.2% and 3.0%, respectively. Key to note, Safaricom reached an all-time high of Kshs 40.4 following the announcement of the submission of a formal bid for a telco license in Ethiopia, taking its market capitalization to Kshs 1.6 tn, representing for 62.9% of the NSE’s market capitalization.
Equities turnover declined by 16.8% during the month to USD 91.4 mn, from USD 109.9 mn recorded in March 2021. Foreign investors remained net sellers during the month, with a net selling position of USD 0.3 mn, compared to March’s net selling position of USD 8.9 mn.
During the week, equities turnover increased by 1.8% to USD 22.7 mn, from USD 22.3 mn recorded the previous week, taking the YTD turnover to USD 380.0 mn. Foreign investors turned net buyers, with a net buying position of USD 8.6 mn, from a net selling position of USD 0.8 mn recorded the previous week, taking the YTD net selling position to USD 9.2 mn.
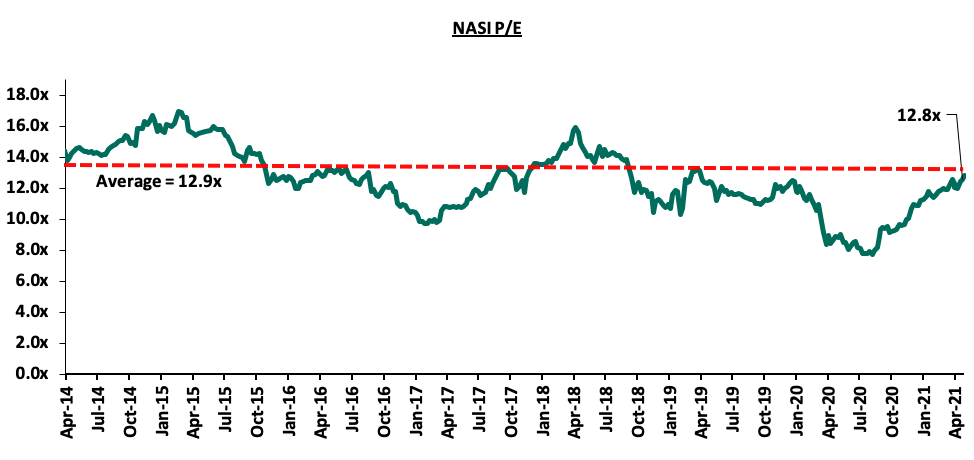
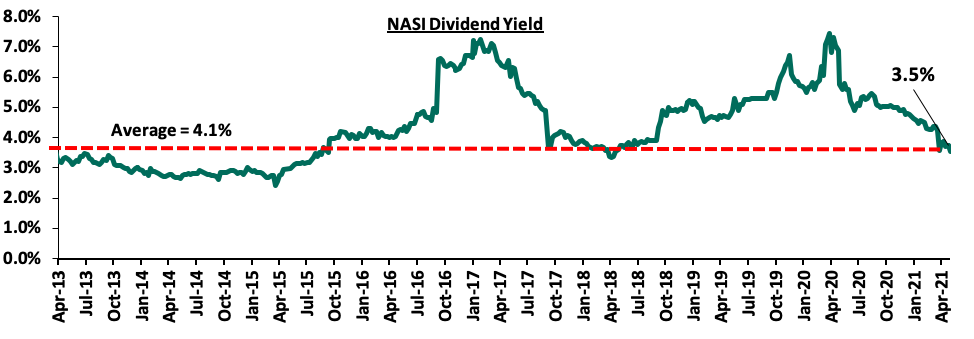
The market is currently trading at a price to earnings ratio (P/E) of 12.8x, 0.9% below the historical average of 12.9x, and a dividend yield of 3.5%, 0.6% points below the historical average of 4.1%. Key to note, NASI’s PEG ratio currently stands at 1.4x, an indication that the market is trading at a premium to its future earnings growth. Basically, a PEG ratio greater than 1.0x indicates the market may be overvalued while a PEG ratio less than 1.0x indicates that the market is undervalued. The current P/E valuation of 12.8x is 66.1% above the most recent trough valuation of 7.7x experienced in the first week of August 2020. The charts below indicate the historical P/E and dividend yields of the market.
Monthly Highlights:
- During the month, we released the banking sector report for FY’2020, which showed the sector’s Core Earnings per Share recorded a weighted average decline of 26.8%, compared to a growth of 8.9% recorded in FY’2019. The decline in the earnings was mainly attributable to the increased provisioning levels, which increased by 233.2% to Kshs 110.7 bn in FY’2020 from Kshs 33.2 bn in FY’2019, for the listed banking sector. Asset quality for the listed banks deteriorated, with the NPL ratio rising by 3.0% points to 13.5% in FY’2020 from 10.5% in FY’2019, and higher than the 5-year average of 9.9%. By the end of December 2020, the banking sector had restructured loans amounting to Kshs 1.6 tn (54.2% of the total banking sectors loans book) in order to offer relief for their customers in line with the Central Banks’ guidance on loan restructuring. For more information, please see the Cytonn Kenya Listed Commercial Banks Report FY'2020, and,
- The Central Bank of Kenya (CBK) announced that Chase Bank Limited (In Receivership) (CBLIR) would be liquidated, following the recommendation made by Kenya Deposit Insurance Corporation (KDIC). Key to note, this comes five years after CBK appointed the Kenya Deposit Insurance Corporation (KDIC) as the receiver for Chase Bank Limited on 7th April 2016. On 7th April 2021, KDIC submitted a receiver’s reports to CBK indicating that given the weak financial position of CBLIR, liquidation of the bank was the only plausible option and therefore, effective 16th April 2021, CBK appointed KDIC as the Liquidator of CBLIR. For more information, please see Cytonn Weekly#15/2021.
Weekly Highlight:
During the week, Safaricom Plc announced that it was a leading member of a consortium consisting of Vodacom Group Ltd (South Africa), Vodafone Group Plc (UK), CDC Group Plc (UK) and Sumitomo Corporation (Japan), that intends to make a formal bid for one of the two Ethiopia telco licenses. The respective consortium members will invest through special purpose investment vehicles (joint venture). Apart from Safaricom, ECA revealed that MTN Group also submitted a bid for the license.
In our view, the Ethiopian telecom license presents an ideal opportunity for Safaricom to tap into Africa’s second most populated nation after Nigeria, with a population of 112.0 mn according to World Bank data, and 50.7 mn mobile subscribers. Ethiopia’s economy is also projected to grow by 7.8% in 2021/22 according to IMF. The country presents an untapped market for internet connectivity, with 66.0% of the population being covered by mobile network but do not have mobile internet access. Key to note, mobile money services are excluded from the licenses on offer. Although the venture will have a significant impact on Safaricom’s balance sheet, the Return On Investment (ROI) in the long-run is expected to outweigh the cost of entry. Market entry as a consortium will also have some advantages such as network infrastructure development costs sharing and tapping into the diverse expertise of the consortium members.
Universe of Coverage
|
Company |
Price at 23/4/21 |
Price at 30/4/21 |
w/w change |
m/m change |
YTD Change |
Year Open 2021 |
Target Price* |
Dividend Yield |
Upside/ Downside** |
P/TBv Multiple |
Recommendation |
|
I&M Holdings*** |
45.0 |
44.1 |
(2.1%) |
(11.9%) |
(1.8%) |
44.9 |
59.5 |
5.1% |
40.2% |
0.6x |
Buy |
|
Kenya Reinsurance |
2.6 |
2.5 |
(3.5%) |
1.2% |
6.9% |
2.3 |
3.3 |
4.0% |
37.7% |
0.3x |
Buy |
|
Liberty Holdings |
8.0 |
7.4 |
(7.8%) |
(10.4%) |
(4.2%) |
7.7 |
9.8 |
0.0% |
32.8% |
0.5x |
Buy |
|
Standard Chartered*** |
141.0 |
134.0 |
(5.0%) |
(5.5%) |
(7.3%) |
144.5 |
164.4 |
7.8% |
30.5% |
1.0x |
Buy |
|
Diamond Trust Bank*** |
67.3 |
65.3 |
(3.0%) |
4.0% |
(15.0%) |
76.8 |
84.3 |
0.0% |
29.2% |
0.3x |
Buy |
|
Britam |
7.0 |
6.7 |
(3.7%) |
(4.0%) |
(3.7%) |
7.0 |
8.6 |
0.0% |
27.6% |
1.2x |
Buy |
|
Equity Group*** |
39.1 |
39.2 |
0.1% |
3.2% |
8.0% |
36.3 |
49.5 |
0.0% |
26.4% |
1.2x |
Buy |
|
KCB Group*** |
41.6 |
40.3 |
(3.2%) |
(2.5%) |
4.8% |
38.4 |
49.8 |
2.5% |
26.2% |
0.9x |
Buy |
|
Stanbic Holdings |
83.0 |
83.0 |
0.0% |
2.2% |
(2.4%) |
85.0 |
99.4 |
4.6% |
24.3% |
0.8x |
Buy |
|
Sanlam |
11.5 |
11.5 |
0.4% |
6.5% |
(11.5%) |
13.0 |
14.0 |
0.0% |
21.7% |
1.0x |
Buy |
|
NCBA*** |
24.9 |
25.0 |
0.4% |
(0.8%) |
(6.2%) |
26.6 |
28.4 |
6.0% |
19.8% |
0.6x |
Accumulate |
|
Co-op Bank*** |
11.9 |
12.2 |
2.5% |
(7.6%) |
(2.8%) |
12.6 |
13.6 |
8.2% |
19.7% |
0.8x |
Accumulate |
|
ABSA Bank*** |
8.7 |
8.8 |
0.7% |
(0.5%) |
(7.8%) |
9.5 |
10.2 |
0.0% |
16.2% |
1.0x |
Accumulate |
|
Jubilee Holdings |
290.0 |
281.8 |
(2.8%) |
4.2% |
2.2% |
275.8 |
313.8 |
3.2% |
14.6% |
0.6x |
Accumulate |
|
CIC Group |
2.3 |
2.2 |
(5.2%) |
4.8% |
3.3% |
2.1 |
2.1 |
0.0% |
(3.7%) |
0.7x |
Sell |
|
HF Group |
3.9 |
4.0 |
2.3% |
(1.0%) |
26.4% |
3.1 |
3.8 |
0.0% |
(4.3%) |
0.2x |
Sell |
|
*Target Price as per Cytonn Analyst estimates **Upside/ (Downside) is adjusted for Dividend Yield ***For Disclosure, these are stocks in which Cytonn and/or its affiliates are invested in |
|||||||||||
We are “Neutral” on the Equities markets in the short term. With the market currently trading at a premium to its future growth (PEG Ratio at 1.4x), we believe that investors should reposition towards companies with a strong earnings growth and are trading at discounts to their intrinsic value. Additionally, we expect the recent discovery of new strains of COVID-19 coupled with the introduction of strict lockdown measures in major economies to continue dampening the economic outlook.
I. Industry Reports
During the month, the following industry report was released and the key take-outs were as follows:
|
# |
Theme |
Report |
Key Take-out |
|
1 |
General Real Estate |
· According to the Central Bank of Kenya, the real estate sector recorded a 6.4% increase in the gross non-performing loans in Q4’2020 to Kshs 61.4 bn from Kshs 57.7 bn in Q3’2020 attributed to layoffs, business closures affecting the commercial office and retail sectors, and travel restrictions triggered by the pandemic affecting the performance of the hospitality industry. For more information, see Cytonn Weekly#15/2021 |
II. Residential Sector
During the month;
- The county government of Mombasa in partnership with property developer Buxton Point Apartment Limited began demolitions at Buxton Estate, located in Mombasa County, to pave way for 1,860 affordable housing units which will comprise of modern one, two and three bedroom units, to sit on a 14-acre piece of land. For more information, see Cytonn Weekly #16/2021.
III. Retail Sector
French retailer Carrefour supermarket, opened a new outlet in Nairobi Garden City Mall along Thika Road taking up space that was vacated by Shoprite Supermarket. This marks the 4th outlet opened by the retailer during the year and its 13th outlet country wide with 11 outlets within Nairobi. The decision to open a store in the Nairobi-Thika Road is supported by; i) availability of prime retail space after the exit of Shoprite supermarket, ii) a rising middle class along Thika Road who come as potential clients, iii) high footfall with Garden City being a destination mall, and, iv) improved infrastructure with the area being served by Thika Road. In terms of performance, Thika Road posted an average rental yield of 5.6% which is 1.8% points lower than the retail sector average of 7.4%. The retailer is however leveraging on availability of quality retail space, and, affordability as their main reason for moving to Thika Road. The Thika Road average rent per SQM in Q1’2021 came in at Kshs 148 compared to the market average of Kshs 166.
The table below shows the retail performance of various nodes including Thika Road according to the Cytonn Q’1 2021 Markets Review;
|
Nairobi Metropolitan Area Retail Market Performance |
|||
|
Area |
Rent Kshs/SQFT Q1’ 2021 |
Occupancy (%) Q1’ 2021 |
Rental Yield Q1’ 2021 |
|
Westlands |
205 |
84.5% |
10.1% |
|
Karen |
219 |
82.6% |
10.1% |
|
Kilimani |
173 |
83.8% |
8.7% |
|
Ngong Road |
178 |
75.0% |
7.6% |
|
Kiambu road |
163 |
70.8% |
6.7% |
|
Mombasa road |
139 |
73.0% |
6.0% |
|
Satelite towns |
138 |
72.4% |
6.0% |
|
Thika Road |
148 |
66.8% |
5.6% |
|
Eastlands |
132 |
66.0% |
5.5% |
|
Average |
166 |
75.0% |
7.4% |
Source: Cytonn Research 2021
The table below shows the summary of the number of stores of the key local and international retail supermarket chains in Kenya;
|
Main Local and International Retail Supermarket Chains |
|||||||
|
Name of Retailer |
Category |
Highest number of branches that have ever existed as at FY’2018 |
Highest number of branches that have ever existed as at FY’2019 |
Highest number of branches that have ever existed as at FY’2020 |
Number of branches opened in 2021 |
Closed branches |
Current number of Branches |
|
Naivas |
Local |
46 |
61 |
69 |
2 |
0 |
71 |
|
QuickMart |
Local |
10 |
29 |
37 |
3 |
0 |
40 |
|
Chandarana Foodplus |
Local |
14 |
19 |
20 |
0 |
0 |
20 |
|
Carrefour |
International |
6 |
7 |
9 |
4 |
0 |
13 |
|
Cleanshelf |
Local |
9 |
10 |
11 |
1 |
0 |
12 |
|
Tuskys |
Local |
53 |
64 |
64 |
0 |
61 |
3 |
|
Game Stores |
International |
2 |
2 |
3 |
0 |
0 |
3 |
|
Uchumi |
Local |
37 |
37 |
37 |
0 |
35 |
2 |
|
Choppies |
International |
13 |
15 |
15 |
0 |
13 |
2 |
|
Shoprite |
International |
2 |
4 |
4 |
0 |
3 |
1 |
|
Nakumatt |
Local |
65 |
65 |
65 |
0 |
65 |
0 |
|
Total |
257 |
313 |
334 |
10 |
177 |
167 |
|
Source: Online research
Other notable highlights during the month include;
- Naivas Supermarket opened a new outlet in Nakuru taking up space previously occupied by Tuskys marking its fourth outlet in Nakuru and 71st countrywide. Cleanshelf Supermarket also opened a new branch in the same town taking up space left by Ukwala marking its first outlet in Nakuru and 12th countrywide. For more information, please fee Cytonn Weekly #15/2021, and,
- Artcaffe Group, a restaurant chain based in Kenya, announced plans to open four new outlets within the Nairobi Metropolitan Area in Kileleshwa, Freedom Height Mall in Lang’ata, ACK Gardens in Upperhill, and at Hardy in Ngong. For more information, see Cytonn Weekly #15/2021.
We expect the performance of the retail sector performance to be cushioned by the continued expansion by local and international chains supported by; i) relatively high population growth rate and urbanization growth rate of 2.2% and 4.0%, respectively according to the World Bank, ii) investor confidence due to the ease of doing business in Kenya, having been ranked position #56 by World Bank, iii) the growing middle class with increased purchasing power, and, iv) improving infrastructure.
IV. Hospitality Sector
During the month;
- The United States of America (USA) retained the highest travel advisory on Kenya after the Centre for Disease Control (CDC) issued a Level Four Travel Health Advisory to American nationals due to the steep rise in Covid-19 cases in the country. For more information, see Cytonn Weekly #14/2021, and,
- The Kenyan government and the United Kingdom (UK) announced plans to form a joint committee to review the travel restrictions that triggered a tit-or-tat travel blockade between UK and Kenya over rising Covid-19 risk levels. For more information, see Cytonn Weekly #14/2021.
V. Land
During the week, President Uhuru Kenyatta officially launched the National Land Information Management System (NLIMS) marking the culmination of years of digitization of land records in Kenya. The launch of the digital land platform named ‘Ardhi Sasa’, which will be first rolled out in Nairobi then in other counties in phases, coincided with the opening of the National Geospatial Data Centre, an online depository that will contain all the land records in Kenya. The land digitization program will enable Kenyans to;
- Conduct land searches in real time thereby allowing for identification of the land’s location, ownership, size and past records,
- Apply for title deeds directly through the system unlike in the past where one had to do this physically. This will reduce delays and inconveniences that were common in the land registries,
- Sell land and conduct nearly every land transaction at the click of a button hence reducing human interaction, delays and other inconveniences Kenyans had to endure in the land registries,
- Phase out the use of brokers and hence reduce cases of fraud and exploitation by fraudsters and middlemen while carrying out land transactions, and,
- Reduce corruption and illegal transactions while assisting investigative agencies such as the Ethics and Anti-Corruption Commission (EACC) in curbing land related fraud.
The Ministry of Lands is currently transferring all parcels of land registered under repealed laws to the Land Registration Act of 2012 in order to implement the new system. The Land Act of 2012 aimed to amend, consolidate and streamline land laws and to ensure that land and land-based resources are managed and administered in a sustainable manner. While all land parcels will be transferred to the new regime, their ownership, size, and other interests will remain unchanged. The new digital platform also comes with the introduction of the Registry Index Maps (RIMs) in place of the old system that utilized deed plans. The RIMs system displays all land parcels within an area as opposed to a deed plan used in the former system that captured data on one specific parcel hence making it easier to note any changes or alterations.
This new platform will help to make transactions involving land easier and more transparent while reducing fraudulent transactions such as land grabbing that have plagued the sector for decades.
VI. Infrastructure
The Government of Kenya, through the State Department of infrastructure released Kshs 3.1 bn to complete tarmacking of the 192.0 km Kabati-Migwani-Mbondoni road in Kitui. The road will join the Lamu Port-South Sudan-Ethiopia Transport (LAPSSET) corridor hence linking Machakos, Makueni and Kitui counties to the coastal and northern areas such as Tharaka-Nithi, Meru to Moyale. For more information, see Cytonn Weekly#16/2021.
VII. Listed Real Estate
During the month, the Fahari I-REIT closed the month trading at an average price of Kshs 5.7 per share, representing a 16.2% decrease compared to the previous month’s closing price of Kshs 6.8 per share, and a 1.7% decrease YTD from Kshs 5.8 per share. The REIT is expected to continue recording subdued performance due to; i) declining performance of the real estate market in the wake of the pandemic and lockdown restrictions, ii) insufficient institutional grade real estate assets, iii) lack of investor appetite in the instrument, and iv) general lack of knowledge about the instrument.
The real estate sector is expected to continue recording activities supported by; i) continued focus on affordable housing, ii) the continued expansion by local and international retailers, iii) the improvement of services in the land sector due to the digitization of land records, iv) the continued launch of infrastructure projects by the government opening up areas for real estate investment. However, the hospitality sector is expected to be negatively affected as a result of travel restrictions by countries such as USA and UK which are key tourist markets for Kenya’s tourism sector.
Disclaimer: The views expressed in this publication are those of the writers where particulars are not warranted. This publication, which is in compliance with Section 2 of the Capital Markets Authority Act Cap 485A, is meant for general information only and is not a warranty, representation, advice or solicitation of any nature. Readers are advised in all circumstances to seek the advice of a registered investment advisor.

- Talk to us
- Kenya
- P.O Box 20695 - 00200, Nairobi, Kenya
- Cell +254709101200
- Tel +254709101200
- WhatsApp +254741676635
- United States
- +254709101200
- DOWNLOAD OUR APP
-


- Kenya
- 8th Floor, Pinetree Plaza, Kaburu Drive, Ngong Road, Nairobi, Kenya
- USA
- Suite 1150, 1775 Eye Street NW, USA, Washington DC 20006, USA
- Investments
- High Yield
- Private Equity
- Real Estate
- Real Estate
- RiverRun Estates
- Cytonn Towers
- The Ridge
- Taraji Heights
- The Alma