Nairobi Metropolitan Area Commercial Office Report 2021, & Cytonn Weekly #16/2021
By Cytonn Research Team, Apr 25, 2021
Executive Summary
Fixed Income
During the week, there was a decline in the subscription rates for T-bills with the overall subscription rate declining to 59.8%, down from 86.9% recorded last week. The undersubscription can be attributed to the tightening liquidity in the money markets as evidenced by the increase in the average interbank rates to 5.5%, from 4.4% recorded the previous week. The investors are still biased towards the 364-day T-bill as the absolute amount of bids received were Kshs 8.9 bn compared to Kshs 3.7 bn and Kshs 2.0 bn for the 182 day and the 91 day bills respectively. Yields on the 364-day and 91-day papers rose by 5.7 bps and 0.7 bps, to 9.5% and 7.1%, respectively, while the yield on the 182-day paper declined by 1.3 bps to 7.9%.
In the primary bonds auction, the government is seeking to raise Kshs 30.0 bn for budgetary support by reopening a previously issued bond, FXD2/2019/15 with an effective tenor of 13.0 years. The bond is currently trading at a yield of 12.8% in the secondary market. The government has also opened bidding for a new issue, FXD1/2021/25, with a tenor of 25.0 years, with the coupon rate being market determined;
Equities
During the week, the equities market recorded mixed performance, with both NASI and NSE 20 gaining by 0.3%, while NSE 25 remained unchanged from what was recorded the previous week. This week’s performance took the indices YTD performance to gains of 8.9%, 0.8% and 6.6% for NASI, NSE 20 and NSE 25, respectively. The equities market performance was driven by gains recorded by stocks such as Bamburi, Diamond Trust Bank (DTB-K) and Safaricom which gained by 6.0%, 3.5% and 1.0%, respectively. The gains were however weighed down by losses recorded by stocks such as BAT and NCBA Group which declined by 8.7% and 7.3%, respectively;
Real Estate
During the week, the county government of Mombasa in partnership with property developer Buxton Point Apartment Limited began demolition at Buxton Estate located in Mombasa County, to pave way for 1,860 affordable housing units which will comprise of modern one, two and three bedroom units, to sit on a 14-acre piece of land. In the infrastructure sector, the Government of Kenya released Kshs 3.1 bn to complete tarmacking of the 192.0 km Kabati-Migwani-Mbondoni road in Kitui;
Focus of the Week
The commercial office sector performance softened in 2020 recording a 0.5% points decline in average rental yields to 7.0% in 2020 from 7.5% in 2019. Occupancy rates declined by 2.6% points to 77.7% in 2020, from 80.3%, in 2019. Asking rents and prices declined by 3.0% and 2.8% respectively to an average of Kshs 93 and Kshs 12,280 per SQFT in 2020 from per SQFT from Kshs 96 and Kshs 12,638 per SQFT in 2019.
Investment Updates:
- Weekly Rates:
- Cytonn Money Market Fund closed the week at a yield of 10.50%. To invest, just dial *809#;
- Cytonn High Yield Fund closed the week at a yield of 14.50% p.a. To invest, email us at sales@cytonn.comand to withdraw the interest you just dial *809#;
- We continue to offer Wealth Management Training daily, from 9:00 am to 11:00 am, through our Cytonn Foundation. The training aims to grow financial literacy among the general public. To register for any of our Wealth Management Training, click here;
- If interested in our Private Wealth Management Training for your employees or investment group, please get in touch with us through wmt@cytonn.com;
Real Estate Updates:
- For an exclusive tour of Cytonn’s real estate developments, visit: Sharp Investor's Tour, and for more information, email us at sales@cytonn.com;
- Phase 3 of The Alma by Cytonn is now ready for occupancy. To rent please email properties@cytonn.com;
- We have 10 investment-ready projects, offering attractive development and buyer targeted returns. See further details here: Summary of Investment-ready Projects;
Hospitality Updates:
We currently have promotions for Daycations and Staycations, visit cysuites.com/offers for details or email us at sales@cysuites.com
- For recent news about the group, see our news section here.
Money Markets, T-Bills & T-Bonds Primary Auction:
During the week, there was decline in the subscription rates for T-bills with the overall subscription rate declining to 59.8%, down from 86.9% recorded last week. The undersubscription can be attributed to the tightening liquidity in the money markets as evidenced by the increase in the average interbank rates to 5.5%, from 4.4% recorded the previous week. Investors are still biased towards the 364-day T-bill as the absolute amount of bids received were Kshs 8.9 bn compared to Kshs 3.7 bn and Kshs 2.0 bn for the 182 day and the 91 day bills respectively. Yields on the 364-day and 91-day papers rose by 5.7 bps and 0.7 bps, to 9.5% and 7.1%, respectively, while the yield on the 182-day paper declined by 1.3 bps to 7.9%. The government continued to reject expensive bids by accepting Kshs 13.4 bn of the Kshs 14.4 bn bids received, translating to an acceptance rate of 93.6%.
In the primary bonds auction, the government is seeking to raise Kshs 30.0 bn for budgetary support by reopening a previously issued bond, FXD2/2019/15 with an effective tenor of 13.0 years. The bond is currently trading at a yield of 12.8% in the secondary market, as such, we recommend a bidding range of 12.5%-12.7%. The government has also opened bidding for a new issue, FXD1/2021/25, with a tenor of 25.0 years, with the coupon rate being market determined. Bonds with similar tenor are currently trading at a yield of 12.8% – 13.4% in the secondary market and as such, we recommend a bidding range of between 12.9%-13.3%. The period of sale runs between 23rd April 2021 and 4th May 2021. We anticipate an oversubscription as investors have recently favored papers with longer tenors and subsequently a high acceptance rate as the government seeks to raise more funds to fund the recently approved supplementary budget.
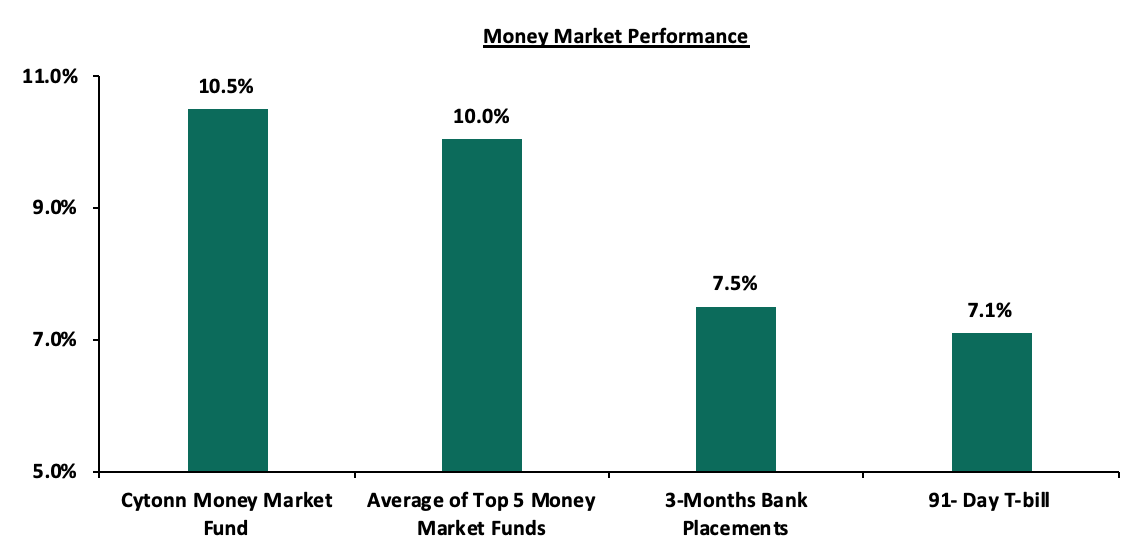
In the money markets, 3-month bank placements closed the week at 7.5% (based on what we have been offered by various banks), the 91-day T-bill remained unchanged at 7.1%, similar to what was recorded the previous week. Additionally, the average yield of the Top 5 Money Market Funds remained unchanged at 10.0%. The yield on the Cytonn Money Market fund declined marginally by 0.1% points to 10.5% from 10.6% recorded the previous week. The table below shows the Money Market Fund Yields for Kenyan fund managers as published on 23rd April 2021:
|
Money Market Fund Yield for Fund Managers as published on 23rd April 2021 |
|||
|
Rank |
Fund Manager |
Daily Yield |
Effective Annual Rate |
|
1 |
Cytonn Money Market Fund |
9.99% |
10.50% |
|
2 |
Alphafrica Kaisha Money Market Fund |
9.56% |
9.99% |
|
3 |
Zimele Money Market Fund |
9.56% |
9.91% |
|
4 |
Nabo Africa Money Market Fund |
9.48% |
9.90% |
|
5 |
GenCapHela Imara Money Market Fund |
9.41% |
9.87% |
|
6 |
Madison Money Market Fund |
8.89% |
9.29% |
|
7 |
CIC Money Market Fund |
8.94% |
9.26% |
|
8 |
Sanlam Money Market Fund |
8.75% |
9.14% |
|
9 |
Dry Associates Money Market Fund |
8.69% |
9.05% |
|
10 |
Co-op Money Market Fund |
8.39% |
8.76% |
|
11 |
British-American Money Market Fund |
8.39% |
8.72% |
|
12 |
Apollo Money Market Fund |
8.43% |
8.50% |
|
13 |
ICEA Lion Money Market Fund |
8.09% |
8.43% |
|
14 |
NCBA Money Market Fund |
8.04% |
8.34% |
|
15 |
Old Mutual Money Market Fund |
6.91% |
7.14% |
|
16 |
AA Kenya Shillings Fund |
6.04% |
6.21% |
Liquidity:
During the week, liquidity in the money markets tightened, with the average interbank rate increasing to 5.8%, from 5.0% recorded the previous week, mainly due to tax remittances which were partly offset by Government payments. Additionally, there was an 11.5% decrease in the average volumes traded in the interbank market to Kshs 11.2 bn, from Kshs 12.6 bn the previous week. According to the Central Bank of Kenya’s weekly bulletin released on 23rd April 2021, commercial banks’ excess reserves came in at Kshs 5.0 bn in relation to the 4.25% Cash Reserve Ratio.
Kenya Eurobonds:
During the week, the yields on Eurobonds recorded mixed performance with the yields on the 10-year Eurobond issued in June 2014, the 10-year and 30-year Eurobonds issued in 2018 and the 7-year Eurobond issued in 2019 remaining unchanged at 3.2%, 5.7%, 7.6% and 5.0%, respectively. The yield on the 12-year Eurobond issued in 2019 increased by 0.1% points to 6.7%, from 6.6%, recorded the previous week.
|
Kenya Eurobond Performance |
|||||
|
|
2014 |
2018 |
2019 |
||
|
Date |
10-year issue |
10-year issue |
30-year issue |
7-year issue |
12-year issue |
|
31-Dec-2020 |
3.9% |
5.2% |
7.0% |
4.9% |
5.9% |
|
16-April-2021 |
3.2% |
5.7% |
7.6% |
5.0% |
6.6% |
|
19-April-2021 |
3.2% |
5.7% |
7.6% |
4.9% |
6.6% |
|
20-April-2021 |
3.2% |
5.7% |
7.6% |
5.0% |
6.7% |
|
21-April-2021 |
3.2% |
5.8% |
7.7% |
5.1% |
6.7% |
|
22-Aprilr-2021 |
3.2% |
5.7% |
7.6% |
4.9% |
6.7% |
|
23-Aprilr-2021 |
3.2% |
5.7% |
7.6% |
5.0% |
6.7% |
|
Weekly Change |
0.0% |
0.0% |
0.0% |
0.0% |
0.1% |
|
YTD Change |
(0.7%) |
0.5% |
0.6% |
0.1% |
0.8% |
Source: Reuters
The Kenya Shilling:
During the week, the Kenya Shilling depreciated against the dollar by 1.3%, to close at Kshs 108.5, from Kshs 107.1 recorded the previous week, attributable to increased demand from oil, manufacturing and agricultural importers. On a YTD basis, the shilling has appreciated by 0.6% against the dollar, in comparison to the 7.7% depreciation recorded in 2020. We expect the shilling to remain under pressure in 2021 as a result of:
- Rising uncertainties in the global market due to the Coronavirus pandemic, which has seen investors continue to prefer holding their investments in dollars and other hard currencies and commodities, and,
- Continued strengthening of the US Dollar against major currencies as evidenced by a YTD gain of 2.1% in the ICE U.S. Dollar Index as compared to a 6.7% decline in 2020. The ICE U.S. Dollar Index is a benchmark index that measures the international value of the US Dollar where investors can monitor the value of the US Dollar relative to a basket of six other world currencies.
The shilling is however expected to be supported by:
- The Forex reserves, currently at USD 7.7 bn (equivalent to 4.8-months of import cover), which is above the statutory requirement of maintaining at least 4.0-months of import cover, and the EAC region’s convergence criteria of 4.5-months of import cover,
- The improving current account position which narrowed to 4.8% of GDP in the 12 months to December 2020 compared to 5.8% of GDP during a similar period in 2019, and,
- Improving diaspora remittances evidenced by a 27.1% y/y increase to USD 290.8 mn in March 2021, from USD 228.8 mn recorded over the same period in 2020, has cushioned the shilling against further depreciation.
Rates in the fixed income market have remained relatively stable as the government rejects expensive bids. The government is 32.1% ahead of its domestic borrowing target, having borrowed Kshs 596.7 bn against a pro-rated target of Kshs 451.6 bn for the financial year 2021/2021. In our view, due to the current subdued economic performance brought about by the effects of the COVID-19 pandemic, the government will record a shortfall in revenue collection with the target having been set at Kshs 1.9 tn for FY’2020/2021, thus leading to a larger budget deficit than the projected 7.5% of GDP. The high deficit and the lower credit rating from S&P Global to 'B' from 'B+' will mean that the government might be forced to borrow more from the domestic market which will ultimately create uncertainty in the interest rate environment. In our view, investors should be biased towards short-term fixed income securities to reduce duration risk.
Market Performance:
During the week, the equities market recorded mixed performance, with both NASI and NSE 20 gaining by 0.3%, while NSE 25 remained unchanged from what was recorded the previous week. This week’s performance took the indices YTD performance to gains of 8.9%, 0.8% and 6.6% for NASI, NSE 20 and NSE 25, respectively. The equities market performance was driven by gains recorded by stocks such as Bamburi, Diamond Trust Bank (DTB-K) and Safaricom which gained by 6.0%, 3.5% and 1.0%, respectively. The gains were however weighed down by losses recorded by stocks such as BAT and NCBA Group which declined by 8.7% and 7.3%, respectively.
Equities turnover increased by 1.7% during the week to USD 22.3 mn, from USD 21.9 mn recorded the previous week, taking the YTD turnover to USD 357.3 mn. Foreign investors remained net sellers, with a net selling position of USD 0.8 mn, from a net selling position of USD 3.2 mn recorded the previous week, taking the YTD net selling position to USD 17.8 mn.
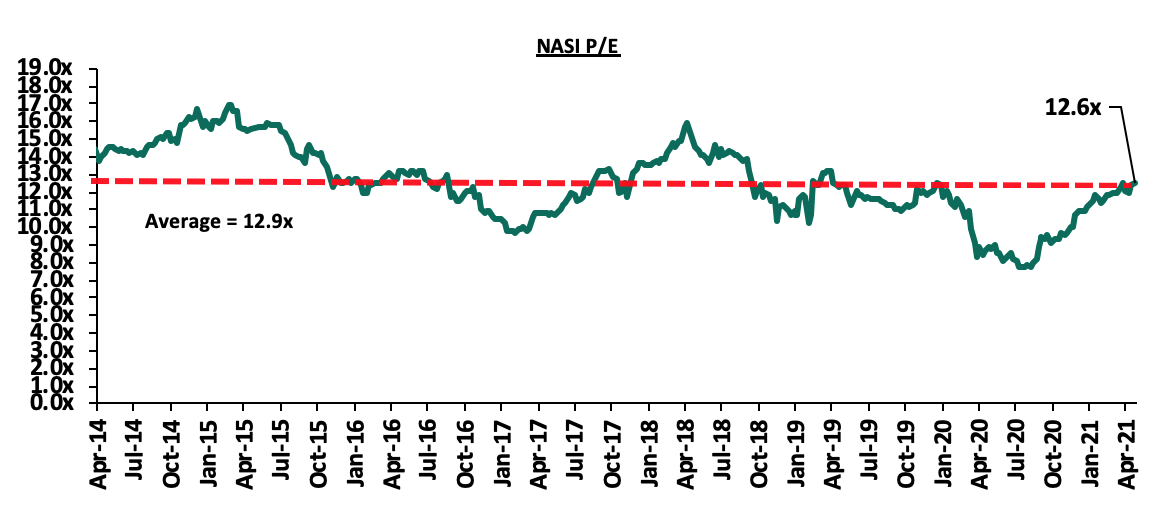
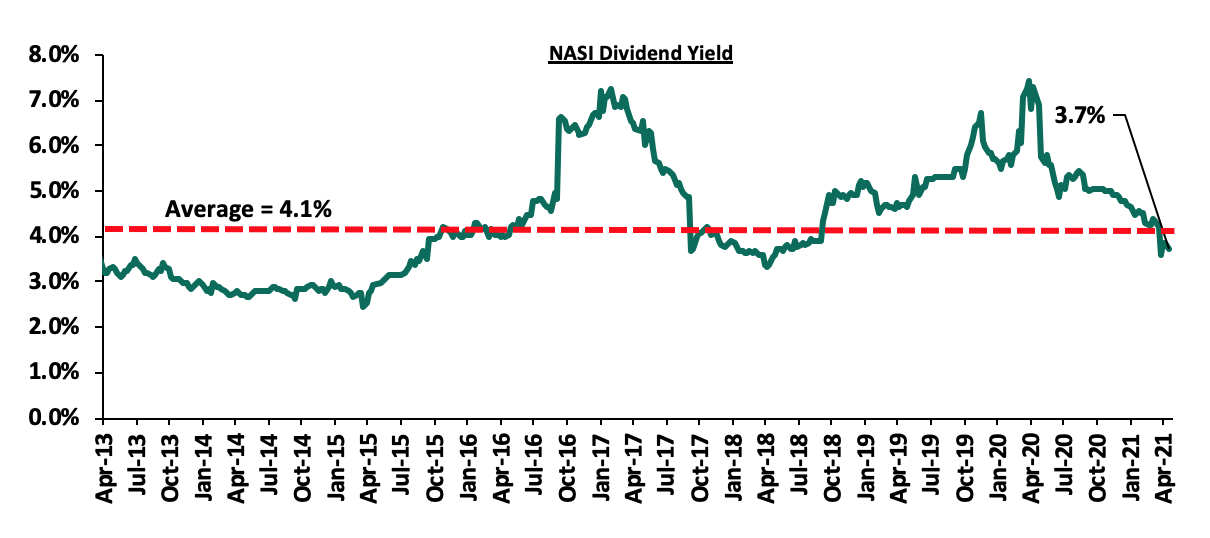
The market is currently trading at a price to earnings ratio (P/E) of 12.6x, 2.8% below the 12-year historical average of 12.9x, and a dividend yield of 3.7%, 0.4% points below the historical average of 4.1%. Key to note, NASI’s PEG ratio currently stands at 1.4x, an indication that the market is trading at a premium to its future earnings growth which means that some of the stocks are expensive. Basically, a PEG ratio greater than 1.0x indicates the market may be overvalued while a PEG ratio less than 1.0x indicates that the market is undervalued. The current P/E valuation of 12.6x is 63.0% above the most recent trough valuation of 7.7x experienced in the first week of August 2020. The charts below indicate the historical P/E and dividend yields of the market.
Universe of Coverage:
|
Company |
Price at 16/4/2021 |
Price at 23/4/2021 |
w/w change |
YTD Change |
Year Open 2021 |
Target Price* |
Dividend Yield |
Upside/ Downside** |
P/TBv Multiple |
Recommendation |
|
I&M Holdings*** |
46.0 |
45.0 |
(2.2%) |
0.3% |
44.9 |
59.5 |
5.0% |
37.2% |
0.6x |
Buy |
|
Kenya Reinsurance |
2.5 |
2.6 |
4.5% |
10.8% |
2.3 |
3.3 |
4.3% |
33.2% |
0.3x |
Buy |
|
Equity Group*** |
38.9 |
39.1 |
0.6% |
7.9% |
36.3 |
49.5 |
0.0% |
26.6% |
1.2x |
Buy |
|
Diamond Trust Bank*** |
65.0 |
67.3 |
3.5% |
(12.4%) |
76.8 |
84.3 |
0.0% |
25.4% |
0.3x |
Buy |
|
Stanbic Holdings |
83.8 |
83.0 |
(0.9%) |
(2.4%) |
85.0 |
99.4 |
4.6% |
24.3% |
0.8x |
Buy |
|
Standard Chartered*** |
142.8 |
141.0 |
(1.2%) |
(2.4%) |
144.5 |
164.4 |
7.4% |
24.0% |
1.1x |
Buy |
|
Britam |
6.7 |
7.0 |
4.2% |
0.0% |
7.0 |
8.6 |
0.0% |
22.9% |
0.6x |
Buy |
|
Co-op Bank*** |
11.8 |
11.9 |
0.8% |
(5.2%) |
12.6 |
13.6 |
8.4% |
22.7% |
0.8x |
Buy |
|
Liberty Holdings |
8.1 |
8.0 |
(1.7%) |
3.9% |
7.7 |
9.8 |
0.0% |
22.5% |
2.9x |
Buy |
|
Sanlam |
10.9 |
11.5 |
5.0% |
(11.9%) |
13.0 |
14.0 |
0.0% |
22.3% |
0.9x |
Buy |
|
KCB Group*** |
42.0 |
41.6 |
(1.0%) |
8.3% |
38.4 |
49.8 |
2.4% |
22.1% |
1.0x |
Buy |
|
NCBA*** |
26.8 |
24.9 |
(7.3%) |
(6.6%) |
26.6 |
28.4 |
6.0% |
20.3% |
0.2x |
Buy |
|
ABSA Bank*** |
8.8 |
8.7 |
(0.9%) |
(8.4%) |
9.5 |
10.2 |
0.0% |
17.0% |
0.5x |
Accumulate |
|
Jubilee Holdings |
282.3 |
290.0 |
2.7% |
5.2% |
275.8 |
313.8 |
2.8% |
11.0% |
1.9x |
Accumulate |
|
HF Group |
4.0 |
3.9 |
(3.0%) |
23.6% |
3.1 |
3.8 |
0.0% |
(2.1%) |
0.2x |
Sell |
|
CIC Group |
2.3 |
2.3 |
0.4% |
9.0% |
2.1 |
2.1 |
0.0% |
(8.7%) |
0.1x |
Sell |
|
*Target Price as per Cytonn Analyst estimates **Upside/ (Downside) is adjusted for Dividend Yield ***For Disclosure, these are stocks in which Cytonn and/or its affiliates are invested in |
||||||||||
We are “Neutral” on the Equities markets in the short term. With the market currently trading at a premium to its future growth (PEG Ratio at 1.4x), we believe that investors should reposition towards companies with a strong earnings growth and are trading at discounts to their intrinsic value. Additionally, we expect the recent discovery of new strains of COVID-19 coupled with the introduction of strict lockdown measures in major economies to continue dampening the economic outlook.
- Residential Sector
During the week, the county government of Mombasa in partnership with property developer Buxton Point Apartment Limited began demolitions at Buxton Estate, located in Mombasa County, to pave way for 1,860 affordable housing units which will comprise of modern one, two and three bedroom units, to sit on a 14-acre piece of land. The Kshs 6.0 bn Buxton Estate being developed is part of a Kshs 200.0 bn housing project to redevelop ten estates through a joint venture between County Government of Mombasa and private investors, and the ground breaking for the project is set for 1st May 2021, with phase one anticipated to be completed in 12 months.
The table below gives a summary of the unit types, sizes and prices for the development;
|
Buxton Estate Affordable Housing Project |
|||
|
Typology |
Unit size (SQM) |
Unit Price (Kshs) |
Price per SQM(Kshs) |
|
1 |
35 |
1.8 mn |
51,429 |
|
2 |
55 |
3.0 mn |
54,545 |
|
3 |
72 |
4.2 mn |
58,333 |
|
Averages |
54 |
3.0 mn |
54,769 |
Source: Cytonn Research
The affordable housing programme continues to take shape in Kenya, with the Buxton Estate Project being the first in Mombasa County. Other projects on the pipeline in the Nairobi Metropolitan Area are Shauri Moyo, Makongeni and Starehe houses. Despite the growing demand for the affordable housing units, evidenced by the relatively high number of individuals who have registered through the boma yangu portal currently at 316,632; the implementation of affordable housing projects has been sluggish attributed to; i) bureaucracy and slow project approval processes, ii) the pending operationalization of the Integrated Project Delivery Unit which was tasked with being a single point of regulatory approval for developments, infrastructure provision and developer incentives, iii) failure to fast track incentives provided in support of the affordable housing initiative, iv) ineffectiveness of Public-Private Partnerships, and, v) the current economic slowdown due to the ongoing pandemic. The initiative is expected to fall short of its 2022 target of delivering 500,000 housing units, with less than 1,000 units having been delivered so far through the Park Road project in Ngara and the Pangani Estate project.
In our view, if the Buxton project is successfully delivered, it will enhance Kenyans confidence in the affordable housing programme and encourage public-private partnerships towards its delivery. However, given the negligible number of units delivered compared to existing demand, we expect the current housing deficit of 2.0 mn units growing by 200,000 annually according to the National Housing Corporation, to expand further driven by the relatively high urbanization and population growth rates of 4.0% p.a and 2.2% p.a respectively, compared to the global average of 1.9% p.a and 1.1% p.a, respectively according to World Bank. Therefore, to accelerate the supply of housing units, the government must embark on resolving the above challenges in addition to investing in urban planning to enhance sustainability.
- Infrastructure
During the week, the Government of Kenya, through the State Department of Infrastracture released Kshs 3.1 bn to complete tarmacking of the 192.0 km Kabati-Migwani-Mbondoni road in Kitui. The road will join the Lamu Port-South Sudan-Ethiopia Transport (LAPSSET) corridor hence linking Machakos, Makueni and Kitui counties to the coastal and northern areas such as Tharaka-Nithi, Meru to Moyale. The construction of the road began in 2016 and was expected to be complete by February 2021, however works stalled due financial constraints attributed to reduced budget allocation to infrastructure. The project is part of the fulfilment of Kenya Vision 2030 agendas with regard to infrastructural development and it is expected to open up the surrounding areas to trade and tourism, provide an easy link to Tana River county, boost businesses by easing mineral exploitation and transportation of agricultural produce, and, open the surrounding areas to real estate investment hence boost property prices.
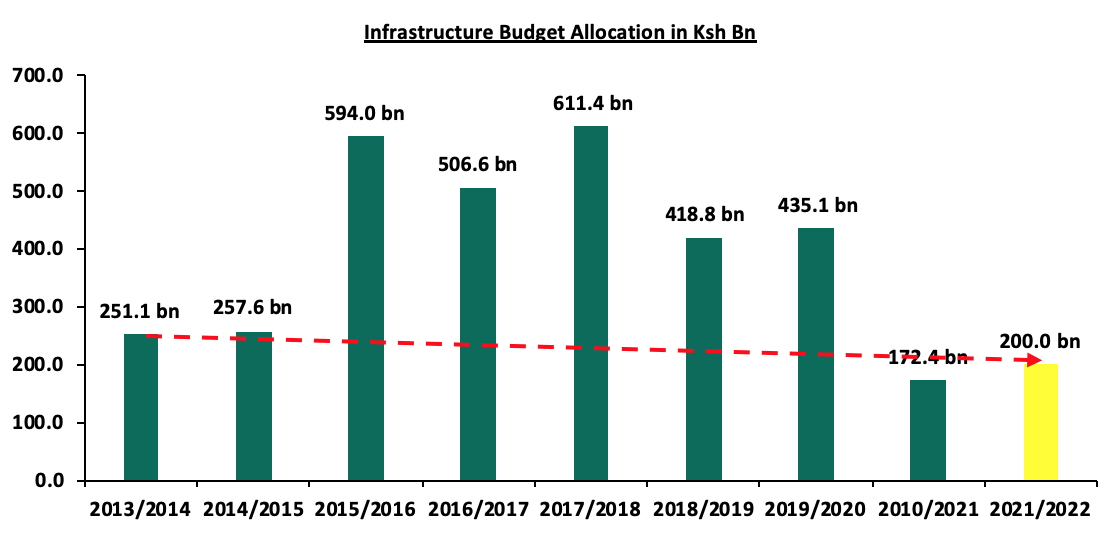
The government continues to implement select infrastructural projects despite the economic slowdown brought about by the Covid-19 pandemic that caused reduced budget allocation to Kshs 172.4 bn for financial year 2020/2021, the lowest allocation in the last 10 financial years, and 60.4% lower than the Kshs 435.1 bn allocated in the 2019/2020 budget. With the proposed allocation of Kshs 200.0 bn, a 16.0% budget increase for the financial year 2021/2022, we expect the infrastructure sector to record improved performance through increased activities as it is a key driver to economic growth. Other mega infrastructure projects which are underway include; i) The Nairobi expressway which is anticipated to be completed by December 2022, ii) Nairobi Western Bypass, and, iii) Lamu Port Access Road, among others.
The graph below shows the budget allocation to the infrastructure sector over the years;
Source: National Treasury
Despite the existing effects of the pandemic on the real estate sector, we expect that the sector will record increased activities supported by continued focus on the affordable housing programme and improvement of infrastructure.
In 2020, we released the Nairobi Metropolitan Area Commercial Office Report 2020, which highlighted the state of the commercial office market in terms of supply, demand, performance, and investment opportunities within the sector and the overall performance of the sector in 2019. According to the report, the commercial office sector performance softened in 2019 recording a decline of 0.6% in average rental yields to 7.7% in 2019 from 8.3% in 2018. Occupancy rates declined by 3.3% to 80.5% in 2019, from 83.8%, in 2018. Asking rents declined by 4.3% to an average of Kshs 97 per SQFT from Kshs 101 per SQFT in 2018. The main reasons that led to the declines in performance in 2019 were; i)an introduction of 1.5 mn SQFT office space to the market resulting to an oversupply of 6.3 mn SQFT which has created a bargaining chip for potential tenants, forcing developers and landlords to reduce or maintain prices and rents to remain competitive and attract occupants to their office spaces, and, ii) a decline in uptake of office space attributed to a challenging financial environment, leading to downsizing or business closures, especially for small and medium-sized enterprises (SMEs).
This week, we update our report based on research conducted in 9 nodes in the Nairobi Metropolitan Area Commercial Office Market by looking at the following:
- Overview of the Commercial Office Sector,
- Commercial Office Supply in the Nairobi Metropolitan Area,
- Commercial Office Performance, by Location and by Grades, and,
- Office Market Outlook and the Investment Opportunity in the Sector.
Section I: Overview of the Commercial Office Sector
The Nairobi Metropolitan Area (NMA) commercial office market in 2020 faced numerous challenges attributable to the covid-19 pandemic which brought about reduced demand for office space as well as the high supply which led to declines in both rental rates and occupancies. The sector saw an increase in the oversupply from 6.3 mn SQFT in 2019 to 7.3mn SQFT in 2020;
However, some of the factors that have continued to drive the commercial office sector include:
- Reinvention of Commercial Spaces: Since the emergence of the pandemic in early 2020 which was followed by lockdown measures, companies restructured and adopted remote working which led to a decrease in occupancy levels in the commercial office sector. There was also a need to redesign offices to open spaces so as to adhere to social distancing regulations as well as maximize the space thus bringing about the need for more office spaces. In addition, the popularity of co-working office spaces is picking up as they are offering companies spaces on flexible terms, and,
- Rise of Serviced Offices: Serviced offices are becoming a trend in the modern market as they provide flexibility with no significant upfront Capex and for the office owners they yield higher returns of up to 11.2% against the market average of 7.0%,
The sector continues to face challenges among them,
- The Covid-19 Pandemic: The pandemic has adversely affected the growth of office sector as it led to reduced occupancies and uptake of spaces. In 2020, occupancies dropped by 2.6% points to 77.7% from 80.3%, and the average rental rates declined to by 3.0% from Kshs 96 per SQFT in 2019 to Kshs 93 per SQFT, leading to a 0.5% decline in the total yield to an average of 7.0% from 7.5%.
- Oversupply of the office Space: Office space oversupply stood at 7.3 mn SQFT in 2020 with a total of 0.8mn SQFT of new office space coming to the market adding to the initial office stock of 36.3 mn SQFT.
- Reduced Occupancy Rates: The business restructuring which incorporated remote working has led to reduced occupancy levels as companies sought to reduce the sizes of their offices to minimize spending on rental charges, and,
- Limited Accessibility of Funds: Lack of proper funding for developers resulted in the use of expensive debts in the funding structure of most real estate developments with no exception of the commercial office sector. However, accessing loans for development has been a challenge as creditors are exercising a more conservative underwriting approach as a strategy to cushion themselves against the pandemic which is marked by high loan default rates.
Section II: Commercial Office Supply in the Nairobi Metropolitan Area
The supply of new commercial space continued to rise in 2020 despite the pandemic with the completion of 7 buildings offering up to 0.8 mn SQFT of extra space in to the commercial market. This office supply is expected to increase going forward with few developments in the pipeline bringing the expected incoming supply in 2021 to 0.9 mn SQFT. Some of these developments in pipeline expected to be completed in 2021 include the Global Trade Centre in Westlands, Riverside Square in Riverside and China Road and Bridge Corporation in Lang’ata.
Some of the notable office completions during the review period included:
|
Major Commercial Office Completion in 2020 |
|||
|
# |
Office Development |
Location |
Size (SQFT) |
|
1 |
Millennium Business Park |
Lang’ata |
23,000 |
|
2 |
Templeton House |
Westlands |
33,132 |
|
3 |
Majani House |
CBD |
54,551 |
|
4 |
Capital Square |
Westlands |
101,000 |
|
5 |
Delta Chambers |
Westlands |
132,979 |
|
6 |
Central Bank Pension Building |
CBD |
180,000 |
|
7 |
Upperhill Chambers |
Upperhill |
270,000 |
|
Total |
794,662 |
||
Source: Cytonn Research 2020/Knight Frank 2020
The Office space supply grew by a 7-year CAGR of 21.3% to 36.4 mn SQFT in 2020 from 7.7 mn SQFT in 2012. In 2020, the market had an available supply of 7.1 mn SQFT against a demand of (0.2) mn SQFT, resulting in an oversupply of 7.3 mn SQFT. The demand was low in 2020 due to a tough economic environment brought about by the pandemic forcing businesses to restructure thus reducing the demand for office spaces. Additionally, the adoption of remote working as a strategy for limiting the spread of the pandemic also reduced the demand for office spaces in 2020 and this is expected to continue in 2021.
The table below summarizes the commercial office space supply over time:
|
Commercial Office Supply Analysis (2011-2020) |
|||||||||||||
|
Year |
2011 |
2012 |
2013 |
2014 |
2015 |
2016 |
2017 |
2018 |
2019 |
2020 |
2021F |
2022 F |
7 year CAGR |
|
Stock ( Mn Sqft) |
6.7 |
7.7 |
9.7 |
15.4 |
22.9 |
28.9 |
31.8 |
35.5 |
36.3 |
36.4 |
37.2 |
38.1 |
21.3% |
|
Completions ( Mn Sqft) |
1.2 |
2.1 |
5.9 |
7.8 |
6.5 |
3.5 |
4.3 |
1.5 |
0.8 |
0.9 |
0.5 |
(5.1%) |
|
|
Vacancy Rate ( %) |
9.0% |
9.0% |
10.0% |
10.0% |
11.0% |
12.0% |
16.8% |
16.7% |
19.5% |
22.3% |
23.9% |
25.6% |
12.0% |
|
Vacant Stock ( Mn Sqft) |
0.6 |
0.7 |
1.0 |
1.5 |
2.5 |
3.5 |
5.3 |
5.9 |
7.1 |
8.1 |
9.0 |
9.5 |
35.9% |
|
Occupied Stock (Mn Sqft) |
6.1 |
7.1 |
8.8 |
13.9 |
20.3 |
25.4 |
26.5 |
29.6 |
29.2 |
28.3 |
28.3 |
28.1 |
18.9% |
|
Net Absorption |
1.0 |
1.7 |
5.1 |
6.5 |
5.1 |
1.0 |
3.1 |
(0.4) |
(1.0) |
(0.2) |
(0.3) |
||
|
Demand |
1.1 |
1.9 |
5.3 |
6.8 |
5.6 |
1.6 |
3.7 |
0.4 |
(0.2) |
0.9 |
1.0 |
||
|
Available Supply, AS(T) |
1.7 |
2.6 |
6.5 |
8.8 |
8.4 |
6.3 |
9.0 |
6.7 |
7.1 |
8.8 |
9.2 |
19.9% |
|
|
Gap, GAP(T) |
(0.5) |
(0.8) |
(1.2) |
(2.1) |
(2.9) |
(4.7) |
(5.2) |
(6.3) |
(7.3) |
(7.9) |
(8.2) |
38.5% |
|
|
|||||||||||||
Source: Cytonn Research 2020, Building Plan Approvals Data from the Nairobi City County
Section III: Commercial Office Performance, by Location and by Grades
The commercial office sector performance softened in 2020 recording a 0.5% points decline in average rental yields to 7.0% from 7.5% in 2019. Occupancy rates declined by 2.6% points to 77.7% in 2020, from 80.3%, in 2019. Asking rents and prices declined by 3.0% and 2.8% respectively to an average of Kshs 93 and Kshs 12,280 per SQFT in 2020 from per SQFT from Kshs 96 and Kshs 12,638 per SQFT, respectively in 2019. The subdued performance was largely driven by:
- Increased supply with the introduction of 0.8 mn SQFT office space to the market resulting to reduced occupancies and hence an oversupply of 7.3 mn SQFT which has forced developers and landlords to reduce or maintain prices and rents in order to remain competitive and attract occupants to their office spaces, and,
- The Covid -19 lockdown measures leading businesses to restructure their operations leading to lower demands for office space.
The table below summarizes the performance of the commercial office theme over time:
(All Values in Kshs Unless Stated Otherwise)
|
Commercial Office Market Performance Summary |
||||||||
|
Year |
2013 |
2015 |
2016 |
2017 |
2018* |
2019 |
2020 |
y/y ∆ 2020 |
|
Occupancy (%) |
90.0% |
89.0% |
88.0% |
82.6% |
83.8% |
80.3% |
77.7% |
(2.6%) points |
|
Asking Rents (Kshs/SQFT) |
95 |
97 |
97 |
101 |
101 |
96 |
93 |
(3.0%) |
|
Average Prices (Kshs/SQFT) |
12,433 |
12,776 |
12,031 |
12,649 |
12,407 |
12,638 |
12,280 |
(2.8%) |
|
Average Rental Yields (%) |
8.3% |
8.1% |
8.5% |
7.9% |
8.3% |
7.5% |
7.0% |
(0.5%) points |
Source: Cytonn Research 2020
- Commercial Office Performance by Nodes
For submarket analysis, we classified the main office nodes in the Nairobi Metropolitan Area into 9 nodes: i) Nairobi CBD, ii) Westlands, covering environs including Riverside, iii) Parklands, iv) Mombasa Road, v) Thika Road, vi) Upperhill, vii) Karen, viii) Gigiri, and ix) Kilimani, which includes offices in Kilimani, Kileleshwa and Lavington.
In 2020, Gigiri, Karen and Westlands were the best performers recording an average rental yield of 8.5%, 7.8%, and 7.8%, respectively, due to their superior locations leading to the possibility of charging premium rents and the availability of quality Grade A offices.
Thika Road and Mombasa Road were the worst performing nodes recording rental yields of 5.8% and 4.8%, respectively, attributed to poor location as a result of traffic congestions, and lower quality office spaces, that are generally unattractive to many businesses.
The Nairobi Metropolitan Area sub-market office performance is as summarized in the table below:
(All Values in Kshs Unless Stated Otherwise)
|
Commercial Office Market Performance by Nodes - 2020 |
|||||||||||
|
Nodes |
Price Kshs/SQFT 2020 |
Rent Kshs/SQFT 2020 |
Occupancy 2020 (%) |
Rental Yields (%) 2020 |
Price Kshs/ SQFT 2019 |
Rent Kshs/SQFT 2019 |
Occupancy 2019(%) |
Rental Yield (%) 2019 |
∆ in Rent |
∆ in Occupancy (% points) |
∆ in Rental Yields (% points) |
|
Gigiri |
13,401 |
116 |
82.5% |
8.5% |
13,833 |
117 |
80.4% |
9.2% |
(0.9%) |
2.1% |
(0.7%) |
|
Karen |
13,567 |
106 |
83.6% |
7.8% |
13,665 |
111 |
85.3% |
8.3% |
(4.6%) |
(1.7%) |
(0.5%) |
|
Parklands |
10,958 |
93 |
79.9% |
7.6% |
12,369 |
97 |
83.1% |
8.2% |
(4.9%) |
(3.2%) |
(0.6%) |
|
Westlands |
11,975 |
104 |
74.4% |
7.8% |
12,370 |
104 |
80.3% |
8.3% |
(0.3%) |
(5.9%) |
(0.5%) |
|
Upperhill |
12,684 |
92 |
78.5% |
6.9% |
12,397 |
98 |
80.0% |
7.5% |
(6.3%) |
(1.5%) |
(0.6%) |
|
Nairobi CBD |
11,889 |
82 |
82.4% |
6.8% |
12,425 |
89 |
85.6% |
7.1% |
(8.3%) |
(3.2%) |
(0.3%) |
|
Kilimani |
12,233 |
93 |
79.1% |
6.8% |
12,680 |
91 |
80.9% |
7.1% |
1.6% |
(1.8%) |
(0.3%) |
|
Thika Road |
12,500 |
80 |
76.1% |
5.8% |
12,600 |
84 |
80.4% |
6.3% |
(5.0%) |
(4.3%) |
(0.5%) |
|
Msa Road |
11,313 |
73 |
63.0% |
4.8% |
11,400 |
73 |
66.5% |
5.5% |
(0.2%) |
(3.5%) |
(0.7%) |
|
Average |
12,280 |
93 |
77.7% |
7.0% |
12,638 |
96 |
80.3% |
7.5% |
(3.2%) |
(2.6%) |
(0.5%) |
Source: Cytonn Research 2020
- Commercial Office Performance by Class/Grade:
Commercial office buildings are classified into three main categories based on the size and quality of office spaces. These are:
- Grade A: Office buildings with a total area ranging from 100,001 - 300,000 SQFT that are pacesetters in establishing rents and that generally have ample natural good lighting, good views, prestigious finishing, and on-site undercover parking, and a minimum parking ratio of 3:1000 SQFT,
- Grade B: Office buildings with a total area ranging from 50,000 to 100,000 SQFT. They have good (but lower than Grade A) technical services and ample parking space, and,
- Grade C: These are buildings of any size, usually older, and in need of renovation, they lack lobbies and may not have on-site parking space. They charge below average rental rates.
The performance across the three offices grades declined with the average yields on the Grade A, Grade B and Grade C decline to 6.8%, 7.5% and 6.8% from 7.4%, 7.9% and 7.2% respectively.
Grade B office spaces had the highest rental yields at 7.5% as tenants prefer them because of their cheaper rents as compared to grade A office while having decent technical services (not as good as those of grade A) and ample security
Grade A offices recorded an overall increase in occupancy rates by 2.5% points in 2020 to 76.3% from 73.8% in 2019. Grade A offices recorded the largest drop in the average rental rates by 3.8% points which led to the largest drop in rental yields by 0.6% points compared to grade B and C offices which both recorded declines of 0.4% points.
The performance according to grades/class is as summarized in the table below:
(All Values in Kshs Unless Stated Otherwise)
|
Commercial Office Market Performance by Grades - 2020 |
|||||||||||
|
Office Grade |
Price 2020 Kshs/SQFT |
Rent 2020 Kshs/SQFT |
Occupancy 2020 (%) |
Rental Yield 2020 |
Price 2019 Kshs/ SQFT |
Rent 2019 (Kshs/SQFT) |
Occupancy 2019 (%) |
Rental Yield 2019(%) |
∆ Rent Y/Y |
∆ Occupancy Y/Y (% points) |
∆ Rental Yield Y/Y (%points) |
|
Grade A |
13,628 |
101 |
76.3% |
6.8% |
12,860 |
105 |
73.8% |
7.4% |
(3.8%) |
2.5% |
(0.6%) |
|
Grade B |
12,202 |
96 |
78.7% |
7.5% |
12,706 |
99 |
82.7% |
7.9% |
(3.1%) |
(4.0%) |
(0.4%) |
|
Grade C |
10,721 |
85 |
74.3% |
6.8% |
10,920 |
82 |
80.4% |
7.2% |
3.1% |
(6.1%) |
(0.4%) |
|
Average |
12,167 |
95 |
77.4% |
7.2% |
12,552 |
97 |
80.5% |
7.7% |
(1.5%) |
(2.5%) |
(0.5%) |
Source: Cytonn Research 2020
- Commercial Office Performance by Class and Node:
In 2020, Grade A offices in Gigiri and Karen offered the highest returns with average rental yields of 8.4% and 7.6%, respectively, as they enjoy a superior locations characterized by serene environment attracting high-end clients and premium rental rates. The Grade B offices in Gigiri and parklands had the highest rental yields of 8.6% and 8.5%, respectively. In the Grade C category, Gigiri, had the best returns with average rental yields being 8.5% while Westlands and Karen came in at the second place with both offering average rental yields of 7.8%.
The class performance by node is as summarized in the table below with the best performing areas of each grade highlighted in yellow:
|
Commercial Office Performance in 2020 by Nodes and Grades |
||||||
|
Typology |
Grade A |
Grade B |
Grade C |
|||
|
Location |
Rental Yield (%) |
Occupancy (%) |
Rental Yield (%) |
Occupancy (%) |
Rental Yield (%) |
Occupancy (%) |
|
Gigiri |
8.4% |
80.5% |
8.6% |
85.6% |
8.5% |
82.5% |
|
Karen |
7.6% |
85.0% |
7.9% |
83.1% |
7.8% |
83.6% |
|
Kilimani |
7.4% |
79.0% |
6.7% |
78.9% |
6.8% |
79.1% |
|
Msa Road |
3.9% |
60.0% |
6.0% |
70.0% |
4.8% |
63.0% |
|
Parklands |
7.3% |
76.7% |
8.5% |
78.1% |
7.6% |
79.9% |
|
Thika Road |
6.7% |
85.0% |
5.5% |
73.6% |
5.8% |
76.1% |
|
UpperHill |
6.4% |
72.1% |
6.9% |
81.2% |
6.9% |
78.5% |
|
Westlands |
6.3% |
76.3% |
8.2% |
75.7% |
7.8% |
74.4% |
|
Nairobi CBD |
6.8% |
84.5% |
6.8% |
82.4% |
||
Source: Cytonn Research 2020
- Serviced Offices
In 2020, serviced offices recorded yields of 11.2%, 4.2% points higher than the un-serviced offices' yield of 7.0%. This is attributed to the attractiveness of the office setup to small businesses, start-ups and freelancers due to; (i) flexibility of the leases, (ii) no set-up costs required, and, (iii) opportunities for collaboration with other individuals/businesses in a competitive working environment.
Westlands and Karen were the best performing nodes recording rental yields of 15.9% and 14.8%, compared to 7.6% and 7.8% for Unserviced offices respectively in the same areas.
(All values in Kshs Unless Stated Otherwise)
|
Serviced and Unserviced Office Performance Comparison-2020 |
||||||
|
Location |
Revenue Per SQFT |
Occupancy (%) |
Yield |
|||
|
|
Serviced Offices |
Un-serviced Offices |
Serviced Offices |
Un-serviced Offices |
Serviced Offices |
Un-serviced Offices |
|
Westlands |
204 |
93 |
81.2% |
79.9% |
15.9% |
7.6% |
|
Karen |
186 |
104 |
70.0% |
74.4% |
14.8% |
7.8% |
|
Parklands |
174 |
106 |
68.6% |
83.6% |
13.2% |
7.8% |
|
Gigiri |
181 |
116 |
80.0% |
82.5% |
12.4% |
8.5% |
|
Upperhill |
|
92 |
|
78.5% |
|
6.9% |
|
Kilimani |
190 |
82 |
65.0% |
82.4% |
10.8% |
6.8% |
|
Nairobi CBD |
160 |
93 |
59.3% |
79.1% |
8.5% |
6.8% |
|
Msa Rd |
105 |
73 |
50.0% |
63.0% |
7.0% |
4.8% |
|
Thika Rd |
116 |
80 |
52.5% |
76.1% |
6.6% |
5.8% |
|
Average |
161 |
93 |
65.8% |
77.7% |
11.2% |
7.0% |
Source: Cytonn Research 2020
Section IV: Office Market Outlook and the Investment Opportunity in the Sector
In conclusion: having looked at supply, demand, and investor returns, we have a general NEGATIVE outlook for the commercial office sector theme in Nairobi Metropolitan Area (NMA) due to the 7.3 mn SQFT. The continued impact of the performance of the pandemic also continues to affect the performance of the commercial office sector. We expect a slowdown in new construction activities allowing the market to absorb the current supply in the long-run. Pockets of value in the sector exist in zones with low supply and high returns such as Gigiri and in differentiated concepts such as the serviced offices.
The table below summarizes our outlook on the sector based on the various key driving factors.
|
Nairobi Commercial Office Outlook |
||||
|
Measure |
2019 Sentiment |
2020 Sentiment and 2021 Outlook |
2020 Review |
2021 Outlook |
|
Supply |
|
|
Negative |
Negative |
|
Demand |
|
|
Neutral |
Neutral |
|
Office Market Performance |
|
|
Negative |
Negative |
For 2021, our outlook for the commercial office sector is NEGATIVE with the three metrics we looked at being negative. This is attributed to the reduced demand for commercial spaces brought about by the COVID-19 pandemic amid the tough economic environment as some firms downsize due to financial constrains while others embrace the working from home concept. The asking prices and rents also continue to decline as landlords endure giving discounts and concessions to attract and retain clients. The oversupply in the commercial office is expected to continue affecting the demand for office spaces. Investment opportunity exists in zones with low supply and high returns such as Gigiri and in differentiated concepts such as the serviced offices recording average rental yields of 11.2%, 4.2% higher than the market average of 7.0%. For the full Commercial Office Report 2020, click here.
Disclaimer: The views expressed in this publication are those of the writers where particulars are not warranted. This publication, which is in compliance with Section 2 of the Capital Markets Authority Act Cap 485A, is meant for general information only and is not a warranty, representation, advice or solicitation of any nature. Readers are advised in all circumstances to seek the advice of a registered investment advisor.

- Talk to us
- Kenya
- P.O Box 20695 - 00200, Nairobi, Kenya
- Cell +254709101200
- Tel +254709101200
- WhatsApp +254741676635
- United States
- +254709101200
- DOWNLOAD OUR APP
-


- Kenya
- 8th Floor, Pinetree Plaza, Kaburu Drive, Ngong Road, Nairobi, Kenya
- USA
- Suite 1150, 1775 Eye Street NW, USA, Washington DC 20006, USA
- Investments
- High Yield
- Private Equity
- Real Estate
- Real Estate
- RiverRun Estates
- Cytonn Towers
- The Ridge
- Taraji Heights
- The Alma