Cytonn Monthly - May 2023
By Research, Jun 4, 2023
Executive Summary
Fixed Income
During the month of May 2023, T-bills were oversubscribed, with the overall average subscription rate coming in at 115.8%, higher than the 109.6% recorded in the month of April 2023. The average subscription rate for the 91-day paper decreased to 499.9%, from the 534.4% recorded in April 2023, while subscription rates for the 364-day and 182-day papers increased to 31.4% and 46.6%, from 27.3% and 21.9% respectively, recorded in April 2023. The average yields on the government papers were on an upward trajectory, with the average yields on the 364-day, 182-day and 91-day papers increasing by 37.0 bps, 40.9 bps and 43.5 bps to 11.3% and 10.8% and 10.5%, from 10.9%, 10.4% and 10.0%, respectively recorded in April 2023. For the month of May, the government accepted a total of Kshs 136.8 bn of the Kshs 139.0 bn worth of bids received, translating to an acceptance rate of 98.4%;
Additionally, in May 2023 bonds were oversubscribed, with the overall subscription rate coming in at 115.3%, up from an undersubscription rate of 26.7%, recorded in April 2023. The newly issued bond FXD1/2023/003 received bids worth Kshs 20.7 bn against the offered Kshs 20.0 bn, translating to an oversubscription rate of 103.7% with the government accepting bids worth Kshs 20.3 bn, translating to an acceptance rate of 97.8%. The bond’s first tap sale received bids worth Kshs 10.6 bn against the offered Kshs 10.0 bn, translating to an oversubscription rate of 106.0%, with the government accepting bids worth Kshs 10.6 bn translating to an acceptance rate of 100.0%. The FXD1/2023/003 second tap-sale received bids worth Kshs 27.2 bn against the offered 20.0 bn translating to an oversubscription rate of 136.0%, with the government accepting bids worth Kshs 27.2 bn translating to an acceptance rate of 100.0%;
During the week, T-bills were undersubscribed for a second consecutive week, with the overall subscription rate coming in at 98.2%, higher than the 91.9% recorded the previous week. Investor’s preference for the shorter 91-day paper persisted as they sought to avoid duration risk, with the paper receiving bids worth Kshs 23.6 bn against the offered Kshs 4.0 bn, translating to an oversubscription rate of 511.3%, up from 356.1% recorded the previous week. The subscription rates for the 364-day paper and 182-day papers decreased to 25.6% and 5.5%, from 37.6% and 40.4% recorded the previous week, respectively. The government accepted bids worth Kshs 20.6 bn out of the Kshs 23.6 bn total bids received, translating to an acceptance rate of 87.6%. The yields on the government papers recorded mixed performance with the yields on the 364-day and 91-day papers increasing by 4.0 bps and 27.1 bps to 11.5% and 11.1%, respectively, while the yield on the 182-day paper declined by 0.1 bps to 11.1%;
In the primary bond market, the government is seeking to raise additional Kshs 60.0 bn for funding of infrastructure projects in the current financial year by issuing a new 7-year amortized bond, IFB1/2023/007. The minimum bidding amount is Kshs 100,000.0, and the bond will be tax free as is the case of infrastructure bonds as provided under the income tax act. Key to note, the bond’s coupon rate will be market determined and the period of sale runs from 26 May 2023 to 13 June 2023. We anticipate the bond to be oversubscribed given its tax-free nature, however we expect investors to bid at higher rates given the country’s debt sustainability concerns. Our recommended bidding range for the bond is 13.9% - 14.4% based on bonds of similar tenor and nature trading range. For instance; IFB1/2020/009, with remaining tenor to maturity of 5.8 years is trading at yield to maturity of 13.88% and IFB1/2022/11 with remaining tenor to maturity years of 8.2 years is trading at a yield to maturity of 13.93%;
Also, during the week, the World Bank approved a USD 1.0 bn (Kshs 138.6 bn) loan under the Development Policy Operation (DPO) to provide low cost budget financing, as well as to support key policy and institutional reforms for Kenya’s near term objectives of fiscal consolidations and long term goal of green and inclusive growth;
The y/y inflation in May 2023 increased marginally to 8.0%, from the 7.9% recorded in April 2023. This was in line with our projection of an increase to a range of 7.9% to 8.3%;
Additionally, during the week the Monetary Policy Committee (MPC) met on 29 May, 2023 to review the outcome of its previous policy decisions and recent economic developments, and to decide on the direction of the Central Bank Rate (CBR). The MPC retained the CBR rate at 9.50%, which was in line with our expectations of the MPC to maintain the CBR rate;
Equities
During the month of May, the equities market was on a downward trajectory, with NASI, NSE 20 and NSE 25 declining by 3.7%, 2.0% and 6.7% respectively. The equities market performance was driven by losses recorded by large cap stocks such as Equity Group, Diamond Trust Bank (DTB-K), BAT, Cooperative Bank, NCBA and ABSA Bank of 17.2%, 16.5%, 14.4%, 9.0%, 8.9% and 6.6%, respectively. The losses were however mitigated by gains recorded by large cap stocks such as Standard Chartered Bank of Kenya (SCBK) and Bamburi of 6.9% and 4.8%, respectively.
During the week, the equities market was on an upward trajectory, with NASI, NSE 20 and NSE 25 gaining by 7.3%, 4.6% and 6.3%, respectively, taking the YTD performance to losses of 17.5%, 7.1%, and 14.0% for NASI, NSE 20, and NSE 25, respectively. The equities market performance was mainly driven by gains recorded by large cap stocks such as Safaricom, Standard Chartered Bank of Kenya (SCBK), ABSA Bank and NCBA of 12.6%, 9.1%, 7.4% and 6.9%, respectively. The gains were however weighed down by losses recorded by other large cap stocks such as BAT and Bamburi of 5.6% and 3.2%, respectively.
During the week, four listed banks released their Q1’2023 financial results with HF Group, ABSA Bank and Diamond Trust Bank (DTB-K) recording an increase in their Core Earnings Per Share of 143.5%, 50.7% and 11.3%, respectively, while I&M Group recorded a decline of 2.0% in its Core Earnings Per Share;
Real Estate
During the week, French retailer Carrefour Supermarket, opened a new outlet at the Business Bay Square (BBS) mall located in Eastleigh, Nairobi, bringing the retailer’s number of operating outlets countrywide to 20. In the Regulated Real Estate Funds, under the Real Estate Investment Trusts (REITs) segment, Fahari I-REIT closed the week trading at an average price of Kshs 6.0 per share in the Nairobi Securities Exchange, representing a 4.9% increase from Kshs 5.9 per share recorded the previous week. On the Unquoted Securities Platform, as at 26 May 2023, Acorn D-REIT and I-REIT closed the week trading at Kshs 23.9 and Kshs 21.6 per unit, respectively, a 19.4% and 7.9% gain for the D-REIT and I-REIT, respectively, from the Kshs 20.0 inception price. In addition, Cytonn High Yield Fund (CHYF) closed the week with an annualized yield of 13.6%, remaining relatively unchanged from the previous week;
Investment Updates:
- Weekly Rates:
- Cytonn Money Market Fund closed the week at a yield of 11.22%. To invest, dial *809# or download the Cytonn App from Google Playstore here or from the Appstore here;
- Cytonn High Yield Fund closed the week at a yield of 13.63% p.a. To invest, email us at sales@cytonn.com and to withdraw the interest, dial *809# or download the Cytonn App from Google Playstore here or from the Appstore here;
- We continue to offer Wealth Management Training every Wednesday and every third Saturday of the month, from 9:00 am to 11:00 am, through our Cytonn Foundation. The training aims to grow financial literacy among the general public. To register for any of our Wealth Management Trainings, click here;
- If interested in our Private Wealth Management Training for your employees or investment group, please get in touch with us through wmt@cytonn.com;
- Cytonn Insurance Agency acts as an intermediary for those looking to secure their assets and loved ones’ future through insurance namely; Motor, Medical, Life, Property, WIBA, Credit and Fire and Burglary insurance covers. For assistance, get in touch with us through insuranceagency@cytonn.com;
- Cytonn Asset Managers Limited (CAML) continues to offer pension products to meet the needs of both individual clients who want to save for their retirement during their working years and Institutional clients that want to contribute on behalf of their employees to help them build their retirement pot. To more about our pension schemes, kindly get in touch with us through pensions@cytonn.com;
Real Estate Updates:
- For an exclusive tour of Cytonn’s real estate developments, visit: Sharp Investor's Tour, and for more information, email us at sales@cytonn.com;
- Phase 3 of The Alma is now ready for occupation and the show house is open daily. To join the waiting list to rent, please email properties@cytonn.com;
- For Third Party Real Estate Consultancy Services, email us at rdo@cytonn.com;
- For recent news about the group, see our news section here;
Hospitality Updates:
- We currently have promotions for Staycations. Visit cysuites.com/offers for details or email us at sales@cysuites.com;
Money Markets, T-Bills Primary Auction:
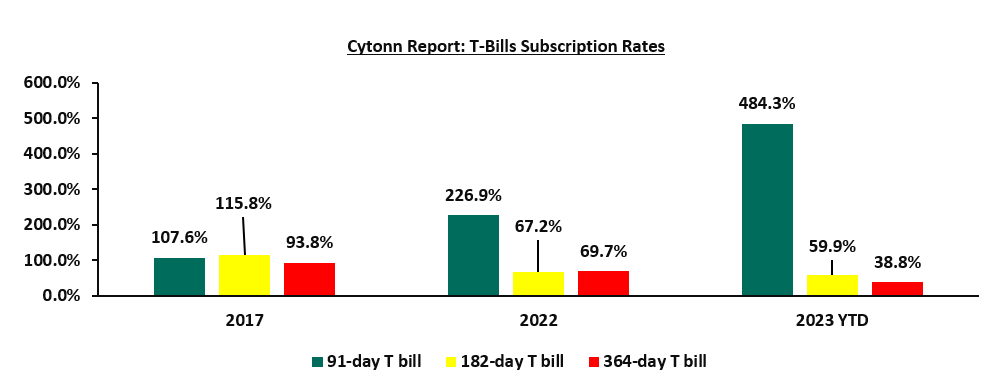
During the month of May 2023, T-bills were oversubscribed, with the overall average subscription rate coming in at 115.8%, higher than the 109.6% recorded in the month of April 2023. The average subscription rate for the 91-day paper decreased to 499.9% from the 534.4% recorded in April 2023, while subscription rates for the 364-day and 182-day papers increased to 31.4% and 46.6%, from 27.3% and 21.9% respectively, recorded in April 2023. The average yields on the government papers were on an upward trajectory, with the average yields on the 364-day, 182-day and 91-day papers increasing by 37.0 bps, 40.9 bps and 43.5 bps to 11.3% and 10.8% and 10.5%, from 10.9%, 10.4% and 10.0%, respectively recorded in April 2023. For the month of May, the government accepted a total of Kshs 136.8 bn of the Kshs 139.0 bn worth of bids received, translating to an acceptance rate of 98.4%.
During the week, T-bills were undersubscribed for a second consecutive week, with the overall subscription rate coming in at 98.2%, higher than 91.9% recorded the previous week. Investor’s preference for the shorter 91-day paper persisted as they sought to avoid duration risk, with the paper receiving bids worth Kshs 23.6 bn against the offered Kshs 4.0 bn, translating to an oversubscription rate of 511.3%, up from 356.1% recorded the previous week. The subscription rates for the 364-day paper and 182-day papers decreased to 25.6% and 5.5%, from 37.6% and 40.4% recorded the previous week, respectively. The government accepted bids worth Kshs 20.6 bn out of the Kshs 23.6 bn total bids received, translating to an acceptance rate of 87.6%. The yields on the government papers recorded mixed performance with the yields on the 364-day and 91-day papers increasing by 4.0 bps and 27.1 bps to 11.5% and 11.1%, respectively, while the yield on the 182-day paper declined by 0.1 bps to 11.1%. The chart below compares the overall average T- bills subscription rates obtained in 2017, 2022 and 2023 Year to Date (YTD):
The May 2023 bonds were oversubscribed, with the overall subscription rate coming in at 115.3%, up from an undersubscription rate of 26.7%, recorded in April 2023. The newly issued bond FXD1/2023/003 received bids worth Kshs 20.7 bn against the offered Kshs 20.0 bn, translating to an oversubscription rate of 103.7% with the government accepting bids worth Kshs 20.3 bn, translating to an acceptance rate of 97.8%. The bond’s first tap sale received bids worth Kshs 10.6 bn against the offered Kshs 10.0 bn, translating to an oversubscription rate of 106.0%, with the government accepting bids worth Kshs 10.6 bn translating to an acceptance rate of 100.0%. The FXD1/2023/003 second tap-sale received bids worth Kshs 27.2 bn against the offered 20.0 bn translating to an oversubscription rate of 136.0%, with the government accepting bids worth Kshs 27.2 bn translating to an acceptance rate of 100.0%. The table below provides more details on the bonds issued during the month of May 2023:
|
Cytonn Report: Treasury Bonds Issued in May 2023 |
|||||||||
|
Issue Date |
Bond Auctioned |
Effective Tenor to Maturity (Years) |
Coupon |
Amount offered (Kshs bn) |
Actual Amount Raised/Accepted (Kshs bn) |
Total bids received (Subscription) |
Average Accepted Yield |
Subscription Rate |
Acceptance Rate |
|
15/05/2023 |
FXD1/2023/003 |
3.0 |
14.2% |
20.0 |
20.3 |
20.7 |
14.2% |
103.7% |
97.8% |
|
22/05/2023 |
FXD1/2023/003-Tap sale |
3.0 |
14.2% |
10.0 |
10.6 |
10.6 |
14.2% |
106.0% |
100.0% |
|
29/05/2023 |
FXD1/2023/03 – Tap sale |
3.0 |
14.2% |
20.0 |
27.2 |
27.2 |
14.2% |
136.0% |
100.0% |
|
May 2023 Average |
3.0 |
14.2% |
50.0 |
58.1 |
58.6 |
14.2% |
115.3% |
99.3% |
|
|
April 2023 Average |
8.3 |
12.9% |
60.0 |
10.2 |
16.0 |
14.4% |
26.7% |
63.9% |
|
Source: Central Bank of Kenya (CBK)
In the primary bond market, the government is seeking to raise additional Kshs 60.0 bn for funding of infrastructure projects in the current financial year by issuing a new 7-year bond amortized bond, IFB1/2023/007. The minimum bidding amount is Kshs 100,000.0, and the bond will be tax free as is the case of infrastructure bonds as provided under the income tax act. Key to note, the bond’s coupon rate will be market determined and the period of sale runs from 26 May 2023 to 13 June 2023. We anticipate the bond to be oversubscribed given its tax-free nature, however we expect investors to bid at higher rates given the country’s debt sustainability concerns. Our recommended bidding range for the bond is 13.9% - 14.4% based on bonds of similar tenor and nature trading range; for instance, IFB1/2020/009, with remaining tenor to maturity of 5.8 years is trading at yield to maturity of 13.88% and IFB1/2022/11 with remaining tenor to maturity years of 8.2 years is trading at a yield to maturity of 13.93%.
Secondary Bond Market:
The yields on the government securities were on an upward trajectory during the month compared to the same period in 2022 as a result of the elevated inflationary pressures leading to investors attaching higher risk premiums. The chart below shows the yield curve movement during the period:
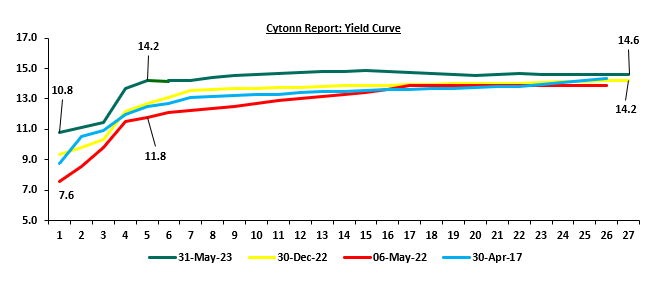
The secondary bond turnover increased by 78.5% to Kshs 68.0 bn, from Kshs 38.7 bn recorded in April 2023, pointing towards increased activities by commercial banks in the secondary bonds market. On a year on year basis, the bonds turnover increased by 16.1% from Kshs 58.6 bn worth of treasury bonds transacted over a similar period last year.
Money Market Performance:
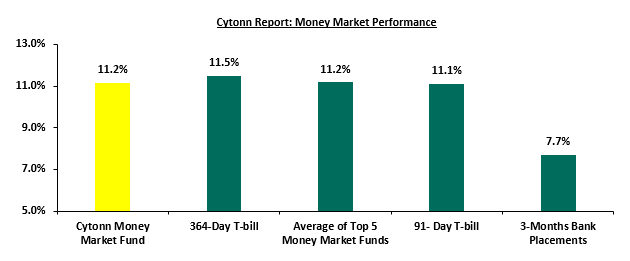
In the money markets, 3-month bank placements ended the week at 7.7% (based on what we have been offered by various banks), while the yield on the 364-day and 91-day T-bill increased by 4.0 bps and 27.1 bps to 11.5% and 11.1%, respectively. The yields of Cytonn Money Market Fund remained relatively unchanged from 11.2% recorded the previous week, while the average yields on the Top 5 Money Market Funds increased by 5.8 bps to 11.2% from 11.1 recorded the previous week.
The table below shows the Money Market Fund Yields for Kenyan Fund Managers as published on 1 June 2023:
|
Money Market Fund Yield for Fund Managers as published on 1 June 2023 |
||
|
Rank |
Fund Manager |
Effective Annual Rate |
|
1 |
Etica Money Market Fund |
11.8% |
|
2 |
Cytonn Money Market Fund (dial *809# or download the Cytonn app) |
11.2% |
|
3 |
Apollo Money Market Fund |
11.1% |
|
4 |
Madison Money Market Fund |
11.0% |
|
5 |
Dry Associates Money Market Fund |
10.9% |
|
6 |
GenAfrica Money Market Fund |
10.9% |
|
7 |
Jubilee Money Market Fund |
10.8% |
|
8 |
Enwealth Money Market Fund |
10.8% |
|
9 |
AA Kenya Shillings Fund |
10.6% |
|
10 |
Kuza Money Market fund |
10.6% |
|
11 |
Co-op Money Market Fund |
10.4% |
|
12 |
Old Mutual Money Market Fund |
10.2% |
|
13 |
NCBA Money Market Fund |
10.2% |
|
14 |
Sanlam Money Market Fund |
10.2% |
|
15 |
Nabo Africa Money Market Fund |
10.1% |
|
16 |
Zimele Money Market Fund |
9.9% |
|
17 |
GenCap Hela Imara Money Market Fund |
9.7% |
|
18 |
British-American Money Market Fund |
9.6% |
|
19 |
ICEA Lion Money Market Fund |
9.6% |
|
20 |
CIC Money Market Fund |
9.6% |
|
21 |
Orient Kasha Money Market Fund |
9.4% |
|
22 |
KCB Money Market Fund |
9.2% |
|
23 |
Absa Shilling Money Market Fund |
8.8% |
|
24 |
Mali Money Market Fund |
8.4% |
|
25 |
Equity Money Market Fund |
8.1% |
Source: Business Daily
Liquidity:
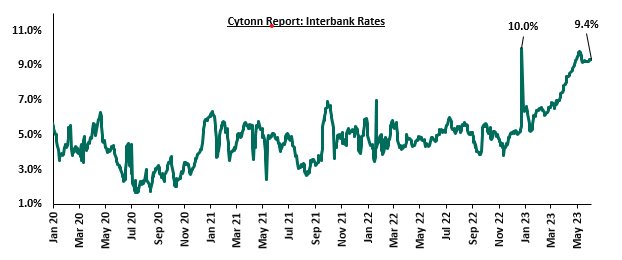
Liquidity in the money markets tightened in the month of May 2023, with the average interbank rate increasing to 9.4%, from 8.6%, recorded in April 2023. Also, during the week, liquidity in the money markets tightened, with the average interbank rate increasing to 9.3%, from 9.2% recorded the previous week, partly attributable to tax remittances that offset government payments. The average interbank volumes traded declined by 10.8% to Kshs 22.9 bn, from Kshs 25.7 bn recorded the previous week. The chart below shows the interbank rates in the market over the years:
Kenya Eurobonds:
During the month, the yields on the Eurobonds were on a downward trajectory despite the prevailing uncertainties surrounding the elevated inflationary pressures and local currency depreciation. The yield on the 10-year Eurobond issued in 2014 recorded the largest decline of 5.0% points to 15.6% in May 2023, from 20.6% recorded in April 2023.
During the week, the yields on Eurobonds were also a downward trajectory with the yield on the 7-year Eurobond issued in 2019 recording the largest decline having declined by 0.3% points to 13.0%, from 13.3%, recorded the previous week. The table below shows the summary of the performance of the Kenyan Eurobonds as of 1 June 2023;
|
Cytonn Report: Kenya Eurobonds Performance |
||||||
|
|
2014 |
2018 |
2019 |
2021 |
||
|
Date |
10-year issue |
10-year issue |
30-year issue |
7-year issue |
12-year issue |
12-year issue |
|
Amount Issued (USD) |
2.0 bn |
1.0 bn |
1.0 bn |
0.9 bn |
1.2 bn |
1.0 bn |
|
Years to Maturity |
1.1 |
4.8 |
24.8 |
4.0 |
9.0 |
11.1 |
|
Yields at Issue |
6.6% |
7.3% |
8.3% |
7.0% |
7.9% |
6.2% |
|
02-Jan-23 |
12.9% |
10.5% |
10.9% |
10.9% |
10.8% |
9.9% |
|
28-Apr-23 |
20.6% |
14.1% |
12.7% |
15.5% |
13.2% |
12.4% |
|
25-May-23 |
15.7% |
12.1% |
11.6% |
13.3% |
12.1% |
11.2% |
|
26-May-23 |
15.7% |
12.1% |
11.6% |
13.3% |
12.1% |
11.2% |
|
29-May-23 |
15.7% |
12.1% |
11.6% |
13.3% |
12.1% |
11.2% |
|
30-May-23 |
15.2% |
11.9% |
11.5% |
13.1% |
11.9% |
11.1% |
|
31-May-23 |
15.6% |
11.9% |
11.6% |
13.1% |
11.9% |
11.1% |
|
01-Jun-23 |
15.5% |
11.9% |
11.5% |
13.0% |
11.9% |
11.0% |
|
Weekly Change |
(0.2%) |
(0.2%) |
(0.1%) |
(0.3%) |
(0.2%) |
(0.2%) |
|
MTM change |
(5.0%) |
(2.1%) |
(1.1%) |
(2.4%) |
(1.3%) |
(1.3%) |
|
YTD Change |
2.6% |
1.4% |
0.6% |
2.1% |
1.1% |
1.1% |
Source: Source: Central Bank of Kenya (CBK) and National Treasury
Kenya Shilling:
During the month, the Kenya Shilling depreciated by 1.9% against the US Dollar, to close the month at Kshs 138.5, from Kshs 135.9 recorded at the end of April 2023, partly attributable to the increased dollar demand from importers, especially oil and energy sectors against a slower supply of hard currency.
Also, during the week, the Kenya Shilling depreciated by 0.3% against the US dollar to close the week at Kshs 138.6, from Kshs 138.3 recorded the previous week, partly attributable to increased dollar demand from importers, especially oil and energy sectors against a slower supply of hard currency. On a year to date basis, the shilling has depreciated by 12.3% against the dollar, adding to the 9.0% depreciation recorded in 2022. We expect the shilling to remain under pressure in 2023 as a result of:
- High global crude oil prices on the back of persistent supply chain bottlenecks coupled with high demand,
- An ever-present current account deficit estimated at 4.9% of GDP in twelve months to January 2023, from 5.6% recorded in a similar period last year, and,
- The need for Government debt servicing which continues to put pressure on forex reserves given that 67.3% of Kenya’s External debt was US Dollar denominated as of March 2023,
The shilling is however expected to be supported by:
- Diaspora remittances standing at a cumulative USD 1,335.9 mn in 2023 as of April 2023, albeit 3.1% lower than the USD 1,378.9 mn recorded over the same period in 2022, and,
- The tourism inflow receipts that came in at USD 268.1 bn in 2022, a significant 82.9% increase from USD 146.5 bn inflow receipts recorded in 2021.
Key to note, Kenya’s forex reserves increased by 0.5% during the week to remain relatively unchanged at USD 6.5 bn as at 31 May 2023. As such, the country’s months of import cover also remained relatively unchanged at 3.6 months, similar to what was recorded the previous week, and remained below the statutory requirement of maintaining at least 4.0-months of import cover. Key to note, upon the receipt of the USD 1.0 bn loan facility from the World Bank, the forex reserve months of import cover is expected to increase to 4.2 months from the current 3.6 months The chart below summarizes the evolution of Kenya months of import cover over the last 10 years:
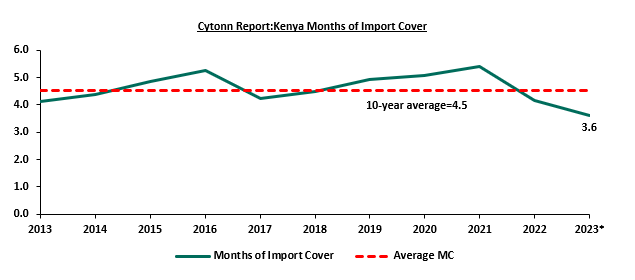
*Figure as at 31 May 2023
Weekly Highlights:
- World Bank Loan Facility
During the week, the World Bank approved a USD 1.0 bn (Kshs 138.6 bn) loan under the Development Policy Operation (DPO) to provide low cost budget financing, as well as to support key policy and institutional reforms for Kenya’s near term objectives of fiscal consolidations and long term goal of green and inclusive growth. The loan facility is the third under the Development Policy Operation (DPO) following the USD 750.0 mn issued to the country in March 2022 to support the country recovery from the COVID-19 pandemic and the USD 750.0 mn issued to the country in June 2021 to provide low-cost budget financing along with support to key policy and institutional reforms. This approval follows the previous week’s announcement by the International Monetary Fund (IMF) that it had reached a staff level agreement with Kenyan authorities to conclude the fifth reviews of Kenya’s economic program under the Extended Fund Facility (EFF) and Extended Credit Facility (ECF) arrangements, which will allow Kenya to have immediate access financing of USD 410.0 mn (Kshs 56.7 bn) once the formal review is completed by July 2023.
The new loan World Bank loan facility will support Kenya policy reforms across three pillars;
- The first bundle of policy reforms will be channelled to creation of fiscal space in a sustainable and equitable manner, including revenue and expenditure measures to support fiscal consolidation, strengthening debt management framework and protecting pro-poor expenditures,
- The second set of reforms will be aimed at boosting agricultural exports, which is the country’s largest GDP contributor. The reforms will reduce distortions in agricultural markets by eliminating administrative price-setting for publicly procured cereals. Additionally, the reforms will create an institutional framework for effective management of agricultural soils and water, as well as supporting agricultural exports through upgrading phytosanitary and food safety standards, and,
- The third wave of reforms will be aimed at strengthening the accountability and transparency through improving governance and financial inclusion for private sector driven growth. In governance, the DPO supports set of initiatives to promote objective decision making through the Conflict-of Interest Bill, to streamline the state’s orderly exits from commercial investments through amendment of the State-Owned Enterprises (SOEs) privatization Act.
We expect that the facility requirements will help to accelerate fiscal reforms in the country that will help to reduce the fiscal deficit, currently at 4.9%, in order to reduce the need for Government borrowing to bridge the gap. Additionally, inflows from the facility will help to shore up and increase the country’s foreign exchange reserves which currently stand at USD 6.5 bn representing 3.6 months of import cover and is below the minimum statutory requirement of 4.0 months of import cover. However, with the loan facility being US Dollar (USD) denominated, we expect pressure on the shilling especially as it will increase debt servicing costs with the shilling having depreciated by 12.3% against the US Dollar to close at 138.6, from Kshs 123.2 recorded at the beginning of 2023.
- May 2023 Inflation
The y/y inflation in May 2023 increased marginally by 0.1% points to 8.0%, from the 7.9% recorded in April 2023. This was in line with our projections of an increase to within a range of 7.9% to 8.3%. The headline inflation in May 2023 was majorly driven by increase in prices of commodities in the following categories, food and non-alcoholic beverages; housing, water, electricity, gas and other fuels; and transport. The table below shows a summary of both the year on year and month on month commodity indices performance:
|
Cytonn Report: Major Inflation Changes – May 2023 |
|||
|
Broad Commodity Group |
Price change m/m (April-2023/May-2023) |
Price change y/y (May-2023/May-2022) |
Reason |
|
Food and Non-Alcoholic Beverages |
1.4% |
10.2% |
The m/m increase was mainly driven by increase in price commodities such as sugar, carrots, onions, beans, maize grain, wheat flour and beef. The increase was, however, mitigated by drop in prices of commodities such as kales, cabbages and avocado |
|
Housing, Water, Electricity, Gas and Other Fuel |
0.7% |
9.7% |
The m/m change was mainly due to increase in price of 50 kilowatts and 200 kilowatts of electricity and single room monthly house rent |
|
Transport cost |
1.2% |
10.1% |
The m/m change was driven by increase in prices of petrol and diesel in the period between May 15 and June 14 2023 |
|
Overall Inflation |
0.9% |
8.0% |
The m/m was mainly driven by 1.4% increase in prices of food and non-alcoholic Beverages |
Source: Kenya National Bureau of Statistics (KNBS)
The overall headline inflation has remained above the Central Bank of Kenya (CBK) target range of 2.5%-7.5% for the past one year, despite the Monetary Policy Committee (MPC) raising its Central Bank Rate (CBR) by a cumulative 175.0 bps in 2022 and 75.0 bps on year-to-date. The increase in headline inflation in May 2023 comes amid the government move to completely remove fuel subsidy which was cushioning the citizens from high fuel prices. As a result, fuel prices increased by 1.9%, 4.0% and 10.4% to Kshs 182.7, Kshs 168.4 and Kshs 161.1 per litre of Super Petrol, Diesel and Kerosene, respectively, for the period between 15th May 2023 to 14th June 2023. The chart below shows the inflation rates for the past 5 years:
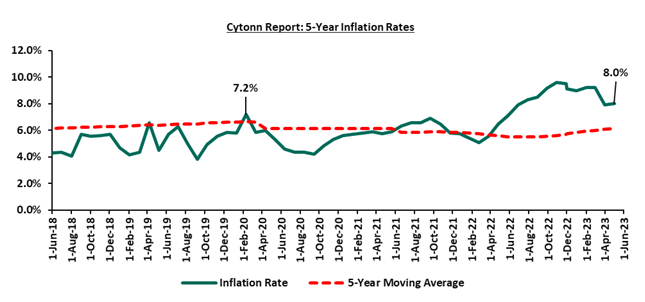
Additionally, the increase in inflation rate was underpinned by the current rally in prices of sugar in the country, partly attributed to the shortage of sugar supply in the market on low imports. This comes on the back of suppliers being conservative of holding expensive stocks at a point when the government is importing duty-free sugar and as such they might end up incurring losses. Key to note, the high commodity prices in the country are also attributed to the sustained depreciation of the Kenya Shilling which has inflated the import bills. As a result, manufacturers pass on the cost to consumers through hike in consumer prices. Going forward, we expect inflationary pressures to persist in the short term, however to ease in the medium term to CBK’s target range of 2.5% to 7.5% aided by easing in global commodity prices and easing of domestic food prices on account of favorable weather conditions. We also expect the measures taken by the government to subsidize major inputs of agricultural production such as fertilizers to lower the cost of farm inputs and support the easing of inflation in the long term.
- May 2023 MPC Meeting
The Monetary Policy Committee (MPC) met on 29 May, 2023 to review the outcome of its previous policy decisions and recent economic developments, and to decide on the direction of the Central Bank Rate (CBR). The MPC retained the CBR rate at 9.50%, which was in line our expectations of the MPC to maintain the CBR rate at the current rate of 9.50%. Below are some of the key highlights from the meeting:
- The headline inflation eased to 7.9% in April 2023, from 9.2% in March 2023 driven by softened food prices. Food inflation declined to 10.1% in April 2023 from 13.4% in March 2023, attributable to lower prices of vegetables as a result of the ongoing rains, and improved supply of select non-vegetable food items. Fuel inflation remained elevated at 13.2% in April, largely attributable to increased electricity prices occasioned by higher tariffs and the scaling down of the fuel subsidy. We expect the overall inflation to remain elevated in the short term due to high fuel and food prices, however, to ease in the long-term as global supply constraints eases,
- The recently released economic survey 2023 showed the Kenya economy remained resilient in 2022, despite the subdued agriculture performance due to erratic weather conditions during the period. The economy recorded a real GDP growth of 4.8% 2022, mainly driven by sustained performance of the services sector particularly transport and storage, financial and insurance, information and communication, and accommodation and food services. Additionally, the economy is expected to continue to strengthen in 2023, mainly driven by increased activities in the services sector and expected recovery in agriculture,
- Goods export remained strong with export growing by 6.6% in the 12 months to April 2023 compared to 11.1% in same period in 2022. Receipts from tea and manufactured goods exports increased by 11.6% and 30.4%, respectively, attributed to increased demand from traditional markets. Additionally, imports grew by 1.2% in the twelve months to April 2023, compared to 21.3% in a similar period in 2022. The slowed growth of imports is partly attributable to drop of imports of infrastructure related equipment, mainly on the back of completed projects. Receipts from services exports rebounded significantly reflecting sustained improvement in international travel and transport. Remittances in the 12 months to April 2023 totaled to USD 3,985.0 mn, 0.4% higher than USD 3,969.0 bn recorded in the same period in 2022. Despite the development, the current account deficit is estimated at 4.9% of the GDP in 2022 and projected at 5.4% of GDP in 2023,
- The CBK foreign exchange reserves which currently stand at USD 6.5 bn representing a 3.6 months of import cover, continues to provide adequate cover against any short term shocks in the foreign exchange markets,
- The banking sector remained stable and resilient, with strong liquidity and capital adequacy ratios. The ratio of gross non-performing loans (NPLs) to gross loans stood at 14.6% in April 2023, compared to 14.0% in February 2023. Increases in NPLs were noted in the manufacturing, real estate, building and construction, and trade sectors. However, banks have continued to make adequate provisions for the NPLs,
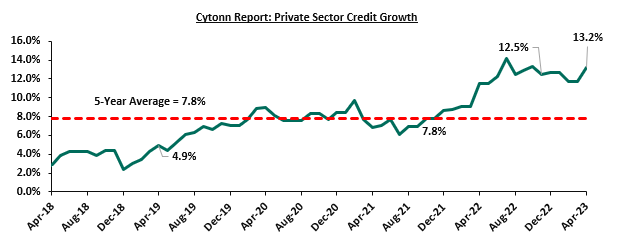
- Growth in private sector credit increased to 13.2% in April 2023 compared to 11.7% in February 2023, attributed to strong credit growth in sectors such as; manufacturing, transport and communication, and trade of 21.7%, 18.0% and 13.7%, respectively. Additionally, the number of loans approval increased, reflecting improved demand with increased economic activities. The chart below shows the movement of the private sector credit growth of the last five years:
- The Committee noted the ongoing implementation of the FY2022/23 Government Budget, particularly the recent strong tax revenue collection reflecting enhanced tax administration efforts, evidenced by the revenue collections of Kshs 1,639.8 bn in the FY’2022/2023 as at the end of April, equivalent to 78.4% of the revised estimates of Kshs 2,192.0 bn for FY’2022/2023 and was 89.8% of the prorated estimates of Kshs 1,826.7 bn. The committee also noted the proposed FY2023/24 budget is expected to support the envisaged fiscal consolidation in the medium term.
The committee noted that, the impact of its move to tighten the monetary policy in March 2023 to anchor inflationary pressures was still in effect to the economy and therefore it concluded that the current stance on monetary policy was appropriate and decided to retain the Central Bank Rate at 9.50%. Additionally, the committee noted that the recent measures by the government to allow limited duty-free imports on certain food items, such as sugar are expected to moderate prices and consequently ease domestic inflationary pressures. However, we expect the inflationary pressures to remain elevated in the short term above the CBK’s ceiling of 7.5% mainly on the back of high food and fuel prices, which are key components in headline inflation index. The Committee will meet again in July 2023, but will closely monitor the impact of the policy measures as well as development in domestic and global economy and take additional measures as necessary.
Monthly Highlights:
- The Central Bank of Kenya announced the issuance and usage of the Kenya Quick Response Code Standard 2023 (KE-QR Code Standard 2023). The Standard will guide banks and payment service providers that are approved and regulated by the Central Bank in issuing of Quick Response Codes to consumers and businesses that accept digital payments. For more information, please see our Cytonn weekly #18/2023,
- Stanbic bank released its monthly Purchasing Manager’s Index (PMI),highlighting that the index for the month of April 2023 came in at 47.2, down from 49.2 in March 2023, which pointed towards further deterioration in the business environment for the third consecutive month in 2023. For more information, please see our Cytonn weekly #18/2023,
- The Cabinet Secretary for the National Treasury submitted the Finance Bill-2023to the National Assembly for discussion and consideration for enactment into the Finance Act 2023. For more information, please see our Cytonn weekly #18/2023,
- The Kenya National Bureau of Statistics released the Economic Review 2023, highlighting that the Kenyan economy recorded a 4.8% expansion in 2022, lower than the 7.6% growth recorded in 2021. For more information, please see our Cytonn weekly #18/2023,
- The National Treasury gazettedthe revenue and net expenditures for the first 10 months of FY’2022/2023 ending 28 April 2023, highlighting that the total revenue collected as at the end of April 2023 amounted to Kshs 1,639.8 bn, equivalent to 78.4% of the revised estimates of Kshs 2,192.0 bn and 89.8% of the prorated estimates of Kshs 1,826.7 bn. For more information, please see our Cytonn weekly #19/2023,
- Moody’s Credit Rating agency downgradedGovernment of Kenya’s long-term foreign currency and local-currency issuer ratings and senior unsecured debt ratings to B3 from B2 with a negative outlook. This is an indication of increased material default risk with very limited margin of safety amid tighter liquidity. For more information, please see our Cytonn weekly #19/2023,
- The Energy and Petroleum Regulatory Authority (EPRA)released their monthly statement on the maximum retail fuel prices in Kenya effective 15 May 2023 to 14 June 2023. Notably, fuel prices increased by 1.9%, 4.0% and 10.4% to Kshs 182.7, Kshs 168.4 and Kshs 161.1, up from Kshs 179.3, Kshs 162.0 and Kshs 145.9 per litre of Super Petrol, Diesel and Kerosene, respectively. For more information, please see our Cytonn weekly #20/2023, and,
- The International Monetary Fund (IMF) announcedthat it had reached a staff level agreement with Kenyan authorities to conclude the fifth reviews of Kenya’s economic program under the Extended Fund Facility (EFF) and Extended Credit Facility (ECF) arrangements. This will allow Kenya to access financing of USD 410.0 mn (Kshs 56.7 bn) once the formal review is completed by July 2023. For more information, please see our Cytonn weekly #21/2023.
Rates in the Fixed Income market have been on upward trend given the continued government’s demand for cash and the highly tightened liquidity in the money market. The government is 2.7% behind its prorated borrowing target of Kshs 395.9 bn having borrowed Kshs 385.3 bn of the revised domestic borrowing target of Kshs 425.1 bn for the FY’2022/2023. We believe that the projected budget deficit of 5.7% is relatively ambitious given the downside risks and deteriorating business environment occasioned by high inflationary pressures. Further, revenue collections are lagging behind, with total revenue as at April 2023 coming in at Kshs 1.6 tn in the FY’2022/2023, equivalent to 74.8% of its revised target of Kshs 2.2 tn and 89.8% of the prorated target of Kshs 1.8 tn. Therefore, we expect a continued upward readjustment of the yield curve in the short and medium term, with the government looking to bridge the fiscal deficit through the domestic market. Owing to this, our view is that investors should be biased towards short-term fixed-income securities to reduce duration risk.
Market Performance:
During the month of May, the equities market was on a downward trajectory, with NASI, NSE 20 and NSE 25 declining by 3.7%, 2.0% and 6.7% respectively. The equities market performance was driven by losses recorded by large cap stocks such as Equity Group, Diamond Trust Bank (DTB-K), BAT, Cooperative Bank, NCBA and ABSA Bank of 17.2%, 16.5%, 14.4%, 9.0%, 8.9% and 6.6%, respectively. The losses were however mitigated by gains recorded by large cap stocks such as Standard Chartered Bank of Kenya (SCBK) and Bamburi of 6.9% and 4.8%, respectively.
During the week, the equities market was on an upward trajectory, with NASI, NSE 20 and NSE 25 gaining by 7.3%, 4.6% and 6.3%, respectively, taking the YTD performance to losses of 17.5%, 7.1%, and 14.0% for NASI, NSE 20, and NSE 25, respectively. The equities market performance was mainly driven by gains recorded by large cap stocks such as Safaricom, Standard Chartered Bank of Kenya (SCBK), ABSA Bank and NCBA of 12.6%, 9.1%, 7.4% and 6.9%, respectively. The gains were however weighed down by losses recorded by other large cap stocks such as BAT and Bamburi of 5.6% and 3.2%, respectively.
Equities turnover increased by 41.1% in the month of May to USD 44.4 mn, from USD 31.4 mn recorded in April 2023. Foreign investors remained net sellers, with a net selling position of USD 9.6 mn, compared to April’s net selling position of USD 2.1 mn.
During the week, equities turnover declined by 31.0% to USD 7.0 mn, from USD 10.2 mn recorded the previous week taking the YTD turnover to USD 425.9 mn. Foreign investors remained net sellers, with a net selling position of USD 1.0 mn, from a net selling position of USD 1.7 mn recorded the previous week, taking the YTD net selling position to USD 53.4 mn.
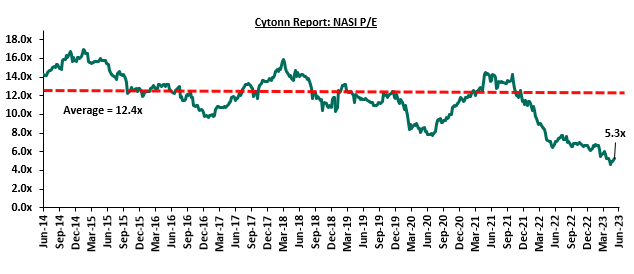
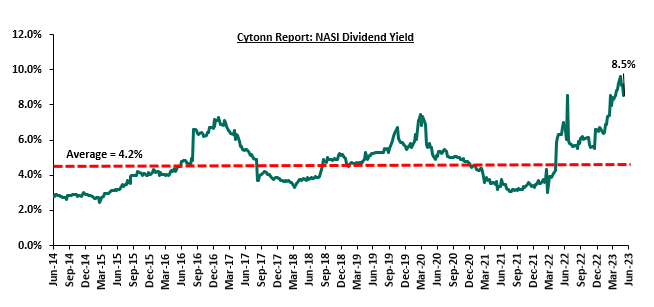
The market is currently trading at a price to earnings ratio (P/E) of 5.3x, 57.2% below the historical average of 12.4x, and a dividend yield of 8.5%, 4.3% points above the historical average of 4.2%. Key to note, NASI’s PEG ratio currently stands at 0.7x, an indication that the market is undervalued relative to its future growth. A PEG ratio greater than 1.0x indicates the market may be overvalued while a PEG ratio less than 1.0x indicates that the market is undervalued. The charts below indicate the historical P/E and dividend yields of the market;
Weekly Highlights:
Earnings Releases
- ABSA Bank
During the week, ABSA Bank released their Q1’2023 financial results. Below is a summary of the performance:
|
Balance Sheet Items (kshs bn) |
Q1’2022 |
Q1’2023 |
y/y change |
|
Government Securities |
136.7 |
134.3 |
(1.8%) |
|
Net Loans and Advances |
242.7 |
310.0 |
27.7% |
|
Total Assets |
438.5 |
514.6 |
17.4% |
|
Customer Deposits |
269.5 |
310.8 |
15.3% |
|
Deposits per Branch |
3.2 |
3.7 |
15.3% |
|
Total Liabilities |
379.3 |
446.6 |
17.7% |
|
Shareholder's Funds |
59.2 |
68.0 |
14.9% |
|
Balance sheet ratios |
Q1’2022 |
Q1’2023 |
% point change |
|
Loan to Deposit Ratio |
90.0% |
99.7% |
9.7% |
|
Return on average equity |
21.2% |
25.3% |
4.1% |
|
Return on average assets |
2.8% |
3.4% |
0.6% |
|
Income Statement Items (Kshs bn) |
Q1’2022 |
Q1’2023 |
y/y change |
|
Net Interest Income |
6.9 |
9.4 |
36.0% |
|
Net non-Interest Income |
3.0 |
4.5 |
49.3% |
|
Total Operating income |
9.9 |
13.9 |
40.0% |
|
Loan Loss provision |
(1.2) |
(2.4) |
103.3% |
|
Total Operating expenses |
(5.6) |
(7.4) |
32.8% |
|
Profit before tax |
4.3 |
6.4 |
49.4% |
|
Profit after tax |
3.0 |
4.5 |
50.7% |
|
Core EPS |
0.5 |
0.8 |
50.7% |
|
Income statement ratios |
Q1’2022 |
Q1’2023 |
% point change |
|
Yield from interest-earning assets |
9.1% |
10.6% |
1.5% |
|
Cost of funding |
2.6% |
3.1% |
0.5% |
|
Net Interest Spread |
0.7% |
0.9% |
0.2% |
|
Cost of risk |
11.9% |
17.3% |
5.4% |
|
Net Interest Margin |
7.1% |
8.3% |
1.2% |
|
Cost to Income |
56.6% |
53.7% |
(2.9%) |
|
Cost to income (Without LLPs) |
44.6% |
36.3% |
(8.3%) |
|
Cost to Assets |
1.0% |
1.0% |
(0.0%) |
|
Net Interest Income as % of operating income |
69.5% |
67.5% |
(2.0%) |
|
Non-Funded Income as a % of operating income |
30.5% |
32.5% |
2.0% |
|
Capital Adequacy Ratios |
Q1’2022 |
Q1’2023 |
% points change |
|
Core Capital/Total Liabilities |
18.4% |
18.6% |
0.2% |
|
Minimum Statutory ratio |
8.0% |
8.0% |
0.0% |
|
Excess |
10.4% |
10.6% |
0.2% |
|
Core Capital/Total Risk Weighted Assets |
14.5% |
14.1% |
(0.4%) |
|
Minimum Statutory ratio |
10.5% |
10.5% |
0.0% |
|
Excess |
4.0% |
3.6% |
(0.4%) |
|
Total Capital/Total Risk Weighted Assets |
17.0% |
18.1% |
1.1% |
|
Minimum Statutory ratio |
14.5% |
14.5% |
0.0% |
|
Excess |
2.5% |
3.6% |
1.1% |
|
Liquidity Ratio |
36.7% |
28.6% |
(8.1%) |
|
Minimum Statutory ratio |
20.0% |
20.0% |
0.0% |
|
Excess |
16.7% |
8.6% |
(8.1%) |
|
Adjusted Core Capital/Total Liabilities |
18.5% |
18.7% |
0.2% |
|
Adjusted Core Capital/Total RWA |
14.6% |
14.2% |
(0.4%) |
|
Adjusted Total Capital/Total RWA |
17.1% |
18.2% |
1.1% |
Key Take-Outs:
Strong Earnings Growth – The Core earnings per share increased by 50.7% to Kshs 0.8 in Q1’2023, from Kshs 0.5 in Q1’2022, driven by a 40.0% increase in total operating income to Kshs 13.9 bn, from Kshs 9.9 bn recorded in Q1’2022. The Bank’s increase in total operating income was driven by a 36.0% increase in Net Interest Income (NII) to Kshs 9.4 bn, from Kshs 6.9 bn in Q1’2022, coupled with a 49.3% gain in Non-Funded Income (NFI) to Kshs 4.5 bn, from Kshs 3.0 bn in Q1’2022,
Deterioration in Asset Quality - The bank’s asset quality deteriorated, with the NPL ratio increasing by 1.8% points to 9.4% in Q1’2023, from 7.6% in Q1’2022, owing to the faster 59.8% growth in Gross Non-Performing Loans, as compared to the 28.1% increase in Gross Loans,
Increased Provisioning – The Bank increased its Loans Loss Provision (LLPs) by 103.3% to Kshs 2.4 bn in Q1’2023, from Kshs 1.2 bn recorded in Q1’2022 aimed at mitigating increased credit risk on the back of the deteriorating business environment as a result of the high inflationary pressures. The high credit risk is further evidenced by the 59.8% in Non-Performing Loans to Kshs 31.1 bn in Q1’2023, from Kshs 19.5 bn recorded in Q1’2022,
Improved efficiency levels – The Banks’s cost to income ratio without LLP improved, declining by 2.9% to 53.7%, from 56.6% in Q1’2022, owing to 40.0% increase in total operating income, which outpaced the 32.8% growth in total operating expenses. Similarly, Without LLP the cost to income ratio improved significantly, declining by 8.3% points to 36.3%, from 44.6% in Q1’2022, an indication of improved efficiency, and,
Aggressive Lending – The Bank increased its lending in Q1’2023 with Loans and advances recording a 27.7% growth, highlighting the Bank’s aggressive lending despite the tough operating business environment. Consequently, the loan to deposit ratio increased by 9.7% points to 99.7% from 90.0% in Q1’2022.
For a comprehensive analysis, please see our ABSA Bank Q1’2023 Earnings Note
- Diamond Trust Bank Kenya (DTB-K)
During the week, Diamond Trust Bank Kenya (DTB-K) released their Q1’2023 financial results. Below is a summary of the performance:
|
Balance Sheet Items (Kshs bn) |
Q1’2022 |
Q1’2023 |
y/y change |
|
Government Securities |
127.7 |
131.6 |
3.1% |
|
Net Loans and Advances |
224.8 |
270.4 |
20.3% |
|
Total Assets |
471.3 |
553.3 |
17.4% |
|
Customer Deposits |
343.1 |
404.6 |
17.9% |
|
Deposits per Branch |
2.7 |
3.1 |
17.0% |
|
Total Liabilities |
394.7 |
470.8 |
19.3% |
|
Shareholders’ Funds |
69.1 |
72.9 |
5.6% |
|
Balance Sheet Ratios |
Q1’2022 |
Q1’2023 |
y/y change |
|
Loan to Deposit Ratio |
65.5% |
66.8% |
1.3% |
|
Return on average equity |
7.1% |
9.9% |
2.8% |
|
Return on average assets |
1.1% |
1.4% |
0.3% |
|
Income Statement (Kshs bn) |
Q1’2022 |
Q1’2023 |
y/y change |
|
Net Interest Income |
5.5 |
6.7 |
20.7% |
|
Non-Interest Income |
1.8 |
2.8 |
59.1% |
|
Total Operating income |
7.3 |
9.5 |
30.0% |
|
Loan Loss provision |
0.6 |
1.4 |
134.7% |
|
Total Operating expenses |
3.9 |
5.9 |
50.4% |
|
Profit before tax |
3.4 |
3.6 |
8.0% |
|
Profit after tax |
2.4 |
2.6 |
11.3% |
|
Core Earnings per share (Kshs) |
8.5 |
9.5 |
11.3% |
|
Income Statement Ratios |
Q1’2022 |
Q1’2023 |
Y/Y Change |
|
Yield from interest-earning assets |
9.0% |
9.7% |
0.7% |
|
Cost of funding |
1.0% |
1.3% |
0.3% |
|
Net Interest Spread |
8.0% |
8.3% |
0.3% |
|
Net Interest Income as % of Total Income |
75.8% |
70.4% |
(5.4%) |
|
Non-Funded Income as a % of Total Income |
24.2% |
29.6% |
5.4% |
|
Cost to Income |
53.3% |
61.7% |
8.4% |
|
Cost to Income Ratio without provisions |
45.3% |
47.3% |
2.0% |
|
Cost to Assets |
4.6% |
4.7% |
0.1% |
|
Net Interest Margin |
5.3% |
5.4% |
0.1% |
|
Capital Adequacy Ratios |
Q1’2022 |
Q1’2023 |
% points change |
|
Core Capital/Total deposit Liabilities |
21.7% |
21.1% |
(0.6%) |
|
Minimum Statutory ratio |
8.0% |
8.0% |
|
|
Excess |
13.7% |
13.1% |
(0.6%) |
|
Core Capital/Total Risk Weighted Assets |
20.5% |
19.3% |
(1.2%) |
|
Minimum Statutory ratio |
10.5% |
10.5% |
|
|
Excess |
10.0% |
8.8% |
(1.2%) |
|
Total Capital/Total Risk Weighted Assets |
21.8% |
20.2% |
(1.6%) |
|
Minimum Statutory ratio |
14.5% |
14.5% |
|
|
Excess |
7.3% |
5.7% |
(1.6%) |
|
Liquidity Ratio |
58.3% |
56.2% |
(2.1%) |
|
Minimum Statutory ratio |
20.0% |
20.0% |
|
|
Excess |
38.3% |
36.2% |
(2.1%) |
|
Adjusted Core Capital/Total Deposit Liabilities |
21.8% |
21.1% |
(0.7%) |
|
Adjusted Core Capital/Total Risk Weighted Assets |
20.6% |
19.3% |
(1.3%) |
|
Adjusted Total Capital/Total Risk Weighted Assets |
21.8% |
20.2% |
(1.6%) |
Key Take-Outs:
Earnings Growth - Core earnings per share increased by 11.3% to Kshs 9.5 in Q1’2023, from Kshs 8.5 in Q1’2022. The performance was driven by a 30.0% increase in total operating income to Kshs 9.5 bn in Q1’2023, from Kshs 7.3 bn in Q1’2022. However, the growth was weighed down by the 50.4% increase in the total operating expenses to Kshs 5.9 bn in Q1’2023, from Kshs 3.9 bn in Q1’2022,
Improved Asset Quality – The group’s asset quality improved, with the NPL ratio declining to 12.3% in Q1’2023, from 12.6% in Q1’2022, owing to the faster 20.6% growth in gross loans, which outpaced the 17.2% increase in gross non-performing loans to Kshs 35.1 bn, from Kshs 30.0 bn in Q1’2022. The improvement in asset quality is attributable to proactive credit management strategies leading to increased loan repayment,
Improved Lending – The Bank increased its lending in Q1’2023 with Loans and advances recording a 20.3% growth to Kshs 270.4 bn in Q1’2023, from Kshs 224.8 bn in Q1’2022, highlighting the Bank’s improved lending despite the tough operating business environment. Consequently, the loan to deposit ratio increased by 1.3% points to 66.8%, from 65.5% in Q1’2022, and,
Deterioration of efficiency levels – The Bank’s efficiency level deteriorated with cost to income ratio without LLP increasing by 8.4% to 61.7%, from 53.3% in Q1’2022. Similarly, Without LLP, the Cost to Income ratio increased to 47.3%, from 45.3% in Q1’2022.
For a comprehensive analysis, please see our Diamond Trust Bank Kenya (DTB-K) Q1’2023 Earnings Note
- I&M Group
During the week, I&M Group released their Q1’2023 financial results. Below is a summary of the performance:
|
Balance Sheet Items (Kshs bn) |
Q1’2022 |
Q1’2023 |
y/y change |
|
Government Securities |
83.9 |
72.7 |
(13.3%) |
|
Net Loans and Advances |
218.4 |
257.7 |
18.0% |
|
Total Assets |
430.8 |
472.6 |
9.7% |
|
Customer Deposits |
309.4 |
324.7 |
4.9% |
|
Deposits per Branch |
3.5 |
3.9 |
12.5% |
|
Total Liabilities |
355.6 |
388.2 |
9.2% |
|
Shareholders’ Funds |
70.5 |
79.0 |
12.0% |
|
Balance Sheet Ratios |
Q1’2022 |
Q1’2023 |
y/y change |
|
Loan to Deposit Ratio |
70.6% |
79.4% |
8.8% |
|
Return on average equity |
13.1% |
14.4% |
1.3% |
|
Return on average assets |
2.2% |
2.6% |
0.4% |
|
Income Statement (Kshs bn) |
Q1’2022 |
Q1’2023 |
y/y change |
|
Net Interest Income |
5.2 |
6.1 |
17.0% |
|
Net non-Interest Income |
2.2 |
3.5 |
58.8% |
|
Total Operating income |
7.4 |
9.6 |
29.4% |
|
Loan Loss provision |
(0.5) |
(1.6) |
241.5% |
|
Total Operating expenses |
(3.9) |
(6.0) |
56.7% |
|
Profit before tax |
3.67 |
3.75 |
2.1% |
|
Profit after tax |
2.71 |
2.66 |
(2.0%) |
|
Core EPS |
1.6 |
1.6 |
(2.0%) |
|
Income Statement Ratios |
Q1’2022 |
Q1’2023 |
Y/Y Change |
|
Yield from interest-earning assets |
10.1% |
10.3% |
0.2% |
|
Cost of funding |
4.0% |
4.2% |
0.2% |
|
Net Interest Margin |
6.4% |
6.3% |
(0.1%) |
|
Net Interest Income as % of operating income |
70.3% |
63.6% |
(6.7%) |
|
Non-Funded Income as a % of operating income |
29.7% |
36.4% |
6.7% |
|
Cost to Income Ratio |
52.0% |
63.0% |
11.0% |
|
CIR without LLP |
45.5% |
45.8% |
0.3% |
|
Cost to Assets |
0.8% |
0.9% |
0.1% |
|
Capital Adequacy Ratios |
Q1'2022 |
Q1'2023 |
% points change |
|
Core Capital/Total Liabilities |
20.0% |
22.0% |
2.0% |
|
Minimum Statutory ratio |
8.0% |
8.0% |
|
|
Excess |
12.0% |
14.0% |
2.0% |
|
Core Capital/Total Risk Weighted Assets |
15.8% |
15.6% |
(0.2%) |
|
Minimum Statutory ratio |
10.5% |
10.5% |
|
|
Excess |
5.3% |
5.1% |
(0.2%) |
|
Total Capital/Total Risk Weighted Assets |
20.6% |
19.9% |
(0.7%) |
|
Minimum Statutory ratio |
14.5% |
14.5% |
|
|
Excess |
6.1% |
5.4% |
(0.7%) |
|
Liquidity Ratio |
52.8% |
46.2% |
(6.6%) |
|
Minimum Statutory ratio |
20.0% |
20.0% |
|
|
Excess |
32.8% |
26.2% |
(6.6%) |
|
Adjusted Core Capital/Total Liabilities |
21.0% |
22.6% |
1.6% |
|
Adjusted Core Capital/Total RWA |
16.6% |
16.3% |
(0.3%) |
|
Adjusted Total Capital/Total RWA |
21.5% |
20.5% |
(1.0%) |
Key Take-Outs:
Decline in Earnings- Core earnings per share declined by 2.0% to Kshs 2.66 from Kshs 2.71 in Q1’2022, mainly weighed down by the 56.7% increase in total operating expenses to Kshs 6.0 bn in Q1’2023 from Kshs 3.9 bn in Q1’2022, which outpaced the 29.4% increase in the total operating income to Kshs 9.6 bn in Q1’2023, from Kshs 7.4 bn in Q1’2022,
Increased Provisioning – The group’s provisioning increased by 241.5% to Kshs 1.6 bn from Kshs 0.5 bn recorded in Q1’2022, aimed at mitigating increased credit risk on the back of the deteriorated business environment as a result of the high inflationary pressures. This is evidenced by the 24.0% increase in Gross Non-Performing loans to Kshs 29.3 bn, from Kshs 23.6 bn in Q1’2022, and,
Revenue diversification – The Group’s Non-Funded income increased by 58.8% to Kshs 3.5 bn in Q1’2023, from Kshs 2.2 bn in Q1’2022, which resulted to a shift in revenue mix to 64:36 in Q1’2023 from 70:30 in Q1’2022. The increase was mainly attributable to increase in non-funded income from digital channels due to increased usage of internet banking and mobile banking, coupled with a 135.4% increase in foreign exchange income to Kshs 1.4 bn in Q1’2023 from Kshs 0.6 bn in Q1’2022.
For a comprehensive analysis, please see our I&M Group Q1’2023 Earnings Note
- HF Group
During the week, HF Group released their Q1’2023 financial results. Below is a summary of the performance:
Below is a summary of HF Group Plc Q1’2023 performance:
|
Balance Sheet Items (Kshs bn) |
Q1'2022 |
Q1'2023 |
y/y change |
|
Net loans |
34.8 |
37.0 |
6.2% |
|
Government Securities |
7.2 |
9.5 |
31.4% |
|
Total Assets |
54.3 |
59.0 |
8.6% |
|
Customer Deposits |
38.4 |
41.2 |
7.4% |
|
Deposits Per Branch |
1.7 |
1.9 |
7.4% |
|
Total Liabilities |
46.4 |
50.2 |
8.1% |
|
Shareholder's Funds |
7.9 |
8.8 |
11.7% |
|
Balance Sheet Ratios |
Q1'2022 |
Q1'2023 |
y/y change |
|
Loan to deposit ratio |
90.8% |
89.7% |
(1.1%) |
|
Return on Average Equity |
(5.7%) |
3.8% |
9.5% |
|
Return on Average Assets |
(0.8%) |
0.6% |
1.4% |
|
Income Statement (Kshs bn) |
Q1'2022 |
Q1'2023 |
y/y change |
|
Net Interest Income |
0.5 |
0.6 |
21.0% |
|
Net non-Interest Income |
0.25 |
0.27 |
8.7% |
|
Total Operating income |
0.8 |
0.9 |
17.0% |
|
Loan Loss provision |
(0.1) |
(0.1) |
80.4% |
|
Total Operating expenses |
(0.7) |
(0.8) |
10.9% |
|
Profit before tax |
0.0 |
0.1 |
130.5% |
|
Profit after tax |
0.03 |
0.1 |
143.5% |
|
Core EPS |
0.1 |
0.2 |
143.5% |
|
Income Statement Ratios |
Q1'2022 |
Q1'2023 |
y/y change |
|
Yield from interest-earning assets |
9.2% |
9.8% |
0.6% |
|
Cost of funding |
4.7% |
4.8% |
0.1% |
|
Net Interest Spread |
4.5% |
5.0% |
0.5% |
|
Net Interest Margin |
4.4% |
5.0% |
0.6% |
|
Cost of Risk |
7.3% |
11.3% |
4.0% |
|
Net Interest Income as % of operating income |
67.3% |
69.6% |
2.3% |
|
Non-Funded Income as a % of operating income |
32.7% |
30.4% |
(2.3%) |
|
Cost to Income Ratio |
94.9% |
90.0% |
(4.9%) |
|
Cost to Income Ratio without LLP |
9.2% |
9.8% |
0.6% |
|
Cost to Assets |
4.7% |
4.8% |
0.1% |
|
Capital Adequacy Ratios |
Q1'2022 |
Q1'2023 |
% Change |
|
Core Capital/Total Liabilities |
8.0% |
6.7% |
(1.3%) |
|
Minimum Statutory ratio |
8.0% |
8.0% |
|
|
Excess |
0.0% |
(1.3%) |
(1.3%) |
|
Core Capital/Total Risk Weighted Assets |
8.2% |
7.2% |
(1.0%) |
|
Minimum Statutory ratio |
10.5% |
10.5% |
|
|
Excess |
(2.3%) |
(3.3%) |
(1.0%) |
|
Total Capital/Total Risk Weighted Assets |
12.1% |
11.0% |
(1.1%) |
|
Minimum Statutory ratio |
14.5% |
14.5% |
|
|
Excess |
(2.4%) |
(3.5%) |
(1.1%) |
|
Liquidity Ratio |
24.6% |
24.7% |
0.1% |
|
Minimum Statutory ratio |
20.0% |
20.0% |
|
|
Excess |
4.6% |
4.7% |
0.1% |
|
Adjusted core capital/ total deposit liabilities |
8.2% |
6.9% |
(1.3%) |
|
Adjusted core capital/ total risk weighted assets |
8.4% |
7.3% |
(1.1%) |
|
Adjusted total capital/ total risk weighted assets |
12.3% |
11.2% |
(1.1%) |
Key Take Outs
Earnings Growth- Core earnings per share rose by 143.5% to Kshs 0.2, from Kshs 0.1 registered in Q1’2022. This was mainly attributable to the 17.0% growth in total operating income to Kshs 0.9 bn, from Kshs 0.8 bn in Q1’2022. However, the growth was weighed down by 10.9% increase in total operating expenses to Kshs 0.8 bn from Kshs 0.7 bn in Q1’2022,
Improved Asset Quality - The group’s asset quality improved, with the gross NPL ratio improving to 19.9% in Q1’2023, from 20.5% in Q1’2022, attributable to the 7.0% increase in gross loans to Kshs 44.1 bn, from Kshs 41.2 bn in Q1’2022 which outpaced the with 4.1% growth in Gross Non-Performing loans during the year to Kshs 8.8, from Kshs 8.4 bn in Q1’2022,
Improved Efficiency – Cost to Income Ratio (CIR) improved by 4.9% points to 90.0%, from 94.9% in Q1’2022, attributable to the 17.0% increase in total operating income to Kshs 0.9 bn in Q1’2023, from Kshs 0.8 bn in Q1’2022, which outpaced the 10.9% increase in total operating expenses to Kshs 0.8 bn, from Kshs 0.7 bn recorded in Q1’2022, and,
Cautious Lending – HF Group’s Q1’2023 result was characterized by a faster 31.4% growth in government securities to Kshs 9.5 bn from Kshs 7.2 bn as compared to the 6.2% rise in net loans to Kshs 37.0 bn from Kshs 34.8 bn in Q1’2022, depicting the group’s adoption of conservative lending strategy to take advantage of the higher interest rates in Fixed Income.
For a comprehensive analysis, please see our HF Group Q1’2023 Earnings Note
Summary performance:
Asset Quality:
The table below highlights the Asset Quality of the listed banks:
|
Cytonn Report: Listed Banks Asset Quality |
||||||
|
Bank |
Q1'2023 NPL Ratio* |
Q1'2022 NPL Ratio** |
% point change in NPL Ratio |
Q1'2023 NPL Coverage* |
Q1'2022 NPL Coverage** |
% point change in NPL Coverage |
|
ABSA Bank Kenya |
9.4% |
7.6% |
1.8% |
63.9% |
76.2% |
(12.3%) |
|
Equity Group |
10.0% |
9.0% |
1.0% |
62.0% |
66.0% |
(4.0%) |
|
I&M Holdings |
10.6% |
10.0% |
0.6% |
65.8% |
72.1% |
(6.3%) |
|
Stanbic Bank |
11.7% |
11.1% |
0.6% |
66.7% |
59.1% |
7.6% |
|
Diamond Trust Bank |
12.3% |
12.6% |
(0.3%) |
45.9% |
42.2% |
3.7% |
|
NCBA Group |
12.8% |
16.3% |
(3.5%) |
56.8% |
72.6% |
(15.8%) |
|
Co-operative Bank of Kenya |
14.1% |
13.9% |
0.2% |
62.2% |
65.3% |
(3.1%) |
|
Standard Chartered Bank Kenya |
14.4% |
15.4% |
(1.0%) |
86.8% |
81.8% |
5.0% |
|
KCB |
17.1% |
16.9% |
0.2% |
57.3% |
52.7% |
4.6% |
|
HF Group |
19.9% |
20.5% |
(0.6%) |
81.4% |
76.1% |
5.3% |
|
Mkt Weighted Average |
14.6% |
12.5% |
2.1% |
62.1% |
65.1% |
(3.0%) |
|
*Market cap weighted as at 02/06/2023 |
||||||
|
**Market cap weighted as at 17/06/2022 |
||||||
Key take-outs from the table include;
- Asset quality for the listed banks deteriorated in Q1’2023 with market weighted average NPL ratio increasing by 2.1% points to 14.6%, from 12.5% in Q1’2022. The deterioration was largely driven by deterioration in ABSA Bank’s and Equity Group’s asset quality with their NPL ratios increasing by 1.8%, 1.0% points to 9.4% and 10.0%, from 7.6% and 9.0%, respectively recorded in Q1’2022,
- ABSA Bank had the highest NPL Ratio jump by 1.8% points to 9.4%, from 7.6% in Q1’2022. The deterioration in Asset Quality was mainly attributable to a significant 59.8% increase in Gross Non-Performing Loans (NPLs) to Kshs 31.1 bn in Q1’2023, from Kshs 19.5 bn recorded in Q1’2022, while Gross loans increased by 28.1% to Kshs 329.9 bn, from Kshs 257.5 bn in Q1’2022,
- NCBA Group recorded the highest improvement in its asset quality with the NPL ratio declining by 3.5% points to 12.8% in Q1’2023, from 16.3% in Q1’2022. This was largely due to 11.9% decrease in Gross Non-Performing loans to Kshs 39.7 bn, from Kshs 45.1 bn in Q1’2022, coupled with 12.0% increase in gross loans to Kshs 309.7 bn, from Kshs 276.7 bn recorded in Q1’2022,
- Market weighted average NPL Coverage for the listed banks decreased by 3.0% points to 62.1% in Q1’2023, from 65.1% recorded in Q1’2022. The decrease was mainly attributable to decrease in NCBA Group’s, ABSA Bank’s, Equity Group’s and I&M Group’s NPL coverage by 15.8%, 12.3% and 6.3% points to 56.8%, 63.9% and 65.8%, from 72.6%, 76.2% and 72.1%, respectively in Q1’2022.
The table below highlights the performance listed banks, showing the performance using several metrics:
|
Cytonn Report: Listed Banks Performance in Q1’2023 |
|||||||||||||
|
Bank |
Core EPS Growth |
Interest Income Growth |
Interest Expense Growth |
Net Interest Income Growth |
Net Interest Margin |
Non-Funded Income Growth |
NFI to Total Operating Income |
Growth in Total Fees & Commissions |
Deposit Growth |
Growth in Government Securities |
Loan to Deposit Ratio |
Loan Growth |
Return on Average Equity |
|
HF Group |
143.3% |
15.1% |
9.1% |
21.0% |
5.0% |
8.7% |
30.4% |
(29.7%) |
7.4% |
31.4% |
89.7% |
6.2% |
3.8% |
|
Stanbic |
84.3% |
49.1% |
59.7% |
44.7% |
7.2% |
89.3% |
51.4% |
17.7% |
23.8% |
9.7% |
79.1% |
11.5% |
20.7% |
|
ABSA |
50.7% |
38.3% |
46.3% |
36.0% |
8.3% |
27.7% |
32.5% |
29.7% |
15.3% |
(1.8%) |
99.7% |
27.7% |
25.5% |
|
NCBA |
48.5% |
21.0% |
25.2% |
18.0% |
6.0% |
18.5% |
46.2% |
9.1% |
7.3% |
6.4% |
57.5% |
17.7% |
18.4% |
|
SCB-K |
47.2% |
34.1% |
(5.4%) |
40.1% |
7.3% |
55.5% |
35.9% |
13.3% |
14.2% |
(6.2%) |
45.3% |
7.0% |
23.0% |
|
DTB-K |
11.3% |
32.1% |
49.2% |
20.7% |
5.4% |
59.1% |
29.6% |
26.5% |
17.9% |
3.1% |
66.8% |
20.3% |
9.1% |
|
Equity |
7.9% |
21.6% |
46.9% |
12.1% |
7.4% |
54.3% |
45.9% |
39.2% |
23.3% |
(7.7%) |
68.1% |
23.1% |
26.8% |
|
Co-op |
4.7% |
11.2% |
32.2% |
3.9% |
8.5% |
10.8% |
39.7% |
9.7% |
2.2% |
(2.3%) |
85.8% |
11.0% |
20.7% |
|
KCB |
(1.0%) |
26.2% |
67.7% |
11.8% |
7.3% |
59.2% |
40.1% |
65.5% |
41.5% |
4.8% |
77.6% |
31.9% |
20.9% |
|
I&M Group |
(2.0%) |
18.3% |
20.2% |
17.0% |
6.3% |
58.8% |
36.4% |
16.6% |
4.9% |
(13.3%) |
79.4% |
18.0% |
14.4% |
|
Q1'23 Mkt Weighted Average* |
24.6% |
26.5% |
40.8% |
20.2% |
7.3% |
46.8% |
41.3% |
30.7% |
19.8% |
(1.3%) |
73.0% |
20.5% |
22.2% |
|
Q1'22 Mkt Weighted Average** |
37.9% |
17.8% |
17.1% |
17.7% |
7.3% |
21.4% |
35.9% |
21.7% |
9.5% |
17.6% |
73.9% |
17.2% |
21.9% |
|
*Market cap weighted as at 02/06/2023 |
|||||||||||||
|
**Market cap weighted as at 17/06/2022 |
|||||||||||||
Key take-outs from the table include;
- The listed banks recorded a 24.6% growth in Core Earnings per Share (EPS) in Q1’2023, compared to the weighted average growth of 37.9% in Q1’2022, an indication of sustained performance despite the tough operating environment experienced in Q1’2023,
- Non-Funded Income grew by 46.8% compared to market weighted average growth of 21.4% in Q1’2022, mainly due to growth in forex related fees occasioned by the wide spreads in the dollar exchange rate during the quarter, and,
- The Banks recorded a weighted average deposit growth of 19.8%, higher than the market weighted average deposit growth of 9.5% in Q1’2022, highlighting increased investment risk in the business environment.
Monthly highlights:
- Safaricom Plc released its FY’2023 financial performance for the year ended 31 March 2023, highlighting that profit after tax declined by 22.2% to Kshs 52.5 bn in FY’2023, from Kshs 67.5 bn in FY’2022.The performance was mainly attributable to a 34.2% increase in operating expenses to Kshs 74.1 bn in FY’2023, up from Kshs 55.2 bn in FY’2022. The increase in operating expenses was mainly driven by injection of Kshs 55.8 bn capital investment expenditure into Safaricom’s subsidiary in Ethiopia during the fourth quarter of FY’2023. For more information, please see our Cytonn Weekly #19/2023,
- The Central Bank of Kenya (CBK), recently released the Commercial Banking Sector Credit Survey Report for the quarter ended March 2023, highlighting that the banking sector’s loan book recorded a 13.9% y/y growth, with gross loans increasing to Kshs 3.9 tn in Q1’2023, from Kshs 3.1 tn in Q1’2022. For more information, please see our Cytonn Weekly #19/2023, and,
- The Central Bank of Kenya (CBK) announced the acquisition of 20.0% stake of Credit Bank Plc by Shorecap III, LP a Private Equity fund registered under the laws of Mauritius, with Equator Capital Partners LLC as the managers of the fund. For more information, please see our Cytonn Weekly #21/2023.
Universe of coverage:
|
Cytonn Report: Universe of Coverage as of 28 April 2023 |
|||||||||||
|
Company |
Price as at 26/05/2023 |
Price as at 2/06/2023 |
w/w change |
m/m change |
YTD Change |
Year Open 2023 |
Target Price* |
Dividend Yield |
Upside/ Downside** |
P/TBv Multiple |
Recommendation |
|
Jubilee Holdings |
178.0 |
180.0 |
1.1% |
1.9% |
(9.4%) |
198.8 |
305.9 |
6.7% |
78.6% |
0.3x |
Buy |
|
Britam |
4.2 |
4.6 |
10.3% |
6.8% |
(11.7%) |
5.2 |
7.1 |
0.0% |
71.2% |
0.7x |
Buy |
|
I&M Group*** |
15.9 |
16.9 |
6.3% |
(2.3%) |
(1.2%) |
17.1 |
24.5 |
14.2% |
68.7% |
0.3x |
Buy |
|
Liberty Holdings |
4.1 |
4.0 |
(1.7%) |
8.0% |
(20.6%) |
5.0 |
6.8 |
0.0% |
65.8% |
0.3x |
Buy |
|
Equity Group*** |
36.9 |
38.2 |
3.4% |
(17.2%) |
(15.3%) |
45.1 |
56.3 |
10.8% |
63.5% |
0.7x |
Buy |
|
Diamond Trust Bank*** |
45.0 |
45.9 |
2.0% |
(16.5%) |
(7.9%) |
49.9 |
64.6 |
11.1% |
54.7% |
0.2x |
Buy |
|
Kenya Reinsurance |
1.8 |
1.9 |
10.2% |
1.1% |
3.7% |
1.9 |
2.5 |
11.4% |
54.0% |
0.1x |
Buy |
|
NCBA*** |
34.6 |
37.0 |
6.9% |
(8.9%) |
(5.0%) |
39.0 |
48.7 |
12.3% |
53.2% |
0.7x |
Buy |
|
KCB Group*** |
31.1 |
31.9 |
2.7% |
(3.2%) |
(16.8%) |
38.4 |
45.5 |
6.4% |
53.0% |
0.5x |
Buy |
|
Sanlam |
7.8 |
7.1 |
(8.5%) |
(2.7%) |
(25.5%) |
9.6 |
11.9 |
0.0% |
52.7% |
0.8x |
Buy |
|
ABSA Bank*** |
10.8 |
11.6 |
7.4% |
(6.6%) |
(4.9%) |
12.2 |
15.1 |
12.5% |
52.7% |
0.8x |
Buy |
|
Co-op Bank*** |
11.4 |
12.1 |
6.1% |
(9.0%) |
0.0% |
12.1 |
15.9 |
13.2% |
52.6% |
0.5x |
Buy |
|
Standard Chartered*** |
145.8 |
159.0 |
9.1% |
6.9% |
9.7% |
145.0 |
195.4 |
15.1% |
49.1% |
0.9x |
Buy |
|
Stanbic Holdings |
98.3 |
104.8 |
6.6% |
(11.2%) |
2.7% |
102.0 |
131.8 |
12.8% |
46.9% |
0.7x |
Buy |
|
CIC Group |
1.9 |
1.9 |
(0.5%) |
8.1% |
(2.1%) |
1.9 |
2.3 |
6.9% |
30.3% |
0.7x |
Buy |
|
HF Group |
4.3 |
4.3 |
0.5% |
9.0% |
36.8% |
3.2 |
4.5 |
0.0% |
3.7% |
0.2x |
Lighten |
|
*Target Price as per Cytonn Analyst estimates **Upside/ (Downside) is adjusted for Dividend Yield ***For Disclosure, these are stocks in which Cytonn and/or its affiliates are invested in |
|||||||||||
We are “Neutral” on the Equities markets in the short term due to the current adverse operating environment and huge foreign investor outflows, and, “Bullish” in the long term due to current cheap valuations and expected global and local economic recovery.
With the market currently trading at a discount to its future growth (PEG Ratio at 0.7x), we believe that investors should reposition towards value stocks with strong earnings growth and that are trading at discounts to their intrinsic value. We expect the current high foreign investors sell-offs to continue weighing down the equities outlook in the short term.
- Industry Reports
During the month, the following industry reports were released and the key take-outs were as follows:
|
Cytonn Report: Notable Industry Reports During the Month of May 2023 |
|||
|
# |
Theme |
Report |
Key Take-outs |
|
1 |
Real Estate Mortgage |
Bank Supervision Annual Report 2022 by the Central Bank of Kenya (CBK) |
· The number of mortgage accounts increased by 4.0% to 27,786 in 2022, from 26,723 in 2021, which also represented a 10-year Compounded Annual Growth Rate (CAGR) of 4.1%, from 18,587 recorded in 2012, · The average mortgage loan size decreased by 2.2% to Kshs 9.0 mn in 2022, from 9.2 mn in 2021, attributable to lower values of mortgage loans advanced in 2022 by financial institutions, · The value of mortgage loans outstanding increased by Kshs 16.7 bn, representing a 6.8% increase to Kshs 261.8 bn in 2022, from Kshs 245.1 bn in 2021, · The average interest rate charged on mortgages increased by 1.0% points to 12.3% in 2022, from 11.3% in 2021. The interest rates majorly ranged from 8.2% to 17.0% in 2022 compared to a range of from 7.1% to 15.0% recorded in 2021, · The outstanding value of Non-Performing Mortgage Loans (NPMLs) increased by 33.6% to Kshs 37.8 bn in 2022, from Kshs 28.3 bn in 2021, and, · The Loan to Value Ratio, which is the maximum loan as a percentage of the property value, stabilized at 90.0% in 2022 since 2014, leaving mortgage customers to cover for their own incidental costs such as legal and registration costs. For more information, please see our Cytonn Weekly #20/2023. |
|
2 |
General Real Estate |
Economic Survey 2023 Report reports by the Kenya National Bureau of Statistics (KNBS) |
· Declined Growth in the Real Estate Sector – According to the report, the Real Estate Sector grew by 4.5% in FY’2022. This was however 2.2% points lower than the 6.7% growth recorded in FY’2021, · Slower Growth in the Construction Sector - The construction sector grew by 4.1% in FY’2022, 2.6% point lower than the 6.7% growth recorded in FY’2021, and, · Sustained Recovery in Accommodation and Food Service Sector - The Accommodation and Restaurant services grew by 26.2% in FY’2022, from the 52.6% growth recorded in FY’2021 demonstrating sustained recovery of the sector toward pre-COVID levels. For more information, see Cytonn Weekly #18/2023. |
|
3 |
Residential and Land Sectors |
House Price Index Q1’2023 , and, Land Price Index Q1’2023 Reports by Hass Consult |
· The average q/q selling prices for residential houses registered a 0.02% increase in Q1’2023, compared to a 2.2% decline recorded in Q4’2022, while on a y/y basis the average selling prices for residential houses appreciated by 2.0%, compared to a 6.8% increase that was recorded in Q1’2022, and, · Average q/q and y/y selling prices for land in the Nairobi suburbs slightly increased by 0.3% and 1.4% respectively, compared to 0.1% and 1.1% recorded in Q1’2022, and, · Consequently, q/q and y/y land prices in satellite towns of Nairobi increased by 1.3% and 8.1% respectively, compared to a 2.2% and 7.4%, respectively in Q1’2022. For more information please see Cytonn Weekly #18/2023 |
We expect Kenya’s Real Estate sector to continue registering growth in terms of activity, driven by; i) positive performance in land and residential sectors on the back of increased focus by the government on affordable housing, ii) sustained recovery in the accommodation and food sectors post COVID-19, iii) positive demographics above the global averages thus driving the demand for Real Estate upwards, and iv) increased activities in the mortgage industry. However, we expect that the optimal performance of the sector will be hindered by factors such as high construction costs, worsened by inflationary pressures resulting from both local and global economic shocks. Additionally, the continued depreciation of the Kenyan shilling against major international trading currencies, could potentially increase the import bill of building materials and raw materials for local production of crucial construction materials such as cement, paint and steel among others, further slowing down the growth of the construction sector.
- Residential Sector
Notable highlights during the month include;
- President Ruto presided over ground breaking of the Lapfund Bellevue Park Residences housing project consisting of 2,356 residential units worth Kshs 16.0 bn, located in South C, Nairobi. The project targeting middle-income earners will comprise of studio, 1, 2 and 3-bedroom residential units, a commercial area with offices, and amenities including a strip retail center and recreational facilities. The development of the project will be undertaken by the Local Authorities Provident Fund (LAPFund), and, will be delivered under a contractor-financed model basis, by CRJE (East Africa) Limited, a subsidiary of the Chinese CREC Group. For more information, please see our Cytonn Weekly #19/2023.
We anticipate that the sector’s performance will be driven by; i) the initiation and completion of various housing projects across the country under the affordable housing programme, and, ii) continuous launch of projects by developers in the private sector. This we expect will aid in addressing the existing housing deficit, currently standing at 2.0 mn units, as well as increase urban home-ownership rates in the country which have remained relatively low at 22.0% compared to other African countries such as South Africa at 69.7% and Ghana with 52.0% respectively. However, we expect the rising constructions costs to hinder performance of the sector by increasing development costs for developers.
- Commercial Office Sector
Notable highlights in the sector include;
- Actis Limited, a global private equity firm, announced that it had shut down two offices located in Nairobi, Kenya and Cape Town, South Africa. However, Actis has maintained that the closure of these branches does not imply an exit from the respective markets. For more information, please see our Cytonn Weekly #21/2023, and,
- The United Nations (UN) announced plans to relocate the United Nations Office for Project Services (UNOPS) Africa regional office to Nairobi, Kenya. Previously, the UNOPS Africa regional headquarters had its base in Denmark, while maintaining country offices in Liberia, Tunisia, Sudan, South Sudan, Kenya, the Democratic Republic of Congo (DRC), Nigeria, Ethiopia, Cote d'Ivoire, and Tunisia. For more information please see Cytonn Weekly #18/2023.
We expect to witness continued improvement in performance in the commercial office sector supported by; i) Kenya’s recognition as a regional hub for businesses and diplomacy in the Eastern and Central Africa regions which has attracted more global organizations and agencies to the Kenyan commercial market, ii) gaining traction of co-working spaces and niche centric office spaces that cater to a diverse clientele, and, iii) resumption of operations by most local firms and businesses resulting from the post-COVID-19 and peaceful post-electioneering periods thereby boosting occupancy rates. However, we expect the sector's overall performance to be subdued by the existing oversupply of approximately 5.8 mn SQFT in the Nairobi Metropolitan Area (NMA) as at 2022.
- Retail Sector
During the week, French retailer Carrefour Supermarket, opened a new outlet at the Business Bay Square (BBS) mall located in Eastleigh, Nairobi, bringing the retailer’s number of operating outlets countrywide to 20. The recently launched mall, with phase 1 currently at about 90.0% complete, comprises of retail facilities, banks and micro-finance institutions, food courts and restaurants, medical facilities, a mosque, commercial offices, entertainment and recreation facilities, and a kid’s playground. Phase 2 of the project, comprising of a hotel and residential serviced apartments will begin once the first phase is wrapped up, totaling to 130,000 SQM with both phases fully complete. The move is part of the retailer’s strategic plan to expand its footprint in the Kenyan market. Moreover, the retailer’s decision to open up a new branch at the mall was influenced by the desire to capitalize on high footfall in the mall, and serve customers living adjacent estates. In support of this, the mall will host key retail brands including Simbisa brands, Artcaffe, Java House, L’Oreal, LC Waikiki, Optica, Goodlife among others. Notably, this comes at a time when formal retail penetration in Kenya is still low, standing at 30.0% as at 2018, coupled with existing gaps left by other retailers such as Nakumatt, Uchumi, Shoprite and Choppies Supermarkets which exited the market.
The table below shows the number of stores operated by key local and international retail supermarket chains in Kenya;
|
Cytonn Report: Main Local and International Retail Supermarket Chains |
|||||||||||
|
Name of retailer |
Category |
Branches as at FY’2018 |
Branches as at FY’2019 |
Branches as at FY’2020 |
Branches as at FY’2021 |
Branches as at FY’2022 |
Branches opened in 2023 |
Closed branches |
Current branches |
Branches expected to be opened |
Projected branches FY’2023 |
|
Naivas |
Hybrid* |
46 |
61 |
69 |
79 |
91 |
2 |
0 |
93 |
0 |
93 |
|
Quick Mart |
Hybrid** |
10 |
29 |
37 |
48 |
55 |
3 |
0 |
58 |
0 |
58 |
|
Chandarana |
Local |
14 |
19 |
20 |
23 |
26 |
0 |
0 |
26 |
0 |
26 |
|
Carrefour |
International |
6 |
7 |
9 |
16 |
19 |
1 |
0 |
20 |
0 |
20 |
|
Cleanshelf |
Local |
9 |
10 |
11 |
12 |
12 |
1 |
0 |
13 |
0 |
13 |
|
Tuskys |
Local |
53 |
64 |
64 |
6 |
4 |
0 |
59 |
5 |
0 |
5 |
|
Game Stores |
International |
2 |
2 |
3 |
3 |
0 |
0 |
3 |
0 |
0 |
0 |
|
Uchumi |
Local |
37 |
37 |
37 |
2 |
2 |
0 |
35 |
2 |
0 |
2 |
|
Choppies |
International |
13 |
15 |
15 |
0 |
0 |
0 |
15 |
0 |
0 |
0 |
|
Shoprite |
International |
2 |
4 |
4 |
0 |
0 |
0 |
4 |
0 |
0 |
0 |
|
Nakumatt |
Local |
65 |
65 |
65 |
0 |
0 |
0 |
65 |
0 |
0 |
0 |
|
Total |
|
257 |
313 |
334 |
189 |
209 |
7 |
181 |
217 |
0 |
217 |
|
*40% owned by IBL Group (Mauritius), Proparco (France), and DEG (Germany), while 60% owned by Gakiwawa Family (Kenya) |
|||||||||||
|
**More than 50% owned by Adenia Partners (Mauritius), while Less than 50% owned by Kinuthia Family (Kenya) |
|||||||||||
Source: Cytonn Research
Additionally, during the month;
- Chain store Naivas Supermarket opened a new outlet located at Shell petrol station along Haile Selassie Avenue, Nairobi, bringing the retailer’s number of operating outlets countrywide to 93. For more information, please see our Cytonn Weekly #19/2023.
We continue to expect increased activities in the Kenyan retail industry attributed to; i) sustained expansion efforts by both domestic and foreign retailers who are aggressively competing for a bigger share of the market and increased capital investments by foreign entities in the retail market, ii) the growing demand for goods, services, and retail space driven by favorable demographics both within and beyond the Nairobi Metropolitan Area (NMA), and, iii) increased infrastructural development enhancing accessibility in regions offering new opportunities for retail investment. Nevertheless, the rampant proliferation of e-commerce which is quickly changing how consumers shop and purchase goods, and the oversupply of retail spaces, currently estimated at 3.0 mn SQFT in the Nairobi Metropolitan Area (NMA) and 1.7 mn SQFT in the larger Kenyan retail sector (excluding NMA), remain significant obstacles that continue to impede the sector's growth and overall performance.
- Regulated Real Estate Funds
- Real Estate Investment Trusts (REITs)
In the Nairobi Securities Platform, ILAM Fahari I-REIT closed the week trading at an average price of Kshs 6.0 per share. The performance represented a 4.9% increase from Kshs 5.8 per share recorded the previous week, taking it to an 10.9% Year-to-Date (YTD) decline from Kshs 6.8 per share recorded on 3 January 2023. In addition, the performance represented a 69.8% Inception-to-Date (ITD) loss from the Kshs 20.0 price. The dividend yield currently stands at 10.8%. The graph below shows Fahari I-REIT’s performance from November 2015 to 2 June 2023;
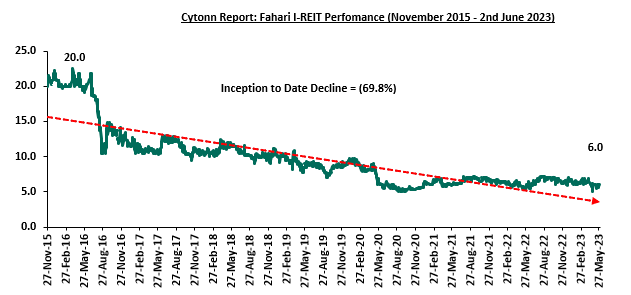
In the Unquoted Securities Platform Acorn D-REIT and I-REIT traded at Kshs 23.9 and Kshs 21.6 per unit, respectively, as at 26 May 2023. The performance represented a 19.4% and 7.9% gain for the D-REIT and IREIT, respectively, from the Kshs 20.0 inception price. The volumes traded for the D-REIT and I-REIT came in at 12.3 mn and 30.1 mn shares, respectively, with a turnover of Kshs 257.5 mn and Kshs 620.7 mn, respectively, since inception in February 2021.
REITs provide numerous advantages, including; access to more capital pools, consistent and prolonged profits, tax exemptions, diversified portfolios, transparency, liquidity and flexibility as an asset class. Despite these benefits, the performance of the Kenyan REITs market remains limited by several factors such as; i) insufficient investor understanding of the investment instrument, ii) time-consuming approval procedures for REIT creation, iii) high minimum capital requirements of Kshs 100.0 mn for trustees, and, iv) high minimum investment amounts set at Kshs 5.0 mn discouraging investments.
- Cytonn High Yield Fund (CHYF)
Cytonn High Yield Fund (CHYF) closed the week with an annualized yield of 13.6%, remaining relatively unchanged from the previous week. The performance also represented 0.3% points Year-to-Date (YTD) decline from 13.9% yield recorded on 1 January 2023, and 2.1% points Inception-to-Date (ITD) loss from the 15.7% yield. The graph below shows Cytonn High Yield Fund’s performance from October 2019 to 2 June 2023;
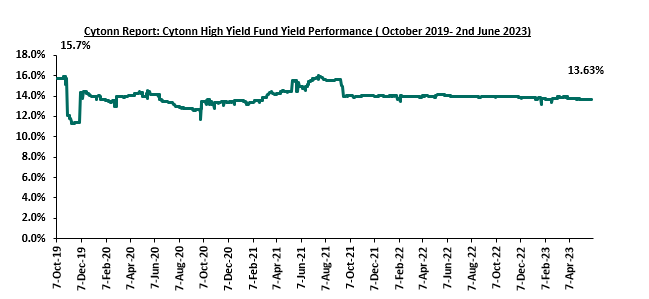
Notably, the CHYF has outperformed other regulated Real Estate funds with an annualized yield of 13.6%, as compared to Fahari I-REIT and Acorn I-REIT with yields of 10.8%, and 6.8% respectively. As such, the higher yields offered by CHYF makes the fund one of the best alternative investment resource in the Real Estate sector. The graph below shows the yield performance of the Regulated Real Estate Funds:
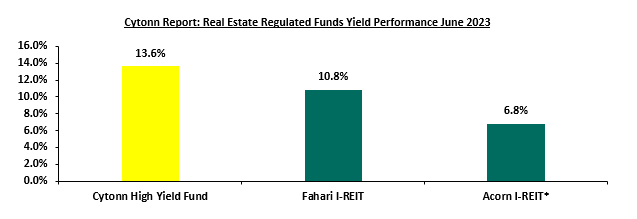
*FY’2022
Source: Cytonn Research
We expect the performance of Kenya’s Real Estate sector to remain on an upward trajectory, supported by factors such as; i) ongoing efforts by both the government and private sector to prioritize affordable housing, ii) infrastructural advancements supporting investments, iii) aggressive expansion strategies pursued by both local and international retailers, and, iv) relatively positive demographics in the country increasing demand for housing. However, the shift by companies to scale down physical operations in favour of hybrid and remote work policies, existing oversupply of physical space in select sectors, rising costs of construction on the back of rising inflation, and low investor appetite for REITs are expected to continue hindering optimal the performance of the sector.
Disclaimer: The views expressed in this publication are those of the writers where particulars are not warranted. This publication, which is in compliance with Section 2 of the Capital Markets Authority Act Cap 485A, is meant for general information only and is not a warranty, representation, advice or solicitation of any nature. Readers are advised in all circumstances to seek the advice of a registered investment advisor.

- Talk to us
- Kenya
- P.O Box 20695 - 00200, Nairobi, Kenya
- Cell +254709101200
- Tel +254709101200
- WhatsApp +254741676635
- United States
- +254709101200
- DOWNLOAD OUR APP
-


- Kenya
- 8th Floor, Pinetree Plaza, Kaburu Drive, Ngong Road, Nairobi, Kenya
- USA
- Suite 1150, 1775 Eye Street NW, USA, Washington DC 20006, USA
- Investments
- High Yield
- Private Equity
- Real Estate
- Real Estate
- RiverRun Estates
- Cytonn Towers
- The Ridge
- Taraji Heights
- The Alma