Cytonn Weekly #06/2024
By Research Team, Feb 11, 2024
Executive Summary
Fixed Income
During the week, T-bills were oversubscribed for the sixth consecutive week, with the overall oversubscription rate coming in at 213.0%, much higher than the oversubscription rate of 107.5% recorded the previous week. Investors’ preference for the shorter 91-day paper persisted, with the paper receiving bids worth Kshs 34.7 bn against the offered Kshs 4.0 bn, translating to an oversubscription rate of 867.6%, higher than the oversubscription rate of 515.7% recorded the previous week. The subscription rates for the 182-day and the 364-day papers increased significantly to 94.5% and 69.7% respectively from 16.6% and 35.1% recorded the previous week. The government accepted a total of Kshs 48.8 bn worth of bids out of Kshs 51.1 bn of bids received, translating to an acceptance rate of 95.4%. The yields on the government papers continued to rise with the yields on the 364-day, 182-day, and, 91-day papers increasing by 17.7 bps, 12.7 bps, and 12.9 bps to 16.9%, 16.6%, and 16.5%, respectively;
During the week, the Monetary Policy Committee met on February 6, 2024, to review the outcome of its previous policy decisions against a backdrop of continued global uncertainties, moderating global oil prices, an improved global growth outlook as well as heightened geopolitical tensions. The MPC decided to raise the CBR rate by 0.5% points to 13.0% from 12.5% on account of inflation remaining sticky in the economy as well as continued pressures on the exchange rate, albeit reduced;
During the week, Kenya announced it was going through with the earlier announced plan of buying back the 10-year tenor USD 2.0 bn Eurobond issued in 2014. In the announcement, Kenya stated that the buyback plan would be financed by the issuance of a new Eurobond. This follows successful issues by Ivory Coast and Benin which raised USD 2.6 bn and USD 750.0 mn respectively, marking the return of the Sub-Saharan region to the international Eurobonds market after nearly two years of absence;
During the week, Benin became the second country in the Sub-Saharan Africa (SSA) region to tap into the international capital markets in 2024, issuing their debut dollar bond with a tenor of 14 years and a coupon rate of 8.375%. Notably, the bond was oversubscribed with the overall subscription rate coming in at 666.7% having received bids worth USD 5.0 bn against the offered USD 750.0 mn;
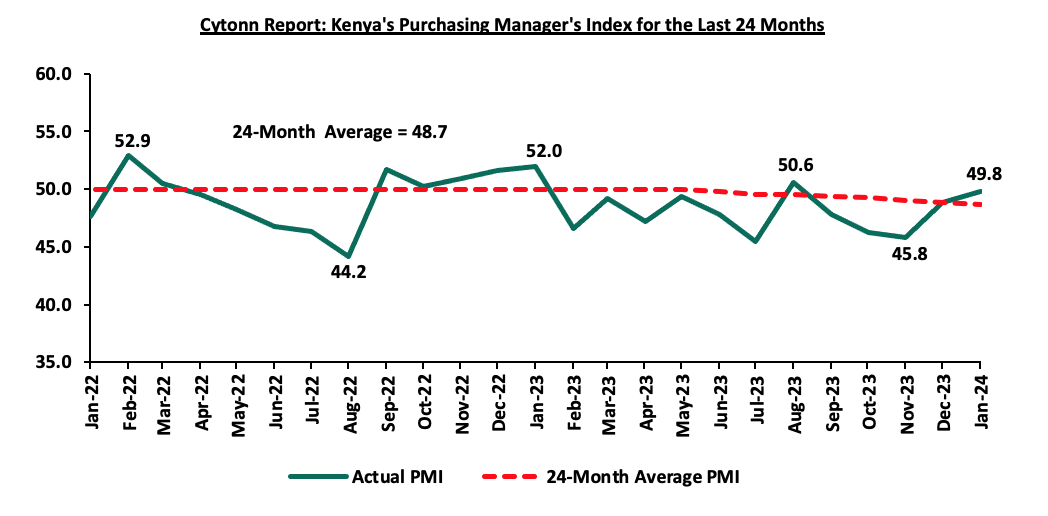
During the week, Stanbic Bank released its monthly Purchasing Manager's Index (PMI) highlighting that the index for the month of January 2024 improved slightly, coming in at 49.8, up from 48.8 in December 2023, signaling a modest and softer downturn in operating conditions across Kenya’s business environment;
Equities
During the week, the equities market recorded a mixed performance, with NSE 20 gaining the most by 0.3%, while NASI, NSE 10, and NSE 25 declined by 1.3%, 0.9%, and 0.4% respectively, taking the YTD performance to gains of 1.2%, 0.8% and 0.5% for NSE 25, NSE 10 and NSE 20 respectively while NASI declined by 0.9%. The equities market performance was driven by losses recorded by large cap stocks such as Safaricom, KCB Group, and Equity Group of 3.3%, 2.2%, and 1.8% respectively. The losses were, however, mitigated by gains recorded by large-cap stocks such as Stanbic, ABSA, and Cooperative Bank of 4.5%, 1.7%, and 1.7% respectively;
Real Estate
During the week, Hass Consult, a Kenyan consulting and real estate development firm, released its House Price Index Q4’2023 Report which highlighted that quarter-on-quarter (q/q) selling prices for all the properties registered a 4.1% increase in Q4’2023, compared to 2.2% decrease in Q4’2022. Additionally, Hass Consult released its Land Price Index Q4’2023 Report which highlighted that the average q/q selling prices for land in the Nairobi suburbs grew by 3.3%, compared to a 0.2% increase recorded in Q4’2022;
In the infrastructure sector, the Kenya Urban Roads Authority (KURA) announced plans to enhance traffic safety and flow by installing new traffic lights and surveillance cameras at 125 intersections;
In the industrial sector, the International Finance Corporation (IFC) announced its plans to lend Kshs 4.8 bn (USD 30.0 mn) to Bora Africa, a REIT-like investment vehicle focused on investing in industrial properties and real estate assets in Kenya and Africa;
In the regulated real estate funds, under the Real Estate Investments Trusts (REITs) segment, ILAM Fahari Income Real Estate Investment Trust (ILAM Fahari I-REIT or IFIR) through a public notice announced it received approval from the Capital Markets Authority (CMA) to delist from the Main Investment Market Segment (MIMS) of the Nairobi Securities Exchange. Additionally, the Capital Markets Authority (CMA) licensed NCBA Bank Kenya PLC to become a Real Estate Investment Trust (REIT) trustee in Kenya. In the Nairobi Securities Exchange, Fahari I-REIT closed the week trading at an average price of Kshs 5.7 per share representing a 6.0% decline from Kshs 6.0 recorded the previous week;
On the Unquoted Securities Platform as at 9th February 2024, Acorn D-REIT and I-REIT closed the week trading at Kshs 24.4 and Kshs 21.7 per unit, a 22.0% and 8.3% gain for the D-REIT and I-REIT, respectively, from the Kshs 20.0 inception price. In addition, Cytonn High Yield Fund (CHYF) closed the week with an annualized yield of 19.2%, 1.2% points higher than the 18.0% yield recorded the previous week;
Investment Updates:
- Weekly Rates:
- Cytonn Money Market Fund closed the week at a yield of 16.62% p.a. To invest, dial *809# or download the Cytonn App from Google Play store here or from the Appstore here;
- Cytonn High Yield Fund closed the week at a yield of 19.20% p.a. To invest, email us at sales@cytonn.com and to withdraw the interest, dial *809# or download the Cytonn App from Google Play store here or from the Appstore here;
- We continue to offer Wealth Management Training every Monday, from 10:00 am to 12:00 pm. The training aims to grow financial literacy among the general public. To register for any of our Wealth Management Trainings, click here;
- If interested in our Private Wealth Management Training for your employees or investment group, please get in touch with us through wmt@cytonn.com;
- Cytonn Insurance Agency acts as an intermediary for those looking to secure their assets and loved ones’ future through insurance namely; Motor, Medical, Life, Property, WIBA, Credit and Fire and Burglary insurance covers. For assistance, get in touch with us through insuranceagency@cytonn.com;
- Cytonn Asset Managers Limited (CAML) continues to offer pension products to meet the needs of both individual clients who want to save for their retirement during their working years and Institutional clients that want to contribute on behalf of their employees to help them build their retirement pot. To more about our pension schemes, kindly get in touch with us through pensions@cytonn.com;
Real Estate Updates:
- For more information on Cytonn’s real estate developments, email us at sales@cytonn.com;
- Phase 3 of The Alma is now ready for occupation and the show house is open daily. To join the waiting list to rent, please email properties@cytonn.com;
- For Third Party Real Estate Consultancy Services, email us at rdo@cytonn.com;
- For recent news about the group, see our news section here;
Hospitality Updates:
- We currently have promotions for Staycations. Visit cysuites.com/offers for details or email us at sales@cysuites.com;
Money Markets, T-Bills Primary Auction:
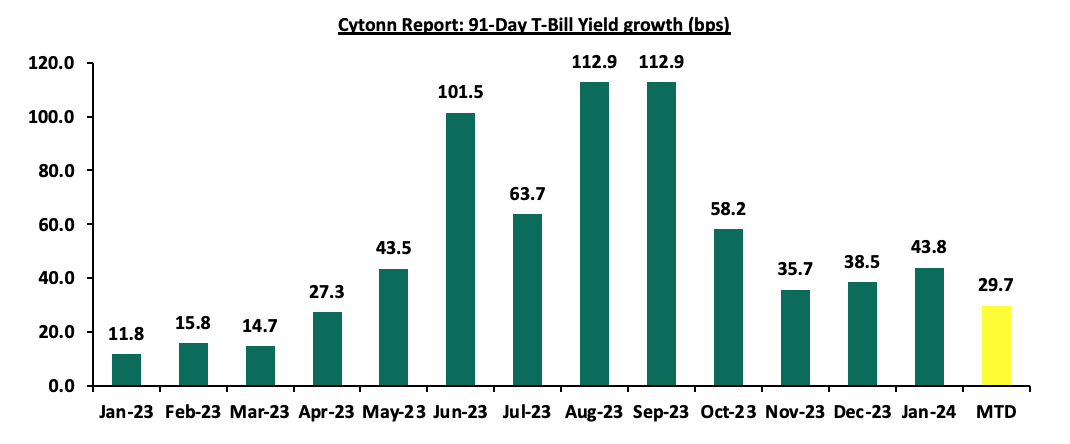
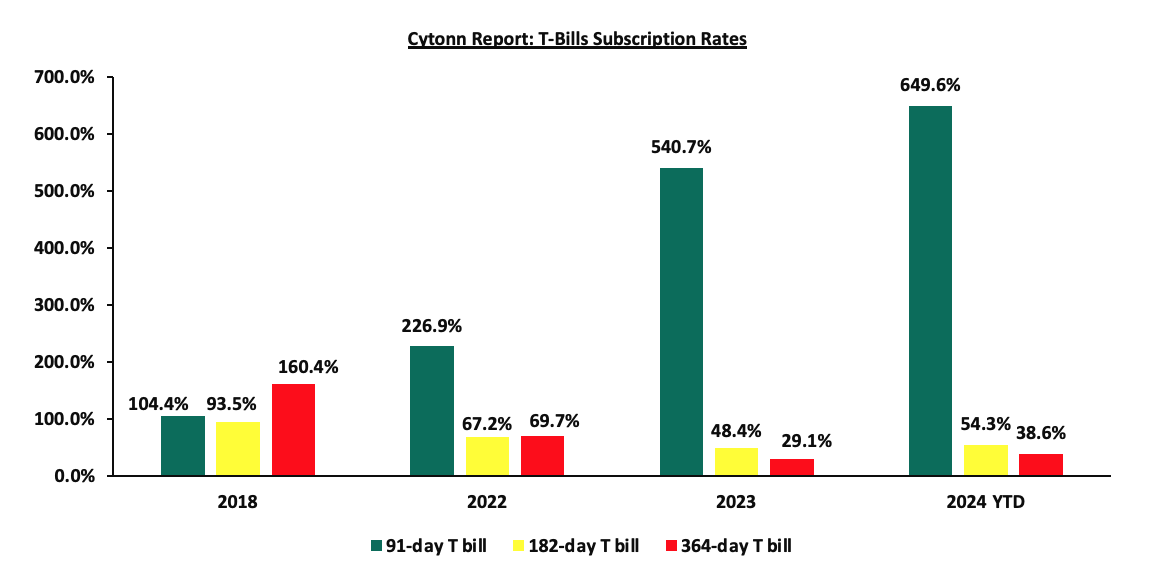
During the week, T-bills were oversubscribed for the sixth consecutive week, with the overall oversubscription rate coming in at 213.0%, much higher than the oversubscription rate of 107.5% recorded the previous week. Investors’ preference for the shorter 91-day paper persisted, with the paper receiving bids worth Kshs 34.7 bn against the offered Kshs 4.0 bn, translating to an oversubscription rate of 867.6%, higher than the oversubscription rate of 515.7% recorded the previous week. The subscription rates for the 182-day and the 364-day papers increased significantly to 94.5% and 69.7% respectively from 16.6% and 35.1% recorded the previous week. The government accepted a total of Kshs 48.8 bn worth of bids out of Kshs 51.1 bn of bids received, translating to an acceptance rate of 95.4%. The yields on the government papers continued to rise with the yields on the 364-day, 182-day, and 91-day papers increasing by 17.7 bps, 12.7 bps, and 12.9 bps to 16.9%, 16.6%, and 16.5%, respectively. The chart below shows the yield growth rate for the 91-day paper over the period:
The chart below compares the overall average T-bill subscription rates obtained in 2018, 2022, 2023, and 2024 Year-to-date (YTD):
Money Market Performance:
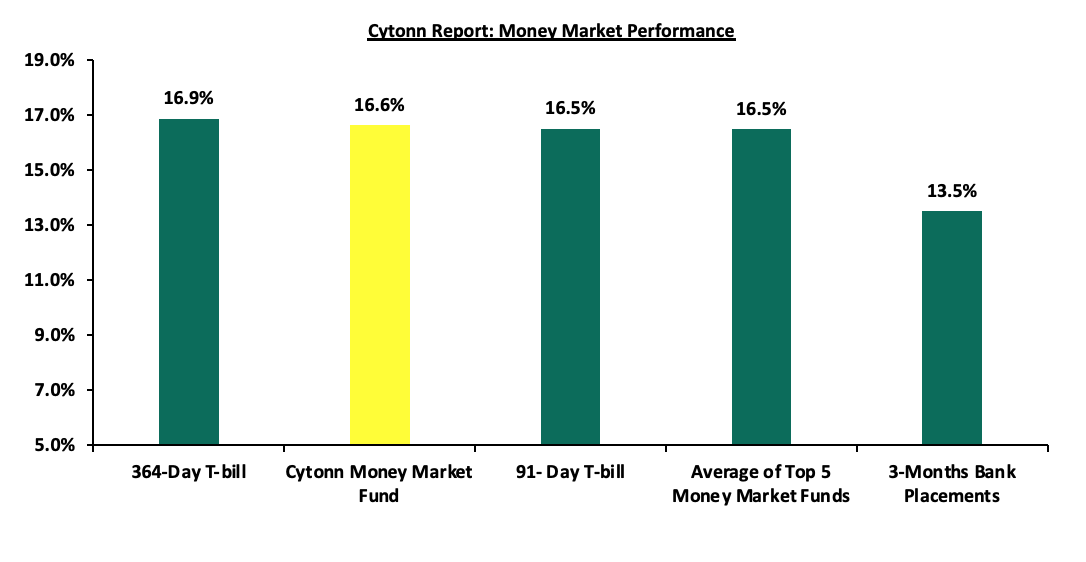
In the money markets, 3-month bank placements ended the week at 13.5% (based on what we have been offered by various banks), and the yields on the 364-day and 91-day papers increased by 17.7 bps and 12.9 bps to 16.9% and 16.5%, respectively. The yields of the Cytonn Money Market Fund increased by 78.0 bps to 16.6% from 15.8% recorded the previous week, while the average yields on the Top 5 Money Market Funds increased by 15.0 bps to 16.5%, from 16.3% recorded the previous week.
The table below shows the Money Market Fund Yields for Kenyan Fund Managers as published on 9th February 2024:
|
Cytonn Report: Money Market Fund Yield for Fund Managers as published on 9th February 2024 |
||
|
Rank |
Fund Manager |
Effective Annual Rate |
|
1 |
Etica Money Market Fund |
17.2% |
|
2 |
Lofty-Corban Money Market Fund |
16.8% |
|
3 |
Cytonn Money Market Fund (Dial *809# or download the Cytonn App) |
16.6% |
|
4 |
GenAfrica Money Market Fund |
16.0% |
|
5 |
Nabo Africa Money Market Fund |
15.9% |
|
6 |
Apollo Money Market Fund |
15.1% |
|
7 |
Kuza Money Market fund |
15.1% |
|
8 |
GenCap Hela Imara Money Market Fund |
15.0% |
|
9 |
Madison Money Market Fund |
14.9% |
|
10 |
Enwealth Money Market Fund |
14.9% |
|
11 |
Co-op Money Market Fund |
14.6% |
|
12 |
Absa Shilling Money Market Fund |
14.6% |
|
13 |
Jubilee Money Market Fund |
14.2% |
|
14 |
AA Kenya Shillings Fund |
14.2% |
|
15 |
Sanlam Money Market Fund |
14.0% |
|
16 |
Mayfair Money Market Fund |
13.9% |
|
17 |
KCB Money Market Fund |
13.6% |
|
18 |
Mali Money Market Fund |
13.5% |
|
19 |
Old Mutual Money Market Fund |
13.2% |
|
20 |
Orient Kasha Money Market Fund |
12.9% |
|
21 |
Dry Associates Money Market Fund |
12.7% |
|
22 |
CIC Money Market Fund |
12.2% |
|
23 |
ICEA Lion Money Market Fund |
11.9% |
|
24 |
Equity Money Market Fund |
11.5% |
|
25 |
British-American Money Market Fund |
10.2% |
Source: Business Daily
Liquidity:
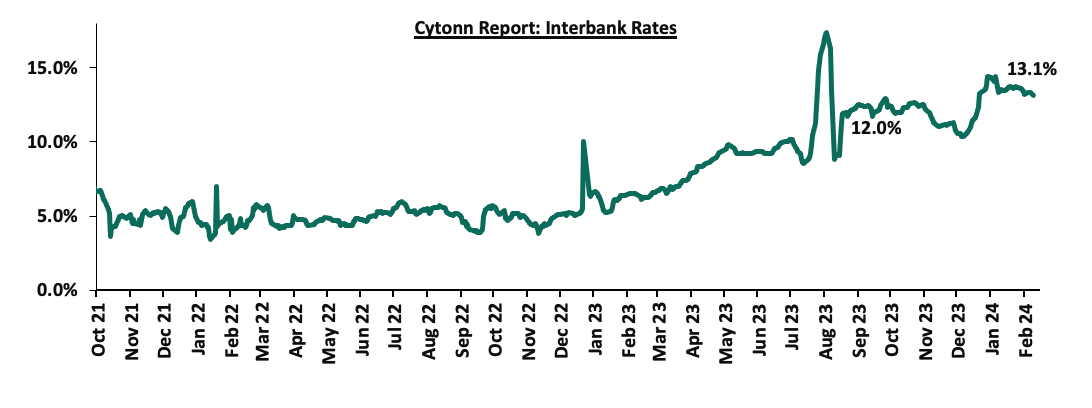
During the week, liquidity in the money markets marginally eased, with the average interbank rate decreasing by 0.1% points, to 13.3% from 13.4% recorded the previous week, partly attributable to the government payments that offset tax remittances. The average interbank volumes traded increased by 60.1% to Kshs 24.9 bn from Kshs 15.5 bn recorded the previous week. The chart below shows the interbank rates in the market over the years:
Kenya Eurobonds:
During the week, the yields on Eurobonds recorded a mixed performance, with the yields on the 10-year Eurobond issued in 2014 decreasing the most by 4.3% points, to 10.3% from 14.6% recorded the previous week attributable to the announcement of its buyback, indicating improved investor perception on the country, while the yields on the 12-year Eurobond issued in 2019 increased the most by 0.3% points, to 10.8% from 10.5% recorded the previous week. The table below shows the summary of the performance of the Kenyan Eurobonds as of 8th February 2024;
|
Cytonn Report: Kenya Eurobonds Performance |
||||||
|
2014 |
2018 |
2019 |
2021 |
|||
|
Tenor |
10-year issue |
10-year issue |
30-year issue |
7-year issue |
12-year issue |
12-year issue |
|
Amount Issued (USD) |
2.0 bn |
1.0 bn |
1.0 bn |
0.9 bn |
1.2 bn |
1.0 bn |
|
Years to Maturity |
0.4 |
4.1 |
24.1 |
3.3 |
8.3 |
10.4 |
|
Yields at Issue |
6.6% |
7.3% |
8.3% |
7.0% |
7.9% |
6.2% |
|
01-Jan-24 |
13.6% |
9.8% |
10.2% |
10.1% |
9.9% |
9.5% |
|
01-Feb-24 |
14.6% |
10.6% |
10.6% |
11.3% |
10.5% |
10.1% |
|
02-Feb-24 |
14.7% |
10.7% |
10.7% |
11.4% |
10.6% |
10.2% |
|
05-Feb-24 |
15.1% |
10.8% |
10.8% |
11.6% |
10.8% |
10.3% |
|
06-Feb-24 |
14.8% |
10.7% |
10.8% |
11.5% |
10.8% |
10.3% |
|
07-Feb-24 |
10.3% |
10.7% |
10.8% |
10.8% |
10.8% |
10.3% |
|
08-Feb-24 |
10.3% |
10.7% |
10.8% |
10.8% |
10.8% |
10.3% |
|
Weekly Change |
(4.3%) |
0.1% |
0.2% |
(0.5%) |
0.3% |
0.2% |
|
MTD Change |
(4.3%) |
0.1% |
0.2% |
(0.5%) |
0.3% |
0.2% |
|
YTD Change |
(3.3%) |
0.8% |
0.6% |
0.7% |
0.9% |
0.8% |
Source: Central Bank of Kenya (CBK) and National Treasury
Kenya Shilling:
During the week, the Kenya Shilling gained against the US Dollar by 0.3% for the second consecutive week, to close at Kshs 160.1, from Kshs 160.6 recorded the previous week. On a year-to-date basis, the shilling has depreciated by 2.0% against the dollar, adding to the 26.8% depreciation recorded in 2023. We expect the shilling to remain under pressure in 2024 as a result of:
- An ever-present current account deficit which came at 3.5% of GDP in Q3’2023 from 6.4% recorded in a similar period in 2022,
- The need for government debt servicing, continues to put pressure on forex reserves given that 67.5% of Kenya’s external debt was US Dollar denominated as of September 2023, and,
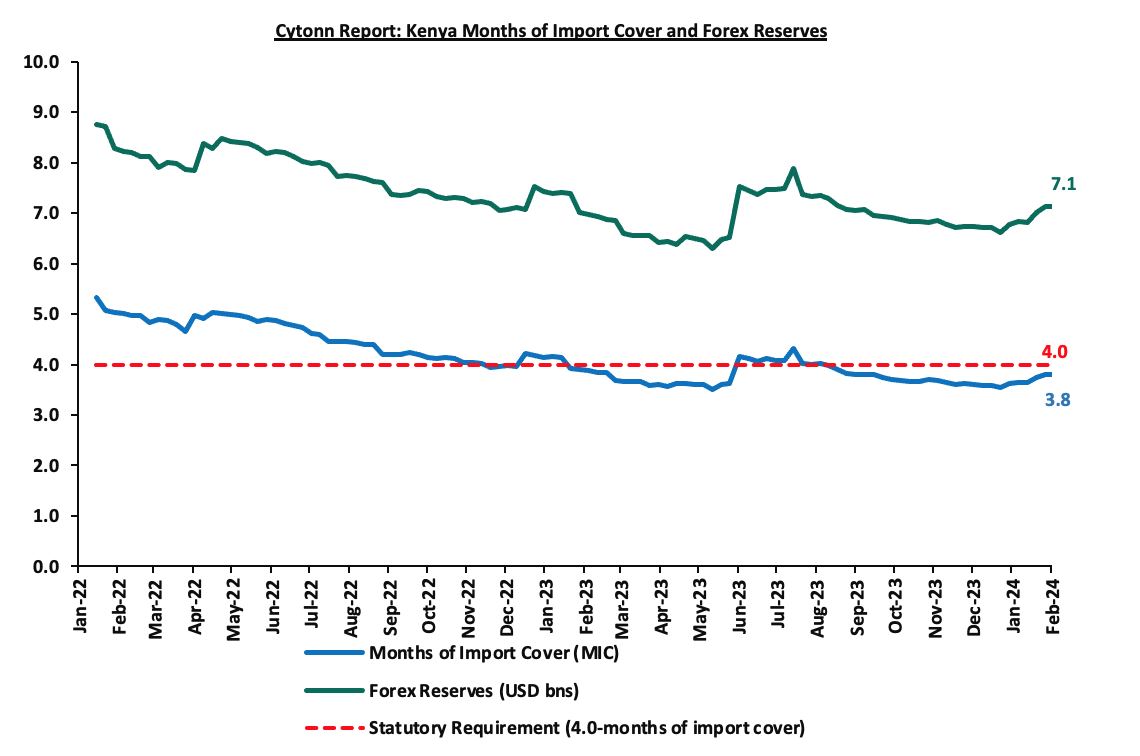
- Dwindling forex reserves, currently at USD 7.1 mn (equivalent to 3.8 months of import cover), which is below the statutory requirement of maintaining at least 4.0 months of import cover.
The shilling is however expected to be supported by:
- Diaspora remittances standing at a cumulative USD 4,189.9 mn as of December 2023, 4.0% higher than the USD 4,027.9 mn recorded over the same period in 2022, which has continued to cushion the shilling against further depreciation. In the December 2023 diaspora remittances figures, North America remained the largest source of remittances to Kenya accounting for 59.6% in the period, and,
- The tourism inflow receipts which came in at USD 333.9 mn in 2023, a 24.6% increase from USD 268.1 mn inflow receipts recorded in 2022, and tourist arrivals improved by 30.7% to 192,000 in the 12 months to December 2023, from 161,000 recorded during a similar period in 2022.
Key to note, Kenya’s forex reserves remained relatively unchanged during the week from the USD 7.1 bn recorded the previous week, equivalent to 3.8 months of import cover relatively unchanged from the months of import cover recorded the previous week, and remained below the statutory requirement of maintaining at least 4.0 months of import cover. The chart below summarizes the evolution of Kenya's months of import cover over the years:
Weekly Highlights
- Monetary Policy Committee (MPC) February Meeting
The monetary policy committee met on February 6, 2024, to review the outcome of its previous policy decisions against a backdrop of continued global uncertainties, moderating global oil prices, an improved global growth outlook as well as the heightened geopolitical tensions. The MPC decided to raise the CBR rate by 0.5% points to 13.0% from 12.5%, which was contrary to our expectation for the MPC to retain the CBR rate at 12.5%. Our expectation to maintain the rate at 12.5% was mainly on the back of an eased inflation rate, coming in at 6.6% in December 2023 from 6.8% in November, remaining within the CBK preferred range of 2.5%-7.5% for the sixth consecutive month, as well as the need to allow more time for the effects of the previous policy rate to transmit in the economy. Key to note, the MPC had increased the CBR by 200 basis points to 12.5% in the previous meeting. Below are some of the key highlights from the February meeting:
- The overall inflation tightened to 6.9% in January 2024, from 6.6% in December 2023, to remain on the higher bound of the preferred CBK range of 2.5%-7.5%, mainly driven by an increase in fuel inflation. Fuel inflation increased to 14.3% in January 2024 from 13.7% in December 2023, largely attributable to higher electricity tariffs. The food inflation increased slightly to 7.9% in January 2024 from 7.7% in December 2023, attributable largely to higher prices of a few non-vegetable food items, following a decline in food supply partly due to seasonal factors. The increase was however mitigated by a decrease in the prices of a few vegetables, particularly mangoes and tomatoes. The non-food non-fuel inflation slightly increased to 3.6% in January 2024 from 3.4% in December 2023. We expect the overall inflation to tighten further in the short-term, on the back of increased landing fuel prices resulting from the depreciation of the Shilling against the dollar,
- The recently released GDP data for the third quarter of 2023 showed continued strong performance of the Kenyan economy, with real GDP growing by 5.9%. This was attributable to a strong rebound in the agriculture sector due to favourable weather conditions and resilient performance of the services sector. Leading indicators of economic activity pointed to continued strong performance in the fourth quarter of 2023. Despite the global uncertainties, the economy is expected to continue to strengthen in 2024, supported by resilient services sector, the rebound in agriculture, and implementation of measures to boost economic activity in priority sectors by the Government,
- Goods exports declined by 2.2% in the 12 months to December 2023, compared to a 9.3% growth in a similar period in 2022. Receipts from manufactured exports increased by 11.3%, attributable to increased regional demand. Imports declined by 10.6% in the 12 months to December 2023 compared to a growth of 7.3% in a similar period in 2022, mainly reflecting lower imports across all categories except food and crude materials. Tourist arrivals improved by 30.7% in the 12 months to December 2023, compared to a similar period in 2022. Remittances totalled USD 4,190.0 mn in the 12 months to December 2023 and were 4.0% higher compared to a similar period in 2022. The current account deficit is estimated at 3.9% of GDP in the 12 months to December 2023, and is projected at 4.0% of GDP in 2024, reflecting the expected recovery in imports, resilient remittances and expected rebound in agricultural exports. Going forward for this year, the MPC expects a widening of the current account to a deficit of USD 4.9 bn, to be mostly funded by inflows of capital and to have a residual deficit of USD 111.0 mn,
- The CBK foreign exchange reserves, which currently stand at USD 7,101.0 mn representing 3.8 months of import cover, continue to provide adequate cover and a buffer against any short-term shocks in the foreign exchange market,
- The banking sector remains stable and resilient, with strong liquidity and capital adequacy ratios. The ratio of gross non-performing loans (NPLs) to gross loans decreased to 14.8% in December 2023 compared to 15.3% in October 2023. Decreases in NPLs were noted in the energy and water, manufacturing, agriculture, building and construction, and transport and communication sectors. However, banks have continued to make adequate provisions for the NPLs,
- The CEOs Survey and Market Perceptions Survey conducted ahead of the MPC meeting revealed a positive outlook on business activity for the next year. Participants of the survey expressed concerns about low demand for goods, weakening of the Kenya shilling, and high interest rates. Despite this, they remained optimistic that economic growth would remain resilient and improve in 2024, supported by increased agricultural production, easing global inflation, a resilient private sector and focus by the government on key sectors including agriculture,
- The Survey of the Agriculture Sector revealed an expectation by respondents that the prices of key food items were expected to increase in the next three months due to high import costs as a result of the depreciation of the currency’s value,
- Global growth is expected to increase by 0.1% points to 3.2% in 2024 from 3.1% in 2023, attributable to a higher-than-expected growth in the United States, continued strengthening of the Chinese economy and a high growth in several large and emerging markets. Additionally, headline inflation rates in advanced economies have continued to ease, but remain above their respective core inflationary targets due to tight monetary policy and lower commodity prices, particularly oil and food,
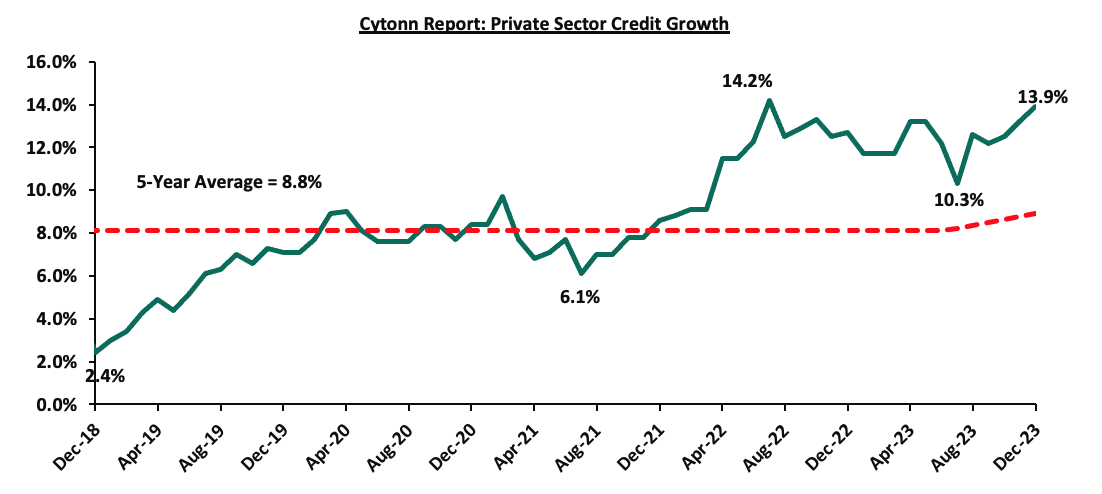
- Growth in private sector credit increased to 13.9% in December 2023 from 13.2% in November, mainly attributed to credit growth in the manufacturing, transport and communication, trade, and consumer durables sectors which grew by 20.9, 20.8%, 13.1% and 9.9% respectively. The number of loan applications and approvals remained strong, reflecting sustained demand, particularly for working capital requirements. The chart below shows the movement of the private sector credit growth over the last five years:
- The Committee noted the ongoing implementation of the FY2023/24 Government Budget, as well as the revised budget for the fiscal year which continues to reinforce fiscal consolidation. Notably, with fiscal deficit is expected to decline from 5.6% in 2023 to around 3.0% in the next three years.
The MPC noted the impact of the continued, albeit reduced, depreciation of the Kenyan Shilling against the dollar on domestic prices of goods and its ripple effect on the cost of living and purchasing power of consumers. In addition to the inflation tightening to 6.9% in January 2024, the committee noted that all key components of inflation had increased in January. Additionally, the Committee noted that the proposed action will ensure that inflationary pressures remain anchored and downward towards the 5.0% mid-point of the target range, as well as addressing residual pressures on the exchange rate. The MPC therefore decided to raise the Central Bank Rate (CBR) to 13.00%, from 12.50% and concluded that it will closely monitor the impact of the policy measures as well as developments in the global and domestic economy and stands ready to further tighten monetary policy as necessary to ensure price and exchange rate stability are achieved, in line with its mandate. The Committee will meet again in April 2024.
- Kenya’s Eurobond Buyback Offer
During the week, Kenya announced it was going through with the earlier announced plan of buying back the 10-year tenor USD 2.0 bn Eurobond issued in 2014. In the announcement, Kenya stated that the buyback plan would be financed by issuance of a new Eurobond. This follows successful issues by Ivory Coast and Benin which raised USD 2.6 bn and USD 750.0 mn respectively, marking the return of the Sub-Saharan region to the international Eurobonds market after nearly two years of absence. Notably, both bonds were massively oversubscribed.
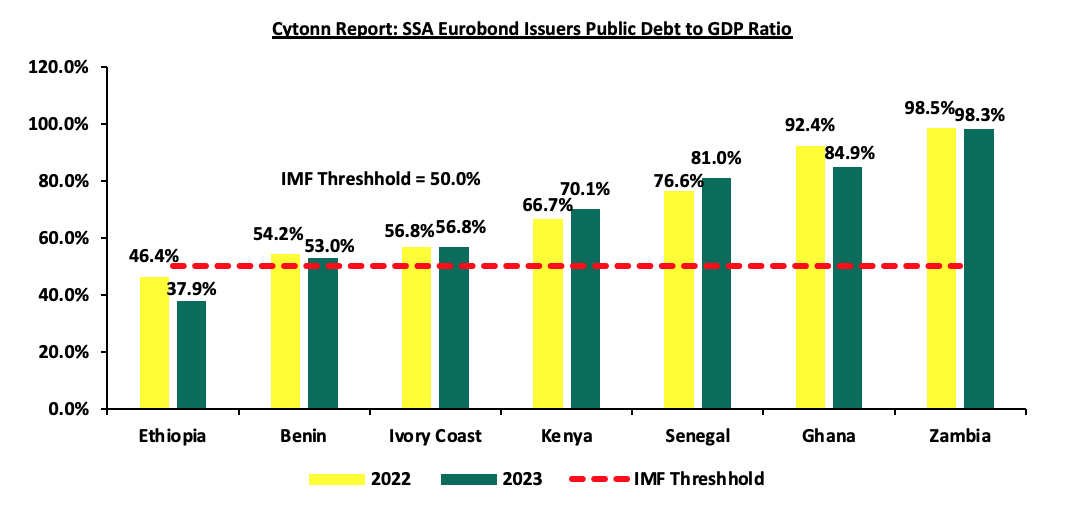
The Kenyan ten-year tenor bond that was issued in 2014 at a coupon rate of 6.875% is due for maturity in June 2024 and has been a subject of great concern for the country’s economic prospects. Questions have been raised on whether Kenya will be able to meet its obligations on the debt and how it would affect the country’s credit ratings. According to Moody’s, S&P Global, and Fitch Kenya’s credit rating currently stands at B3 (Negative), B (Negative), and B (Negative) respectively. Kenya’s high public debt to GDP ratio of 70.1%, which is 20.1% points higher than the IMF recommended threshold of 50.0%, has compounded these concerns. The graph below shows the public debt to GDP ratio of select SSA countries:
The buyback offer which runs from the 7th of February 2024 to 14th February 2024 will see Kenya purchase Notes due in 2024 from their holders at par value, for cash. The maximum tender amount for the offer is expected to be equal to the principal amount, which in this case will be USD 2.0 bn. Kenya expects to pay for these notes using proceeds from the issuance of a new bond. The results of the offer and issue will be announced on the 15th of February and the settlement date is scheduled for 21st February. In the offering circular for the new bond, Kenya stated that the proceeds from the bond will be used to finance the buyback, and that any extra funds will be used for general budgeting expenses.
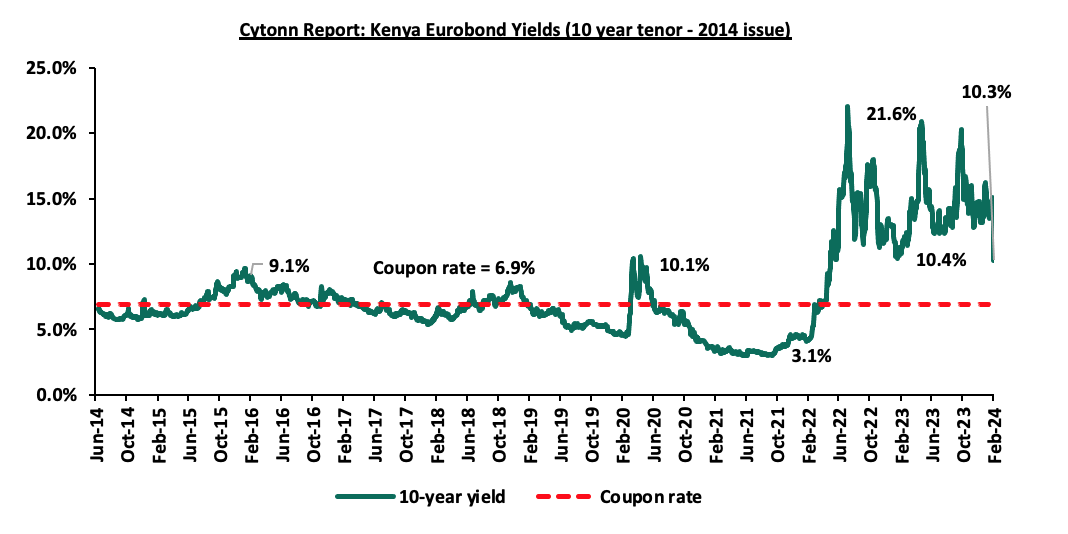
Following the announcement of the buyback and new issue, the immediate market reaction saw a drop in the yields of the 10-year Eurobond to close the day at 10.25%, from the initial 14.8%. This reaction can be attributed to a number of factors, including:
- Investor Expectations: Investors interpreted the development as a positive signal from the Kenyan government, showing its commitment to managing its debt profile more efficiently and taking proactive measures to address debt sustainability concerns. This increased investor confidence contributed in driving down the yields,
- Perceived Risk Reduction: Like initially discussed, the maturity of the bond in June has created uncertainty over Kenya’s ability to repay the debt, and induced a level of risk concerns among investors. This announcement by Kenya was, therefore, perceived by investors as a positive development, as it reduces the risk of default and improves the creditworthiness of the government, and,
- Supply & demand dynamics: The buyback announcement of the existing bond pointed to reduced supply of that bond in the market, while the issuance of new bonds likely attracting more investors’ increased the demand in the market. This change in supply and demand dynamics helped pressure the yields downwards.
The graph below shows the yields for the bond since it was issued in 2014:
Given the activity we have seen in the Sub-Saharan African countries’ performance in the market, our risk profile and the unique nature of our buy-back and new issue plan, we anticipate the yield for the Kenyan Eurobond will come in at a coupon rate range of between 9.5% to 10.5%.
To note, Kenya’s credit rating ranks six positions below Ivory Coast and five positions below Benin. As such, given that both the IDR credit ratings and Public Debt-to-GDP ratio for Kenya are worse than those of Benin and Ivory Coast, the country would need to propose an average coupon rate of 10.0% to successfully issue a 10-year Eurobond. The table below compares the credit ratings for the three countries, the performance of the recent Eurobond issues and Debt-to-GDP ratios:
|
Fitch Ratings Long-Term Foreign-Currency Issuer Default Rating (IDR) |
2024 Eurobond Issues |
|||||
|
Country |
IDR Credit Rating |
IDR Credit Outlook |
Value (USD Mn) |
Coupon Rate |
Subscription Rate |
Public Debt-to-GDP Ratio |
|
Ivory Coast |
BB- |
Stable |
1,100.0 |
7.650% |
307.5% |
56.8% |
|
1,500.0 |
8.250% |
|||||
|
Benin |
B+ |
Stable |
750.0 |
8.375% |
666.7% |
53.0% |
|
Kenya |
B |
Negative |
- |
10.000%* |
- |
70.1% |
*Average Projected Coupon Rate for Kenya for a 10-year Eurobond
- Benin Debuts USD 750.0 mn Dollar Bond
During the week, Benin became the second country in the Sub-Saharan Africa (SSA) region to tap into the international capital markets in 2024, issuing their debut dollar bond with a tenor of 14 years and a coupon rate of 8.375%. Notably, the bond was oversubscribed with the overall subscription rate coming in at 666.7% having received bids worth USD 5.0 bn against the offered USD 750.0 mn.
This follows Ivory Coast (Côte d’Ivoire) January 2024 Eurobond issue of two bonds with maturities of 8.5 years and 12.5 years, which fetched coupon rates of 7.625% and 8.250% respectively. Notably, the sovereign raised a total of USD 2.6 bn from the two tranches, with the two issues recording an oversubscription of over USD 8.0 bn. This marked the inaugural issuance in the Sub-Saharan Africa region since 2022, a period when heightened global interest rates and geopolitical unrest made foreign currency loans unaffordable for most African borrowers.
Benin’s Economy and Finance Ministry announced that the country will use the proceeds to finance the 2024 budget and in effect reduce borrowing on the West African regional market. Since starting a new IMF program in 2022, Benin has been focused on reform implementation that is set to drive a decline in the budget deficit. According to the Africa Development Bank (AfDB), the country’s budget deficit is projected to decline to 4.1% in 2024 while the current account deficit is projected to fall to 3.8% in 2024.
Notably, Benin’s issuer ratings according to Moody’s, S&P Global, and Fitch stand at B1 (stable), B+ (positive), and B+ (Stable) respectively, indicating that the country has the ability to meet its financial commitments despite substantial credit risk being present. Kenya’s issuer ratings according to Moody’s, S&P Global, and Fitch stand at B3 (negative), B+ (negative), and B (negative) respectively. In comparison, Kenya’s credit rating ranks seven positions lower than that of Benin in the SSA Credit rankings, implying that the country is able to meet its financial commitments but there is a material risk of default due to deteriorating business and economic environment. Additionally, Kenya’s debt to GDP ratio stood at 70.1% in 2023, 17.7% points above that of Benin indicating a higher debt burden for Kenya. As such, if Kenya was to issue a Eurobond, we estimate that a 10-year Eurobond would fetch a coupon rate in the range of 9.5% and 10.5%, with the single digit rate probability been on the back of improved investor perception, following the announcement of the USD 2.0 bn buyback by the Kenyan government, evident through the 4.3% points yield decline of the June maturity Eurobond to close the week at 10.3% from 14.6% recorded the previous week.
The Benin Dollar Bond issue 2024 is a significant milestone for the country. Benin is part of the countries using the West African CFA Franc that is pegged to the Euro, and has until now only issued international bonds denominated in the Euro currency. The decision to issue a Dollar-denominated bond reflects Benin's effort to tap into a broader investor base and access alternative sources of capital. By entering the Dollar bond market, Benin enhances its visibility and attractiveness to a wider range of global investors who may have a preference for or exposure to Dollar-denominated assets. This diversification can contribute to lowering Benin's dependency on a single currency and mitigating currency risk. In addition, the oversubscription of the SSA Eurobond issues in 2024 points to an increasing appetite for risky and junk-rated bonds as investors anticipate interest rate cuts by developing countries.
- Stanbic Bank’s January 2024 Purchasing Manager’s Index (PMI)
During the week, Stanbic Bank released its monthly Purchasing Manager's Index (PMI) highlighting that the index for the month of January 2024 improved slightly, coming in at 49.8, up from 48.8 in December 2023, signaling a modest and softer downturn in operating conditions across Kenya’s business environment. Private sector conditions have now deteriorated for five months running, with the latest decline being the weakest in this sequence. The modest and softer downturn of the general business environment is mainly attributable to a slight improvement in activity in agriculture, construction and services sectors, coupled with improved employment levels. Notably, the maximum allowed price for Super Petrol, Diesel and Kerosene decreased by Kshs 5.0, Kshs 5.0 and Kshs 4.8 respectively and will retail at Kshs 207.4, Kshs 196.5 and Kshs 194.2 per litre respectively. This is against the December 2023 prices of Super Petrol, Diesel and Kerosene at Kshs 212.4, Kshs 201.5 and Kshs 199.1 respectively. The fuel prices however still remain relatively high, with the aggressive depreciation of the Kenyan shilling, having depreciated against the dollar by 2.7% in the month of January as well as higher taxes. In addition, the slight increase in the country’s inflation to 6.9% in January from 6.6% in December contributed to the subdued business environment. Consequently, demand in the manufacturing, the wholesale and retail sectors worsened as heightened prices resulted to erosion of spending power.
The average output charges rose at the slowest pace in nearly a year and a half. Where prices increased, firms noted a combination of higher costs and a stabilizing demand environment. The sector data showed a rise in employment numbers for January, marking the first monthly increase since August 2023, attributable to an increase in addition of temporary employees. During the month, work backlogs also increased, albeit fractionally. With cost pressures easing and the downturn in sales softening, purchasing activity at Kenyan firms dropped for the fifth consecutive month, and this time at a faster rate than December’s. Lead times on purchased items improved modestly as inventories remained relatively unchanged after three successive months of growth. Agriculture was the only sector to see a rise in staffing.
Notably, domestic output expectations were subdued in January as exports continued to perform strongly, helping to compensate for this weak domestic output, as demand from Asia and Europe still remained greater. Key to note, a PMI reading of above 50.0 indicates an improvement in the business conditions, while readings below 50.0 indicate a deterioration. The chart below summarizes the evolution of PMI over the last 24 months:
Going forward, we anticipate that the business environment will be constrained in the short to medium term as a result of the tough economic environment driven by high interest rates from the tightened monetary policy, persistent depreciation of the Kenyan Shilling
Rates in the Fixed Income market have been on an upward trend given the continued high demand for cash by the government and the occasional liquidity tightness in the money market. The government is 42.6% behind of its prorated net domestic borrowing target of Kshs 292.7 bn, having a net borrowing position of Kshs 168.0 bn out of the domestic net borrowing target of Kshs 471.4 bn for the FY’2023/2024. Therefore, we expect a continued upward readjustment of the yield curve in the short and medium term, with the government looking to maintain the fiscal surplus through the domestic market. Owing to this, our view is that investors should be biased towards short-term fixed-income securities to reduce duration risk.
Market Performance:
During the week, the equities market recorded a mixed performance, with NSE 20 gaining the most by 0.3%, while NASI, NSE 10, and NSE 25 declined by 1.3%, 0.9%, and 0.4% respectively, taking the YTD performance to gains of 1.2%, 0.8% and 0.5% for NSE 25, NSE 10 and NSE 20 respectively while NASI declined by 0.9%. The equities market performance was driven by losses recorded by large cap stocks such as Safaricom, KCB Group, and Equity Group of 3.3%, 2.2%, and 1.8% respectively. The losses were, however, mitigated by gains recorded by large-cap stocks such as Stanbic, ABSA, and Cooperative Bank of 4.5%, 1.7%, and 1.7% respectively.
During the week, equities turnover increased by 19.6% to USD 6.2 mn from USD 5.2 mn recorded the previous week, taking the YTD total turnover to USD 24.5 mn. Foreign investors remained net sellers for the fifth consecutive week with a net selling position of USD 0.4 mn, from a net selling position of USD 0.1 mn recorded the previous week, taking the YTD foreign net selling position to USD 1.5 mn.
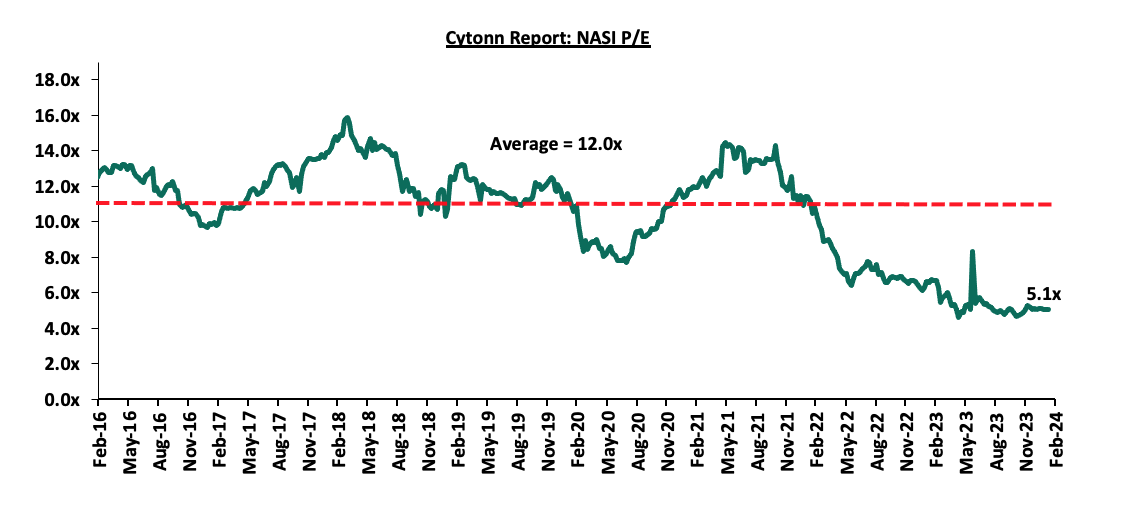
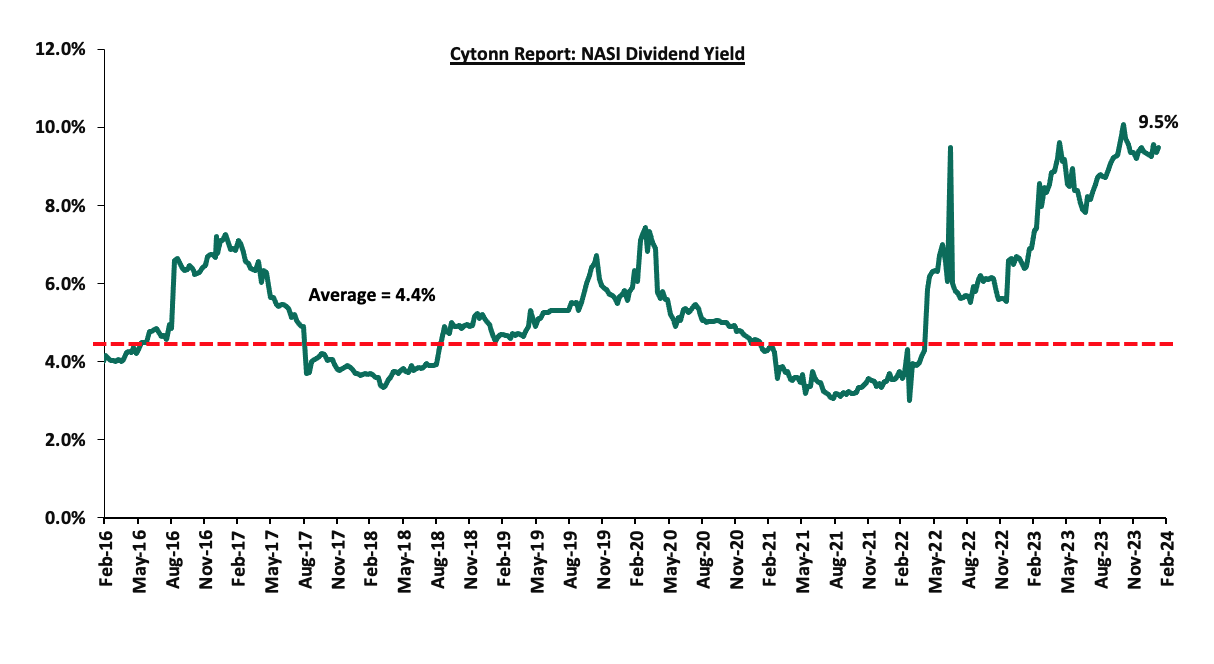
The market is currently trading at a price-to-earnings ratio (P/E) of 5.1x, 57.9% below the historical average of 12.0x. The dividend yield stands at 9.5%, 5.1% points above the historical average of 4.4%. Key to note, NASI’s PEG ratio currently stands at 0.7x, an indication that the market is undervalued relative to its future growth. A PEG ratio greater than 1.0x indicates the market is overvalued while a PEG ratio less than 1.0x indicates that the market is undervalued. The charts below indicate the historical P/E and dividend yields of the market;
Universe of Coverage:
|
Cytonn Report: Universe of Coverage |
||||||||||
|
Company |
Price as at 02/02/2024 |
Price as at 09/02/2024 |
w/w change |
YTD Change |
Year Open 2024 |
Target Price* |
Dividend Yield |
Upside/ Downside** |
P/TBv Multiple |
Recommendation |
|
KCB Group*** |
20.4 |
20.0 |
(2.2%) |
(9.1%) |
22.0 |
31.2 |
10.0% |
66.4% |
0.3x |
Buy |
|
Sanlam |
6.3 |
6.6 |
4.1% |
10.0% |
6.0 |
10.3 |
0.0% |
55.9% |
1.9x |
Buy |
|
Kenya Reinsurance |
1.9 |
1.9 |
(0.5%) |
0.0% |
1.9 |
2.5 |
10.8% |
46.5% |
0.1x |
Buy |
|
Jubilee Holdings |
180.3 |
190.0 |
5.4% |
2.7% |
185.0 |
260.7 |
6.3% |
43.5% |
0.3x |
Buy |
|
I&M Group*** |
17.5 |
17.4 |
(0.6%) |
(0.3%) |
17.5 |
22.1 |
12.9% |
39.9% |
0.4x |
Buy |
|
NCBA*** |
37.7 |
37.6 |
(0.3%) |
(3.2%) |
38.9 |
48.3 |
11.3% |
39.8% |
0.8x |
Buy |
|
ABSA Bank*** |
11.9 |
12.1 |
1.7% |
4.3% |
11.6 |
14.6 |
11.2% |
32.4% |
1.0x |
Buy |
|
Diamond Trust Bank*** |
49.0 |
48.8 |
(0.3%) |
9.1% |
44.8 |
58.5 |
10.2% |
30.1% |
0.2x |
Buy |
|
Britam |
5.0 |
4.7 |
(6.0%) |
(8.6%) |
5.1 |
6.0 |
0.0% |
27.0% |
0.6x |
Buy |
|
Stanbic Holdings |
110.0 |
115.0 |
4.5% |
8.5% |
106.0 |
132.8 |
11.0% |
26.4% |
0.8x |
Buy |
|
Standard Chartered*** |
162.5 |
165.0 |
1.5% |
3.0% |
160.3 |
185.5 |
13.3% |
25.8% |
1.1x |
Buy |
|
Co-op Bank*** |
12.0 |
12.2 |
1.7% |
7.5% |
11.4 |
13.8 |
12.3% |
25.4% |
0.6x |
Buy |
|
Equity Group*** |
38.2 |
37.5 |
(1.8%) |
9.5% |
34.2 |
42.8 |
10.7% |
25.0% |
0.8x |
Buy |
|
CIC Group |
2.0 |
2.1 |
4.9% |
(6.6%) |
2.3 |
2.5 |
6.1% |
22.9% |
0.7x |
Buy |
|
Liberty Holdings |
5.3 |
5.5 |
3.4% |
42.0% |
3.9 |
5.9 |
0.0% |
8.0% |
0.4x |
Hold |
|
HF Group |
3.5 |
3.8 |
7.4% |
9.9% |
3.5 |
3.9 |
0.0% |
2.9% |
0.2x |
Lighten |
We are “Neutral” on the Equities markets in the short term due to the current tough operating environment and huge foreign investor outflows, and, “Bullish” in the long term due to current cheap valuations and expected global and local economic recovery. With the market currently being undervalued to its future growth (PEG Ratio at 0.7x), we believe that investors should reposition towards value stocks with strong earnings growth and that are trading at discounts to their intrinsic value. We expect the current high foreign investor sell-offs to continue weighing down the equities outlook in the short term.
- Industry Report
During the week, Hass Consult, a Kenyan consulting and real estate development firm, released its House Price Index Q4’2023 Report, focusing on the residential real estate sector's performance in the Nairobi Metropolitan Area (NMA). The following are the main findings of the report;
- The average quarter-on-quarter (q/q) selling prices for all the properties registered a 4.1% increase in Q4’2023, compared to a 2.2% decrease in Q4’2022. The performance was mainly supported by price increases of 4.1% and 4.6% in detached and semi-detached house prices respectively. Furthermore, the performance was supported by a 3.4% increase in the selling prices of apartments. On a year-on-year (y/y) basis, the average selling prices for properties increased by 2.5%, compared to the 4.8% increase that was recorded in Q4’2022. This upward trend in property prices is linked to escalating inflation and the depreciation of the shilling, which have elevated input expenses for developers who in turn pass on these higher costs to homebuyers through higher selling prices,
- The overall asking rents of housing units in the NMA during Q4’2023 increased by 2.5% q/q, compared to a 1.5% decline recorded in Q4’2022. On a y/y basis, the average asking rent increased by 2.5% compared to the 0.3% increase recorded in Q4’2022. The increase in performance was attributable to increased rents in detached and semi-detached houses, registering q/q surges of 0.8% and 4.6% respectively in Q4’2023, as landlords adjusted rents to align with the growing demand for these property types in the market,
- Apartments recorded the highest y/y increase in asking rents of 10.2% in Q4’2023, a 5.7% increase from Q4’2022. Conversely, detached units experienced a price correction of 1.4%, while semi-detached units saw a price increase of 2.5% during the period under review. The decline in detached units and increase in apartments and semi-detached units can be attributed to the progressive expansion of the middle class, which favors renting apartments for their affordability, and the growing demand for semi-detached units,
- Within the Nairobi Suburbs detached and semi-detached houses market, Langata emerged as the top performer, witnessing a y/y sales price appreciation of 12.9%. This surge can be attributed to factors such as i) the area benefits from a well-connected road network, facilitated by infrastructure developments like the Southern Bypass and Lang’ata road, ii) its proximity to the Central Business District (CBD) iii) Langata offers relatively more affordable housing options compared to neighboring areas such as Karen. Conversely, Kitisuru experienced the highest year-on-year decline of 4.6%, primarily due to a decrease in demand for houses in the area, driven by the search for more affordable housing alternatives,
- In the Nairobi Suburbs apartments, Lang’ata remained to be the best-performing region recording a y/y capital appreciation of 11.4%, due to i) its close proximity to social commercial, social, and recreational amenities such as The Hub, and Waterfront Karen malls ii) enhanced access due to infrastructure improvements on key connecting roads including rehabilitation of Ngong Road and link road joining Ngong Road to Lang’ata Road, iii) close proximity to Central Business District and due to good road connectivity reducing commute time, and, iv) a growing middle class population in the areas driving demand for apartments in the area upwards. On the other hand, Upperhill realized the highest y/y price correction of 9.2% attributed to city residents opting for neighboring areas such as Westlands and Spring Valley,
- In the satellite towns, properties in Athi River saw the highest year-on-year price appreciation, standing at 14.5%. This surge can be attributed to several factors: i) its proximity to commercial, social, educational institutions, and recreational amenities like Signature Mall, Coloho Mall, and Whistling Morans, ii) enhanced infrastructure development such as the Athi River interchange, the Nairobi Expressway in neighboring Mlolongo, and the presence of the Standard Gauge Railway (SGR) station, all contributing to improved accessibility; iii) the growing population driven by the presence of major mining and cement companies like Bamburi Cement and East Africa Portland Cement Company, creating employment opportunities and increasing demand. Conversely, properties in Limuru experienced the highest y/y price correction of 3.4%, mainly due to reduced demand resulting from its distant location from Nairobi CBD and other major urban business centers, as well as key transportation hubs like Jomo Kenyatta International Airport (JKIA) and the SGR, and,
- In satellite towns’ apartments, Thika recorded the highest y/y price appreciation of 9.6% which was supported by good infrastructure access and a growing population. Conversely, Kitengela realized the highest y/y price correction of 5.9% attributed to stiff competition faced from neighbourhoods such as Athi River, Mlolongo, and Syokimau, which are strategically located along the Mombasa-Nairobi Highway enhancing accessibility and demand by buyers as well as their closer proximity to amenities such as Crystal Rivers and Signature malls, and the Nairobi CBD.
The findings of the report are in line with our Cytonn Annual Markets Review 2023, highlighting that selling prices of residential properties in the Nairobi Metropolitan Area (NMA) recorded a 0.5% appreciation in FY’2023. The performance was supported by 0.6% and 0.5% price appreciations realized by apartments and detached and semi-detached units respectively during the period under review.
Hass Consult also released Land Price Index Q4’2023 Report which highlights the performance of the Real Estate land sector in the Nairobi Metropolitan Area (NMA). The following were the key take outs from the report;
- The average q/q selling prices for land in the Nairobi suburbs grew by 3.3%, compared to 0.2% increase recorded in Q4’2022. On a y/y basis the performance represented 4.0% increase, compared to the 1.2% increase recorded in Q4’2022. Consequently, q/q and y/y land prices in satellite towns of Nairobi increased by 3.7% and 9.3% respectively, compared to the 1.0% and 9.0% growth respectively, recorded in Q4’2022. The market improvement continues to demonstrate the sector’s resilience, with demand growing on the back of emerging opportunities in retail, manufacturing, and logistics needed to serve the rapidly urbanizing towns as well as the Nairobi CBD,
- Loresho was the best-performing node in the Nairobi suburbs with a y/y price appreciation of 11.0%. This was attributed to; i) its close proximity to commercial, social, educational institutions and recreational amenities, ii) enhanced access due to good infrastructure, iii) close proximity to Central Business District, and, iv) a growing middle-class population in the areas driving demand in the area. Conversely, land in Riverside recorded the highest y/y price correction of 3.2%. This is attributed to the land buyer’s preference for neighboring Loresho and Spring Valley areas, which prove to be more strategic for developers, and,
- For satellite town, Ngong was the best-performing node with a y/y capital appreciation of 21.4%, followed by Thika which recorded a y/y capital appreciation of 17.8%. The improvement in performance in Ngong was driven by; i) increased demand for land due to its affordability, ii) its close proximity to the Nairobi CBD and major urban nodes as well as opulent residential areas such as Karen, and, iii) good infrastructure enhancing connectivity. On the other hand, land prices in Thika were supported by access to infrastructural facilities such as roads as well as a growing young population in the area mainly composed of students driving demand for rentals in the area upwards. Conversely, Limuru was the worst performing node with a y/y price correction of 5.6%, attributable to increased competition from the neighboring areas which are closer in proximity to the CBD and other urban areas.
The findings of the report are also in line with our Cytonn Annual Markets Review 2023 which highlighted that the overall average selling prices for land in the NMA appreciated by 2.9% to record an average price per acre of Kshs 128.6 mn per acre in Q4’2023. This was mainly attributed to; i) government’s continued emphasis on infrastructural development such as roads, railways, water, and sewer lines which has improved and opened up areas for investment, ultimately increasing property prices, ii) limited supply of land especially in urban areas which has contributed to exorbitant prices, iii) increased construction activities particularly in the residential sector fueled by the government’s affordable housing agenda boosting demand for land upwards, iv) positive demographics driving demand for land upwards, facilitated by high population and urbanization growth rates of 1.9% and 3.7%, which are above the global averages of 0.8% and 1.5% respectively, and, v) growth in popularity of satellite towns by investors and buyers which provide affordable land options in comparison to the suburbs and key commercial zones.
- Infrastructure Sector
During the week, the Kenya Urban Roads Authority (KURA) announced plans to enhance traffic safety and flow by installing new traffic lights and surveillance cameras at 125 intersections. The project which is to be funded by a loan from the Exim Bank of China and implemented by Chinese contractors, aims to improve road safety and ease congestion. The Kenya Urban Roads Authority (Kura) revealed that the initiative will include the establishment of a traffic management center and the installation of advanced traffic management systems, signal controls, and surveillance cameras. Additionally, traffic violation detection equipment will be installed at intersections, with intelligent checkpoints and traffic guidance systems at selected sites.
KURA highlighted the integration of these systems with third-party systems and emphasized the importance of operation, maintenance, and technical support services. Transport Cabinet Secretary Kipchumba Murkomen disclosed plans to install 400 speed surveillance cameras across Nairobi roads, enforcing instant fines for violators. In our view, this initiative, along with the Intelligent Traffic System (ITS) will assist address traffic challenges exacerbated by reckless driving and inadequate traffic management infrastructure.
- Industrial Sector
During the week, the International Finance Corporation (IFC) announced its plans to lend Kshs 4.8 bn (USD 30.0 mn) to Bora Africa, a REIT-like investment vehicle focused on investing in industrial properties and real estate assets in Kenya and Africa. Bora Africa, is a special purpose vehicle of the Mauritian based firm Grit Real Estate Income Group and aims to utilize the IFC funds to expand its project pipeline, further enhancing its presence in the industrial real estate market on the continent
Established on October 24, 2023, Bora Africa specializes in industrial real estate, consolidating Grit-owned industrial assets such as Imperial, Bollore, Orbit, and two industrial land assets. Grit is currently in the process of transferring a 99.9% stake in Bora to its real estate development arm, Gateway Real Estate Africa Ltd (GREA). This strategic move aims to raise funds to finance Grit's share of a USD 100.0 mn shareholder cash call initiated by GREA, with GREA seeking to maintain a majority stake in Bora Africa.
Additionally, Grit disclosed that a subordinated hybrid note, amounting to approximately USD 16.9 mn, will be issued to IFC to fund Bora Africa's initial pipeline. Further discussions with IFC are underway for the issuance of an additional subordinated hybrid note worth approximately USD 13.1 mn. This financial arrangement underscores the IFC's continued support for Grit and its subsidiaries in Kenyan-linked investments.
The injection of funds into Bora Africa is expected to stimulate activities in the industrial Real Estate sector in Kenya, aligning with the government's efforts to enhance the export of agricultural and horticultural products. This development underscores the growing significance of industrial real estate investments in Kenya, driven by increasing demand for modern industrial facilities and infrastructure across various sectors.
- Regulated Real Estate Funds
- Real Estate Investments Trusts (REITs)
During the week, ILAM Fahari Income Real Estate Investment Trust (ILAM Fahari I-REIT or IFIR) through a public notice, announced it received approval from the Capital Markets Authority (CMA) to delist from the Main Investment Market Segment (MIMS) of the Nairobi Securities Exchange (NSE). The delisting, effective from Monday, February 12th, 2024, follows the resolution by Unitholders of ILAM Fahari to delist in November 2023. The last day of trading for the REIT is set on Friday, February 9th, 2024. Subsequently, ILAM Fahari initiated the process of applying to have its securities admitted for trading over the counter on the Unquoted Securities Platform (USP) of the NSE. ILAM Fahari I-REIT will join Acorn D-REIT and I-REIT on the USP for a period of three years, after which, should the strategic objectives of the operational restructuring be met, the REIT will reconsider the possibility of re-listing on the NSE.
Additionally, the Capital Markets Authority (CMA) licensed NCBA Bank Kenya PLC to become a Real Estate Investment Trust (REIT) trustee in Kenya. This accreditation, issued in line with the Capital Markets (REITs) (Collective Investment Schemes) Regulations 2013, and, the Capital Markets (Corporate Governance) (Market Intermediaries) Regulations 2011, underscores the CMA's commitment to supporting the National Government's Affordable Housing agenda through the stimulation of the Kenyan Real Estate capital markets. NCBA Bank now joins Housing Finance Company (Kenya) Limited, Co-operative Bank of Kenya Limited, and Kenya Commercial Bank Limited in the list of REIT trustees in Kenya.
With NCBA Bank now authorized to act as a REIT trustee, it can play a crucial role in facilitating financing for real estate projects, including those aimed at providing affordable housing. This increased access to financing can help developers undertake housing projects that cater to low and middle-income earners, aligning with the government's agenda of increasing homeownership and addressing the 80.0% housing deficit.
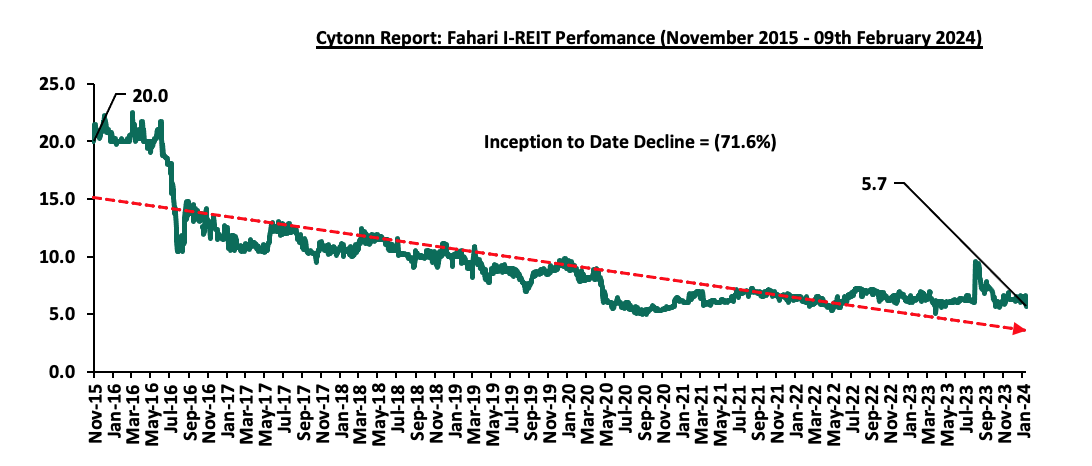
In the Nairobi Securities Exchange, ILAM Fahari I-REIT closed the week trading at an average price of Kshs 5.7 per share. The performance represents a 6.0% decline from Kshs 6.0 per share recorded last week. The performance represents a 9.8% Year-to-Date (YTD) loss from Kshs 6.3 per share recorded on 2nd January 2024, taking it to a 71.6% Inception-to-Date (ITD) loss from the Kshs 20.0 price. The dividend yield currently stands at 11.4%. The graph below shows Fahari I-REIT’s performance from November 2015 to 9th February 2024;
In the Unquoted Securities Platform, Acorn D-REIT and I-REIT traded at Kshs 24.4 and Kshs 21.7 per unit, respectively, as of 9th February 2024. The performance represented a 22.0% and 8.3% gain for the D-REIT and I-REIT, respectively, from the Kshs 20.0 inception price. The volumes traded for the D-REIT and I-REIT came in at 12.3 mn and 30.7 mn shares, respectively, with a turnover of Kshs 257.5 mn and Kshs 633.8 mn, respectively, since inception in February 2021.
REITs provide various benefits like tax exemptions, diversified portfolios, and stable long-term profits. However, the continuous deterioration in performance of the Kenyan REITs and restructuring of their business portfolio is hampering major investments that had previously been made. The other general challenges include; i) inadequate comprehension of the investment instrument among investors, ii) prolonged approval processes for REITs creation, iii) high minimum capital requirements of Kshs 100.0 mn for trustees, and, iv) minimum investment amounts set at Kshs 5.0 mn, continue to limit the performance of the Kenyan REITs market.
- Cytonn High Yield Fund (CHYF)
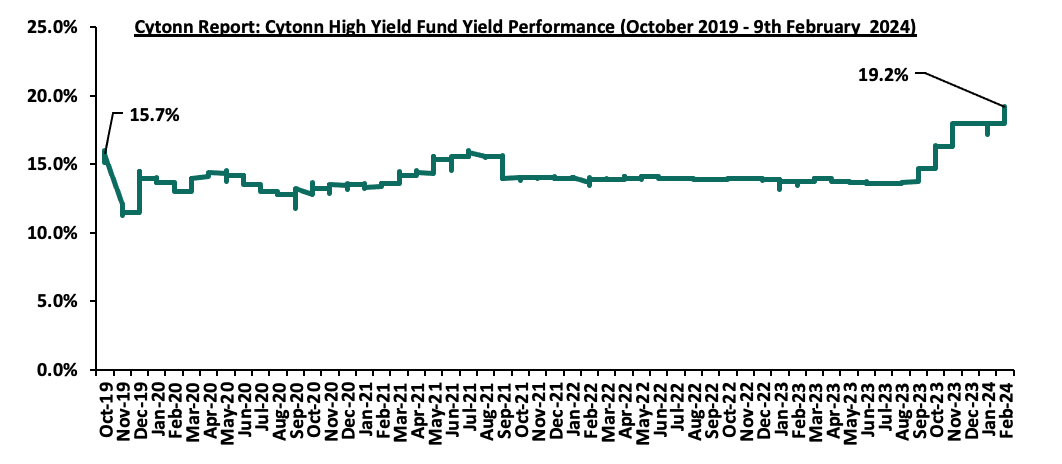
Cytonn High Yield Fund (CHYF) closed the week with an annualized yield of 19.2%, representing 1.2% points increase from the 18.0% recorded the previous week. On a Year-to-Date (YTD) basis, the performance represents a 1.2% increase from the 18.0% yield recorded on 1st January 2024 and a 3.5% Inception-to-Date (ITD) increase from the 15.7% yield. The graph below shows Cytonn High Yield Fund’s performance from November 2019 to 9th February 2024;
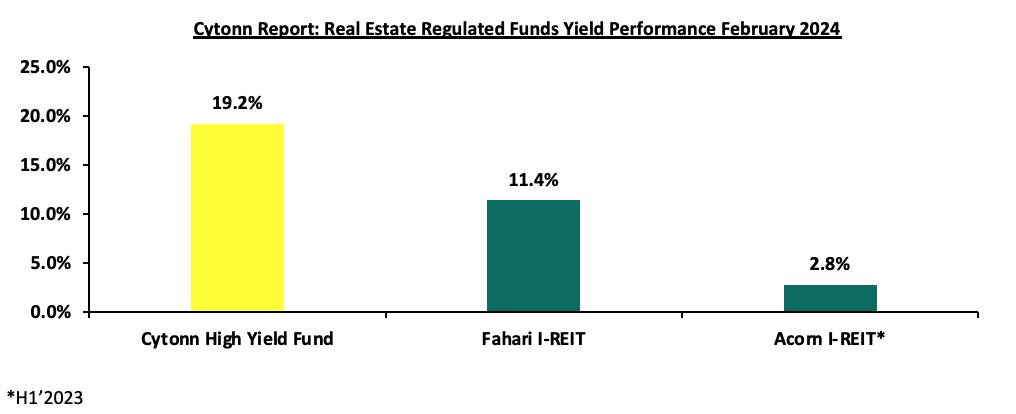
Notably, the CHYF has outperformed other regulated Real Estate funds with an annualized yield of 19.2%, as compared to Fahari I-REIT and Acorn I-REIT with yields of 11.4%, and 2.8% respectively. As such, the higher yields offered by CHYF makes the fund one of the best alternative investment resource in the Real Estate sector. The graph below shows the yield performance of the Regulated Real Estate Funds;
Source: Cytonn Research
We expect the performance of Kenya’s Real Estate sector will be supported by; i) increased initiations and development of affordable housing projects expected to boost the residential sector, ii) relatively positive demographics in the country necessitating the demand for housing and Real Estate, and, iii) continued infrastructural improvements opening up new areas for investments. However, factors such as rising costs of construction, limited investor knowledge in REITs, and, existing oversupply in select Real Estate sectors will continue to hinder optimal performance of the sector by limiting developments and investments.
Disclaimer: The views expressed in this publication are those of the writers where particulars are not warranted. This publication, which is in compliance with Section 2 of the Capital Markets Authority Act Cap 485A, is meant for general information only and is not a warranty, representation, advice or solicitation of any nature. Readers are advised in all circumstances to seek the advice of a registered investment advisor

