Cytonn Annual Markets Review 2023
By Cytonn Research, Dec 31, 2023
Executive Summary
Global Markets Review
According to the October 2023 World Economic Outlook Report by the International Monetary Fund (IMF), the global economy is projected to grow at a rate of 3.0% in 2023, 0.5% points lower than the 3.5% growth recorded in 2022 and 0.9% points higher than the World Bank's earlier projection in June 2023. The expected slowdown in the Global economy’s growth is majorly attributable to the persistent inflationary pressures attributed to the high global fuel and energy prices experienced through most of the year. In line with this, most economies have continued to tighten their monetary policies in their efforts to fight inflation with the global headline inflation being expected to fall to 6.9% in 2023 from the 8.7% recorded in 2022. Notably, advanced economies continue to drive the decline in growth in 2023, with expected growth of 1.5% in 2023, a decline from the 2.6% growth in 2022. Moreover, the growth in the Emerging Markets and Developing Economies is expected to expand by 4.0% in 2023, 0.1%-points decline from the estimated growth of 4.1% in 2022;
Sub-Saharan Africa Region Review
According to the International Monetary Fund (IMF), the Sub-Saharan African economy is projected to grow at a rate of 3.3% in 2023, a 0.7% points decline from a growth of 4.0% recorded in 2022. Notably, the projection was revised downwards from the earlier forecast of 3.5% in July 2023 by the IMF. The downward revision of the regional growth by the IMF is mainly on the back of the continued depreciation of most currencies against the dollar, weak external demand, tight global financial conditions, and high inflationary pressures in most countries in the region. Additionally, public debt is expected to remain high due to increased debt-serving costs as a result of continued currency depreciation and increased interest rates in developed economies;
During the year, all select Sub-Saharan African currencies depreciated against the U.S Dollar, with the Nigerian Naira being the largest decliner in 2023, largely attributable to the adoption of a floating exchange rate regime in the country. Also, the region’s appetite for foreign-denominated Eurobonds remained muted, there being no issuer during the year. Additionally, Sub-Saharan Africa (SSA) stock markets recorded mixed performance in 2023, with the Zambia Stock Exchange (LASILZ) being the largest gainer with a 5.3% gain in 2023 due to gains in the financial as well as mining sectors of the economy;
Kenya Macro Economic Review
The Kenyan economy recorded an average growth of 5.5% in the period between January to September 2023, with Q3’2023 GDP coming in at 5.9%, adding to the 5.4% growth recorded in Q2’2023. The average GDP growth of 5.5% marked a slight decline from the 5.6% average growth recorded in a similar period in 2022. The performance in Q3’2023 was mainly driven by the 6.7% growth in the agricultural sector due to the favourable weather conditions, which led to more agricultural output as evidenced by the 28.0% increase in tea output to 138.8 thousand metric tonnes coupled with the 84.3% growth in fruit exports to 59.6 thousand metric tonnes in the quarter under review. All sectors in Q3’2023 recorded positive growths, with varying magnitudes across activities. Most sectors recorded improved growth compared to Q3’2022 with Accommodation and Food Services, Agriculture, Forestry and Fishing, and Mining and Quarrying Sectors recording the highest growth improvements of 9.1% points, 8.0% points, and 5.6% points, respectively. Other sectors that recorded expansion in growth rate, from what was recorded in Q3’2022 were Financial and Insurance Services, Information and Communication, and Real Estate sectors, of 5.1%, 2.7%, and 2.2% points respectively;
In 2023, the Kenyan economy is projected to grow at an average of 5.2%, higher than the 4.8% growth observed in 2022. The faster growth is mainly attributable to a rebound in the agricultural sector following the sufficient long rains that have been experienced in the country, coupled with recent fiscal policies such as subsidizing the costs of crucial farm inputs such as fertilizers that have enhanced agricultural output;
Fixed Income
During the year, T-bills were oversubscribed, with the overall subscription rate coming in at 120.0%, up from 94.9% in FY’2022. Investors’ preference for the 91-day paper persisted as they sought to avoid duration risk, with the paper receiving bids worth Kshs 1,100.5 bn against the offered Kshs 208.0 bn, translating to an oversubscription rate of 529.1%, higher than the oversubscription rate of 226.9% recorded in FY’2022. Overall subscription rates for the 364-day and 182-day papers came in at 29.0% and 48.5%, lower than the 69.7% and 67.2%, respectively, recorded in FY’2022. The average yields on the 364-day, 182-day, and 91-day papers were on an upward trajectory with the 91-day yields increasing the most by 409.2 bps to 12.3%, from 8.2% in 2022 while the 182-day and 364-day increased by 348.9 bps and 293.4 bps to 12.5% and 12.8% in 2023, from 9.0% and 9.9% in 2022, respectively. Likewise, on y/y basis, the yields on the government papers registered significant growth in 2023 with the 91-day paper increasing the most by 661.4 bps to close the year at 16.0% from the 9.4% recorded at the close of FY’2022. The yields on the 182-day and 364-day increased by 613.3 bps and 579.2 bps to close the year at 16.0% and 16.1%, from the 9.8% and 10.3%, respectively, recorded at the end of FY’2022. The upward trajectory in yields is mainly on the back of investors attaching higher risks amid high inflation, currency depreciation, and tight liquidity positions, hence the need for higher returns to cushion against the possible loss. The average acceptance rate during the period came in at 92.5%, albeit higher than the 89.3% recorded in FY’2022, with the government accepting a total of Kshs 1,385.9 bn out of the Kshs 1,497.7 bn worth of bids received;
Both the short term and long-term government papers were oversubscribed, with the average subscription rate for T-bills and T-bonds coming in at 120.0% and 117.8%, from the 94.9% and 98.8% subscription rates recorded in 2022, respectively. The oversubscription was partly attributable to the increased yields on the government papers during the year with all government papers registering an increase in their yields;
During the week, T-bills were undersubscribed, for the third consecutive week, with the overall subscription rate dropping significantly to 43.8%, down from the 86.8% recorded the previous week, partly attributable to the tightened liquidity in the money market with the average interbank rate increasing to 13.9% from 12.2% recorded the previous week. Investors’ preference for the shorter 91-day paper persisted as they sought to avoid duration risk, with the paper receiving bids worth Kshs 8.5 bn against the offered Kshs 4.0 bn, translating to an oversubscription rate of 212.9%, albeit lower than the oversubscription rate of 415.9% recorded the previous week. The subscription rates for the 364-day and the 182-day papers also declined, with the 182-day paper decreasing the most to 3.2% from 22.9% and the 364-day paper decreasing to 16.6% from 19.2%, recorded the previous week. The government accepted a total of Kshs 9.0 bn worth of bids out of Kshs 10.5 bn of bids received, translating to an acceptance rate of 85.4%. The yields on the government papers recorded a mixed performance with the yields on the 364-day and 91-day papers increasing by 19.9 bps and 10.0 bps to 16.1% and 16.0% respectively, while the 182-day paper decreased by 0.5 bps to 16.0%;
During the week, the Kenya National Bureau of Statistics (KNBS) released the year-on-year inflation highlighting that the inflation in the month of December 2023 decreased by 0.2% points to 6.6%, from the 6.8% recorded in November 2023. This was well in line with our projections to within a range of 6.6% to 6.8%;
During the week, the Kenya National Bureau of Statistics (KNBS) released the Q3'2023 Quarterly Gross Domestic Product Report, highlighting that the Kenyan economy recorded a 5.9% growth in Q3’2023, faster than the 4.3% growth recorded in Q3’2022. The main contributor to Kenyan GDP remains to be the Agriculture, fishing and forestry sector which grew by 6.7% in Q3’2023 compared to a contraction of 1.3% in Q3’2022. All sectors in Q3’2023 recorded positive growths, with varying magnitudes across activities. Most sectors recorded improved growth compared to Q3’2022 with Accommodation and Food Services, Agriculture, Forestry and Fishing and Mining and Quarrying Sectors recording the highest growth improvements of 9.1% points, 8.0% points, and 5.6% points, respectively. Other sectors that recorded expansion in growth rate, from what was recorded in Q3’2022 were Financial and Insurance Services, Information and Communication and Real Estate sectors, of 5.1%, 2.7% and 2.2% points respectively;
During the week, the Kenya National Bureau of Statistics released the Quarterly Balance of Payment Report for Q3’2023 highlighting that Kenya’s balance of payments position deteriorated registering a deficit of Kshs 131.5 bn in Q3’2023, from a deficit of Kshs 112.7 bn recorded in Q3’2022, and a reversal from the Kshs 152.9 bn surplus recorded in Q2’2023;
During the month, Ethiopia became the third African country to default on its international government debt after the COVID-19 pandemic, joining Zambia and Ghana in the region, with the 14-day grace period for the USD 33.0 mn first repayment ending on December 25th;
Equities
During the year, the Kenyan equities market was on a downward trajectory, with NASI, NSE 20 and NSE 25 declining by 27.7%, 10.4% and 24.2%, respectively. The equities market performance was driven by losses recorded by large-cap stocks such as KCB Group, Safaricom, EABL, Equity Group, Diamond Trust Bank Kenya, Absa Bank, and Co-operative Bank Kenya of 42.9%, 42.2%, 32.9%, 25.3%, 9.6%, 6.1%, and 5.8% respectively. The performance was, however, supported by gains by large-cap stocks such as Bamburi Cement, Standard Chartered Bank, and Stanbic Bank of 14.0%, 11.7%, and 6.6%. In the banking sector, the Kenya listed banks recorded a weighted average increase in the core earnings per share of 11.2% in Q3’2023, compared to a weighted average increase of 36.3% in Q3’2022, while in the Insurance sector, the listed insurers recorded a weighted average increase in core earnings per share of 19.8% in H1’2023, compared to a weighted average increase of 16.0% in H1’2022. During the year, 15 companies issued profit warnings, as compared to 11 companies in 2022, and 4 companies in 2021 an indication that the operating environment became increasingly difficult in 2023 compared to the previous years. Some of the companies in the financial services sector that issued profit warnings include Centum Group Plc and Sanlam Kenya Plc. Additionally, during the year, the Nairobi Securities Exchange officially listed the Local Authority Pension Trust (LAPTRUST) Imara Income Real Estate Investment Trust (I-REIT) on the Nairobi Securities Exchange (NSE) under the Restricted Sub-Segment after approval by the Capital Markets Authority last year. The NSE also launched two new indices, the NSE 10 share index and the NSE Bond Index. Four companies remained suspended at the Nairobi Securities Exchange, namely, Deacons (East Africa) PLC, ARM Cement PLC, Mumias Sugar Co. Ltd. and Kenya Airways;
Real Estate
In 2023, the general Real Estate sector witnessed considerable growth in activity in terms of property transactions and development activities. Consequently, the sector’s activity contribution to GDP grew by 5.4% to Kshs 785.9 bn in Q3’2023, from Kshs 743.4 bn recorded during the same period in 2022. In addition, the sector contributed 10.5% to the country’s GDP, a 0.5% increase from 10.0% recorded in Q2’2023. Cumulatively, the Real Estate and construction sectors contributed 16.6% to GDP, a 1.1% improvement from 15.5% in Q2’2023, evidencing their growing contribution to Kenya's economy. Additionally, the escalation of selling and rental prices persisted, propelled by ongoing inflationary pressures and a depreciated shilling against the United States dollar, leading to an increase in the costs of construction materials. In terms of performance, the Nairobi Metropolitan Area (NMA) Residential, Commercial Office, Retail, Hospitality, and Mixed-Use Development sectors realized average rental yields of 6.1%, 7.7%, 8.3%, 6.8%, and 8.4%, respectively. This resulted to an average rental yield for the Real Estate market of 7.5%, 0.7% points higher than the 6.8% recorded in 2022;
In statutory reviews, Nairobi City County Government announced that the new valuation scheme for land rates payment within the county will come into effect in January 2024. This comes more than a year after the county issued a notice in November 2022, highlighting the increment of land rates to 0.115% of the current value of undeveloped land;
In the Regulated Real Estate Funds, under the Real Estate Investments Trusts (REITs) segment, Acorn Student Accommodation Development REIT (ASA D-REIT) announced it had sold its latest stabilized asset, Qwetu Aberdare Heights II, to the Acorn Student Accommodation Income REIT (ASA I-REIT) in a Kshs 1.5 bn deal. In the Nairobi Securities Exchange, Fahari I-REIT closed the week trading at an average price of Kshs 6.3 per share remaining relatively unchanged from the previous week;
On the Unquoted Securities Platform, as at 1st December 2023, Acorn D-REIT and I-REIT closed the week trading at Kshs 25.3 and Kshs 21.7 per unit, a 26.6% and 8.3% gain for the D-REIT and I-REIT, respectively, from the Kshs 20.0 inception price. In addition, Cytonn High Yield Fund (CHYF) closed the week with an annualized yield of 18.0%, remaining relatively unchanged from the previous week;
Investment Updates:
- Weekly Rates:
- Cytonn Money Market Fund closed the week at a yield of 15.45% p.a To invest, dial *809# or download the Cytonn App from Google Playstore here or from the Appstore here;
- Cytonn High Yield Fund closed the week at a yield of 17.95% p.a. To invest, email us at sales@cytonn.com and to withdraw the interest, dial *809# or download the Cytonn App from Google Playstore here or from the Appstore here;
- We continue to offer Wealth Management Training every Monday, from 9:00 am to 11:00 am. The training aims to grow financial literacy among the general public. To register for any of our Wealth Management Trainings, click here;
- If interested in our Private Wealth Management Training for your employees or investment group, please get in touch with us through wmt@cytonn.com;
- Cytonn Insurance Agency acts as an intermediary for those looking to secure their assets and loved ones’ future through insurance namely; Motor, Medical, Life, Property, WIBA, Credit and Fire and Burglary insurance covers. For assistance, get in touch with us through insuranceagency@cytonn.com;
- Cytonn Asset Managers Limited (CAML) continues to offer pension products to meet the needs of both individual clients who want to save for their retirement during their working years and Institutional clients that want to contribute on behalf of their employees to help them build their retirement pot. To more about our pension schemes, kindly get in touch with us through pensions@cytonn.com;
Real Estate Updates:
- For more information on Cytonn’s real estate developments, email us at sales@cytonn.com;
- Phase 3 of The Alma is now ready for occupation and the show house is open daily. To join the waiting list to rent, please email properties@cytonn.com;
- For Third Party Real Estate Consultancy Services, email us at rdo@cytonn.com;
- For recent news about the group, see our news section here;
Hospitality Updates:
- We currently have promotions for Staycations. Visit cysuites.com/offers for details or email us at sales@cysuites.com;
Global Economic Growth:
According to the October 2023 World Economic Outlook Report by the International Monetary Fund (IMF), the global economy is projected to grow at a rate of 3.0% in 2023, 0.5% points lower than the 3.5% growth recorded in 2022 and 0.9% points higher than the World Bank's earlier projection in June 2023. The expected slowdown in the Global economy’s growth is majorly attributable to the persistent inflationary pressures attributed to the high global fuel and energy prices experienced through most of the year. In line with this, most economies have continued to tighten their monetary policies in their efforts to fight inflation with the global headline inflation being expected to fall to 6.9% in 2023 from the 8.7% recorded in 2022. Notably, advanced economies continue to drive the decline in growth in 2023, with expected growth of 1.5% in 2023, a decline from the 2.6% growth in 2022. Moreover, the growth in the Emerging Markets and Developing Economies is expected to expand by 4.0% in 2023, a 0.1%-points decline from the estimated growth of 4.1% in 2022. The expected slowed down in global economic growth in 2023 as compared to 2022 is majorly attributable to;
- The elevated global inflationary pressures which have necessitated the hiking of interest rates by central banks around the world with the aim of anchoring inflation. As such, the global inflation is forecasted to ease slightly to 6.9% in 2023, from 8.7% in 2022,
- Tight global financial conditions occasioned by high cost of borrowing which have increased risks of debt distress in emerging economies as most advanced economies continue to tighten their monetary policies, and,
- Persistent supply chain constraints worsened by the ongoing Russia-Ukraine conflict which has impacted global fuel and food prices. Consequently, the high energy prices have increased inflationary pressures as well as contributed to currency depreciation as dollar demand increases especially in Emerging Markets and Developing Economies.
The global economy is expected to remain subdued in the short term mainly as a result of persistent inflationary pressures as well as tightening of monetary policies which are expected to weigh down on economic activity. Furthermore, the global economy’s future performance is majorly dependent on how soon the inflationary pressures will ease, which will see central banks ease their monetary policies hence boosting economic activity.
Global Commodities Market Performance:
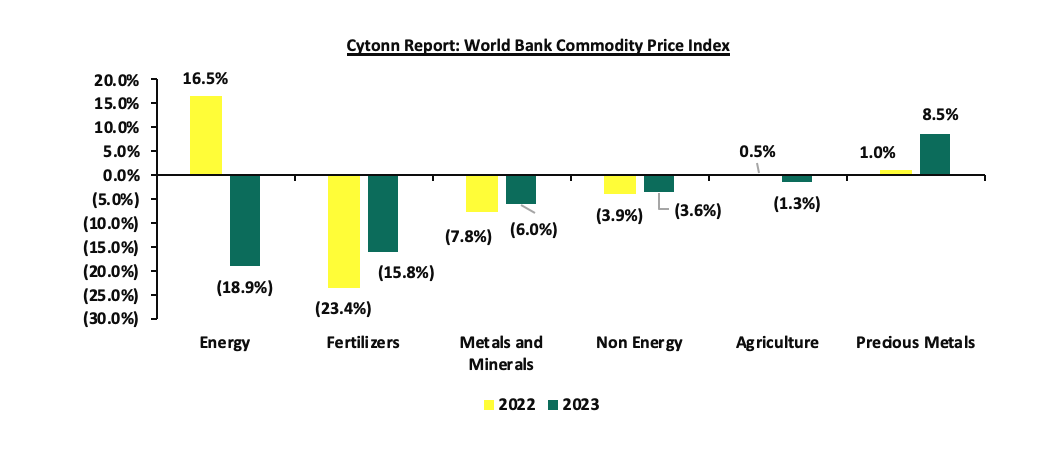
Global commodity prices recorded mixed performance in 2023, with prices of energy decreasing the most by 18.9% compared to the 16.5% increase recorded in 2022, mainly as a result of slowed global demand on the back of the easing supply chain constraints which had been worsened by the Russia-Ukraine conflict. Similarly, prices of fertilizers decreased by 15.8% in 2023, compared to 23.4% in a similar period last year, while prices of metals and minerals, Non- energy and agriculture declined by 6.0%, 3.6%, and 1.3% respectively, on the back of reduced global demand coupled with easing supply chain constraints. The chart below shows a summary of the performance of various commodities.
Global Equities Market Performance:
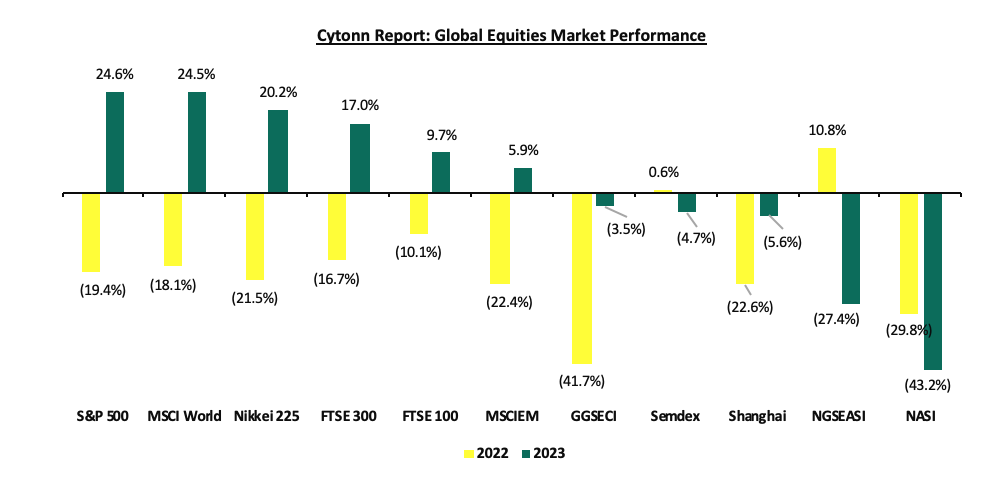
The global stock market recorded mixed performance in 2023, with most indices in the Sub-Saharan Africa declining attributable to capital outflows from equities market to the fixed income docket mainly on the back of elevated inflationary pressures which has led to increased interest rates. The S&P 500 was the largest gainer, recording a 24.6% gain, a reversal from the 19.4% decline in 2022, largely driven by increased investor sentiments following the relatively stable USA economy as well as the appreciation of the US dollar against other global currencies. Notably, stocks in the technology segment recorded significant gains mainly attributable to the well-established market dominance across the world with stocks such as Amazon, Microsoft and Apple gaining by 78.7%, 56.6% and 54.9% respectively on YTD basis. On the other hand, NASI was the largest decliner recording losses of 43.2%, mainly due to the increased capital flight as foreign investors withdrew from the Kenyan equities market on the back of deteriorated business environment. Additionally, investors have continued to attach higher risk premium to the country as a result of the inflationary pressures coupled with the sustained depreciation of the Kenyan shilling against the dollar so far having depreciated by 26.8% on year to date basis in 2023. Moreover, the tightening of the monetary policy in Kenya has seen interest rates rise thus attracting investors to the other alternatives such as government securities.
According to the International Monetary Fund (IMF), the Sub-Saharan African economy is projected to grow at a rate of 3.3% in 2023, a 0.7% points decline from a growth of 4.0% recorded in 2022. Notably, the projection was revised downwards from the earlier forecast of 3.5% in July 2023 by the IMF. The downward revision of the regional growth by the IMF is mainly on the back of the continued depreciation of most currencies against the dollar, weak external demand, tight global financial conditions and high inflationary pressures in most countries in the region. Additionally, public debt is expected to remain high due to increased debt serving costs as a result of continued currency depreciation and increased interest rates in developed economies. The decline in the region’s economic growth is attributable to;
- The heightened inflationary pressures following the Russia-Ukraine conflict which has prompted higher interest rates worldwide leading to slowing international demand, elevated spreads, and ongoing exchange rate pressures,
- Rising risk of debt distress in the region is expected to weigh down on the region’s growth due to increased debt-serving costs as a result of continued currency depreciation and increased interest rates in developed economies, and,
- High interest rates in developed economies such as the United States of America (USA) have led to a decline in foreign capital in the region further fuelling the economic decline in the SSA.
Currency Performance
In 2023, all select Sub-Saharan African currencies depreciated against the U.S Dollar, mainly on the back of the deteriorated business environment occasioned by the elevated inflationary pressures in the region, high debt servicing costs that continue to dwindle foreign exchange reserves, coupled with monetary policy tightening by advanced economies. The high interest rates in developed countries has led to massive capital outflows in SSA as investors seek to take advantage of the higher returns offered in developed economies. Further, the high cost of importation in the region continue to put pressure on the local currencies. The table below shows the performance of select African currencies against the USD;
|
Cytonn Report: Select Sub-Saharan Africa Currency Performance vs USD |
|||||
|
Currency |
Dec-21 |
Dec-22 |
Dec 23 |
2022 y/y change (%) |
2023 y/y change (%) |
|
Nigerian Naira |
413.0 |
447.1 |
896.6 |
(8.3%) |
(100.5%) |
|
Malawian kwacha |
816.4 |
1,026.4 |
1,689.7 |
(25.7%) |
(64.6%) |
|
Zambian Kwacha |
16.7 |
18.1 |
25.8 |
(8.4%) |
(42.4%) |
|
Ghanaian Cedi |
6.0 |
8.6 |
11.96 |
(43.3%) |
(39.1%) |
|
Kenyan Shilling |
113.1 |
123.4 |
156.5 |
(9.1%) |
(26.8%) |
|
South African Rand |
15.9 |
16.9 |
18.5 |
(6.3%) |
(9.5%) |
|
Tanzanian Shilling |
2,297.8 |
2,308.9 |
2,510.0 |
(0.5%) |
(8.7%) |
|
Botswana Pula |
11.7 |
12.8 |
13.4 |
(9.4%) |
(5.0%) |
|
Senegal CFA Franc |
577.0 |
615.0 |
592.1 |
(6.6%) |
(3.7%) |
|
Ugandan Shilling |
3,544.7 |
3,717.5 |
3,783.9 |
(4.9%) |
(1.8%) |
|
Mauritius Rupee |
43.5 |
43.9 |
44.0 |
(0.9%) |
(0.1%) |
Key take outs from the table include:
- The Nigerian Naira was the worst performer during the year, depreciating by 100.5% against the dollar, attributable to the deteriorated macroeconomic environment, evidenced by its elevated inflation, with November 2023 inflation rate coming in at a record of 28.2%, coupled with the tightened monetary policy as Nigeria’s interest rates were hiked to 18.8% in July 2023. Further, the recent decision by the Central Bank of Nigeria to adopt floating exchange rate regime, where the currency value of the Naira is allowed to vary according to the foreign exchange market hence making the overvalued naira to undergo a massive devaluation, broadly aligning the currency with its black-market rate,
- The Mauritius Rupee depreciated the least against the dollar, having depreciated by only 0.1% in 2023, mainly attributable to positive investor confidence following Mauritius’ improved macroeconomic performance following the expansion of the Mauritius economy by 6.0% as of Q2’2023, easing inflation rate with the November inflation coming in at 4.0% and the relatively stable foreign reserves in the country equivalent to over ten months of import cover, and,
- The Kenya Shilling depreciated by 26.8% in 2023 to close at Kshs 156.5 against the US Dollar, compared to Kshs 123.4 recorded at the beginning of the year, driven by increased dollar demand from importers, especially oil and energy sectors, the ever-present current account deficit and the need for government debt servicing which has continued to put pressure on the country’s forex reserves.
African Eurobonds:
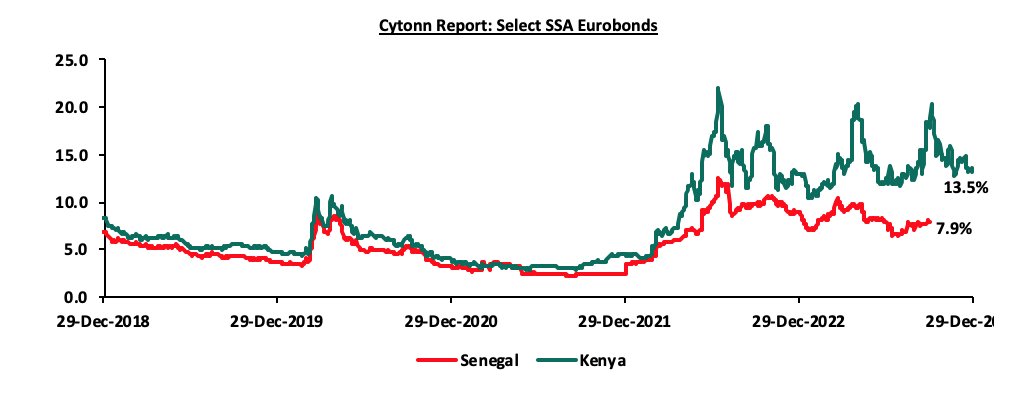
In 2023, most countries were not able to access the Eurobonds market because of the high and persistent interest rates and the difficult economic environment in the region. The main reason for the rise in interest rates was that investors attached high risk premium in the region following the elevated inflation, debt sustainability concerns, and weakening local currencies in the region. Yields on the Senegal Eurobond remained elevated despite recording marginal decline of 0.9% points as of the end Q3’2023 to 8.0% from 8.9% recorded at the end of 2022. On the other hand, the yield on Kenya’s Eurobond increased marginally by 0.6% points to 13.5% at the end of 2023, up from 12.9% recorded at the end of the previous year, on the back of debt sustainability concerns ahead of the 2024 bond maturity, coupled with the elevated credit risk as evidenced by the downgrade of Kenya’s long-term foreign currency and local-currency issuer ratings and senior unsecured debt ratings to B3 from B2 with a negative outlook by Moody’s Credit Rating Agency. Below is a 5-year graph showing the Eurobond secondary market performance of select 10-year Eurobonds issued by the respective countries.
Equities Market Performance:
Sub-Saharan Africa (SSA) stock markets recorded mixed performance in 2023, with the Zambia Stock Exchange (LASILZ) being best performing market gaining by 5.3% largely driven by the gains in the financial as well as energy sectors coupled with increased copper exports to countries such as China, Switzerland and Singapore driving the country’s growth prospects. In addition, the improved macroeconomic environment supported by the IMF financial assistance has continued to accelerate investor confidence in the country. Notably, Nigeria all share index declined by 25.3% in 2023, a reversal from the 7.6% gain recorded in 2022 due to the aggressive depreciation of the Nigerian Naira against the dollar having depreciated by 100.5% in 2023 which has resulted to increased capital outflows in the country. Additionally, the reduction in oil production in Nigeria has led to the contraction of many key sectors of the economy considering that the country’s economy is highly dependent on crude oil exports. Below is a summary of the performance of the key SSA indices;
|
Cytonn Report: Equities Market Performance |
||||||
|
Country |
Index |
Dec-21 |
Dec-22 |
Dec-23 |
2022 y/y change (%) |
2023 y/y change (%) |
|
Zambia |
LASILZ |
364.7 |
406.9 |
428.7 |
11.6% |
5.3% |
|
Ghana |
GSECI |
465.6 |
271.5 |
262.2 |
(41.7%) |
(3.4%) |
|
South Africa |
JALSH |
4,618.3 |
4,292.8 |
4,038.5 |
(7.0%) |
(5.9%) |
|
Tanzania |
DARSDEI |
0.8 |
0.8 |
0.7 |
(1.9%) |
(13.2%) |
|
Rwanda |
RSEASI |
0.1 |
0.1 |
0.1 |
(4.6%) |
(17.2%) |
|
Uganda |
USEASI |
0.4 |
0.3 |
0.2 |
(25.0%) |
(23.1%) |
|
Nigeria |
NGEASI |
103.5 |
111.4 |
83.2 |
7.6% |
(25.3%) |
|
Kenya |
NASI |
1.5 |
1.0 |
0.6 |
(31.1%) |
(43.2%) |
|
*The index values are dollarized for ease of comparison |
||||||
The tough macroeconomic environment experienced in the region is expected to slow down economic growth. As such, subdued GDP growth rate in Sub-Saharan Africa is expected to continue in 2024, in line with the rest of the global economy. Elevated inflation rates, debt sustainability concerns, and supply chain constraints in the region are expected to persist in 2024, and this will continue to weigh down its economic growth. Additionally, the continued weakening of local currencies will even make debt servicing costlier, and this will lead to increased perceived risks in the region, resulting in reduced investor confidence in the region.
Economic Growth
The Kenyan economy recorded an average growth of 5.5% in the period between January to September 2023, with Q3’2023 GDP coming in at 5.9%, adding to the 5.4% growth recorded in Q2’2023. The average GDP growth of 5.5% marked a slight decline from the 5.6% average growth recorded in a similar period in 2022. The performance in Q3’2023 was mainly driven by the 6.7% growth in the agricultural sector due to the favourable weather conditions, which led to more agricultural output as evidenced by the 28.0% increase in tea output to 138.8 thousand metric tonnes coupled with the 84.3% growth in fruit exports to 59.6 thousand metric tonnes in the quarter under review. All sectors in Q3’2023 recorded positive growths, with varying magnitudes across activities. Most sectors recorded improved growth compared to Q3’2022 with Accommodation and Food Services, Agriculture, Forestry and Fishing, and Mining and Quarrying Sectors recording the highest growth improvements of 9.1% points, 8.0% points, and 5.6% points, respectively. Other sectors that recorded expansion in growth rate, from what was recorded in Q3’2022 were Financial and Insurance Services, Information and Communication, and Real Estate sectors, of 5.1%, 2.7%, and 2.2% points respectively.
In 2023, the Kenyan economy is projected to grow at an average of 5.3%, higher than the 4.8% growth observed in 2022. The faster growth is mainly attributable to a rebound in the agricultural sector following the sufficient long rains that have been experienced in the country, coupled with recent fiscal policies such as subsidizing the costs of crucial farm inputs such as fertilizers that have enhanced agricultural output. The table below shows the projections of Kenya’s 2023 GDP by various organizations:
|
Cytonn Report: Kenya 2023 growth Projections |
||
|
No. |
Organization |
2023 GDP Projections |
|
1 |
International Monetary Fund |
5.1% |
|
2 |
National Treasury |
6.1% |
|
3 |
World Bank |
5.0% |
|
4 |
Fitch Solutions |
5.1% |
|
5 |
Cytonn Investments Management PLC |
5.1% |
|
Average |
5.3% |
|
Source: Cytonn Research, 2023
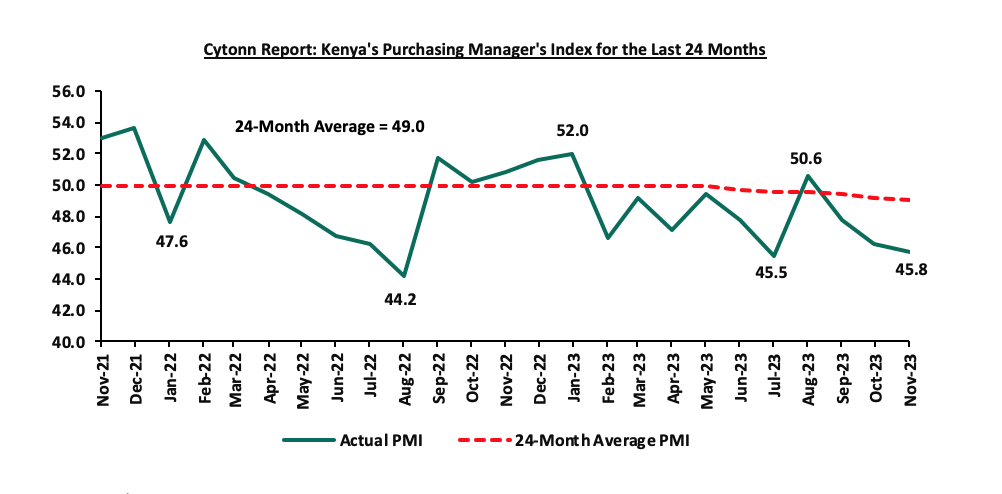
Business conditions in the Kenyan private sector remained subdued during the year, with the average Stanbic Bank Monthly Purchasing Managers’ Index (PMI) for the first eleven months averaging at 48.0, 1.0 points lower than the average of 49.0 recorded during a similar period in 2022 indicating a deterioration of the country’s business environment in 2023 compared to 2022. Similarly, PMI for the month of November 2023 came in at 45.8, down from 46.2 in October 2023 signalling a stronger downturn of the business environment for the third consecutive month. The agricultural sector, the manufacturing, wholesale, and retail sectors’ output, and new orders declined at a faster rate compared to October, as firms adjusted to reduced demand by cutting their workforce, resulting in the highest rate of workforce cut, with higher rates only registered during the first COVID-19 lockdown. The chart below shows the trend of Kenya’s Purchasing Managers index for the last 24 months;
Source: Stanbic PMI
Kenyan Shilling
The Kenya Shilling depreciated by 26.8% against the US Dollar to close at Kshs 156.5 in 2023, compared to Kshs 123.4 at the end of 2022, adding to adding to the 9.0% depreciation recorded in 2022. The chart below highlights the performance of the Kenyan Shilling against the US Dollar in 2023;
IMAGE 5 KSH VS USD
Source: Central Bank of Kenya
The depreciation of the Kenyan shilling in 2023 was driven by;
- Increased dollar demand by importers especially in the oil and energy sector, as well as manufacturers against a low supply of dollar currency leading to shortage of USD in the Kenyan market,
- An ever-present current account deficit which came at 3.5% of GDP in Q3’2023 from 6.4% recorded in a similar period last year. Key to note, the current account deficit narrowed by 42.1% to Kshs 122.5 bn in Q3’2023 from the Kshs 211.6 bn deficit recorded in Q3’2022. The performance was mainly driven by the contraction of the merchandise trade account deficit by 12.6% to Kshs 326.2 bn in Q3’2023, from Kshs 373.1 bn recorded in Q3’2022, coupled with a 35.2% improvement in the secondary income (transfer) balance to a to a surplus of Kshs 251.9 bn from a surplus of Kshs 186.3 bn in Q3’2022,
- The need for Government debt servicing which continues to put pressure on forex reserves given that 67.1% of Kenya’s external debt was US Dollar denominated as of June 2023,
- A continued hike in the USA Federal interest rates, with the Fed raising the rates by 100 bps in 2023 from a range of 4.25%-4.50% in December 2022 to a rage of 5.25%-5.50% in July 2023. The hike in rates meant to curb inflation in the US has strengthened the dollar against other currencies resulting in capital outflows from emerging and developing markets such as Kenya, and,
- Dwindling forex reserves closing the year at USD 6.7 bn (equivalent to 3.6 months of import cover), which is below the statutory requirement of maintaining at least 4.0-months of import cover. Notably, Kenya’s forex reserves have declined by 9.8% on a year-to-date basis from USD 7.4 bn recorded in January 2023 to USD 6.7 bn as of December 2023. The following is a graph showing Kenya months of import cover and forex reserves for the last 10 years;
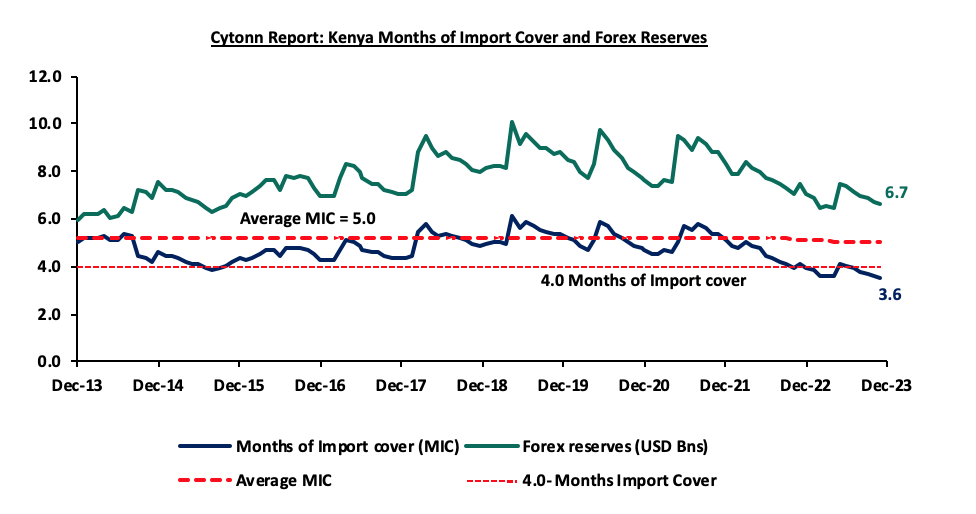
Source: Central Bank of Kenya
The shilling received some support driven by:
- Improved diaspora remittances standing at a cumulative USD 3,817.4 mn as of November 2023, 4.0% higher than the USD 3,670.6 mn recorded over the same period in 2022, which has continued to cushion the shilling against further depreciation. In the November 2023 diaspora remittances figures, North America remained the largest source of remittances to Kenya accounting for 57.2% in the period,
- Foreign loan disbursements, with the government receiving USD 1.0 bn from the World Bank under the Development Policy Operation (DPO) facility in May 2023, as well as USD 415.0 mn from the International Monetary Fund (IMF) in July 2023 under the 38-month Extended Fund Facility (EFF) and Extended Credit Facility (ECF) following the completion of the fifth review and is expected to receive USD 682.3 mn upon completion of the sixth review, and,
- CBK’s supportive activities in the money market, such as repurchase agreements and selling of dollars.
Beyond our expectations, the Kenyan shilling depreciated by 26.8% in 2023 to close the year at Kshs 156.5. We expected the Kenyan shilling to remain within a range of Kshs 130.2 and Kshs 134.4 against the USD in the medium term based on the Purchasing Power Parity (PPP) and Interest Rate Parity (IRP) approach respectively, with a bias of a 6.4% depreciation. The shilling’s depreciation against the USD dollar overshot our projection due to the aggressive hike in the US Federal interest rate as well as the adoption of a flexible mechanism by the CBK to allow the currency exchange rate reach an equilibrium hence hitting its true value. Read on our outlook on Performance of Kenya Currency.
Inflation:
The inflation rate for the year 2023 averaged at 7.7%, 0.1% points higher than average inflation rate of 7.6% recorded over a similar period in 2022. Notably, the y/y inflation in December 2023 decreased by 0.2% points to 6.6%, from the 6.8% recorded in November 2023. This was in line with our projections to within a range of 6.6% to 6.8%. The headline inflation in December 2023 was majorly driven by increase in prices of commodities in the following categories, transport; housing, water, electricity, gas, and other fuels, and food and non-alcoholic beverages by 11.7%, 8.3%, and 7.7%, respectively. The overall headline inflation remained within the Central Bank of Kenya (CBK) target range of 2.5% to 7.5% for the sixth consecutive month.
Going forward, we expect inflationary pressures to ease in the short term, while remaining within the CBK’s target range of 2.5% to 7.5% aided by the easing in fuel prices and easing of domestic food prices on the account of improved supply attributed to the ongoing harvests and Government measures to zero-rate key food imports. Additionally, the upward revision of the CBR to 12.50% in the latest MPC meeting, from 10.50%, is meant to continue reducing money supply, in turn easing inflation in the short to medium term, though the impact of this might be muted given that the current inflation is cost driven and not demand driven as the money supply remain stable. We also expect the measures taken by the government to subsidize major inputs of agricultural production such as fertilizers to lower the cost of farm inputs and support the easing of inflation in the long term.
Monetary Policy:
During the year the Monetary Policy Committee (MPC) met 7 times where it maintained the Central Bank Rate (CBR) at 8.75% and the Cash Reserve Ratio of 4.25% in the first meeting held in January. However, the MPC raised the CBR rate by 75.0 basis points (bps) to 9.50% March, and retained the rate in its May sitting, in a bid to anchor inflation which stood above the government’s target range of 2.5% - 7.5% in the first half of 2023. The MPC further hiked the CBR by an additional 100.0 bps to 10.50% in June and maintained the same rate in its August and October meetings and introduced a 250.0 bps interest rate corridor in the former. In its latest meeting held in December, the MPC raised the CBR rate by 200.0 bps to 12.5%, contrary to our expectation that the MPC would retain the CBR rate at 10.5% based on an eased inflation rate, coming in at 6.8% in November from 6.9% in October, remaining in the CBK preferred range of 2.5%-7.5% for the fifth consecutive month, as well as easing depreciation of the Shilling against the dollar, having depreciated by 1.7% in November compared to 1.9% in September. The increment was made to tame the local currency depreciation, which the Committee noted had a significant contribution to the country’s inflation, contributing 3.0% of the 6.8% inflation rate recorded in November, as well as the high cost of debt service. In total, MPC raised rates in 2023 by 3.75%, from 8.75% in January to 12.5% in December. We expect the MPC to continue raising the CBR rates in a bid to anchor the Kenyan shilling that has suffered a 26.8% depreciation against the US Dollar in the year 2023. The following is a graph highlighting the Central Bank Rate for the last 5 years;
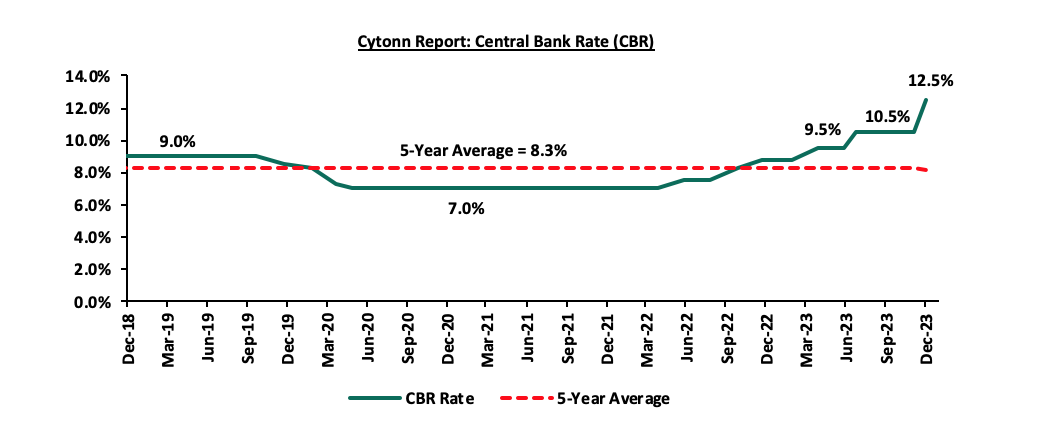
Source: Central Bank of Kenya
2023 Key Highlights:
- FY’2023/2024 Budget Policy Statement
On 15th June 2023, the National Treasury presented Kenya’s FY’2023/24 National Budget to the National Assembly highlighting that the total budget estimate for the 2023/24 fiscal year increased by 8.7% to Kshs 3.7 tn from the Kshs 3.4 tn in FY’2022/23 budget. The government projects that total revenue will increase by 15.7% to Kshs 3.0 tn from the Kshs 2.6 tn in FY’2022/23, supported by a 17.3% increase in ordinary revenue to Kshs 2.6 tn for FY’2023/24, from the Kshs 2.2 tn in FY’2022/23. The FY’2023/24 budget focuses mainly on providing solutions to the heightened concerns on the high cost of living, the measures put in to accelerate economic recovery as well as undertaking a growth-friendly fiscal consolidation to preserve the country’s debt sustainability. Notably, the government projects to narrow the fiscal deficit to 4.4% of GDP in FY’2023/24, from the estimate of 5.8% of GDP in FY’2022/23. For more information, see our Kenya’s FY’2023/24 Budget Review.
- Credit Facilities extended to Kenya
-
- In 2022, Kenya received a total of USD 1 bn (Kshs 155.5 bn) under the Development Policy Operation (DPO) from the World Bank and a total of USD 415.0 mn (Kshs 64.5 bn) from the IMF under the Extended Credit Facility arrangement (EFF/ECF) for budgetary support by providing low-cost budget financing to support key policies and institutional reforms. Additionally, the funding from the World Bank would also boost Kenya’s post-COVID-19 recovery. Key to note, during the fifth review of the EFF/ECF program, the IMF approved USD 551.4 mn (Kshs. 85.7 bn) under the Resilience Sustainability Facility (RSF) programme to support Kenya’s ambitious efforts to build resilience to climate change. For more information, see our Cytonn Weekly #29/2023, and,
- On 15th November 2023, The International Monetary Fund (IMF) reached a staff-level agreement with the Kenyan authorities for the sixth reviews of Kenya’s economic program supported by the IMF’s Extended Fund Facility (EFF) and Extended Credit Facility (ECF), and the first Review under the Resilience Sustainability Facility (RSF). Notably, the discussions considered Kenya’s request for an augmentation under the EFF/ECF arrangement and the RSF, leading to a potential total commitment of approximately USD 4.4 bn (Kshs 670.1 bn) over the program's duration. Following the completion of the review by the IMF Executive Board, Kenya stands to gain immediate access to USD 682.3 mn (Kshs 103.9 bn), marking significant financial support toward the nation's economic programs. For more information, see our Cytonn Weekly #46/2023.
- FY’2022/2023 KRA Revenue Performance
On 14th July 2023, The Kenya Revenue Authority (KRA) released the annual revenue performance for the FY’2022/23, highlighting t that the total revenue collection amounted to Kshs 2.2 tn against the target of Kshs 2.3 tn, translating to a target achievement of 95.3%. The performance also marked the second consecutive year that the KRA has surpassed the Kshs 2.0 tn mark in revenue collection and a 6.6% growth in revenue from the 2.0 tn in FY’2021/22. The performance was mainly supported by an 8.5% growth in domestic tax revenue to Kshs 1.4 tn from Kshs 1.3 tn recorded in FY’2021/22, coupled with a 3.5% growth in customs tax revenue to Kshs 754.1 bn from Kshs 728.6 bn recorded in FY’2021/22. However, the performance of custom taxes was curtailed by an increase in exemptions and remissions, which grew by 39.7%, as a result of exemptions on imports of commodities such as rice, maize, sugar, and cooking oil. For more information, see our Cytonn Weekly #28/2023.
- Balance of Payments
The Kenya National Bureau of Statistics released the Q3’2023 Balance of Payments Report highlighting that Kenya’s balance of payments position (BoP) deteriorated during the quarter, registering a deficit of Kshs 131.5 bn in Q3’2023, from a deficit of Kshs 112.7 bn recorded in Q3’2022, and a reversal from the Kshs 152.9 bn surplus recorded in Q2’2023. The y/y performance in BoP was mainly driven by the reversal of the financial account balance to a deficit of Kshs 20.6 bn from a surplus of Kshs 175.1 bn in Q3’2022, which outweighed the 42.1% narrowing of the current account balance deficit to Kshs 122.5 bn in Q3’2023 from Kshs 211.6 bn in Q3’2022 and the 448.2% increase in the capital account balance to Kshs 3.4 bn from Kshs 0.6 bn recorded in a similar period in 2022.
- Credit Ratings
Kenya’s debt levels have been of concern in 2023, with global credit rating agencies such as Standard & Poor (S&P) Global, Fitch and Moody’s downgrading the country’s credit outlook from stable to negative. In February, S&P Global downgraded Kenya’s credit outlook from stable to negative based on weakening liquidity position brought about by limited access to the international market and undersubscription of domestic bond issuances limiting Kenya’s capacity to service its debt. In May, Moody’s downgraded Kenya’s senior unsecured debt rating as well as long-term foreign-currency and local-currency issuer ratings to B3 from B2 due to a decline in domestic financing leading to delays in funding. The agency also placed the country’s ratings on review, affirming the B3 rating in July and further downgrading the country’s credit outlook from stable to negative on the back of constrained refinancing options for the upcoming USD 2.0 bn Eurobond maturity due in June 2024. Similarly, Fitch Ratings adjusted the outlook on Kenya’s Long-Term Foreign-Currency Issuer Default Rating (IDR) from Stable to Negative, while confirming the IDR at B reflecting the growing constraints on external financing due to high funding needs, including the upcoming Eurobond maturity, declining international reserves, increasing financing costs, and uncertainty about the fiscal path. The downgrades of Kenya’s credit score have dimmed the country’s ability to access cheaper loans in the international financial markets, with the yields on the 10-year 2014 Eurobond Issue reaching a high of 20.3% on 3rd October 2023. For more information, see our media release, Cytonn Q3'2023 Markets Review. Below is a summary of the credit rating on Kenya by various rating agencies;
|
Cytonn Report: Kenya Credit Rating Agencies Ratings |
|||||
|
Rating Agency |
Previous Rating |
Previous Outlook |
Current Rating |
Current Outlook |
Date Released |
|
B3 |
Stable |
B3 |
Negative |
28 th July 2023 |
|
|
B |
Stable |
B |
Negative |
20 th July 2023 |
|
|
B2 |
Stable |
B3 |
Stable |
12 th May 2023 |
|
|
B |
Stable |
B |
Negative |
24 th February 2023 |
|
Source: Fitch Ratings, S&P Global, Moody’s
2023 returns by Various Asset Classes
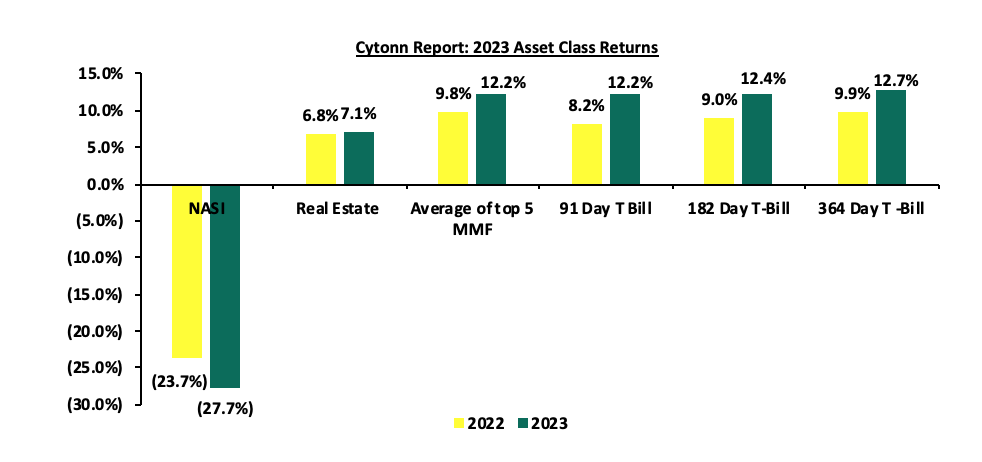
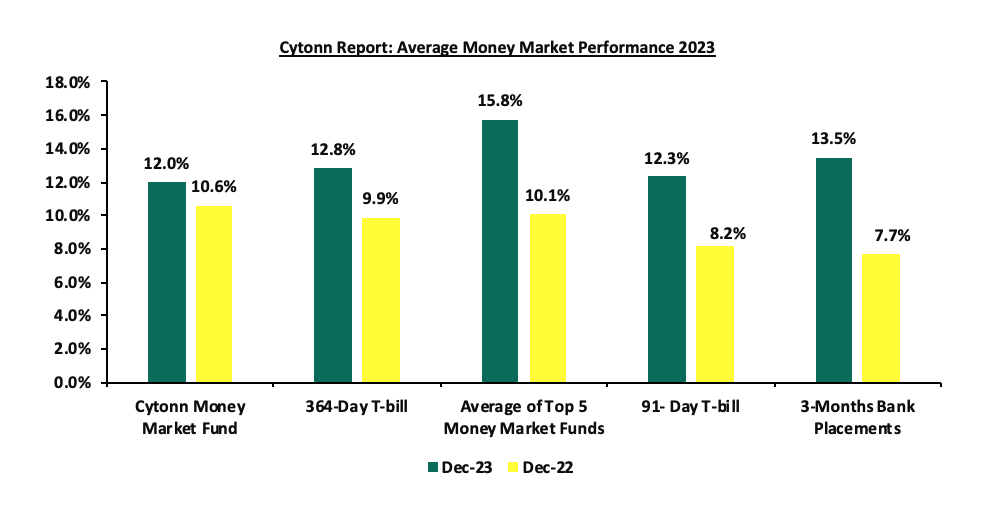
The returns by the various asset classes improved in 2023, with the average of the top five money market funds (MMFs), Real Estate yield and government papers being on upward trajectories. The average of top 5 MMFs recorded a yield of 12.1%, 2.3% points higher than the 9.8% average recorded in 2022 as the average Real Estate yield also increased by 0.3% points to 7.1% in 2023, from 6.8% recorded in 2022. Similarly, the 364-day, 182-day and 91-day Government papers recorded average yields of 12.7%, 12.4% and 12.2%, respectively. However, for the equities class, NASI registered a 27.7% loss in 2023, a deterioration from the 23.7% loss recorded in 2022. The graph below shows the summary of returns by various asset classes (Average top 5 MMF, Fixed Income, Real Estate and Equities).
The table below shows the macro-economic indicators that we track, indicating our expectations for each variable at the beginning of 2023 versus the experience;
|
Cytonn Report: Macro-Economic & Business Environment Outlook |
||||
|
Macro-Economic Indicators |
2023 Outlook |
Effect |
2023 Experience |
Effect |
|
Government Borrowing |
|
Negative |
|
Negative |
|
Exchange Rate |
|
Negative |
|
Negative |
|
Interest Rates |
|
Negative |
|
Negative |
|
Inflation |
|
Neutral |
|
Neutral |
|
GDP |
|
Neutral |
|
Positive |
|
Investor Sentiment |
|
Neutral |
|
Negative |
|
Security |
|
Positive |
|
Neutral |
Since the beginning of the year, the notable changes we have seen out of the seven metrics that we track, fall under three metrics, namely; the GDP, investor sentiment, and Security. Key to note, economic growth improved from neutral to positive, while investor sentiments and security changed from neutral to negative and positive to neutral respectively. In conclusion, macroeconomic fundamentals showed mixed performance during the year with most metrics on downward trajectories. We expect a slight recovery in 2024 supported by the improving economic conditions in the country evidenced by momentum in GDP growth and declining inflation with the rate remaining within target range of 2.5% to 7.5% for the sixth consecutive month. However, improvement of the business conditions in the country depends on the decline in inflation rates and stabilization of the Kenyan currency.
T-Bills & T-Bonds Primary Auction:
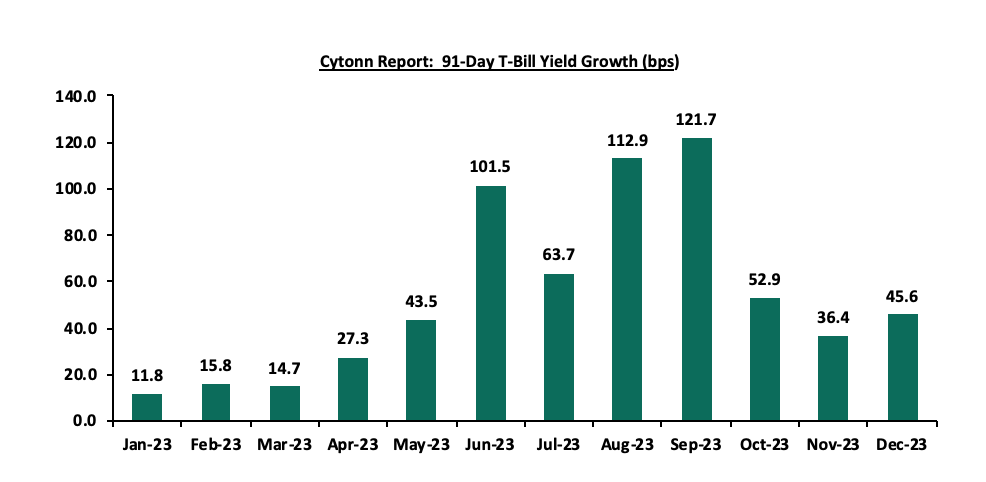
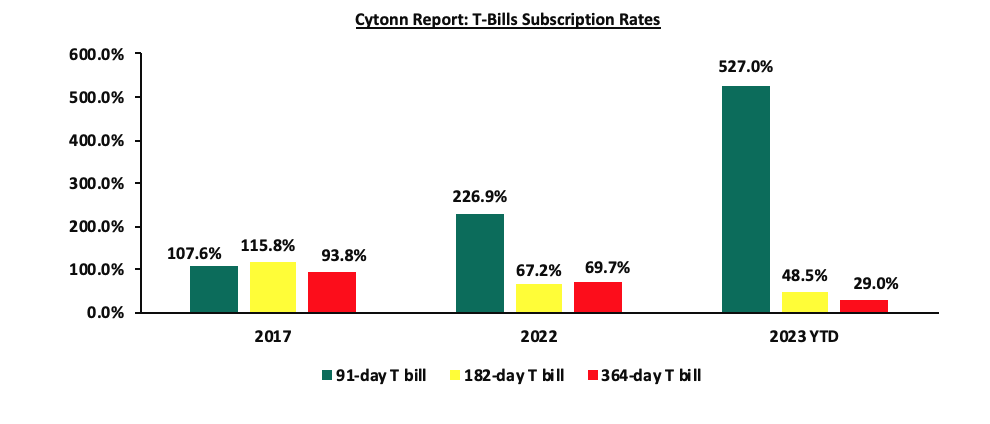
During the year, T-bills were oversubscribed, with the overall subscription rate coming in at 120.0%, up from 94.9% in FY’2022. Investors’ preference for the 91-day paper persisted as they sought to avoid duration risk, with the paper receiving bids worth Kshs 1,100.5 bn against the offered Kshs 208.0 bn, translating to an oversubscription rate of 529.1%, higher than the oversubscription rate of 226.9% recorded in FY’2022. Overall subscription rates for the 364-day and 182-day papers came in at 29.0% and 48.5%, lower than the 69.7% and 67.2%, respectively, recorded in FY’2022. XX The average yields on the 364-day, 182-day, and 91-day papers were on an upward trajectory with the 91-day yields increasing the most by 409.2 bps to 12.3%, from 8.2% in 2022 while the 182-day and 364-day increased by 348.9 bps and 293.4 bps to 12.5% and 12.8% in 2023, from 9.0% and 9.9% in 2022, respectively. Likewise, on y/y basis, the yields on the government papers registered significant growth in 2023 with the 91-day paper increasing the most by 661.4 bps to close the year at 16.0% from the 9.4% recorded at the close of FY’2022. The yields on the 182-day and 364-day increased by 613.3 bps and 579.2 bps to close the year at 16.0% and 16.1%, from the 9.8% and 10.3%, respectively, recorded at the end of FY’2022. The upward trajectory in yields is mainly on the back of investors attaching higher risks amid high inflation, currency depreciation, and tight liquidity positions, hence the need for higher returns to cushion against the possible loss. The average acceptance rate during the period came in at 92.5%, albeit higher than the 89.3% recorded in FY’2022, with the government accepting a total of Kshs 1,385.9 bn out of the Kshs 1,497.7 bn worth of bids received. Notably, the growth in the government papers yields paced up in December compared to November, with the yields on the 91-day paper rising by 45.6 bps, compared to 36.4 bps growth that was recorded in November, as the government remains under pressure to keep borrowing for budgetary purposes. The chart below shows the yields growth rate for the 91-day paper during the year;
During the week, T-bills were undersubscribed, for the third consecutive week, with the overall subscription rate dropping significantly to 43.8%, down from the 86.8% recorded the previous week, partly attributable to the tightened liquidity in the money market with the average interbank rate increasing to 13.9% from 12.2% recorded the previous week. Investor’s preference for the shorter 91-day paper persisted as they sought to avoid duration risk, with the paper receiving bids worth Kshs 8.5 bn against the offered Kshs 4.0 bn, translating to an oversubscription rate of 212.9%, albeit lower than the oversubscription rate of 415.9% recorded the previous week. The subscription rates for the 364-day and the 182-day papers also declined, with the 182-day paper decreasing the most to 3.2% from 22.9% and the 364-day paper decreasing to 16.6% from 19.2%, recorded the previous week. The government accepted a total of Kshs 9.0 bn worth of bids out of Kshs 10.5 bn of bids received, translating to an acceptance rate of 85.4%. The yields on the government papers recorded a mixed performance with the yields on the 364-day and 91-day papers increasing by 19.9 bps and 10.0 bps to 16.1% and 16.0% respectively, while the 182-day paper decreased by 0.5 bps to 16.0%. The chart below compares the overall average T- bills subscription rates obtained in 2017, 2022 and FY’2023;
Primary T-Bond Auctions in FY’2023
Primary T-bond auctions in 2023 were oversubscribed, with the subscription rate averaging 117.8%, an increase from the 98.8% average subscription rate recorded in 2022, mainly attributable to the rising yields on the government papers during the year. The average acceptance rate came in at 82.0% in 2023, 5.2% points lower than the 87.2% recorded in 2022 as the government sought to avoid expensive bids;
In the primary bond market, the government is seeking to raise additional Kshs 35.0 bn for budgetary support by issuing a new 3-year bond FXD1/2024/03 with a tenor of 3.0 years and reopening the 5-year bond FXDI/2023/05 with a tenor to maturity of 4.7 years. The coupon rate for the FXD1/2024/03 will be market-determined; however, that of FXD1/2023/05 is set at 16.8%. The bidding process opened on 14th December 2023 and will close on 14th January 2024, giving the bonds a value date of 15th January 2024. Any discount amounts and interest payments from the bonds will be subject to a withholding tax at a rate of 15.0%. We anticipate the bonds to be oversubscribed, given the short tenor to maturity of the FXD1/2024/03, with that investors attaching higher yields as they seek to cushion themselves against future losses on the back of the government’s debt sustainability concerns and the sustained inflationary pressures experienced in the country.
Secondary Bond Market Activity:
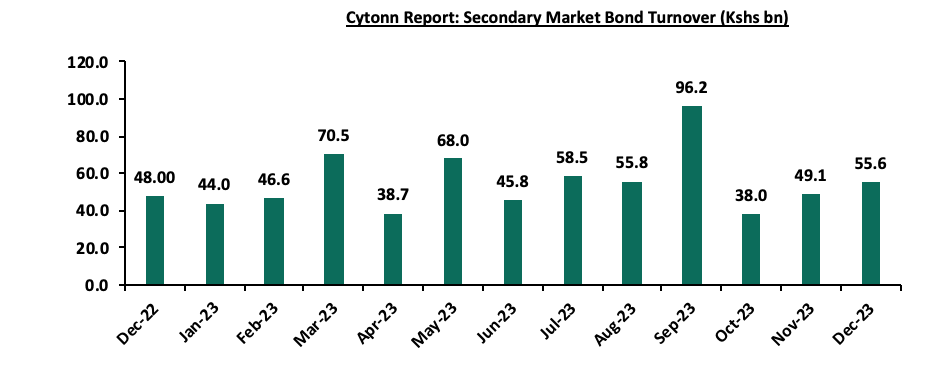
The secondary bond market recorded reduced activity during the year, with the turnover having declined by 9.5% to Kshs 666.9 bn, from Kshs 736.9 bn in 2022. The chart below shows the bond turnover over the past 12 months;
In 2023, the yield curve experienced an upward adjustment, mainly attributable to the increased government borrowing, local currency depreciation and the heighted credit risk with global credit rating agencies such as Fitch, Moody’s and S&P Global downgrading Kenya’s credit outlook from stable to negative amidst constrained liquidity ahead of the upcoming USD 2.0 bn Eurobond maturity due in 2024. As such, investors will continue to demand higher yields to compensate for inflation and currency depreciation risk leading to rise across the yield curve. The chart below is the yield curve movement during the period; 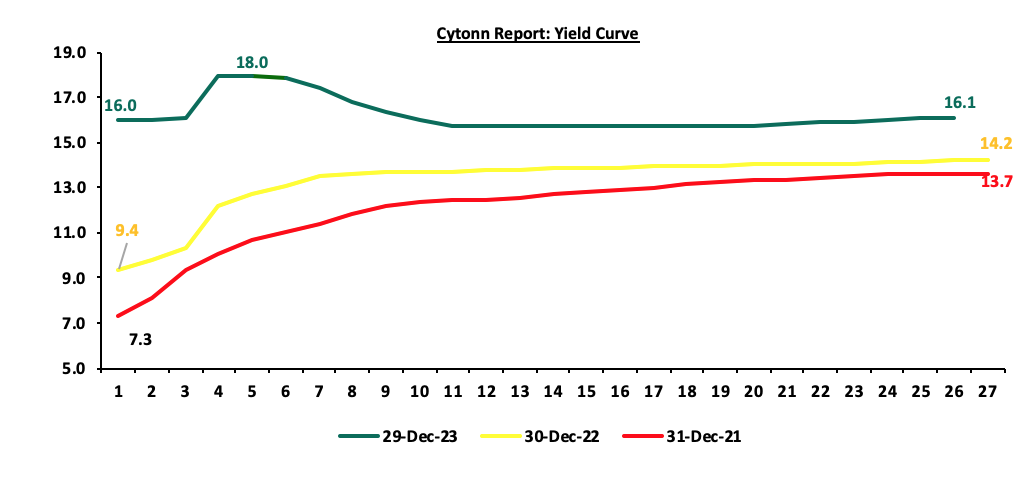
Money Market Performance:
During the week, 3-month bank placements ended the week at 13.5% (based on what we have been offered by various banks), while the yield on the 364-day T-bill and 91-day T-bill increased by 19.9 bps and 10.0 bps to 16.1% and 16.0%, respectively. Likewise, the average yield of the Top 5 Money Market Funds increased by 15.4 bps to 15.8% from15.6% recorded the previous week, while the yields of the Cytonn Money Market Fund remained relatively unchanged at 15.5% recorded the previous week. The table below shows the Money Market Fund Yields for Kenyan Fund Managers as published on 29th December 2023:
|
Cytonn Report: Money Market Fund Yield for Fund Managers as published on 29th December 2023 |
||
|
Rank |
Fund Manager |
Effective Annual |
|
1 |
Etica Money Market Fund |
16.5% |
|
2 |
Nabo Africa Money Market Fund |
15.9% |
|
3 |
GenAfrica Money Market Fund |
15.8% |
|
4 |
Cytonn Money Market Fund (Dial *809# or download Cytonn App) |
15.5% |
|
5 |
Lofty-Corban Money Market Fund |
15.3% |
|
6 |
Enwealth Money Market Fund |
14.9% |
|
7 |
Sanlam Money Market Fund |
14.7% |
|
8 |
Apollo Money Market Fund |
14.4% |
|
9 |
Madison Money Market Fund |
14.3% |
|
10 |
Kuza Money Market fund |
14.1% |
|
11 |
AA Kenya Shillings Fund |
14.1% |
|
12 |
Co-op Money Market Fund |
13.9% |
|
13 |
Absa Shilling Money Market Fund |
13.8% |
|
14 |
GenCap Hela Imara Money Market Fund |
13.6% |
|
15 |
Jubilee Money Market Fund |
13.6% |
|
16 |
Old Mutual Money Market Fund |
13.4% |
|
17 |
Orient Kasha Money Market Fund |
13.0% |
|
18 |
Mayfair Money Market Fund |
12.7% |
|
19 |
Dry Associates Money Market Fund |
12.3% |
|
20 |
KCB Money Market Fund |
12.2% |
|
21 |
CIC Money Market Fund |
11.8% |
|
22 |
ICEA Lion Money Market Fund |
11.7% |
|
23 |
Equity Money Market Fund |
11.5% |
|
24 |
Mali Money Market Fund |
11.5% |
|
25 |
British-American Money Market Fund |
9.1% |
Source: Business Daily
Liquidity:
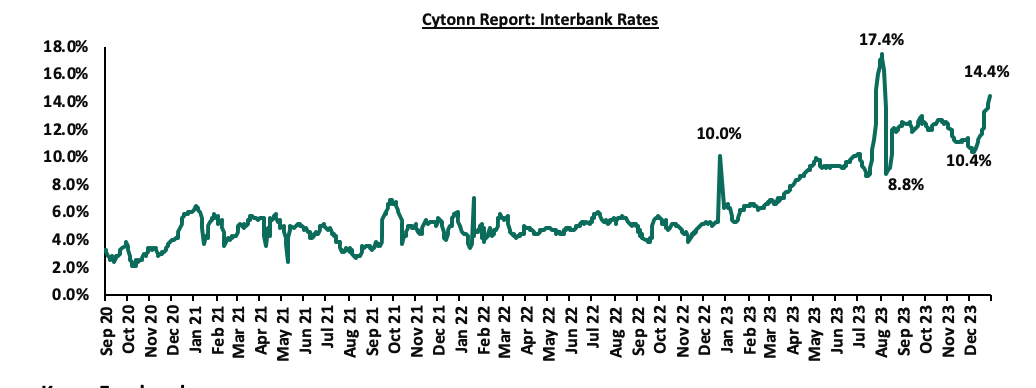
During the year, liquidity levels tightened as evidenced by the doubling in the average interbank rate to 9.8%, from 4.9% in 2022. The tightened liquidity is partly due to tax remittances which offset government payments. The average volumes traded in the interbank market increased by 16.1% to Kshs 21.6 bn in 2023 from Kshs 18.6 bn recorded in 2022.
During the week, liquidity in the money markets tightened, with the average interbank rate rising to 13.9% from 12.2% recorded the previous week, partly attributable to tax remittances that offset government payments. The average interbank volumes traded declined by 39.6% to Kshs 20.3 bn from Kshs 33.7 bn recorded the previous week. The chart below shows the interbank rates in the market over the years:
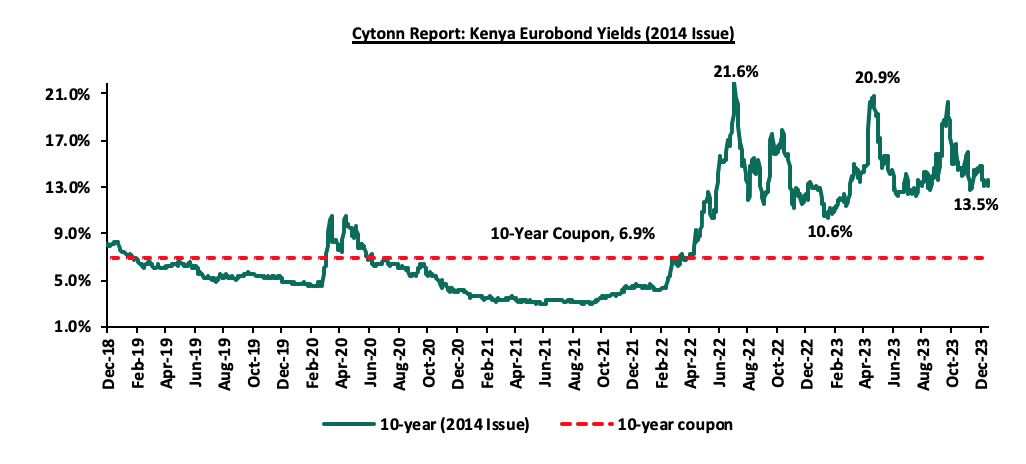
Kenya Eurobonds:
Yields on Kenya’s Eurobonds recorded mixed performance in 2023, with the yields on the 10-Year Eurobond issued in 2014, set to mature in 2024, increasing the most by 0.6% points to 13.5%, from 12.9% recorded at the end of 2022.
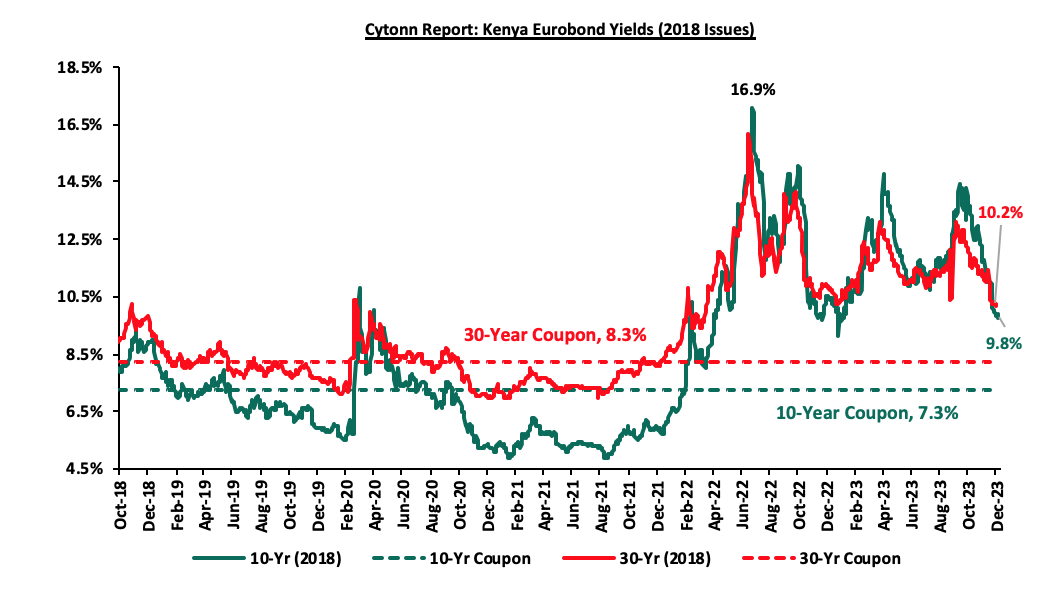
For the 2018 Eurobond issue, the yields on the 10-year Eurobond and the 30-year Eurobond both decreased by 0.7% points and 0.6% points to close the year at 9.8% and 10.2%, from 10.5% and 10.9% recorded at the end of 2022, respectively;
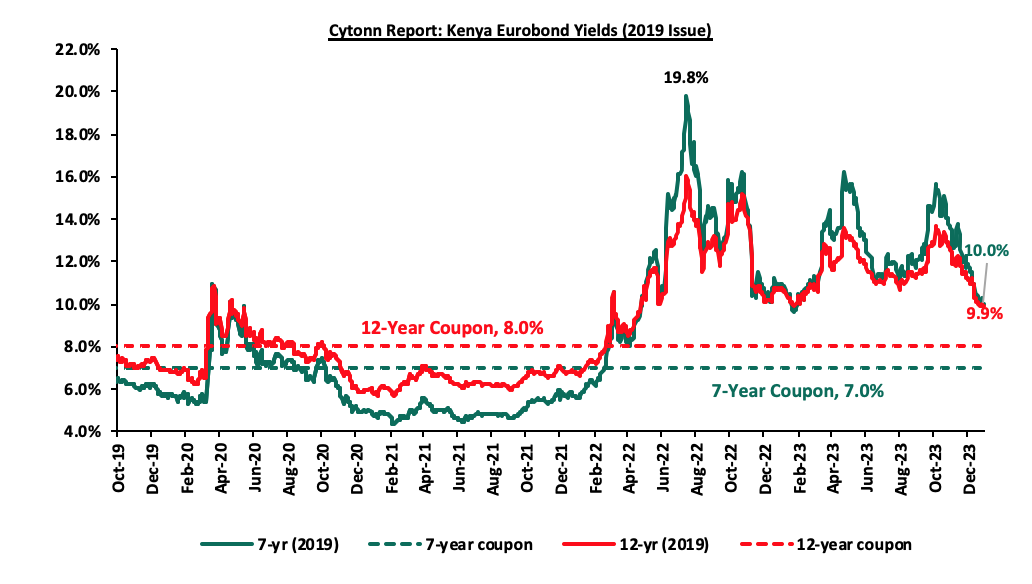
For the 2019 Dual-tranche Eurobond issue, the yields on the 7-year Eurobond and the 12-year Eurobond decreased by 0.9% points each, to close the year at 10.0% and 9.9%, from 10.9% and 10.8% at the close of 2022, respectively.
The yields on the 12-Year Eurobond issued in 2021, set to mature in 2033, decreased by 0.3% points to 9.6%, from 9.9% recorded at the end of 2022;
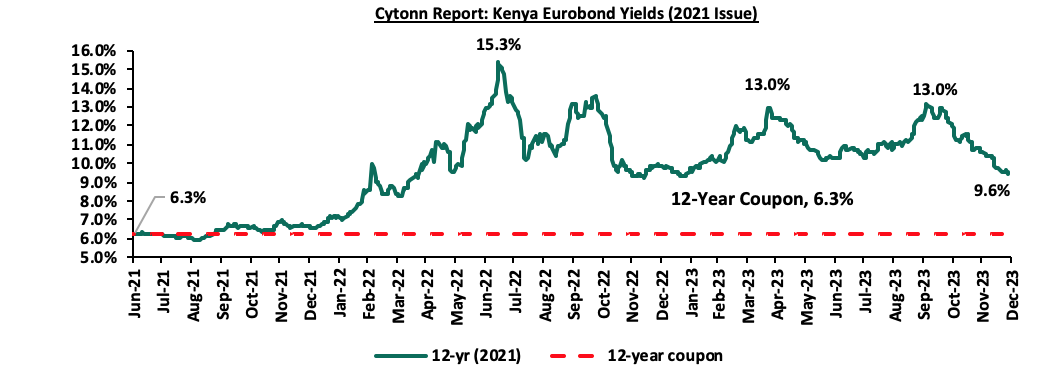
Likewise, during the week, the yields on Eurobonds recorded mixed performance with the 10-year Eurobond issued in 2014 increasing the most by 0.1% points, to 13.5% from 13.4% recorded the previous week, while the yields on the 7-year Eurobond issued in 2019 declined the most by 0.1% points to 10.0% from 10.1% recorded the previous week. The table below shows the summary of the performance of the Kenyan Eurobonds as of 29th December 2023;
|
Cytonn Report: Kenya Eurobonds Performance |
||||||
|
|
2014 |
2018 |
2019 |
2021 |
||
|
Tenor |
10-year issue |
10-year issue |
30-year issue |
7-year issue |
12-year issue |
12-year issue |
|
Amount Issued (USD) |
2.0 bn |
1.0 bn |
1.0 bn |
0.9 bn |
1.2 bn |
1.0 bn |
|
Years to Maturity |
0.5 |
4.2 |
24.2 |
3.4 |
8.4 |
10.5 |
|
Yields at Issue |
6.6% |
7.3% |
8.3% |
7.0% |
7.9% |
6.2% |
|
02-Jan-23 |
12.9% |
10.5% |
10.9% |
10.9% |
10.8% |
9.9% |
|
30-Nov-23 |
14.1% |
11.4% |
11.2% |
11.9% |
11.2% |
10.6% |
|
21-Dec-23 |
13.4% |
9.9% |
10.3% |
10.1% |
9.9% |
9.6% |
|
22-Dec-23 |
13.4% |
9.9% |
10.2% |
10.2% |
9.9% |
9.6% |
|
25-Dec-23 |
13.4% |
9.9% |
10.2% |
10.2% |
9.9% |
9.6% |
|
26-Dec-23 |
13.4% |
9.9% |
10.3% |
10.3% |
10.0% |
9.6% |
|
27-Dec-23 |
13.2% |
9.8% |
10.2% |
10.0% |
9.9% |
9.5% |
|
28-Dec-23 |
13.5% |
9.8% |
10.2% |
10.0% |
9.9% |
9.6% |
|
Weekly Change |
0.2% |
(0.0%) |
(0.0%) |
(0.1%) |
(0.0%) |
(0.0%) |
|
MTM Change |
(0.6%) |
(1.6%) |
(1.0%) |
(1.8%) |
(1.3%) |
(1.1%) |
|
YTD Change |
0.6% |
(0.7%) |
(0.6%) |
(0.9%) |
(0.9%) |
(0.3%) |
Source: Central Bank of Kenya (CBK)
Weekly Highlights:
- December 2023 Inflation
The y/y inflation in December 2023 decreased marginally by 0.2% points to 6.6%, from the 6.8% recorded in November 2023. This was well in line with our projections to within a range of 6.6% to 6.8%. The headline inflation in December 2023 was majorly driven by increase in prices of commodities in the following categories, transport; housing, water, electricity, gas and other fuels, and food and non-alcoholic beverages by 11.7%, 8.3% and 7.7%, respectively. The table below shows a summary of both the year on year and month on month commodity indices performance:
|
Cytonn Report: Major Inflation Changes – 2023 |
|||
|
Broad Commodity Group |
Price change m/m (December-2023/November-2023) |
Price change y/y (December-2022/December-2023) |
Reason |
|
Food and Non-Alcoholic Beverages |
0.3% |
7.7% |
The m/m increase was mainly driven by the increase in prices of commodities such as carrots, kale-sukumawiki and goat meat by 14.5%, 6.2%, and 5.1%, respectively. However, the increase was weighed down by decrease in prices of mangoes, potatoes (Irish) and maize flour- sifted by 5.7%, 4.9%, and 3.8%, respectively. |
|
Housing, Water, Electricity, Gas and Other Fuel |
0.4% |
8.3% |
The m/m performance was mainly driven by the increase in prices of Electricity of 50kWh and 200kWh by 1.2% and 1.0% respectively. However, there was a decrease in the price of a litre of kerosene by 2.0%. |
|
Transport cost |
0.5% |
11.7% |
The m/m increase in transport Index was mainly due to an increase in prices of country bus fares despite of the decline in the prices of a litre of petrol and diesel by 2.3% and 1.0%, respectively. |
|
Overall Inflation |
0.4% |
6.6% |
The m/m decrease was mainly supported by the slower 0.3% increase in food and non-alcoholic beverages. |
Notably, the overall headline inflation remained within the Central Bank of Kenya (CBK) target range of 2.5% to 7.5% for the sixth consecutive month. The decrease in headline inflation in December 2023 comes amid the recent decline in the Petrol, Diesel and Kerosene prices which decreased by 2.3%, 1.0% and 2.0% to Kshs 213.0, Kshs 202.2 and Kshs 199.8 per litre respectively, for the period between 15th December 2023 to 14th January 2024. The chart below shows the inflation rates for the past 5 years:
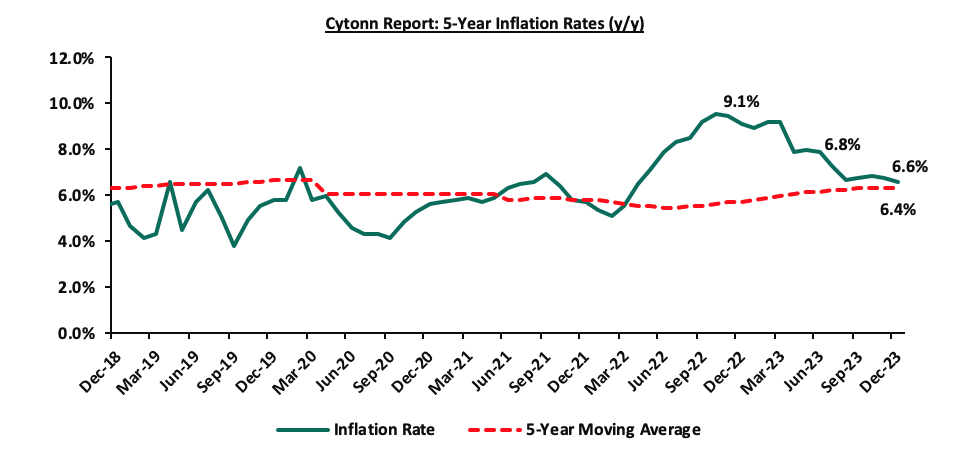
Going forward, we expect inflationary pressures to ease in the short term, while remaining within the CBK’s target range of 2.5% to 7.5% aided by the easing in fuel prices and easing of domestic food prices on the account of improved supply attributed to the ongoing harvests and Government measures to zero-rate key food imports. Additionally, the upward revision of the CBR to 12.50% in the latest MPC meeting, from 10.50%, is meant to continue reducing money supply, in turn easing inflation in the short to medium term, though the impact of this might be muted given that the current inflation is cost driven and not demand driven as the money supply remain stable. We also expect the measures taken by the government to subsidize major inputs of agricultural production such as fertilizers to lower the cost of farm inputs and support the easing of inflation in the long term.
- Kenya Q3’2023 GDP Growth
During the week, the Kenya National Bureau of Statistics (KNBS) released the Q3'2023 Quarterly Gross Domestic Product Report, highlighting that the Kenyan economy recorded a 5.9% growth in Q3’2023, faster than the 4.3% growth recorded in Q3’2022. The main contributor to Kenyan GDP remains to be the Agriculture, fishing and forestry sector which grew by 6.7% in Q3’2023 compared to a contraction of 1.3% in Q3’2022. All sectors in Q3’2023 recorded positive growths, with varying magnitudes across activities. Most sectors recorded improved growth compared to Q3’2022 with Accommodation and Food Services, Agriculture, Forestry and Fishing and Mining and Quarrying Sectors recording the highest growth improvements of 9.1% points, 8.0% points, and 5.6% points, respectively. Other sectors that recorded expansion in growth rate, from what was recorded in Q3’2022 were Financial and Insurance Services, Information and Communication and Real Estate sectors, of 5.1%, 2.7% and 2.2% points respectively.
The key take-outs from the report include;
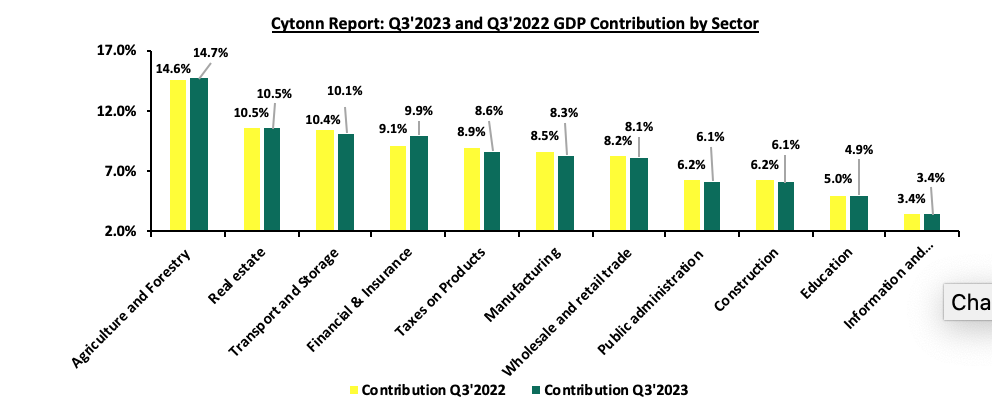
- Sectoral Contribution to Growth - The biggest gainer in terms of sectoral contribution to GDP was the Financial and Insurance sector, increasing by 0.8% points to 9.9% in Q3’2023 from 9.1% in Q3’2022, while the Transport and Storage sector was the biggest loser, declining by 0.3% points to 10.1% in Q3’2023, from 10.4% in Q3’2022. Real Estate was the second largest contributor to GDP at 10.5% in Q3’2023, remaining relatively unchanged from Q3’2022, indicating sustained growth. The Accommodation and Food Services sector recorded the highest growth rate in Q3’2023 growing by 26.0%, faster than the 16.9% growth recorded in Q3’2022.
The chart below shows the top contributors to GDP by sector in Q3’2023:
Source: KNBS Q3’2022 and Q3’2023 GDP Report
- Rebound in the Agricultural Sector– Agriculture and Forestry recorded a growth of 6.7% in Q3’2023. The performance was an increase of 8.0% points, from the contraction of 1.3% recorded in Q3’2022. The positive growth recorded during the quarter was mainly attributable to favorable weather conditions that characterized the first three quarters of 2023. Notably, during the quarter, production of key food crops and cash crops increased with a significant increase in the production of fruits, tea and vegetables during the quarter under review. However, the performance was weighed down by decline in the production of sugarcane.
- Increased growth in the Financial and Insurance Services Sector: The Financial and Insurance sector registered a significant growth of 14.7% in Q3’2023 compared to the 9.6% in Q3’2022. Additionally, the contribution to GDP increased to 9.9%, from 9.1% in Q3’2022. Some of the notable improvements include:
-
- Broad money supply (M3)-which is a collection of all the currency flowing in the economy, rose by 18.6% to Kshs 5.8 tn in Q3’2023 as compared to Kshs 4.9 tn recorded same period in 2022,
- Net foreign assets registered a remarkable growth of 142.1% to Kshs 708.0 bn in Q3’2023, from Kshs 292.5 bn in 2022, and,
- The Central Bank of Kenya (CBK) in efforts to curb the high inflation raised the Central Bank Rate (CBR) to 10.50% in Q3’2023, compared to 8.25% that was recorded same period in 2022, resulting to increased cost of credit by commercial banks, with interests on loans averaging 14.0% in Q3’2023 compared to the 12.4% recorded in Q3’2022.
- Decelerated growth in the electricity supply sector - The manufacturing sector recorded a decelerated growth of 1.9% in Q3’2023 compared to a 6.0% growth in a similar period of review in 2022.However, the sectoral contribution to GDP marginally decreasing to 2.6% in Q3’2023, from 2.7% recorded in Q3’2022.
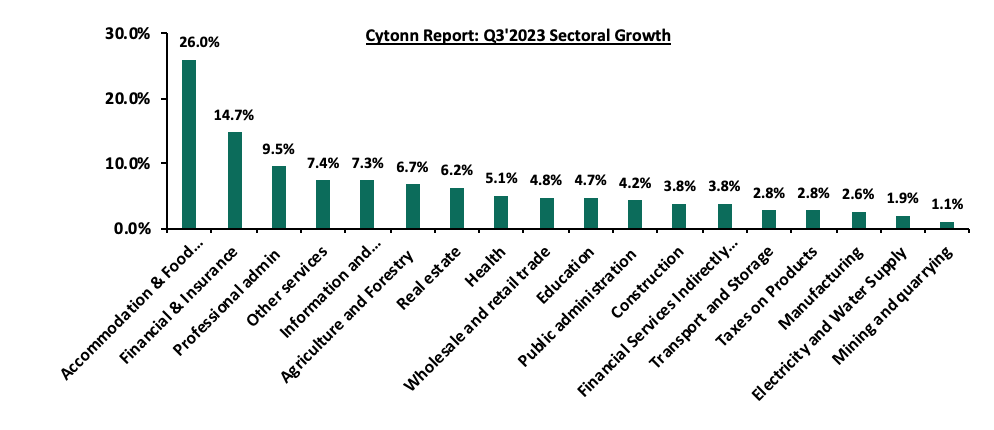
- Significant growth in the Accommodation and Food Service sector: Accommodation and Food Services sector recorded the highest growth rate among all the sectors in Q3’2023, having expanded by 26.0%, higher than the 16.9% recorded in Q3’2022. Additionally, the contribution to GDP increased by 0.2% points, to 1.2% in Q3’2023, compared to 1.0% recorded in Q3’2022.
The chart below shows the different sectoral GDP growth rates for Q3’2023:
Source: KNBS Q3’2023 GDP Report
In the near-term, we expect the economy to grow at a slower pace given the subdued general business environment in the country, mainly as a result of elevated inflationary pressures occasioned by high fuel and food prices. Additionally, the Central Bank of Kenya’s Monetary Policy Committee’s (MPC) decision on 5th December 2023 to increase the Central Bank Rate (CBR) to 12.5% from 10.5% in a bid to curb inflation and maintain price stability is expected to curtail economic growth. The higher CBR is set to maintain the cost of credit issued by lenders high, hence discouraging borrowing, which will in turn lead to reduced investment spending in the economy by both individuals and businesses. Additionally, the inflation in the country remains high, although within the Central Bank’s range, and risks going high in the short term with the persistent high fuel prices in the country, despite global fuel prices easing, mainly on the back of the depreciating shilling. Thus, the consumer purchasing power remains low, resulting in reduced demand for goods and services and consequentially slowed economic growth. However, we expect the agricultural sector to continue backing economic growth in the country, as the country continues to experience sufficient rain during the year. The sector remains Kenya’s largest contributor to GDP, as well as food prices being a major contributor to headline inflation.
- Kenya Q3’2023 BOP Growth
During the week, the Kenya National Bureau of Statistics released the Quarterly Balance of Payment Report for Q3’2023 report highlighting that Kenya’s balance of payments position deteriorated registering a deficit of Kshs 131.5 bn in Q3’2023, from a deficit of Kshs 112.7 bn recorded in Q3’2022, and a reversal from the Kshs 152.9 bn surplus recorded in Q2’2023. In this note, we provide a detailed analysis of the current account and the balance of payment before giving an outlook on both;
Balance of Payments
Kenya’s balance of payment (BoP) position deteriorated by 16.7% in Q3’2023, coming in at a deficit of Kshs 131.5 bn, from a deficit of Kshs 112.7 bn in Q3’2022, and a reversal from the Kshs 152.9 bn surplus recorded in Q2’2023. the reversal of the financial account balance to a deficit of Kshs 20.6 bn from a surplus of Kshs 175.1 bn in Q3’2022, which outweighed the 42.1% narrowing of the current account balance deficit to Kshs 122.5 bn in Q3’2023 from Kshs 211.6 bn in Q3’2022 and the 448.2% increase in capital account balance to Kshs 3.4 bn from Kshs 0.6 bn recorded in a similar period in 2022. The table below shows the breakdown of the various balance of payments components, comparing Q3’2023 and Q3’2022:
|
Cytonn Report: Current Account Balance |
||||
|
Item |
Q3'2022 |
Q2'2023 |
Q3'2023 |
Y/Y % Change |
|
Current Account Balance |
(211.6) |
(138.7) |
(122.5) |
(42.1%) |
|
Capital Account Balance |
0.6 |
4.9 |
3.4 |
448.2% |
|
Financial Account Balance |
175.1 |
321.5 |
(20.6) |
(111.8%) |
|
Net Errors and Omissions |
(76.9) |
(34.8) |
8.3 |
(110.7%) |
|
Balance of Payments |
(112.7) |
152.9 |
(131.5) |
16.7% |
All values in Kshs bns
Key take-outs from the table include;
- The current account deficit (value of goods and services imported exceeds the value of those exported) narrowed by a significant margin of 42.1% to Kshs 122.5 bn, from Kshs 211.6 bn in Q3’2022, mainly attributable to 12.6% improvement in the merchandise trade balance deficit to Kshs 326.2 bn, from Kshs 373.1 bn recorded in Q3’2022,
- The financial account balance deficit (the difference between the foreign assets purchased by domestic buyers and the domestic assets purchased by the foreign buyers) recorded a deficit of Kshs 20.6 bn in Q3’2023, a sharp decrease of 111.8% from the surplus of Kshs 175.1 bn recorded in Q3’2022. Notably, the stock of gross official reserves increased by 18.7% to Kshs 1,116.0 bn in Q3’2023 from Kshs 940.2 bn in Q3’2022, mainly attributed the increased disbursement of programme loans from the International Monetary Fund (IMF) and multilateral sources during the period of review,
- Consequently, the Balance of Payments (BoP) position deteriorated to a deficit of Kshs 131.5 bn in Q3’2023, from a deficit of Kshs 112.7 bn recorded in Q3’2022.
Current Account Balance
Kenya’s current account deficit narrowed by 42.1% to Kshs 122.5 bn in Q3’2023 from the Kshs 211.6 bn deficit recorded in Q3’2022. Similarly, the performance was an improvement from the previous quarter, with the Q3’2023 deficit narrowing by 11.7% from the deficit of Kshs 138.7 bn recorded in Q2’2023, driven by:
- The contraction of the merchandise trade (a scenario where imports are greater than exports of goods resulting to a negative net foreign investment) by 12.6% to Kshs 326.2 bn in Q3’2023, from Kshs 373.1 bn in Q3’2022,
- A 35.2% increase in the secondary income balance (the transactions recorded in the secondary income account pertain to those current transfers between residents and non-residents that directly affect the level of gross national disposable income and thus influence the economy’s ability to consume goods and services), a surplus of Kshs 251.9 bn from a surplus of Kshs 186.3 bn in Q3’2022.
The table below shows the breakdown of the various current account components, comparing Q3’2022 and Q3’2023:
|
Cytonn Report: Current Account Balance |
||||
|
Item |
Q3'2022 |
Q2'2023 |
Q3'2023 |
Y/Y % Change |
|
Merchandise Trade Balance |
(373.1) |
(343.2) |
(326.2) |
(12.6%) |
|
Services Trade Balance |
38.5 |
35.4 |
36.2 |
(5.8%) |
|
Primary Income Balance |
(63.3) |
(65.4) |
(84.5) |
33.5% |
|
Secondary Income (transfer) Balance |
186.3 |
234.5 |
251.9 |
35.2% |
|
Current Account Balance |
(211.6) |
(138.7) |
(122.5) |
(42.1%) |
All values in Kshs bns
The deterioration in the balance of payments performance is mainly due to the reversal of the financial account balance from a surplus to a deficit driven by debt servicing costs that have been on the rise given the continued depreciation of the Kenya shilling against the US dollar, given that 67.1% of Kenya's external debt as of June 2023 is denominated in USD. Consequently, the sustained depreciation of the shilling against hard currency continues to inflate the country's import bill, having depreciated by 26.8% against the USD since the year began. As such, we expect the high costs of imports, especially fuel imports, to continue weighing down on the current account's performance in the medium term. However, we expect that the current administration’s focus on fiscal consolidation will improve the balance of payments performance by minimizing the costs of servicing external debts and making adequate arrangements for the repayment of the 2014 Eurobond debt maturing in June 2024.
- Ethiopia Defaults on its First Installment of USD 1.0 bn Eurobond due in December 2023
During the month, Ethiopia became the third African country to default on its international government debt after the COVID-19 pandemic, joining Zambia and Ghana in the region, with the 14-day grace period for the USD 33.0 mn first repayment ending on December 25th. With the two-year civil war ended in November 2022, and financial strain resulting from the COVID-19 strain, Ethiopia’s economy has been largely subdued, putting pressure on the already low foreign currency reserves. As a result, the government ran into default of the 10-year Eurobond issued in 2014, which had been incurred to fund development projects and to attract foreign investors. In early 2021, Ethiopia had originally requested a debt relief under the G20’s Common Framework, an initiative that aims to provide coordinated and comprehensive debt restructuring for low-income countries following the COVID-19 pandemic, which was unsuccessful as it meant the country had to seek the consent of its bond holders to restructure its Eurobond. According to the Ethiopian government, the government is requesting a debt-service suspension for the period 2023 and 2024 from its creditors as it carries out the restructuring negotiations with the creditors. With the poor state of the economy, China, which stands as the major creditor to Ethiopia agreed to debt-service suspension in November, 2023 to give debt service break to the country which is currently dealing with high inflation rates, currently standing at 28.3% as of November 2023, as well as depleted foreign reserves. As such, Credit ratings Agency S&P Global downgraded the bond to “Default” on Dec 15, 2023 on assumption that Ethiopia would default on the December coupon payment. In confirmation to this, Fitch Ratings downgraded the rating on the Eurobond to “Default”(D) from “near default”(C) on 27th December, 2023. Similarly, Fitch also downgraded Ethiopia’s long-term foreign currency rating to “restricted default” (RD) from “C”.
According to International Monetary Fund (IMF), the government’s debt to GDP is projected at 37.9% for 2023 which is 12.1% points below the IMF’s threshold of 50.0% for developing countries. Despite relatively manageable debt to GDP ratio, the double-digit inflation rates, hard currency shortage and the struggling economy resulting from the civil war and COVID-19 pandemic puts Ethiopia in foreign debt default levels. Below is a chart showing Ethiopia’s debt to GDP levels;
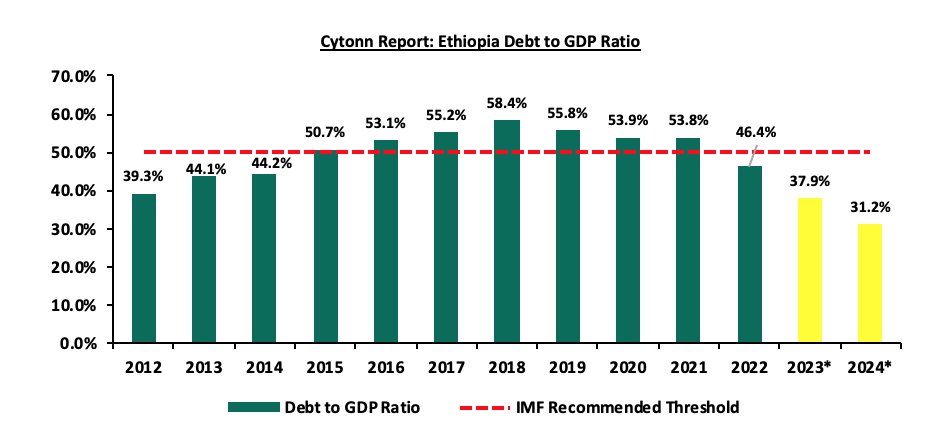
Source: IMF, *projections
In addition to Ethiopia’s default, many counties in Sub-Saharan Africa (SSA) are on the verge of debt distress according to IMF Economic Outlook-Sub-Saharan Africa with debt-to GDP ratio largely stabilizing at 60.0% in the region, mainly on the back of increasing spending and reduced revenue collection during the COVID-19 pandemic
Key to note, the implications of Ethiopia’s debt default can have significant implications including i) Eroding the already low foreign investor confidence due to concerns on the economic stability, ii) Limited access to credit as international lenders become cautions of the country’s ability to repay, translating to limited development funds as well as higher borrowing costs for the government and the private sector, and iii) possible economic instability as the uncertainty can reduce demand and activity in the economy.
Rates in the Fixed Income market have been on an upward trend given the continued high demand for cash by the government and the occasional liquidity tightness in the money market. The government is 37.8% behind of its prorated net domestic borrowing target of Kshs 238.3 bn, having a net borrowing position of Kshs 142.5 bn out of the domestic net borrowing target of Kshs 471.4 bn for the FY’2023/2024. Therefore, we expect a continued upward readjustment of the yield curve in the short and medium term, with the government looking to maintain the fiscal surplus through the domestic market. Owing to this, our view is that investors should be biased towards short-term fixed-income securities to reduce duration risk.
Market Performance
In 2023, the Kenyan equities market was on a downward trajectory, with NASI, NSE 20, and NSE 25 declining by 27.7%, 10.4%, and 24.2%, respectively. Below is a summary of the 2022 annual performance of some of the large-cap stocks in the Kenyan stock market:
|
Cytonn Report: Kenya Equities Performance - Large Cap Gainers and Losers 2023 |
||
|
No |
Company |
Share Price Performance 2023 |
|
1 |
Bamburi Cement |
14.0% |
|
2 |
Standard Chartered Bank |
11.7% |
|
3 |
Stanbic Bank |
6.6% |
|
4 |
NCBA |
0.0% |
|
5 |
Cooperative Bank of Kenya |
(5.8%) |
|
6 |
Absa Bank |
(6.1%) |
|
7 |
Diamond Trust Bank |
(9.6%) |
|
8 |
BAT |
(11.4%) |
|
9 |
Equity Group |
(25.3%) |
|
10 |
East Africa Breweries |
(32.9%) |
|
11 |
Safaricom |
(42.2%) |
|
12 |
KCB Group |
(42.9%) |
During the week, the equities market was on an upward trajectory, with NASI, NSE 20 and NSE 25 gaining by 1.2%, 0.8%, and 0.7%, respectively. The equities market performance was mainly driven by gains recorded by large-cap stocks such as Stanbic, Co-operative Bank, Safaricom, ABSA Bank, and Standard Chartered Bank Kenya of 3.3%, 3.2%, 2.6%, 2.2%, and 1.1%, respectively. The performance was however weighed down by losses recorded by banking stocks such as Diamond Trust Bank Kenya, NCBA Group, and Equity Bank of 3.1%, 2.6%, and 1.0% respectively.
During the year, equities turnover declined by 18.3% to close the year at USD 0.6 bn, from USD 0.8 bn recorded in 2022. Foreign investors remained net sellers, with a net outflow of USD 296.3 mn, compared to net outflows of USD 204.3 mn recorded in 2022. The foreign-investor outflows during the year can be largely attributed to investors fleeing emerging markets such as Kenya, to advanced economies such as United States and United Kingdom following interest rate hikes as well as increased concerns about macroeconomic deterioration in emerging markets.
During the week, equities turnover declined by 48.0% to USD 2.6 mn from USD 5.0 mn recorded the previous week, taking the YTD turnover to USD 649.1 mn. Additionally, foreign investors became net buyers for the first time in five weeks, with a net buying position of USD 0.01 mn, from a net selling position of USD 1.0 mn recorded the previous week, taking the YTD net selling position to USD 296.3 mn.
The market is currently trading at a price-to-earnings ratio (P/E) of 5.1x lower than 6.7x recorded at the end of 2022, and is 57.7% below the 12-year historical average of 12.1x. NASI’s P/E ratio remained suppressed for the majority of the year, mainly attributable to a drop-in price of large-cap stocks such as Safaricom whose price declined by 42.2% during the year. Safaricom continues to be a key part of Kenyan equities portfolios, accounting for 39.0% of Nairobi Stock Exchange (NSE’s) market capitalization, and has dominated both the market turnover and determines the direction of the market given its weight and liquidity in the Nairobi Securities Exchange. On the other hand, the dividend yield is currently at 9.4%, 5.0% points above the historical average of 4.4%.
Key to note, NASI’s PEG ratio currently stands at 0.7 an indication that the market is undervalued relative to its future earnings growth. The charts below indicate the market’s historical P/E and dividend yield:
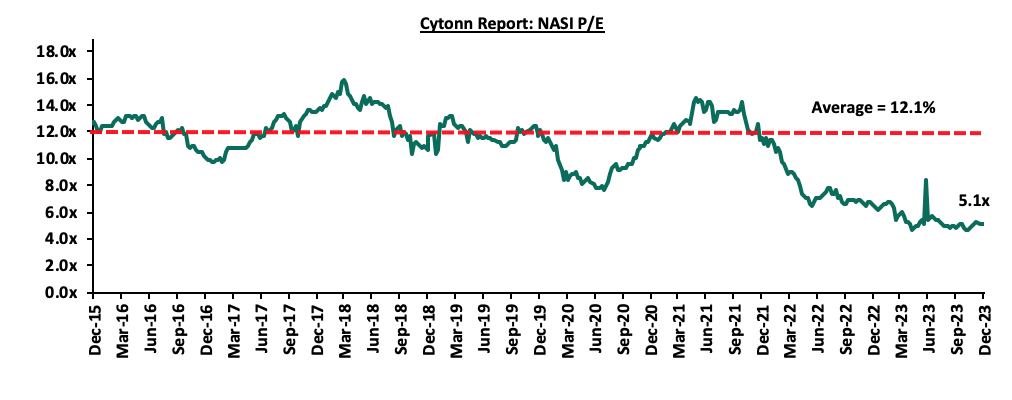
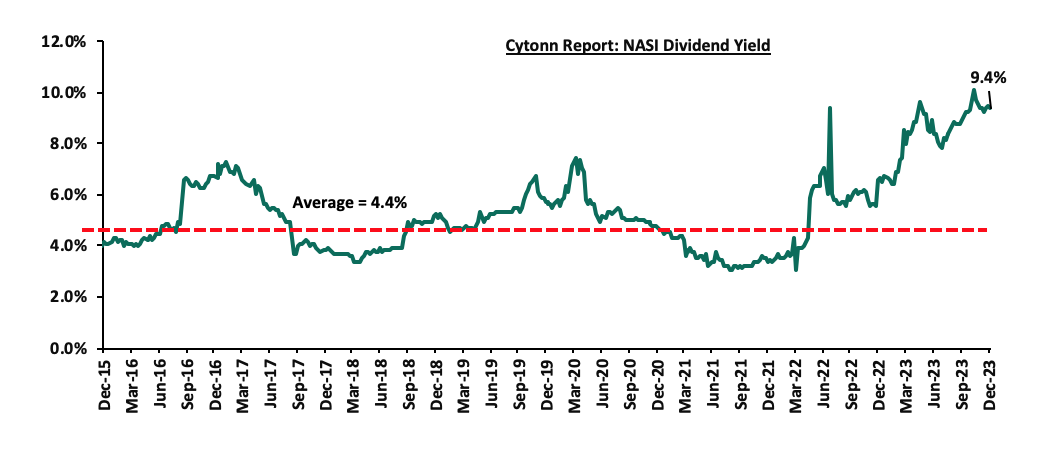
2022 Key Highlights
- Banking Sector Earnings
According to the Q3’2023 banking results, listed banks recorded a weighted average increase in the core earnings per share of 11.2%, compared to a weighted average increase of 36.4% in Q3’2022, an indication of sustained performance despite the tough operating environment occasioned by elevated inflationary pressures experienced during the period. The table below highlights the performance of the banking sector, showing the performance using several metrics, and the key take-outs of the performance.
|
Cytonn Report: Listed Banks Performance in Q3’2023 |
|||||||||||||
|
Bank |
Core EPS Growth |
Interest Income Growth |
Interest Expense Growth |
Net Interest Income Growth |
Net Interest Margin |
Non-Funded Income Growth |
NFI to Total Operating Income |
Growth in Total Fees & Commissions |
Deposit Growth |
Growth in Government Securities |
Loan to Deposit Ratio |
Loan Growth |
Return on Average Equity |
|
Equity Group |
5.3% |
32.0% |
58.4% |
21.3% |
5.6% |
36.9% |
44.3% |
36.6% |
19.9% |
4.1% |
70.0% |
25.5% |
21.8% |
|
NCBA Group |
14.4% |
21.1% |
35.3% |
11.7% |
6.0% |
(8.0%) |
44.4% |
11.9% |
18.6% |
(2.9%) |
56.3% |
16.0% |
18.4% |
|
KCB Group |
0.4% |
36.4% |
77.9% |
21.6% |
6.8% |
38.7% |
36.1% |
65.7% |
79.6% |
37.5% |
63.3% |
38.1% |
20.2% |
|
SCBK |
11.8% |
28.5% |
(10.0%) |
34.5% |
8.5% |
(6.6%) |
27.9% |
19.0% |
4.5% |
(50.3%) |
48.0% |
5.5% |
22.7% |
|
Absa Bank |
14.9% |
33.5% |
62.2% |
26.0% |
8.8% |
6.4% |
27.0% |
21.2% |
26.1% |
(15.7%) |
93.4% |
14.3% |
25.8% |
|
Coop Bank |
7.6% |
12.9% |
41.3% |
2.5% |
8.4% |
2.1% |
38.5% |
7.8% |
0.2% |
1.5% |
87.3% |
12.8% |
22.3% |
|
Stanbic Holdings |
32.7% |
48.2% |
63.2% |
42.4% |
7.8% |
23.0% |
41.0% |
22.7% |
14.3% |
(41.3%) |
82.1% |
5.9% |
21.4% |
|
I&M Holdings |
14.3% |
27.5% |
41.5% |
18.4% |
6.2% |
21.2% |
35.9% |
16.9% |
30.6% |
14.6% |
71.4% |
24.3% |
15.9% |
|
DTBK |
5.2% |
33.0% |
51.5% |
19.6% |
5.4% |
33.9% |
31.4% |
25.2% |
27.3% |
(4.5%) |
63.2% |
18.7% |
10.0% |
|
HF Group |
283.9% |
20.3% |
19.1% |
21.4% |
5.4% |
20.6% |
32.2% |
38.5% |
12.9% |
10.9% |
87.8% |
9.3% |
5.3% |
|
Q3'23 Mkt Weighted Average* |
11.2% |
29.7% |
47.9% |
21.3% |
7.0% |
17.0% |
37.7% |
27.7% |
24.4% |
(4.3%) |
70.6% |
19.1% |
21.1% |
|
Q3'22 Mkt Weighted Average* |
36.3% |
16.4% |
19.7% |
17.6% |
7.3% |
30.1% |
38.1% |
16.3% |
9.8% |
6.5% |
73.7% |
17.1% |
24.2% |
|
*Market cap weighted as at 22/12/2023 |
|||||||||||||
|
**Market cap weighted as at 02/12/2022 |
|||||||||||||
Key takeaways from the table include:
- The listed banks recorded an 11.2% growth in core Earnings per Share (EPS) in Q3’2023, compared to the weighted average growth of 36.4% in Q3’2022, an indication of sustained performance despite the tough operating environment experienced in 2023 on the back of elevated inflationary pressures. The performance during the period was mainly supported by a 21.3% weighted average growth in net interest income, coupled with a 17.0% weighted average growth in non-funded income,
- Investments in government securities by listed banks reduced significantly in Q3’2023, having recorded a market weighted average decline of 4.3%, a reversal from the 6.5% growth recorded in Q3’2022. The declining investment in Kenya government securities is partly attributable to the increased perceived risk of default by the government, mainly on the back of high debt sustainability concerns given the current high public debt stock as well as the impending Eurobond maturity in June 2024,
- The listed banks’ Net loans and advances to customers recorded a weighted average growth of 19.1% in Q3’2023, an increment from the 17.1% growth recorded in Q3’2022, an indication of increased lending despite the elevated credit risk following the continued implementation of risk-based lending by the banks,
- Interest income recorded a weighted average growth of 29.7% in Q3’2023, compared to 16.4% in Q3’2022. Similarly, interest expenses recorded a market weighted average growth of 47.9% in Q3’2023 compared to a growth of 19.7% in Q3’2022. Consequently, net interest income recorded a weighted average growth of 21.3% in Q3’2022, an increment from the 17.6% growth recorded over a similar period in 2022, and,
- The listed banks recorded a 21.1% weighted average growth on return on average equity (RoaE), 3.1% points lower than the 24.2% growth registered in Q3’2022. Additionally, the entire banking sector’s Return on Equity (ROE) stood at 25.4%, 1.8% points decrease from the 27.2% recorded in Q3’2022. On a global level, the Kenyan banking sector continues to record high profitability compared to other economies in the world, as highlighted in the chart below:
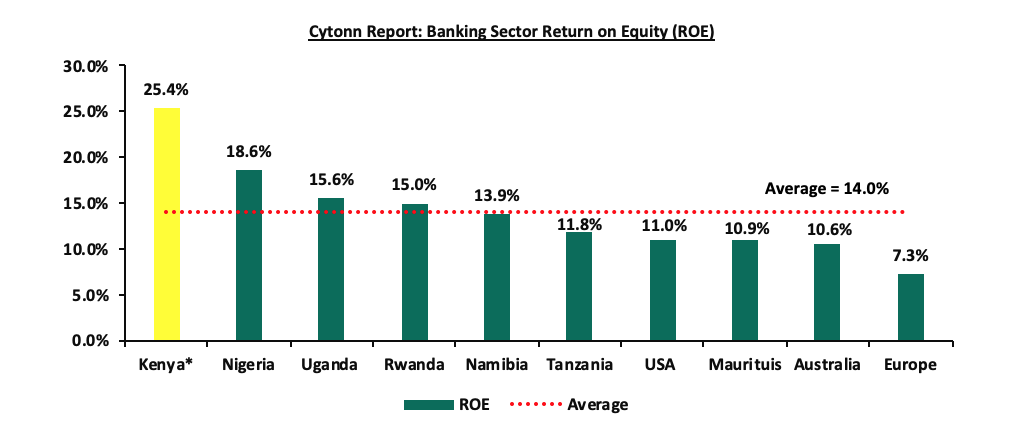
For more information, see our Kenya Listed Banks Q3’2023 Report.
- Insurance Sector Earnings:
During the year, Kenya listed insurers released their H1’2023 results, recording a weighted average increase in core earnings per share of share 19.8%, compared to a weighted average increase of 16.0% in H1’2022. The table below highlights the performance of the listed insurance sector, showing the performance using several metrics, and the key take-outs of the performance;
|
Cytonn Report: Listed Insurance Companies H1’2023 Earnings and Growth Metrics |
||||||||
|
Insurance Company |
Core EPS Growth |
Insurance Revenue Growth |
Loss ratio |
Expense Ratio |
Combined Ratio |
ROACE |
ROaA |
ROaE |
|
Britam Holdings |
334.5% |
33.8% |
66.1% |
71.4% |
137.5% |
9.7% |
1.0% |
2.0% |
|
CIC Group |
168.2% |
19.9% |
70.6% |
50.4% |
121.1% |
23.2% |
1.4% |
7.7% |
|
Jubilee Holdings |
(47.8%) |
11.4% |
114.5% |
38.5% |
153.0% |
16.5% |
1.1% |
4.3% |
|
Liberty Holdings |
(760.0%) |
(151.2%) |
61.9% |
71.2% |
133.1% |
7.5% |
0.5% |
2.4% |
|
Sanlam Kenya |
(1794.0%) |
(8.8%) |
89.2% |
40.8% |
130.0% |
60.5% |
(0.5%) |
(18.1%) |
|
H1'2023 Weighted Average |
19.8% |
9.7% |
86.6% |
54.2% |
140.8% |
15.9% |
1.0% |
3.1% |
|
H1'2022 Weighted Average |
16.0% |
1.7% |
83.4% |
43.4% |
126.8% |
10.5% |
2.2% |
2.2% |
|
*Market cap weighted as at 27/10/2023 |
||||||||
|
**Market cap weighted as at 09/06/2022 |
||||||||
The key take-outs from the above table include;
- Core EPS growth recorded a weighted growth of 19.8% in H1’2023, compared to a weighted growth of 16.0% in H1’2022. The sustained growth in earnings was attributable to the improved profitability owing to the increased insurance revenue despite the tough operating environment occasioned by the elevated inflationary pressures as well as the depreciation of the Kenyan currency against the dollar,
- The insurance revenue grew at a faster pace of 9.7% in H1’2023, compared to a growth of 1.7% in H1’2022,
- The loss ratio across the sector increased slightly to 86.6% in H1’2023 from 83.4% in H1’2022,
- The expense ratio increased to 54.2% in H1’2023, from 43.4% in H1’2022, owing to an increase in operating expenses, a sign of reduced efficiency,
- The insurance core business still remains unprofitable, with a combined ratio of 140.8% as at H1’2023, compared to 126.8% in H1’2022, and,
- On average, the insurance sector delivered a Return on Average Equity (ROaE) of 3.1%, an increase from a weighted Return on Average Equity of 2.2% in H1’2022.
For more information, see our Kenya H1’2023 Listed Insurance Report.
Other Key Results
Safaricom Limited released the H1’2024 results, recording an increase in core earnings per share of 10.0% to Kshs 0.9 in H1’2024, from Kshs 0.8 in H1’2023. The increase was largely attributable to a 9.9% increase in mobile service revenue to Kshs 151.8 bn from Kshs 138.1 bn recorded in H1’2023, with its Ethiopian subsidiary contributing Kshs 2.0 bn of this revenue, representing 1.3% of the group’s total mobile service revenue. The Ethiopian subsidiary recorded a total revenue of Kshs 2.9 bn, with service revenue coming at Kshs 2.1 bn and operating cost at Kshs 10.5 bn leading to a loss after tax of Kshs 14.4 bn which weighed down on the group’s overall performance.
During the year, 15 companies issued profit warnings to investors, compared to 11 companies in 2022 and 4 companies in 2021. The increased in number of companies that issued profit warning in 2023 is an indication of tough economic conditions brought about by the continued depreciation of the Kenyan Shilling against other global currencies. The situation was made worse by the reduction in purchasing power of consumers occasioned by the high cost of living and increased taxes in addition to disruption of the global supply chain due to the challenging geopolitics resulting in high production costs. Companies are required to issue profit warnings if they project a more than 25.0% decline in profits year-on-year. Below is the summary of the said companies:
|
Cytonn Report: Companies that issued profit warnings |
|||
|
No |
2023 |
2022 |
2021 |
|
1 |
Car & General |
Bamburi Cement PLC |
Centum Plc |
|
2 |
Centum Plc |
Centum Investments Co Plc |
Umeme Limited |
|
3 |
Crown Paints Kenya |
Crown Paints Kenya PLC |
Williamson Tea Kenya PLC |
|
4 |
Eveready |
Flame Tree Group Holdings Ltd |
WPP ScanGroup PLC |
|
5 |
Express Kenya |
Kakuzi Plc |
|
|
6 |
Kakuzi Plc |
Liberty Kenya Holdings Ltd |
|
|
7 |
Kenya Airways |
Nairobi Securities Exchange PLC |
|
|
8 |
KPLC |
Sameer Africa plc |
|
|
9 |
Longhorn Publishers Plc |
Sanlam Plc |
|
|
10 |
Nation Media Group |
The Limuru Tea Kenya Plc |
|
|
11 |
Sameer Africa Plc |
|
|
|
12 |
Sanlam Plc |
|
|
|
13 |
Sasini Plc |
|
|
|
14 |
Unga Plc |
|
|
|
15 |
WPP Scan Group |
|
|
The key highlights from the tale include:
- Eveready E.A. Plc was the first company in 2023 to issue a profit warning ahead of the release of its financials for the year ended 30th September 2022, indicating that the expected decline in earnings was due to the impact of the derecognition of the deferred tax asset in the amount of Kshs 38.0 mn,
- Kenya Airways Plc issued a profit in January 2023 ahead of the release of its financials for the year ended 31st December 2022 indicating that the expected decline in its net profits was mainly due to forex losses occasioned by the novation of the guaranteed USD loans as part of an ongoing restructuring program,
- Kenya Power & Lighting Company Limited issued a profit warning in May 2023 ahead of the release of its financials for the year ended 30th June 2023 noting that the expected decline in its earnings was mainly due to increased foreign exchange losses arising from continued weakening of the Kenyan Shilling against world major currencies, along with partial impact of 15.0% reduction of the end user electricity tariff,
- Longhorn Publishers Plc issued a profit warning in June 2023 stating that the expected decline in its half-year profit was due to rising costs of paper which increased by 75.0% in the preceding 12 months, currency depreciation, lifting of the interest rate restrictions in the second half of the financial year, shrinkage of consumer wallets arising from the high cost of living and general business slowdown in the election period,
- Unga Group Plc issued a profit warning in June 2023 ahead of release of its half-year financials. The decline in its earnings was mainly due to scarcity of locally sourced raw materials which led to increased importation at higher global prices which led to increased production costs that could not be fully passed to the consumers,
- Centum Investments Co Plc issued a profit warning for the financial year ended 31st March 2023, indicating that the expected decline in net profit was attributable to the impact by impairment provisions relating to business operations of Two Rivers Development Limited, a 58.0% owned subsidiary; its notable that Centum has issued a profit warning every year for the last 3 years,
- Nation Media Group Plc issued a profit warning in October 2023 indicating the expected decline in its earnings was mainly due to relentless increases in prices of basic commodities, drastic increases in fuel prices, runaway depreciation of the Kenyan shilling, rising interest rates and higher taxes,
- Sasini Plc issued a profit warning statement in November for the financial period ended 30th September 2023, noting that the company performance was impacted by the high costs of production due to unplanned escalation of input costs, severe drought in the early months of the year, and lower coffee and macadamia prices,
- Car & General Kenya Plc issued a profit warning indicating that the expected decline in its earnings was largely attributable to foreign exchange losses on USD exposures, a deterioration of unit economics of motorcycles which negatively impacted sales of motorcycles in Kenya, increased finance costs and demurrage costs in Tanzania,
- Crown Paints Kenya Plc also issued a profit warning indicating that the expected decline in earnings is mainly attributable to the increased cost of raw materials, increased transport costs and volatility in foreign exchange rates, and a slowdown in economic activities during the year,
- WPP ScanGroup Ltd issued a profit warning in November 2023 for the financial year ending 31st December 2023, indicating the expected decline in its earnings is mainly due to the company’s comprehensive restructuring program to right size the cost base and reshaping staff structure which led to a one-off severance cost of Kshs 178 mn and the subdued economic environment
- Sameer Africa Plc also issued a profit warning indicating that the expected decline in earnings is mainly attributable to the continued depreciation of the Kenyan shilling against major currencies which has occasioned exchange losses from the company’s foreign currency liabilities,
- Sanlam Kenya Plc also issued a profit warning in December for the year ending 31st December 2023 indicating that the expected decline in earnings is mainly attributable to the prevailing high interest rates leading to increased finance costs and unrealized fair value losses on their portfolio of government securities
- Express Kenya Plc also issued a profit warning for the financial year ending 31st December 2023, indicating that the expected decline in earnings is mainly attributable to the decrease in demand for the warehousing operations and low economic activities occasioned by the tough economic environment during the year,
- Kakuzi Plc also issued a profit warning for the financial year 2023, indicating that the expected decline in earnings is mainly a result of the Macadamia business which is expected to post a loss due to significant decline in demand and price in the global markets of China, Japan and the USA
Below is a summary of the number of companies that issued profit warnings over the last 8 years:
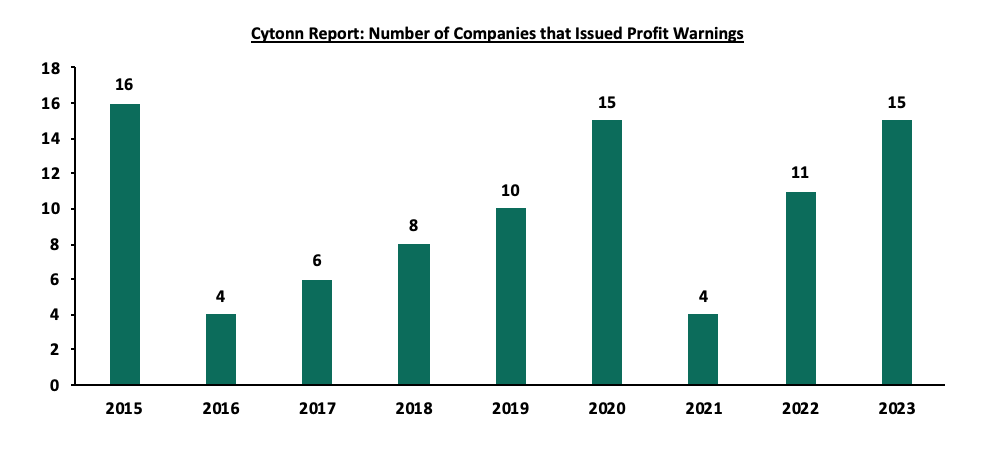
Source: Cytonn Research, NSE
- Listings and Suspensions
In March 2023, the Nairobi Securities Exchange officially listed the Local Authority Pension Trust (LAPTRUST) Imara Income Real Estate Investment Trust (I-REIT) under the Restricted Sub-Segment after the Capital Markets Authority approved the listing in November 2022. The trust opened trading at Kshs 20.0 and sought to offer pension investors the opportunity to invest in income-generating Real Estate assets, for more information about the approval, please see our Cytonn Weekly #12/2023. During the year, four companies remained suspended, namely, Deacons (East Africa) PLC, ARM Cement PLC, Mumias Sugar Co. Ltd., and Kenya Airways. The chart below shows the number of listed companies in the Nairobi Securities Exchange for the period 2010-2023:
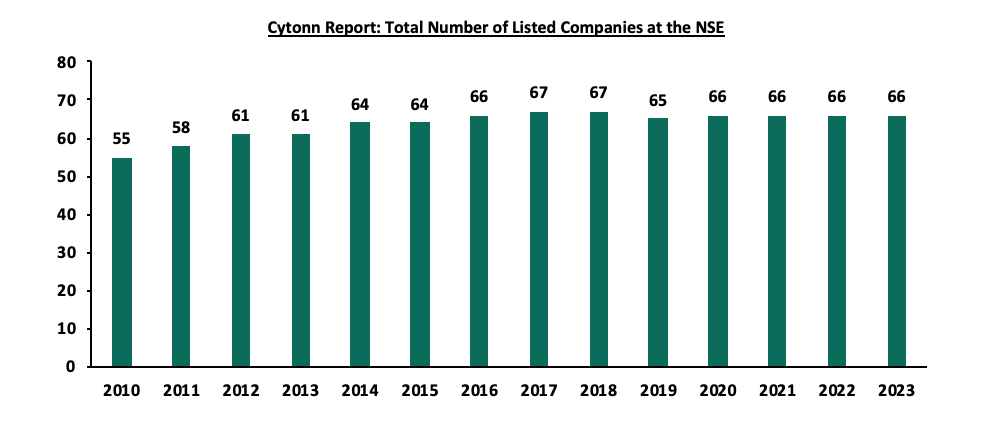
Source: CMA Quarterly Statistical Bulletins
- Liquidations
-
- During the year, just like in 2022, there were no liquidations, announced by the Central Bank. Data from the office of the official receiver, however, shows that 98 insolvencies were filed between January and October this year by debtors and courts. In the insurance sector, the Insurance Regulatory Authority (IRA), announced that Xplico Insurance Company had been placed under statutory management by the Commissioner of Insurance, following continued challenges by the insurer to meet its obligations such as settling claims to claimants, policyholders and other creditors, coupled with failure to mitigate inherent risks. The regulator appointed the Policyholders Compensation Fund (PCF) as the Statutory Manager of Resolution Insurance Company for a period of 12 months, commencing 8th December 2023. The authority also approved the takeover of Invesco Assurance Company Limited by the official receiver for the purpose of liquidation effective 8th December 2023.
- Legislation and other Developments
During the year, there were legislative changes and other developments that affected the equities market and investor sentiments, namely;
- Capital Markets (Amendment) Bill, 2023- In November 2023, parliament’s Finance and Investments Committee approved MP Abraham Kirwa’s Capital Market (Amendment) Bill for publication. The Bill aims to bring digital currency within the scope of the Capital Markets Act and address challenges posed by the unregulated digital currency market in the country. Key highlights include;
- Definition of Digital Currencies: The bill provides lucid definitions for terms related to digital currencies, recognizing the central role of blockchain technology. It classifies digital currencies as representations of value lacking legal currency status, proposing an amendment to include them in the definition of securities under the Act,
- Licensing Requirements: Individuals aspiring to introduce new cryptocurrency products must secure a license from the Capital Markets Authority (CMA). The stringent criteria include a mandatory minimum product development period of two years and testing on a customer base of at least 10,000
- Taxation Framework: The bill outlines clear responsibilities for individuals engaged in trading digital currencies, mandating the maintenance of transaction records and the payment of taxes on gains. It establishes that income tax laws apply for holdings up to twelve months, while capital gains tax laws come into play for longer durations, and,
- Registration of Digital Currencies: The proposed centralized electronic register for tracking digital currency transactions aims to enhance transparency and prevent fraud. However, there's a suggestion to explore the utilization of blockchain technology as a more practical and secure alternative.
- Privatization Act 2023- In October 2023, the government published the privatization act of 2023 which sought to address the long processes of approval of State owned Entities for privatization and provide a new framework for the process. Key highlights from the Act include:
- Establishment of the Privatization Authority: The new authority shall be responsible for advising the government on aspects of the privatization of SOEs as well as the implementation of the privatization programme. The authority will be headed by a chairperson appointed by the President,
- Privatization programme: A new programme shall be formulated by the Cabinet Secretary for the National Treasury and approved by the cabinet, specify the SOEs identified and approved for privatization and serve as the basis point upon which privatization shall be undertaken,
- Identification of entities for privatization: The Cabinet Secretary for the National Treasury shall identify and determine the entities to be included in the privatization programme, taking into consideration the need to avoid privatization that may result in an unregulated monopoly, the expected benefits to be gained from the privatization and sustainable development and protection of the economy,
- Approval of the privatization proposal: Upon preparation of the privatization proposal, the authority, with the concurrence of the Cabinet Secretary for the National Treasury, shall approve it. This is a major change from the current process, which entails different levels of approval, including consideration and approval by the parliament. Under the proposed bill, the privatization authority will have the sole power to identify a public entity for privatization, prepare the privatization proposal, and approve it, thus removing ambiguity with respect to the role and functions of parliament,
- Methods of Privatization: The bill proposes three methods of privatization;
-
-
- Through the initial public offering of shares which shall be undertaken in accordance with the Capital Markets Act,
- Through sell of shares by public tendering, a new method proposed in the bill will involve publishing the notice of invitation to tender on the sale of shares in the Government tenders’ portals or on the Authority’s website and in at least two newspapers of nationwide circulation. Upon closure of the tendering period, the tender evaluation committee shall prepare an evaluation report containing a summary of the evaluation and comparison of tenders which shall be approved by the Board with the concurrence of the Cabinet Secretary for the National Treasury, and,
- Through sale resulting from the exercise of pre-emptive rights.
-
- Block Trades Rules Amendment- In February 2023, the Nairobi Securities Exchange announced amendments to its Trading Rules to allow for Block Trades following approval by the Capital Markets Authority. The key takeaways from this announcement included that:
- Establishment of Block Trades Board: A dedicated board, named the Block Trades Board, will be created for the recording of all Block Trades,
- Definition of Block Trades: Block trades shall constitute the sale of shares whose value: exceeds Kshs 3.0 bn in value and constitute 5.0% or more of an Issuer’s total issued shares subject to a maximum of 25.0%; or less than Kshs 3.0 bn in value and which constitutes more than 15.0% of an Issuer’s total issued shares subject to a maximum of 25.0%,
- Timeframe for Block Transaction Trades: Block Transaction trades must be completed within a 30.0% range based on the average price of the relevant security for the last one month, starting from the date of execution,
- Approval of transactions outside the 30% range: If a Block Transaction falls outside the 30.0% range specified in Rule 6.5.3.3, the Trading Participant(s) must obtain approval from the NSE before executing the transaction in the Automated Trading System (ATS), and,
- Settlement options for Block Transactions: Block transactions may be settled "Free of Payment." In cases where parties agree to settle in this manner, their consent must be submitted to the Central Depository and Settlement Corporation (CDSC) for processing before concluding the transaction.
- Share purchase and consolidation
During the year, consolidation activity remained one of the key highlights witnessed in 2022, as players in the sector were either acquired or merged, leading to the formation of relatively larger, well capitalized, and possibly more stable entities. The following were some of the major M&A’s activities witnessed during the year.
- In January 2023, Equity Bank Kenya Limited announced the acquisition of certain assets and liabilities of Spire Bank Limited (Spire), following approval by the Central Bank of Kenya and the Cabinet Secretary for the National Treasury and Planning. These assets included approximately 20,000 deposit customers holding deposits of Kshs 1.3 bn and 3,700 loan customers with outstanding loan balances at Kshs 1.7 bn, with a net carrying value of Kshs 0.9 bn after adjusting for statutory loan loss provisions of Kshs 0.8 bn. Click here for more information,
- In January 2023, Commercial International Bank (Egypt) announced the acquisition of 49.0% of the shareholding of Mayfair CIB Bank Limited (MBL), following approval by the CBK and the Cabinet Secretary for the National Treasury and Planning. This transaction followed the earlier acquisition by CIB of 51.0% shareholding in MBL announced in April 2020. Subsequently, MBL is now a fully owned (100.0 %) subsidiary of CIB,
- In March 2023, Premier Bank Limited announced the acquisition of 62.5% of the shareholding of First Community Bank Limited (FCB), following approval by the CBK and the Cabinet Secretary for the National Treasury and Planning. The bank has 18 branches, spread across the country, and specializes in provision of Shariah compliant banking services,
- In May 2023, Cactus Cantina Investments Limited announced the acquisition of 55.8% shareholding of Maisha Microfinance Bank Limited (Maish MFB) following approval by the CBK and the Cabinet Secretary for the National Treasury and Planning,
- In May 2023, Shorecap III, LP (Shorecap) announced the acquisition of a 20.0% shareholding in Credit Bank Plc effective June 15, 2023 following the CBK’s approval. Credit Bank Plc has 17 branches across the country and specializes in providing banking services to small corporates and micro, small, and medium-sized enterprises (SMEs). It has a market share of 0.5%, and,
- In November 2023, Hope Advancement Plc, a subsidiary of the Delaware-based Hope International Inc., announced the acquisition of 51.0% of the shareholding at SMEP Microfinance Bank Plc following approval by the Central Bank and the Cabinet Secretary for the National Treasury and Planning. Prior to the acquisition, the National Council of Churches held 71.0% of SMEP MFB’s shares. The institution controls 5.1% of the microfinance banking sector.
Below is a summary of the deals in the last 9 years that have either happened, been announced or expected to be concluded:
|
Cytonn Report: Banking Sector Deals and Acquisitions |
||||||
|
Acquirer |
Bank Acquired |
Book Value at Acquisition (Kshs bn) |
Transaction Stake |
Transaction Value (Kshs bn) |
P/Bv Multiple |
Date |
|
Equity Group |
Cogebanque PLC ltd |
5.7 |
91.1% |
6.7 |
1.3x |
Jun-23 |
|
Shorecap III |
Credit Bank Plc |
3 |
20.0% |
Undisclosed |
N/A |
Jun-23 |
|
Premier Bank Limited |
First Community Bank |
2.8 |
62.5% |
Undisclosed |
N/A |
Mar-23 |
|
KCB Group PLC |
Trust Merchant Bank (TMB) |
12.4 |
85.0% |
15.7 |
1.5x |
Dec-22 |
|
Equity Group |
Spire Bank |
Unknown |
Undisclosed |
Undisclosed |
N/A |
Sep-22* |
|
Access Bank PLC (Nigeria)* |
Sidian Bank |
4.9 |
83.4% |
4.3 |
1.1x |
June-22* |
|
KCB Group |
Banque Populaire du Rwanda |
5.3 |
100.0% |
5.6 |
1.1x |
Aug-21 |
|
I&M Holdings PLC |
Orient Bank Limited Uganda |
3.3 |
90.0 0% |
3.6 |
1.1x |
Apr-21 |
|
KCB Group** |
ABC Tanzania |
Unknown |
100.0% |
0.8 |
0.4x |
Nov-20* |
|
Co-operative Bank |
Jamii Bora Bank |
3.4 |
90.0% |
1 |
0.3x |
Aug-20 |
|
Commercial International Bank |
Mayfair Bank Limited |
1 |
51.0% |
Undisclosed |
N/A |
May-20* |
|
Access Bank PLC (Nigeria) |
Transnational Bank PLC. |
1.9 |
100.0% |
1.4 |
0.7x |
Feb-20* |
|
Equity Group ** |
Banque Commerciale Du Congo |
8.9 |
66.5% |
10.3 |
1.2x |
Nov-19* |
|
KCB Group |
National Bank of Kenya |
7 |
100.0% |
6.6 |
0.9x |
Sep-19 |
|
CBA Group |
NIC Group |
33.5 |
53%:5% |
23 |
0.7x |
Sep-19 |
|
Oiko Credit |
Credit Bank |
3 |
22.8% |
1 |
1.5x |
Aug-19 |
|
CBA Group** |
Jamii Bora Bank |
3.4 |
100.0% |
1.4 |
0.4x |
Jan-19 |
|
AfricInvest Azure |
Prime Bank |
21.2 |
24.2% |
5.1 |
1.0x |
Jan-18 |
|
KCB Group |
Imperial Bank |
Unknown |
Undisclosed |
Undisclosed |
N/A |
Dec-18 |
|
SBM Bank Kenya |
Chase Bank Ltd |
Unknown |
75.0% |
Undisclosed |
N/A |
Aug-18 |
|
DTBK |
Habib Bank Kenya |
2.4 |
100.0% |
1.8 |
0.8x |
Mar-17 |
|
SBM Holdings |
Fidelity Commercial Bank |
1.8 |
100.0% |
2.8 |
1.6x |
Nov-16 |
|
M Bank |
Oriental Commercial Bank |
1.8 |
51.0% |
1.3 |
1.4x |
Jun-16 |
|
I&M Holdings |
Giro Commercial Bank |
3 |
100.0% |
5 |
1.7x |
Jun-16 |
|
Mwalimu SACCO |
Equatorial Commercial Bank |
1.2 |
75.0% |
2.6 |
2.3x |
Mar-15 |
|
Centum |
K-Rep Bank |
2.1 |
66.0% |
2.5 |
1.8x |
Jul-14 |
|
GT Bank |
Fina Bank Group |
3.9 |
70.0% |
8.6 |
3.2x |
Nov-13 |
|
Average |
|
|
75.0% |
|
1.3x |
|
|
Average: 2013 to 2018 |
|
|
73.5% |
|
1.7x |
|
|
Average: 2019 to 2023 |
|
|
75.8% |
|
0.9x |
|
|
* Announcement Date ** Deals that were dropped |
||||||
Universe of coverage:
|
Cytonn Report: Equities Universe of Coverage |
|||||||||||
|
Company |
Price as at 22/12/2023 |
Price as at 29/12/2023 |
w/w change |
m/m change |
YTD Change |
Year Open 2023 |
Target Price* |
Dividend Yield |
Upside/ Downside** |
P/TBv Multiple |
Recommendation |
|
Liberty Holdings |
3.7 |
3.7 |
0.0% |
3.7% |
(26.8%) |
5.0 |
5.9 |
0.0% |
60.4% |
0.3x |
Buy |
|
Kenya Reinsurance |
1.7 |
1.9 |
8.0% |
6.8% |
0.5% |
1.9 |
2.5 |
10.6% |
54.9% |
0.2x |
Buy |
|
Sanlam |
6.7 |
6.0 |
(11.0%) |
(11.8%) |
(37.4%) |
9.6 |
10.3 |
0.0% |
52.7% |
1.7x |
Buy |
|
KCB Group*** |
21.9 |
21.9 |
0.2% |
16.2% |
(42.9%) |
38.4 |
31.2 |
9.1% |
51.9% |
0.4x |
Buy |
|
Jubilee Holdings |
182.0 |
185.0 |
1.6% |
1.1% |
(6.9%) |
198.8 |
260.7 |
6.5% |
49.7% |
0.3x |
Buy |
|
ABSA Bank*** |
11.2 |
11.5 |
2.2% |
3.2% |
(6.1%) |
12.2 |
14.6 |
11.8% |
42.1% |
0.9x |
Buy |
|
I&M Group*** |
17.5 |
17.5 |
0.0% |
0.3% |
2.6% |
17.1 |
22.1 |
12.9% |
39.1% |
0.4x |
Buy |
|
Co-op Bank*** |
11.1 |
11.4 |
3.2% |
0.0% |
(5.8%) |
12.1 |
13.8 |
13.2% |
38.0% |
0.5x |
Buy |
|
Equity Group*** |
34.0 |
33.7 |
(1.0%) |
(7.8%) |
(25.3%) |
45.1 |
42.8 |
11.9% |
37.8% |
0.7x |
Buy |
|
Stanbic Holdings |
105.3 |
108.8 |
3.3% |
6.6% |
6.6% |
102.0 |
132.8 |
11.6% |
37.8% |
0.8x |
Buy |
|
Diamond Trust Bank*** |
46.5 |
45.1 |
(3.1%) |
2.0% |
(9.6%) |
49.9 |
58.5 |
11.1% |
36.9% |
0.2x |
Buy |
|
NCBA*** |
40.0 |
39.0 |
(2.6%) |
0.1% |
0.0% |
39.0 |
48.3 |
10.9% |
31.7% |
0.8x |
Buy |
|
Standard Chartered*** |
160.3 |
162.0 |
1.1% |
2.7% |
11.7% |
145.0 |
185.5 |
13.6% |
29.3% |
1.1x |
Buy |
|
CIC Group |
2.2 |
2.2 |
4.2% |
(8.6%) |
17.3% |
1.9 |
2.5 |
5.8% |
22.1% |
0.7x |
Buy |
|
Britam |
5.1 |
4.8 |
(6.1%) |
(6.1%) |
(7.9%) |
5.2 |
6.0 |
0.0% |
17.1% |
0.7x |
Accumulate |
|
HF Group |
3.5 |
3.5 |
0.0% |
(3.3%) |
10.5% |
3.2 |
3.9 |
0.0% |
12.1% |
0.2x |
Accumulate |
|
Target Price as per Cytonn Analyst estimates **Upside/ (Downside) is adjusted for Dividend Yield ***For Disclosure, these are stocks in which Cytonn and/or its affiliates are invested in |
|||||||||||
We are “Neutral” on the Equities market in the short term due to the current adverse operating environment and huge foreign investor outflows, and, “Bullish” in the long term due to current cheap valuations and expected global and local economic recovery.
With the market currently trading at a discount to its future growth (PEG Ratio at 0.7), we believe that investors should reposition towards value stocks with strong earnings growth and that are trading at discounts to their intrinsic value. We expect the current high foreign investors sell-offs to continue weighing down the economic outlook in the short term.
In 2023, the general Real Estate sector witnessed considerable growth in activity in terms of property transactions and development activities. Consequently, the sector’s activity contribution to Gross Domestic Product (GDP) grew by 5.4% to Kshs 785.9 bn in Q3’2023, from Kshs 743.4 bn recorded during the same period in 2022. In addition, the sector contributed 10.5% to the country’s GDP, a 0.5% increase from 10.0% recorded in Q2’2023. Cumulatively, the Real Estate and construction sectors contributed 16.6% to GDP, a 1.1% improvement from 15.5% in Q2’2023, evidencing their growing contribution to Kenya's economy. The graph below highlights the Real Estate and Construction sectors’ contribution to GDP from Q1’2022 to Q3’2023;
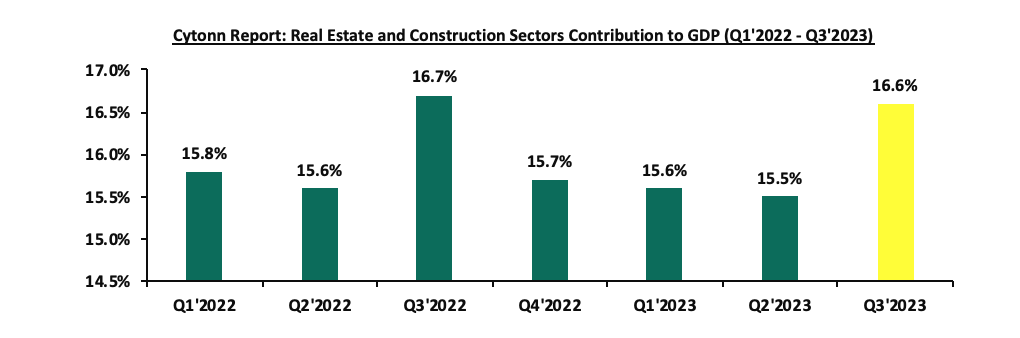
Source: Kenya National Bureau of Statistics (KNBS)
Additionally, the escalation of selling and rental prices persisted, propelled by ongoing inflationary pressures and a depreciated shilling against the United States dollar, leading to an increase in the costs of construction materials. Some of the key factors that continued to positively shape the performance of the Real Estate sector include;
- Continued focus by both the government and the private sector to provide decent housing to Kenyans through the Affordable Housing Program (AHP). Currently, the AHP pipeline boasts an estimated total of 838,876 housing units under construction by both the government and private sector. This is according to the Architectural Association of Kenya (AAK’s) Status of the Built Environment Report 2023,
- The government has continued to make efforts to provide affordable mortgages through the Kenya Mortgage Refinance Company (KMRC) aimed at making home ownership more accessible to Kenyans. This is through offering sustainable financing to Primary Mortgage Lenders (PMLs) such as banks and SACCOs,
- Implementation of various infrastructure projects, such as the Kenol-Marua Highway, Dongo Kundu Bypass project, Makupa Bridge project among others which are aimed at improving the country's economic status. These have opened up new areas for investment, thereby boosting the performance of the Real Estate sector,
- The retail sector has continued to grow, with both local and international retailers such as Naivas, QuickMart and Carrefour pursuing aggressive expansion strategies in a bid to increase their dominance in the market, and replace distressed and exited retailers such as Choppies, Nakumatt, Tuskys, and Uchumi,
- The hospitality sector has seen resumed investor confidence evidenced by positive volumes in hotel mergers and acquisitions. Furthermore, the number of international arrivals into the country registered a 28.7% year-to-year (y/y) increase to 1,238,330 persons as at October 2023, from 962,157 persons recorded during a similar period last year,
- Kenya enjoys positive national demographics, with relatively high urbanization and population growth rates of 3.7% p.a and 1.9% p.a, respectively, against the global average of 1.5% p.a and 0.8% p.a, respectively, as at 2022, that continue to drive demand for Real Estate developments upwards, and,
- Foreign entities have continued to open business operations in Kenya, boosting the demand for both commercial and residential Real Estate. Increased business activity has driven up demand for office space, apartments, and housing near business hubs, leading to development of new projects, increased property values, and job creation in the construction sector.
Despite the above cushioning factors, there were various challenges that impeded the optimum performance of the Real Estate sector such as;
- In 2023, construction costs increased by 27.0% to an average of Kshs 71,200 per SQM from an average of Kshs 56,075 per SQM recorded in 2022. The rise is primarily due to the hike in prices of key construction materials such as cement, steel, paint, aluminum, and PVC on the back of rising inflation. These higher costs are expected to impede development activities in the sector,
- Existing oversupply of physical space in select sectors, with approximately 5.8 mn SQFT in the NMA commercial office market, approximately 3.0 mn SQFT in the Nairobi Metropolitan Area (NMA) retail market, with the rest of the Kenyan retail market having an oversupply of approximately 1.7 mn SQFT. This has led to prolonged vacancy rates in the respective Real Estate sectoral themes,
- The REITs market in Kenya continues to be subdued owing to various challenges such as the large capital requirements of Kshs 100.0 mn for trustees which limits the role to banks, prolonged approval process for REITs, only a few entities capable of incorporating REITs, high minimum investment amounts set at Kshs 5.0 mn which discourage investments and lack of adequate knowledge of the financial asset class by investors, and,
- Tough microeconomic conditions in the country including high inflation and rising interest rates, have led to eroded purchasing power and expensive borrowing respectively. This impacts the Real Estate sector negatively as developers enjoy less profit margins due to the inflated construction costs. Additionally, increased interest rates make borrowing more expensive, further dampening demand for mortgages and lending to developers. The table below shows the annual Real Estate rental yields for existing properties from FY’2017 to FY’2023;
|
Cytonn Report: Annual Real Estate Rental Yields Summary Table, for Existing Properties |
||||||||
|
|
FY’2017 |
FY’2018 |
FY’2018 |
FY’2020 |
FY’2021 |
FY’2022 |
FY’2023 |
Y/Y Change (% Points) |
|
Average Rental Yield |
7.6% |
7.4% |
7.0% |
6.1% |
6.5% |
6.8% |
7.5% |
0.7% |
Source: Cytonn Research
Sectoral Market Performance
- Residential Sector
During FY’2023, the NMA residential sector recorded a slight downtrend in performance, with the average total returns to investors coming in at 6.1%, a 0.1%-point decline from 6.2% recorded in FY’2022. The performance was attributed to a decrease in the residential average y/y price appreciation which came in at 0.5% in FY’2023, 0.6%-points lower than the 1.1% appreciation recorded in FY’2022, driven by slowed property transactions during the year. On the other hand, the average rental yield came in at 5.5% in FY’2023, recording a 0.4%-points uptick from the 5.1% rental yield recorded in FY’2022. This was driven by an increase in the average rent per SQM by 10.9% to Kshs 599, from Kshs 540 recorded in FY’2022, as landlords sought to cover increased expenses. The table below shows the NMA residential sector’s performance during FY’2023 and FY’2022;
All values in Kshs unless stated otherwise
|
Cytonn Report: Nairobi Metropolitan Area (NMA) Residential Sector Summary - FY’2023/FY’2022 |
|||||||||||
|
Segment |
Average of Price per SQM FY'2023 |
Average of Rent per SQM FY'2023 |
Average of Rental Yield FY'2023 |
Average of Price Appreciation FY'2023 |
Average of Total Returns FY'2023 |
Average of Rental Yield FY'2022 |
Average of Price Appreciation FY'2022 |
Average of Total Returns FY'2022 |
y/y ∆ in Rental Yield |
y/y ∆ in Price Appreciation |
y/y ∆ in Total Returns |
|
Detached Units |
|||||||||||
|
High End |
190,489 |
891 |
5.4% |
0.4% |
5.8% |
4.6% |
1.4% |
5.9% |
0.8% |
(1.0%) |
(0.1%) |
|
Upper Middle |
148,592 |
764 |
5.4% |
0.3% |
5.7% |
4.5% |
1.1% |
5.6% |
0.9% |
(0.8%) |
0.1% |
|
Lower Middle |
78,588 |
358 |
5.3% |
0.8% |
6.1% |
5.0% |
1.0% |
6.0% |
0.2% |
(0.2%) |
0.1% |
|
Detached Units Average |
139,223 |
671 |
5.3% |
0.5% |
5.8% |
4.7% |
1.1% |
5.8% |
0.6% |
(0.6%) |
0.0% |
|
Apartments |
|||||||||||
|
Upper Mid- End |
124,379 |
665 |
5.7% |
0.1% |
5.8% |
5.4% |
0.5% |
5.9% |
0.3% |
(0.4%) |
(0.1%) |
|
Lower Mid- End Suburbs |
93,101 |
490 |
5.8% |
0.8% |
6.6% |
5.5% |
1.1% |
6.6% |
0.3% |
(0.3%) |
0.0% |
|
Lower Mid-End Satellite Towns |
81,339 |
427 |
5.6% |
0.9% |
6.5% |
5.5% |
1.4% |
6.9% |
0.1% |
(0.5%) |
(0.4%) |
|
Apartments Average |
99,606 |
527 |
5.7% |
0.6% |
6.3% |
5.5% |
1.0% |
6.5% |
0.2% |
(0.4%) |
(0.2%) |
|
Residential Market Average |
119,415 |
599 |
5.5% |
0.5% |
6.1% |
5.1% |
1.1% |
6.2% |
0.4% |
(0.6%) |
(0.1%) |
Source: Cytonn Research
- Detached Units Performance
The table below shows the NMA residential sector detached units’ performance during FY’2023;
All values in Kshs unless stated otherwise
|
Cytonn Report: Residential Detached Units Summary FY’2023 |
||||||||
|
Area |
Average of Price per SQM FY'2023 |
Average of Rent per SQM FY'2023 |
Average of Occupancy FY'2023 |
Average of Uptake FY'2023 |
Average of Annual Uptake FY'2023 |
Average of Rental Yield FY'2023 |
Average of Price Appreciation FY'2023 |
Total Returns |
|
High End |
||||||||
|
Karen |
185,566 |
1,140 |
84.1% |
90.4% |
12.7% |
6.6% |
(0.1%) |
6.5% |
|
Kitisuru |
211,531 |
845 |
93.8% |
93.8% |
11.7% |
5.1% |
1.1% |
6.2% |
|
Lower Kabete |
152,433 |
603 |
95.8% |
95.3% |
12.7% |
4.6% |
1.0% |
5.6% |
|
Runda |
225,353 |
995 |
94.6% |
96.8% |
9.9% |
5.1% |
0.2% |
5.3% |
|
Rosslyn |
177,560 |
871 |
91.7% |
98.2% |
12.0% |
5.4% |
(0.3%) |
5.1% |
|
Average |
190,489 |
891 |
92.0% |
94.9% |
11.8% |
5.4% |
0.4% |
5.8% |
|
Upper Middle |
||||||||
|
Redhill/Sigona |
92,999 |
466 |
89.0% |
97.3% |
13.3% |
5.4% |
0.9% |
6.3% |
|
Ridgeways |
175,097 |
929 |
84.2% |
88.3% |
10.9% |
6.2% |
(0.2%) |
6.0% |
|
Runda Mumwe |
154,101 |
697 |
87.4% |
91.4% |
16.7% |
4.8% |
1.2% |
5.9% |
|
Lavington |
186,652 |
1,151 |
87.9% |
91.7% |
10.8% |
6.3% |
(0.6%) |
5.7% |
|
Loresho |
167,317 |
888 |
80.5% |
83.1% |
12.4% |
5.3% |
0.0% |
5.3% |
|
Langata |
115,384 |
457 |
89.0% |
85.8% |
9.0% |
4.3% |
0.6% |
4.9% |
|
South B/C |
104,299 |
414 |
90.4% |
87.1% |
12.6% |
4.3% |
0.2% |
4.5% |
|
Average |
148,592 |
764 |
86.3% |
89.6% |
12.2% |
5.4% |
0.3% |
5.7% |
|
Lower Middle |
||||||||
|
Ngong |
61,409 |
311 |
93.5% |
97.0% |
12.2% |
5.8% |
1.5% |
7.3% |
|
Syokimau/Mlolongo |
79,472 |
397 |
90.8% |
92.4% |
13.3% |
5.5% |
1.6% |
7.1% |
|
Athi River |
85,219 |
441 |
88.8% |
93.6% |
11.5% |
5.6% |
1.1% |
6.7% |
|
Ruiru |
68,833 |
348 |
87.4% |
83.7% |
12.2% |
5.6% |
0.9% |
6.5% |
|
Juja |
92,840 |
364 |
88.6% |
90.1% |
16.2% |
5.5% |
0.5% |
6.0% |
|
Kitengela |
64,745 |
299 |
88.2% |
87.2% |
12.0% |
5.0% |
0.7% |
5.7% |
|
Thika |
63,634 |
304 |
83.9% |
87.5% |
13.5% |
5.3% |
0.0% |
5.3% |
|
Rongai |
81,688 |
284 |
97.9% |
97.9% |
13.4% |
4.5% |
0.4% |
4.9% |
|
Donholm/Komarock |
94,496 |
417 |
85.6% |
87.1% |
10.8% |
4.8% |
(0.3%) |
4.5% |
|
Average |
78,588 |
358 |
90.1% |
91.1% |
12.7% |
5.3% |
0.8% |
6.1% |
|
Detached Average |
139,223 |
671 |
89.5% |
91.9% |
12.2% |
5.3% |
0.5% |
5.8% |
The key take-outs from the table include;
- Average Total Returns – The average total returns to apartments’ investors came in at 5.8%, remaining relatively unchanged from FY’2022. The performance was driven by a 0.6%-points increase in the average rental yield to 5.3% in FY’2023, from 4.7% recorded in FY’2022. The improvement in performance was attributable to a 22.2% uptick in the average rents per SQM to Kshs 671 in FY’2023, from Kshs 549 recorded in FY’2022,
- Segment Performance – The best-performing segment was the lower-middle segment offering an average total return of 6.1%, attributable to a relatively high average price appreciation of 0.8%, 0.3%-points higher than the detached market average appreciation of 0.5%. The impressive performance of the segment was driven by returns from well-performing nodes such as Ngong and Syokimau/Mlolongo, which have continued to offer relatively high returns to investors, and,
- Nodal Performance – Overall, Syokimau/Mlolongo was the best-performing node, offering the highest returns at 7.3%, 1.5% points higher than the detached market average of 5.8%, driven by a relatively high y/y price appreciation of 1.5%. The node has seen increased detached unit property investments owing to an inflow of residents brought about by the enhanced accessibility to the Nairobi CBD after the completion of the Ngong-Lang’ata Link road. Syokimau/Mlolongo followed with an average total return of 7.1%, 1.3% points higher than the detached market average of 5.8%.
- Apartments Performance
The table below shows the NMA residential sector apartments’ performance during FY’2023;
All values in Kshs unless stated otherwise
|
Cytonn Report: Residential Apartments Summary FY’2023 |
||||||||
|
Area |
Average of Price per SQM FY'2023 |
Average of Rent per SQM FY'2023 |
Average of Occupancy FY'2023 |
Average of Uptake FY'2023 |
Average of Annual Uptake FY'2023 |
Average of Rental Yield FY'2023 |
Average of Price Appreciation FY'2023 |
Total Returns |
|
Upper Mid-End |
||||||||
|
Westlands |
149,237 |
801 |
85.0% |
87.9% |
18.8% |
5.7% |
0.8% |
6.5% |
|
Kilimani |
107,449 |
584 |
87.6% |
91.4% |
18.2% |
5.8% |
0.4% |
6.2% |
|
Kileleshwa |
123,834 |
645 |
90.0% |
93.2% |
13.2% |
5.6% |
0.5% |
6.1% |
|
Loresho |
122,499 |
667 |
88.8% |
97.7% |
9.4% |
5.9% |
(0.2%) |
5.7% |
|
Parklands |
116,483 |
571 |
89.2% |
93.9% |
11.9% |
5.4% |
0.0% |
5.4% |
|
Upperhill |
126,775 |
720 |
83.9% |
90.0% |
11.8% |
6.0% |
(0.8%) |
5.2% |
|
Average |
124,379 |
665 |
87.4% |
92.3% |
13.9% |
5.7% |
0.1% |
5.8% |
|
Lower Mid-End Suburbs |
||||||||
|
Waiyaki Way |
82,619 |
466 |
84.3% |
87.8% |
16.0% |
5.7% |
1.8% |
7.5% |
|
South C |
114,856 |
608 |
90.3% |
90.7% |
15.7% |
5.8% |
1.4% |
7.2% |
|
Imara Daima |
81,004 |
408 |
85.0% |
87.5% |
10.2% |
5.3% |
1.7% |
7.0% |
|
Kahawa West |
80,934 |
429 |
89.8% |
86.8% |
8.7% |
5.9% |
1.0% |
6.9% |
|
Race Course/Lenana |
102,810 |
604 |
84.9% |
91.4% |
15.8% |
6.1% |
0.6% |
6.7% |
|
Dagoretti |
86,792 |
314 |
84.9% |
79.6% |
12.2% |
5.7% |
0.7% |
6.4% |
|
Donholm/Komarock |
70,379 |
358 |
93.0% |
91.5% |
10.7% |
5.7% |
0.2% |
5.9% |
|
South B |
107,087 |
592 |
93.2% |
97.1% |
14.3% |
6.0% |
(0.3%) |
5.7% |
|
Langata |
111,430 |
631 |
83.6% |
88.2% |
11.1% |
5.7% |
(0.2%) |
5.5% |
|
Average |
93,101 |
490 |
87.7% |
89.0% |
12.7% |
5.8% |
0.8% |
6.6% |
|
Lower Mid-End Satellite Towns |
||||||||
|
Athi River |
60,492 |
331 |
90.3% |
94.0% |
13.1% |
5.9% |
1.5% |
7.4% |
|
Thindigua |
104,243 |
526 |
89.3% |
85.7% |
16.0% |
5.5% |
1.8% |
7.3% |
|
Ngong |
82,491 |
469 |
86.4% |
86.9% |
12.7% |
5.8% |
0.9% |
6.7% |
|
Ruaka |
104,659 |
561 |
80.6% |
83.1% |
16.2% |
5.1% |
1.5% |
6.6% |
|
Ruiru |
91,660 |
479 |
88.4% |
84.1% |
14.3% |
5.5% |
1.0% |
6.5% |
|
Syokimau |
67,535 |
342 |
87.3% |
91.6% |
10.9% |
5.4% |
0.6% |
6.0% |
|
Rongai |
56,926 |
311 |
89.6% |
86.2% |
17.3% |
6.0% |
(0.4%) |
5.6% |
|
Kikuyu |
82,706 |
399 |
88.9% |
94.5% |
16.6% |
5.2% |
0.3% |
5.5% |
|
Average |
81,339 |
427 |
87.6% |
88.3% |
14.6% |
5.6% |
0.9% |
6.5% |
|
Apartment Average |
99,606 |
527 |
87.6% |
89.9% |
13.8% |
5.7% |
0.6% |
6.3% |
Source: Cytonn Research
The key take-outs from the table include;
- Average Total Returns – The average total returns to detached units’ investors came in at 6.3%, recording a 0.2%-points decline from the 6.5% recorded during FY’2022. The softened performance was driven by a 0.4%-points decline in the average price appreciation to 0.6% in FY’2023, from 1.1% recorded in FY’2022. This was driven by slowed apartment property transactions within the period, as attributable to a 1.6% decline in the average selling price per SQM to Kshs 99,606, from Kshs 101,248 recorded in FY’2022,
- Segment Performance – The best-performing segment was the lower mid-end satellite towns with average total returns of 6.5%, attributed to a relatively high average y/y price appreciation of 0.9%. The impressive performance of the segment was driven by returns from well-performing nodes such as Athi River, Thindigua, and Ngong that have continued to offer competitive returns to investors in comparison to other segments, and
- Nodal Performance – Overall, the best-performing node was Athi River, offering investors average total returns of 7.4%, 0.9%-points higher than the apartment market average total return of 6.5%. Athi River continues to attract apartment investments owing to infrastructural development with the Standard Gauge Railway (SGR) train station and a number of factories in the cement and construction industry that attract residents to the area. The worst-performing node was Kikuyu, recording an average total return of 5.5%, 0.8%-points lower than the detached market average of 6.3%.
For notable highlights during FY’2023, please see our, Cytonn Q1’2023 Markets-Review, Cytonn H1’2023 Markets Review, and, Cytonn Q3’ 2023 Markets Review reports. During Q4’2023;
- Property developer Erdemann Property Limited launched a new project in Athi River, Machakos County, that is set to deliver 3,000 residential housing units. The project, dubbed ‘Great Wall Gardens 6’, offers a mix of different amenities, targeting different segments of the market. For more information, please see our Cytonn Weekly #50/2023,
- The Kenya Mortgage Refinance Company (KMRC), in partnership with the treasury and private lenders, launched the Risk Sharing Facility (RSF) aimed at increasing home ownership amongst workers in the informal settlement. For more information, please see our Cytonn Monthly - November 2023,
- Property developer Mi Vida Homes broke ground for the construction of two projects namely, Amaiya, 237 Garden City (237 GC) and KEZA located within Garden City along Thika Road, and Riruta areas respectively. This comes more than a year after the developer announced plans to begin construction in April 2022. For more information, please see our Cytonn Weekly #47/2023,
- President William Ruto launched the first phase of the Kshs 6.0 bn Buxton Point affordable housing project located in Buxton, Mombasa County. The project which is spearheaded by Gulf Africa Limited is planned to deliver 1,984 affordable housing units in two phases, with 584 units already completed under phase one. For more information, please see our Cytonn Monthly – October 2023,
- The State Department for Housing and Urban Development unveiled details of President William Ruto’s affordable housing plan that will allow salaried workers earning Kshs 150,000 and above per month to acquire homes through the State-funded program. For more information, please see our Cytonn Weekly #42/2023, and,
- The Capital Markets Authority (CMA) granted Linzi Finco Trust the approval to issue an inaugural Shariah compliant bond, ‘Linzi Sukuk’. The bond which is set to raise Kshs 3.0 bn to finance the development of 3,069 institutional grade affordable housing units will offer an internal rate of return of 11.1%. For more information, please see our Cytonn Weekly #39/2023.
We have a NEUTRAL outlook for the NMA residential sector, as we as we expect the supply and demand of housing to grow, supported by several factors such as; i) increased financing geared towards property developments, ii) provision of affordable housing by the government and private sector, iii) focus on mortgage financing through the KMRC, and, iv) Kenya's positive demographics in terms of urbanization and population growth rates compared to global rates. However, various setbacks such as the continued increase in construction costs on the back of the high inflation, low penetration rate of mortgage financing to buyers, and constrained financing to developers with underdeveloped capital markets are expected to remain weighing down the optimum performance of the sector.
- Commercial Office Sector
The table below highlights the performance of the Nairobi Metropolitan Area (NMA) Commercial Office sector over time;
|
Cytonn Report: Nairobi Metropolitan Area (NMA) Commercial Office Returns Over Time |
|||||||||
|
Year |
Q1'2022 |
Q2'2022 |
Q3'2022 |
FY'2022 |
Q1'2023 |
H1'2023 |
Q3'2023 |
FY'2023 |
∆ FY'2022/FY'2023 |
|
Occupancy % |
77.9% |
77.9% |
78.2% |
79.4% |
79.8% |
80.8% |
79.9% |
80.3% |
0.9% points |
|
Asking Rents (Kshs/SQFT) |
94 |
95 |
96 |
96 |
97 |
98 |
100 |
103 |
7.1% |
|
Average Prices (Kshs/SQFT) |
12,113 |
12,142 |
12,221 |
12,223 |
12,238 |
12,238 |
12,265 |
12,673 |
3.6% |
|
Average Rental Yields (%) |
7.3% |
7.4% |
7.4% |
7.6% |
7.6% |
7.9% |
7.7% |
7.7% |
0.1% points |
Source: Cytonn Research
- Average Asking Rents – In FY’2023, average asking rents per SQFT in the NMA increased by 7.1% to Kshs 103 per SQFT from Kshs 96 in FY’2022. On a quarter-on-quarter (q/q) basis, the performance registered a 3.0% increase. This was driven by the increased supply of Grade A offices fetching higher rents such as The Piano, The Cube, Karen Green, Principal Place among others. Additionally, the continued depreciation of the Kenyan Shilling has increased landlords’ preference to collect rent in dollars in strategic efforts to mitigate forex losses. This in turn, has contributed to an increase in rental rates,
- Average Occupancy Rate – The overall occupancy rates increased by 0.9% points to 80.3% in FY’2023 from 79.4% in FY’2022. On a q/q basis, occupancy rates increased marginally by 0.4% to 80.3% from 79.9% registered in Q3’2023. Notably, on a y/y basis, supply of office space in 2023 declined as compared to 2022, allowing absorption rates to stabilize thus boosting occupancy rates. Furthermore, the rising demand for office space by startups during the year contributed to a boost in occupancy rates, and,
- Average Rental Yield – The average rental yield remained stable, registering 0.1% points increase to 7.7% in FY’2023 from 7.6% recorded in FY’2022, due to improved rental and occupancy rates.
All values in Kshs unless stated otherwise
|
Cytonn Report: NMA Commercial Office Submarket Performance FY'2023 |
|||||||||||
|
Area |
Price/SQFT FY'2023 |
Rent/SQFT FY'2023 |
Occupancy FY'2023 |
Rental Yields FY'2023 |
Price/SQFT FY'2022 |
Rent/SQFT FY'2022 |
Occupancy FY'2022 |
Rental Yields FY'2022 |
∆ in Rent |
∆ in Occupancy (% points) |
∆ in Rental Yields (% points) |
|
Westlands |
12,504 |
120 |
75.1% |
8.5% |
12,032 |
108 |
76.4% |
8.3% |
11.1% |
(1.3%) |
0.2% |
|
Gigiri |
15,000 |
128 |
79.8% |
8.2% |
13,500 |
118 |
81.6% |
8.7% |
8.5% |
(1.8%) |
0.5% |
|
Parklands |
11,875 |
92 |
85.8% |
8.0% |
11,662 |
91 |
81.5% |
7.7% |
1.0% |
4.3% |
0.3% |
|
Kilimani |
13,051 |
102 |
83.6% |
7.9% |
12,260 |
92 |
84.1% |
7.7% |
11.0% |
(0.5%) |
0.3% |
|
Karen |
14,246 |
115 |
80.1% |
7.8% |
13,431 |
111 |
82.9% |
8.3% |
4.2% |
(2.9%) |
0.4% |
|
Nairobi CBD |
12,000 |
90 |
85.0% |
7.6% |
11,971 |
83 |
85.2% |
7.2% |
8.2% |
(0.2%) |
0.4% |
|
Upperhill |
12,741 |
100 |
75.2% |
6.8% |
12,605 |
96 |
76.5% |
7.0% |
3.9% |
(1.3%) |
0.2% |
|
Thika Road |
12,571 |
79 |
79.4% |
6.0% |
12,571 |
79 |
80.1% |
6.0% |
0.0% |
(0.7%) |
0.1% |
|
Mombasa Road |
11,325 |
72 |
74.5% |
5.7% |
11,325 |
71 |
66.9% |
5.1% |
0.7% |
7.6% |
0.6% |
|
Average |
12,673 |
103 |
80.3% |
7.7% |
12,223 |
96 |
79.4% |
7.6% |
7.1% |
0.9% |
0.1% |
For the submarket performance, Westlands posted the best performance with an average rental yield of 8.5% in FY’2023 compared to market average of 7.7%. Gigiri and Parklands posted rental yields of 8.2% and 8.0% respectively. The performance by these nodes can be attributable to; i) high number of Grade A offices which are highly preferred especially by multinational companies, ii) availability of infrastructural capital such as Nairobi Expressway which has increased accessibility to areas such as Westlands, and, iii) high demand for quality offices by embassies, international organizations and multinational companies in these areas. On the other hand, Mombasa Road was the least performing node with an average rental yield of 5.7% in 2023, 2.0% points, lower than the market average of 7.7%, which can be linked to; i) its recognition as an industrial hub making it less appealing to office businesses, iii) aggressive competition from other suburbs such as CBD and Upperhill, and, iii) averagely low-quality offices which are deemed less attractive fetching lower rents. The table below shows the Nairobi Metropolitan Area (NMA) sub-market performance;
Source: Cytonn Research
For notable highlights during the year, please see our Cytonn Q1’2023 Markets-Review, Cytonn H1’2023 Markets Review, and, Cytonn Q3’ 2023 Markets Review reports. During Q4’2023;
- International Workplace Group (IWG) plc, a global provider of co-working, office and meeting spaces based in Switzerland announced it has, invested USD 850,000.0 (Kshs 127.5 mn) to set up a workplace facility at Global Trade Centre (GTC) Tower, located in Westlands, Nairobi. The facility which occupies 1,761 SQM will mainly target employees hired by different firms and independent contractors, and will comprise co-working spaces, private offices, and state-of-the art meeting facilities. For more information, please see our Cytonn Weekly #46/2023.
Our outlook for the NMA commercial office sector is NEUTRAL, driven by factors such as; i) increased number of multinational companies and startups in the country poised to boost occupancy rates, ii) the growing popularity of co-working spaces, and, iii) reduced developments in the pipeline, which we anticipate will assist curb the existing oversupply challenge. However, the oversupply of office space, totaling 5.8 mn SQFT in the NMA, is expected to dampen the sector's performance by constraining overall demand for physical space. Investment opportunity lies in Westlands, Gigiri and Parklands offering relatively higher returns compared to the market average.
- Retail Sector
The table below shows the performance of the retail sector performance in Nairobi Metropolitan Area from 2022 to 2023;
|
Cytonn Report: Summary of Retail Sector Performance in Nairobi Metropolitan Area 2022 to 2023 |
|||||||||
|
Item |
Q1’2022 |
H1'2022 |
Q3'2022 |
FY’2022 |
Q1’2023 |
H1’2023 |
Q3'2023 |
FY'2023 |
Y/Y 2023 ∆ |
|
Average Asking Rents (Kshs/SQFT) |
170 |
173 |
171 |
174 |
176 |
177 |
182 |
182 |
4.6% |
|
Average Occupancy (%) |
77.2% |
75.89% |
76.1% |
77.6% |
78.0% |
79.2% |
78.7% |
79.8% |
2.2% |
|
Average Rental Yields |
7.9% |
7.8% |
7.6% |
7.9% |
8.0% |
8.2% |
8.2% |
8.3% |
0.4% |
Source: Cytonn Research
The key take-outs from the table include;
- Average Occupancy Rate - The average occupancy rates increased by 2.2% points to 79.8% in FY’2023, from 77.6% recorded in FY’2022. This increase was primarily propelled by several factors including; i) robust expansion initiatives pursued by both local and international retailers like Naivas, QuickMart, Carrefour, and Cleanshelf, and, ii) sustained demand for consumer goods and services driven by favorable demographics, prompting further expansions from existing retailers,
- Asking Rents - The average rental rates per SQFT surged by 4.6% to Kshs 182 in FY’2023 from the Kshs 174 recorded in FY’2022. This spike was fueled by the addition of top-tier retail spaces such as the Global Trade Centre (GTC) mall and Business Bay Square (BBS) Mall fetching higher rents. Moreover, premium retail spaces in several strategic areas within the Nairobi Metropolitan Area (NMA), including Karen, Kilimani, Westlands, and along Kiambu and Limuru roads, continued to command higher rents due to their quality offerings. These coveted areas have attracted a significant influx of foreign businesses seeking proximity to multinational organizations and embassies, catering to the needs of international clientele. Noteworthy global brands such as Adidas, Puma, Michael Kors, Aldo, among others, have ventured into the Kenyan market, competing for prime retail spaces. Consequently, property owners in these sought-after locations have opted for rental transactions quoted in dollars, contributing to the escalation in rental rates, particularly amid the ongoing depreciation of the Kenyan currency against the dollar. The amalgamation of foreign business interest and the adoption of dollar-denominated rents has distinctly driven the surge in rental prices across these regions, and,
- Average Rental Yield- The average rental yield for the NMA retail sector improved by 0.4% points to 8.3% in FY’2023, from 7.9% in FY’2022, as a result of improved asking rents and occupancy rates.
In terms of sub-market performance, Karen, Westlands and Kilimani have retained their status as the leading nodes, boasting impressive average rental yields of 10.2%, 9.9%, and 9.5% respectively, surpassing the overall market average of 8.3%. This performance was primarily propelled by the presence of top-tier retail spaces commanding higher rents, complemented by the provision of quality infrastructure services in these areas. Conversely, retail spaces in Eastlands reported the lowest average rental yield at 6.2%, attributed to several factors: i) the rental rates stood at Kshs 146 per SQFT, notably lower than the market average of Kshs 182 per SQFT, ii) inadequate infrastructure across most towns within the region has hindered accessibility and sustainability for retail spaces, iii) the prevalence of informal retail spaces and service stations, offering competitive rates, diverse amenities, and a one-stop-shop experience, which has intensified market competition, impacting demand. However, noteworthy is the remarkable surge in rental rates in Eastlands, recording a substantial 11.5% increase, surpassing the market average of 4.6%. This surge can be attributed to the addition of prime high-quality space commanding premium rents such as BBS Mall. Currently, BBS is the largest mall in East and Central Africa, offering 130,000 SQM of modern, high-quality spaces.
Moreover, the most notable change in occupancy rates has been observed in prime retail spaces in Karen and the satellite towns, witnessing a substantial 5.8% increase compared to the market average of 2.2%. This significant shift is propelled by changing clientele preferences and the mushrooming population in these areas, prompting retailers to broaden their presence beyond the city center and explore prospects in Karen and the satellite towns. This expansion strategy aims to provide convenience to local residents in the most accessible manner possible. Further augmenting this surge in occupancy rates, rents recorded in satellite towns are lower than market averages at Kshs 139, compared to the market average of Kshs 182. This deliberate adjustment is a strategic maneuver to attract a more extensive clientele base by providing more affordable options, especially considering the amplified demand for consumer goods, diverse services, and entertainment facilities in these burgeoning locales. The table below shows the submarket performance of nodes in the Nairobi Metropolitan Area (NMA) 2023;
|
Cytonn Report: Nairobi Metropolitan Area Retail Market Performance FY’2023 |
|||||||||
|
Area |
Rent Kshs/SQFT FY’2023 |
Occupancy% FY’2023 |
Rental Yields FY’2023 |
Rent Kshs/SQFT FY’2022 |
Occupancy% FY’2022 |
Rental Yields FY’2022 |
∆ in Rental Rates |
∆ in Occupancy (% points) |
FY’2023 ∆ in Rental Yield (% points) |
|
Karen |
218 |
86.0% |
10.2% |
216 |
80.2% |
9.4% |
1.3% |
5.8% |
0.7% |
|
Westlands |
232 |
80.3% |
9.9% |
211 |
75.7% |
8.7% |
10.1% |
4.6% |
1.2% |
|
Kilimani |
193 |
82.2% |
9.5% |
187 |
83.8% |
9.8% |
3.3% |
(1.6%) |
(0.3%) |
|
Kiambu road & Limuru Road |
205 |
74.3% |
8.9% |
202 |
72.8% |
8.6% |
1.4% |
1.5% |
0.3% |
|
Ngong Road |
174 |
81.9% |
8.1% |
168 |
80.5% |
7.7% |
3.7% |
1.4% |
0.5% |
|
Mombasa road |
169 |
78.6% |
8.1% |
154 |
78.9% |
7.4% |
10.0% |
(0.3%) |
0.8% |
|
Thika Road |
162 |
80.8% |
7.1% |
165 |
78.7% |
7.3% |
(1.8%) |
2.2% |
(0.2%) |
|
Satellite towns |
139 |
80.4% |
6.8% |
134 |
74.6% |
6.2% |
3.7% |
5.8% |
0.6% |
|
Eastlands |
146 |
75.8% |
6.2% |
131 |
73.0% |
5.9% |
11.5% |
2.8% |
0.3% |
|
Average |
182 |
79.8% |
8.3% |
174 |
77.6% |
7.9% |
4.6% |
2.2% |
0.4% |
Source: Cytonn Research
For notable highlights during the year please see our Cytonn Q1’2023 Markets-Review, Cytonn H1’2023 Markets Review, and, Cytonn Q3’2023 Markets Review reports. During Q4’2023;
- French retailer Carrefour Supermarket opened a new outlet located at the Promenade Mall in Nyali, Mombasa. This latest addition becomes the third Carrefour outlet in the coastal region, showcasing the franchise's aggressive expansion strategy within the Kenyan market. For more information, please see our Cytonn Weekly #49/2023, and,
- Chain store Naivas Supermarket opened its 100th outlet located along King’ara road, Lavington, Nairobi. The opening of this latest store marks a significant achievement in the retailer's ongoing expansion plan dubbed 'Road to 100', which has been in progress for several months. For more information, please see our Cytonn Weekly #41/2023.
We maintain a NEUTRAL outlook regarding the retail sector's performance, acknowledging its susceptibility to various influencing factors. Anticipated trends point towards sustained growth in the Kenyan retail industry, primarily fueled by: i) the ongoing expansion initiatives pursued by both local and international retailers, aiming to seize larger market shares and fortify their market presence, ii) amplified capital injections from foreign entities into the Kenyan retail landscape, coinciding with the rise of e-commerce ventures, iii) an escalating demand for goods, services propelled by the country's favorable demographics, and iv) infrastructural advancements fostering accessibility in diverse regions, unlocking potential retail investment prospects in previously inaccessible areas. However, the sector's performance is expected to be weighed down by factors such as challenging economic conditions as a result of inflationary pressures, eroding consumers' purchasing power. This downturn is expected to have an impact on businesses reliant on discretionary spending possibly dampening retail activities. In addition, the introduction of new taxes, increased rates on existing taxes, and the increased Monetary Policy Rate from 10.5% to 12.5%, has created a persistent burden on retailers, compelling them to make tough choices between operating with reduced margins or transferring additional costs to consumers. Moreover, an oversupply of retail spaces, estimated at 3.3 mn SQFT in the Nairobi Metropolitan Area (NMA) and 2.1 mn SQFT in the broader Kenyan retail sector (excluding NMA), will continue to constrain the sector's growth. Furthermore, the rapidly growing e-commerce realm within the retail landscape, expected to witness a Compound Annual Growth Rate (2023-2027) of 3.7%, driven by evolving consumer behaviours, poses a substantial challenge by limiting the optimal utilization of physical retail spaces.
- Hospitality Sector
During the year, the Kenyan hospitality industry displayed signs of recovery and growth, moving past the challenges posed by the COVID-19 pandemic. This was evident in the rise in international tourist arrivals, number of operational hotels, bed occupancies, and hotel reservations. According to the Leading Economic Indicators (LEI) October 2023 report by the Kenya National Bureau of Statistics, international arrivals through Jomo Kenyatta International Airport (JKIA) and Moi International Airport (MIA) saw a year-on-year (y/y) increase of 31.7% in Q3’2023, with 451,441 visitors compared to 342,904 visitors in Q3’2022. Additionally, on a year-to-date (YTD) basis, the performance recorded a 28.7% increase to 1,238,330 persons as at October 2023, from 962,157 persons recorded during a similar period last year. The graph below shows the number of visitor arrivals through JKIA and MIA from 2021 to October 2023;
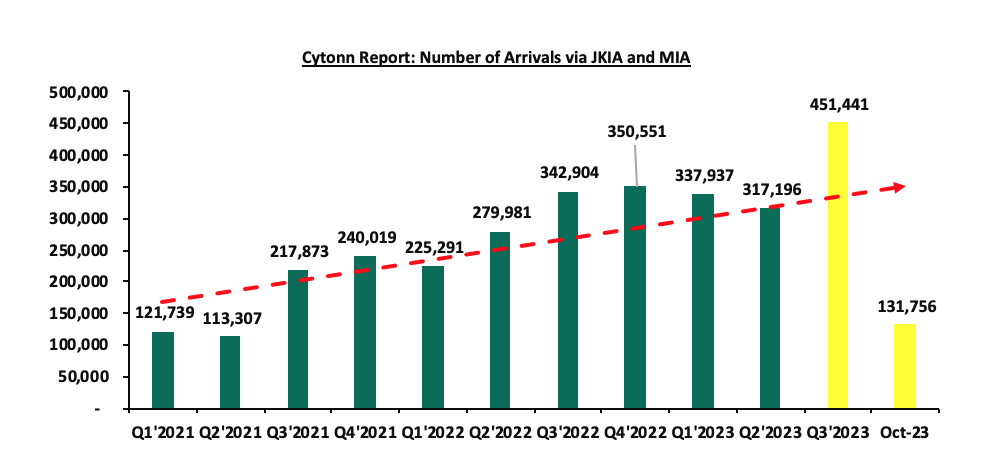
Source: Kenya National Bureau of Statistics (KNBS)
The enhanced performance can be credited to several factors including; i) the Ministry of Tourism's persistent marketing efforts, through platforms like Magical Kenya, ii) the Kenya Tourism Board's strategic marketing focus on both emerging and established source markets, iii) dedicated campaigns promoting local and regional tourism, iv) a notable increase in corporate and business gatherings, events, and conferences (MICE) from both the public and private sectors with the new government regime, v) heightened leisure activities during festive seasons and sports events like the Annual Safari Rally scheduled until 2026, and, vi) the consistent acknowledgment of Kenya's hospitality industry through prestigious awards such as the World Travel Awards, World Luxury Awards, among others. These accolades, awarded to both local and foreign hotel brands in Kenya across various categories, have significantly bolstered investor confidence in the sector.
Despite the above cushioning factors, the sector’s optimum performance was still majorly weighed down by the weakening of Kenyan shilling against the US dollar, raising the prices of crucial inputs hence escalating operational costs. Additionally, consistently rising interest rates in the country during the year further strained the sector by increasing borrowing costs and tightening credit conditions, thereby hindering investments and expansion efforts within the sector. In November, the Central Bank of Kenya raised the Monetary Policy Rate (MPR) from 10.5% to 12.5% in concerted efforts to maintain inflation within the 2.5% - 7.5% range. Moreover, the issuance of travel advisories by governments such as China and Canadian authorities in a recently released cautionary statement in December, warning its citizens against visiting Kenya due to concerns about terrorism threats, high crime rates, frequent power outages, and unsafe transport systems, exacerbated the sector's challenges by denting international confidence and potentially discouraging tourism and business travel to the country. These collective hurdles have created a challenging landscape for Kenya's hospitality sector in 2023, demanding resilience and adaptability from industry players. The graph below shows the Accommodation and Restaurant Sector growth rate from Q1’2020-Q3’2023;
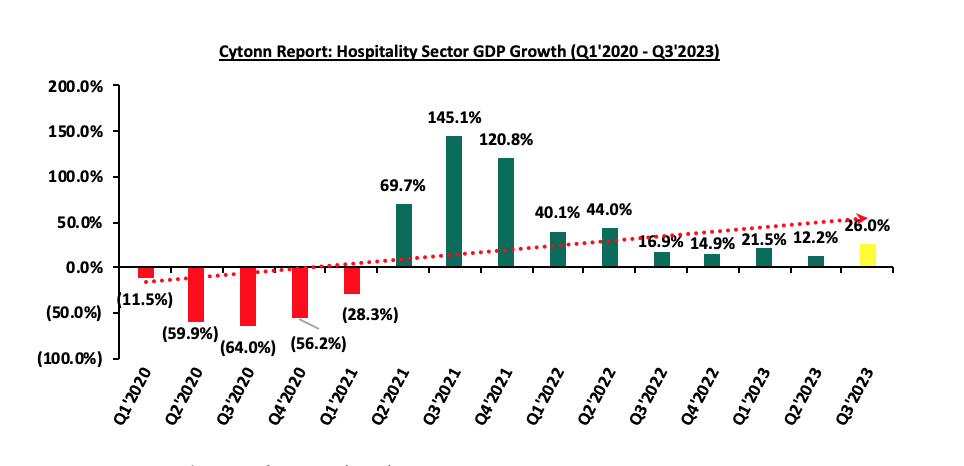
Source: Kenya National Bureau of Statistics (KNBS)
Additionally during the year, we released the Nairobi Metropolitan Area Serviced Apartments Report 2023. The overall performance of the serviced apartments improved y/y, with the occupancy rates coming in at 66.3%, a 0.5%-points increase from the 65.8% recorded in 2022. The monthly charges also improved to Kshs 3,045 per SQM from Kshs 2,716 per SQM recorded in 2022, representing a 10.9% increase. This was attributed to increased costs of operations on the back of rising costs of essential commodities, electricity, fuel costs and energy. Consequently, the average rental yield increased to 6.8% in 2023, a 0.6%-points increase from the 6.2% recorded in 2022. These positive shifts in performance were attributed to several key factors: i) Nairobi's increased recognition as a leading business travel destination in the 2023 World Travel Awards, ii) the ongoing recovery of Kenya's hospitality sector, iii) a rise in international tourist arrivals compared to the same period in 2022, iv) robust marketing efforts in Kenya's tourism sector via platforms like Magical Kenya, and, v) the sustained preference by various guests for extended stay options within the city. The table below shows the comparative analysis between 2022 and 2023;
All values in Kshs unless stated otherwise
|
Cytonn Report: Comparative Analysis-2022/2023 Nairobi Metropolitan Area Serviced Apartments Market Performance |
|||||||||
|
Node |
Monthly Charge/SQM 2022 |
Occupancy 2022 |
Rental Yield 2022 |
Monthly Charge/SQM 2023 |
Occupancy 2023 |
Rental Yield 2023 |
Change in Monthly Charges/SQM |
Change in Occupancy |
Change in Rental Yield |
|
Westlands |
3,916 |
70.7% |
9.3% |
4,059 |
74.2% |
10.2% |
3.7% |
3.5% |
0.9% |
|
Limuru Road |
2,976 |
60.6% |
5.8% |
4,699 |
58.1% |
8.2% |
7.9% |
(2.5%) |
2.4% |
|
Kilimani |
2,937 |
69.3% |
7.2% |
3,229 |
66.5% |
7.7% |
9.9% |
(2.8%) |
0.5% |
|
Kileleshwa & Lavington |
2,811 |
66.3% |
6.6% |
2,844 |
71.5% |
7.2% |
1.2% |
5.2% |
0.6% |
|
Upperhill |
2,225 |
65.4% |
5.0% |
2,309 |
65.8% |
5.2% |
3.8% |
0.4% |
0.2% |
|
Nairobi CBD |
2,348 |
66.2% |
5.2% |
2,539 |
57.5% |
4.9% |
8.1% |
(8.7%) |
(0.3%) |
|
Thika Road |
1,800 |
62.1% |
4.2% |
1,632 |
70.6% |
4.1% |
(9.3%) |
8.5% |
(0.1%) |
|
Average |
2,716 |
65.8% |
6.2% |
3,045 |
66.3% |
6.8% |
10.8% |
0.5% |
0.6% |
Source: Cytonn Research
For notable highlights during the year please see our Cytonn Q1’2023 Markets Review, Cytonn H1’2023 Markets Review and Cytonn Q3’2023 Markets Review Reports. During Q4’2023;
- Swiss-Belhotel International, a global hotel management chain based in Hong-Kong took over management of Nairobi Safari Club, Kenya's first all-suite luxury accommodation. The hotel, which is situated within the 16-storey Lilian Towers, located along Koinange street, Nairobi Central Business District (CBD) is set to undergo a rebranding, and will be renamed to Safari Club by Swiss-Belhotel. For more information, please see our Cytonn Weekly #45/2023,
- Lawford Hotel, a luxury beach resort located in Malindi, Kenya, won three prestigious awards at the 17th World Luxury Hotel Awards 2023 held in Athens, Greece. For more information, please see our Cytonn Monthly – October 2023,
- Kenya’s Diamonds Resorts secured two prestigious awards at the 30th World Travel Awards 2023. Diamond Leisure Beach and Golf Resort located in Diani, and Diamond’s Dreams of Africa Resort which is located in Malindi, Kenya were crowned Africa’s Leading Resort and Africa’s Leading All-Inclusive Resort respectively. For more information, please see our Cytonn Weekly #43/2023, and,
- Miftah Concierge, a leading provider of tailored lifestyle management and luxury travel services based in Dubai expanded its operations into Kenya. For more information, please see our, Cytonn Weekly #42/2023.
We have a NEUTRAL outlook for the hospitality sector during the year as we expect the sector’s performance to be supported by; i) promotion of regional tourism expected to enhance performance of the African markets, ii) increased international tourism arrivals into the country gearing towards pre-COVID levels as highlighted by the LEI and Annual Tourism Sector Performance Report 2022 reports, ii) increased budgetary allocation towards the sector through the Tourism Fund and Tourism Promotion Fund (TPF) in FY’2023/24, iii) development of niche products such as cruise tourism, adventure tourism, culture and sports tourism, iv) extensive marketing of Kenya’s tourism sector through platforms such as Magical Kenya by the Kenya Tourism Board, v) promotion of affordable and accessible travel across Kenya for Free Independent Travelers (FITs) and implementation of vital government initiatives such as the New Tourism Strategy for Kenya 2021-2025 promoting local tourism, vi) increased leisure and sporting activities with the hosting of Annual World Rally Championship (WRC) competition in Naivasha until 2026, , viii) the government’s decision and recent announcement to end visa requirements to all visitors starting January 2024 making Kenya a visa free country. This move is expected to impact positively on the sector by providing a steady visitors flow into the country which will boost bed occupancies and boost businesses in general, and, viii) continuous opening and expansions by local and international hotel brands such as JW Marriott of the Bonvoy Global and Pan Pacific Hotels Group in the country. However, we expect the recently issued travel advisories, and the current tough micro-economic environment characterized by rising inflation will weigh down optimum performance of the sector by increasing operational costs and curtailing consumer’s expenditure.
- Mixed-Use Developments (MUDs)
In December 2023, we released the Nairobi Metropolitan Area (NMA) Mixed Used Developments (MUDs) Report 2023, which highlighted that MUDs recorded an average rental yield of 8.4%, 1.3% points higher than the 7.1% yield recorded in 2022. The relatively improved performance can be linked to to changing client preferences and MUD’s attractiveness driven by the diversity in amenities and social offerings they provide to clients. The table below shows the performance of Mixed-Use development themes by node in 2023;
|
Cytonn Report: Nairobi Metropolitan Area Mixed Use Developments Performance by Nodes 2023 |
|||||||||||
|
Location |
Commercial Retail |
Commercial Office |
Residential |
Average MUD Yield |
|||||||
|
Rent (Kshs/SQFT) |
Occupancy |
Rental Yield |
Rent (Kshs/SQFT) |
Occupancy |
Rental Yield |
Price (Kshs/SQM) |
Rent (Kshs/SQM) |
Annual Uptake |
Rental Yield |
||
|
Karen |
270 |
92.5% |
11.5% |
125 |
82.5% |
7.8% |
9.7% |
||||
|
Limuru Road |
325 |
82.5% |
12.1% |
112 |
75.5% |
7.2% |
162,030 |
1,538 |
27.2% |
9.0% |
9.5% |
|
Westlands |
211 |
70.3% |
9.5% |
134 |
74.7% |
9.0% |
284,147 |
3,448 |
13.7% |
7.9% |
8.8% |
|
Kilimani |
193 |
83.2% |
9.7% |
114 |
82.4% |
7.6% |
8.6% |
||||
|
Upperhill |
147 |
75.7% |
8.0% |
102 |
81.3% |
8.5% |
8.3% |
||||
|
Eastlands |
243 |
84.7% |
11.2% |
80 |
67.5% |
5.4% |
8.3% |
||||
|
Mombasa Road |
203 |
75.0% |
8.7% |
90 |
80.0% |
7.2% |
118,812 |
662 |
13.7% |
6.0% |
7.3% |
|
Thika Road |
198 |
76.7% |
9.2% |
111 |
75.0% |
7.8% |
126,545 |
732 |
17.8% |
4.2% |
7.1% |
|
Average |
211 |
77.9% |
9.8% |
116 |
77.2% |
8.0% |
174,434 |
1,603 |
16.8% |
6.8% |
8.4% |
|
*Selling prices used in the computation of rental yields for commercial office and retail themes entailed a combination of both real figures and market estimates of comparable properties in the locations of the Mixed-Use Developments (MUDs) sampled |
|||||||||||
Source: Cytonn Research
Overall performance: In terms of performance per node, Karen was the best performing of all sampled nodes with an average MUD rental yield of 9.7%, 1.3% points higher than the market average of 8.4% in 2023. The outstanding achievement was mostly credited to; i) increased demand for premium locations has drawn clients who are willing to pay higher rents for these spaces, ii) the existence of residents with substantial incomes and considerable purchasing power, iii) the presence of adequate infrastructure that efficiently sustains the MUDs, and, iv) the presence of prime retail and office spaces fetching higher rents and yields.
For notable highlights during the year please see our Cytonn Q1’ 2023 Markets Review, Cytonn H1’2023 Markets Review, and Cytonn Q3’2023 Market.
Our overall outlook for Mixed Use Developments is NEUTRAL, attributable to; i) their substantial returns compared to single use themes, ii) increased attractiveness of MUDs driven by the variety of amenities and social features they offer to clients, and, iii) evolving client preferences. However; i) the existing oversupply of NMA office market at 5.8 mn SQFT, 3.3 mn SQFT in the NMA retail market and 2.1mn SQFT in the Kenyan Retail market, and, ii) rising construction costs are expected to weigh down the optimum performance. Karen, Limuru Road and Westlands nodes provide the best investment opportunities, with the areas providing the highest average MUD yields of 9.7%, 9.5% and 8.8% respectively, compared to the market average of 8.4%.
- Land Sector
The average selling prices for land in the Nairobi Metropolitan Area (NMA) in FY’2023 slowed down at Kshs 128.6 mn, from Kshs 130.2 mn recorded in FY’2022, attributable to uncertainty on future demand cycles given the economic slowdown and challenging micro-economic environment. However, the y/y average capital appreciation increased by 2.9%. The performance was supported by;
- Government’s continued emphasis on infrastructural development such as roads, railways, water and sewer lines which has improved and opened up areas for investment, ultimately increasing property prices,
- Limited supply of land especially in urban areas which has contributed to exorbitant prices,
- Increased construction activities particularly in the residential sector fueled by the government’s affordable housing agenda boosting demand for land upwards,
- Positive demographics driving demand for land upwards, facilitated by high population and urbanization growth rates of 1.9% and 3.7%, which are above the global averages of 0.9% and 1.6% respectively, and,
- Growth in popularity of satellite towns by investors and buyers which provide affordable land options in comparison to the suburbs and key commercial zones.
Overall Performance: Un-serviced land in the satellite towns of Nairobi recorded the highest y/y capital appreciation of 8.8% mainly due to; i) the areas improved accessibility benefitting from infrastructural developments such as the Nairobi Expressway, the expansion of the Eastern Bypass, and recently completed Nairobi Western Bypass, ii) affordability of land prices enticing buyers and investors, and, iii) high land prices within Nairobi commercial zones. Notably, average land prices per acre in Nairobi commercial zones registered significant price corrections owing to their high prices weighing down on the average selling prices. The table below shows the overall performance of the sector across all land sub-sectors during FY’2023;
|
Cytonn Report: Summary of the Performance Across All regions FY’2023 |
|||
|
|
FY'2022 |
FY'2023 |
Annualized Capital Appreciation |
|
Un-serviced land-satellite Towns |
15.1 mn |
16.4 mn |
8.8% |
|
Serviced land-Satellite Towns |
17.8 mn |
18.9 mn |
5.9% |
|
Nairobi Suburbs- High Rise Residential Areas |
81.1 mn |
82.3 mn |
1.6% |
|
Nairobi Suburbs (Low Rise & High Residential Areas) |
134.9 mn |
134.7 mn |
1.0% |
|
Nairobi Suburbs- Commercial Areas |
402.0 mn |
390.7 mn |
(2.8%) |
|
Average |
130.2 mn |
128.6 mn |
2.9% |
Source: Cytonn Research
Sub-markets Performance - For the satellite areas, Juja, Utawala and Rongai were the best performing nodes both with 12.3%, 11.6% and 9.8% year-on-year (y/y) capital appreciations owing to: i) improved infrastructure developments enhancing accessibility such as Thika Superhighway, Nairobi Eastern and Southern Bypasses among others, ii) availability of amenities such as malls, schools which appeal to families, and, iii) high concentration of learning institutions around and within the areas necessitating demand land for development of student housing particularly in Juja and Rongai areas. For Nairobi commercial zones, recorded a 2.8% price correction mainly on the back of declined demand owing to high land prices. The average asking prices per acre coming in at Kshs 390.7 mn, which is significantly higher than the market average of Kshs 128.6 mn. Furthermore, these areas are increasingly becoming congested due to relaxed zoning regulations in areas such as Kilimani, occasioning frequent traffic snarl-ups rendering them inconvenient and difficult to access. The table below shows NMA’s land performance by submarkets in FY’2023;
Price in Kshs per Acre
|
Cytonn Report: Nairobi Metropolitan Area Land Performance by Submarkets – FY’2023 |
|||
|
Location |
Price FY'2022 |
Price FY'2023 |
Capital Appreciation |
|
Satellite Towns - Unserviced Land |
|||
|
Juja |
14.4 mn |
16.2 mn |
12.3% |
|
Utawala |
18.6 mn |
20.8 mn |
11.6% |
|
Rongai |
15.0 mn |
16.4 mn |
9.8% |
|
Athi River |
4.9 mn |
5.2 mn |
6.9% |
|
Limuru |
22.7 mn |
23.5 mn |
3.3% |
|
Average |
15.1 mn |
16.4 mn |
8.8% |
|
Satellite Towns - Serviced Land |
|||
|
Ruiru & Juja |
26.3 mn |
28.1 mn |
6.8% |
|
Ruai |
11.7 mn |
12.4 mn |
6.0% |
|
Rongai |
16.2 mn |
17.1 mn |
5.9% |
|
Syokimau |
19.5 mn |
20.5 mn |
5.6% |
|
Athi River |
15.5 mn |
16.4 mn |
5.3% |
|
Average |
17.8 mn |
18.9 mn |
5.9% |
|
Nairobi High End Suburbs (Low- and High-Rise Areas) |
|||
|
Runda |
82.0 mn |
87.9 mn |
7.1% |
|
Spring Valley |
172.5 mn |
176.5 mn |
2.3% |
|
Karen |
64.5 mn |
65.7 mn |
1.9% |
|
Ridgeways |
87.0 mn |
87.1 mn |
0.1% |
|
Kitisuru |
97.4 mn |
95.0 mn |
(2.5%) |
|
Kileleshwa |
305.8 mn |
296.2 mn |
(3.1%) |
|
Average |
134.9 mn |
134.7 mn |
1.0% |
|
Nairobi Suburbs – High Rise Areas |
|||
|
Kasarani |
78.7 mn |
82.2 mn |
4.4% |
|
Embakasi |
78.8 mn |
79.2 mn |
0.5% |
|
Dagoretti |
85.7 mn |
85.6 mn |
(0.1%) |
|
Average |
81.1 mn |
82.3 mn |
1.6% |
|
Nairobi Suburbs - Commercial Zones |
|||
|
Kilimani |
378.7 mn |
375.9 mn |
(0.8%) |
|
Westlands |
413.2 mn |
405.9 mn |
(1.8%) |
|
Riverside |
336.6 mn |
323.0 mn |
(4.0%) |
|
Upperhill |
479.4 mn |
458.1 mn |
(4.5%) |
|
Average |
402.0 mn |
390.7 mn |
(2.8%) |
Source: Cytonn Research
We retain a POSITIVE outlook for the land sector in the NMA which has consistently demonstrated its resilience affirming its position as a reliable investment opportunity. We expect that the sector's performance will be driven by several key factors including; i) increased demand for land for development supported by positive population demographics, ii) ongoing government initiatives to streamline land transactions leading to a more efficient and accessible market, iii) notable increase in the initiation and completion of affordable housing projects owing to both government and private sector involvement, and, iv) rapid expansion of satellite towns, coupled with substantial infrastructural developments resulting in higher property prices.
- Infrastructure Sector
The government has continued to demonstrate commitment to the development of infrastructure in line with Vision 2030 and Big Four Agenda aspirations to provide safe, efficient, accessible, and, sustainable transportation services. For notable highlights during the year please see our Cytonn Q1’2023 Markets Review, Cytonn H1’2023 Markets Review and Cytonn Q3’2023 Markets Review reports. During Q4’2023;
- The National Treasury announced that the Nairobi- Mombasa Expressway project secured first-stage approval for construction under a Private-Public Partnership (PPP) model from the PPP Committee. Following the approval, the 473.0-Kilometre highway project valued at USD 3.6 bn (Kshs 555.1 bn) is set to proceed to the development stage. For more information, please see our Cytonn Weekly #51/2023,
- President William Ruto launched the construction of the 33.0 Km Bamburi-Mwakirunge-Rabai-Kaloleni road, traversing Mombasa and Kilifi counties during his five-day state tour of the Coastal region. The construction of the road is poised to be a transformative development that promises to significantly enhance accessibility between the two counties, in addition to stimulating and catalyzing trade thus fostering economic growth and prosperity of the two counties. For more information, please see our Cytonn Monthly – October 2023, and,
- Kenya National Highways Authority (KeNHA) announced plans to set up 26 virtual weighbridges across the country, aimed at enhancing roads monitoring in concerted efforts to minimize road damage. For more information, please see our Cytonn Weekly #41/2023.
We retain a NEUTRAL outlook as we expect the infrastructure sector in Kenya to continue playing a crucial role in promoting economic activities. This in turn will drive the growth and performance of the Real Estate sector supported by government’s continued emphasis on infrastructural development. We however, anticipate that Kenya’s infrastructure sector will witness a slowdown in the number of initiated and completed construction and maintenance projects going forward, particularly roads. This is primarily due to a reduction in budgetary allocations in the FY’2023/24. Furthermore, we expect the reduction in country’s overall development budget by Kshs 41.9 bn to Kshs 765.7 bn from Kshs 807.6 bn will have a knock-on effect to the infrastructure sector. Consequently, we anticipate that going forward, there will be a decline in the number of infrastructure projects completed, while the number of stalled infrastructure projects across the country is expected to rise due to insufficient funding. While it is acknowledged that the government is turning to Public-Private Partnerships (PPPs) to bridge financing gaps, it is our opinion that a heightened focus on PPPs is essential to overcome funding constraints. This is primarily because PPPs leverage private sector resources and expertise, fostering sustainable infrastructure development and economic growth. For more information, please see our Nairobi Metropolitan Area (NMA) Infrastructure Report 2023.
- Industrial Sector
During the year, Kenya’s industrial sector demonstrated remarkable growth supported by increased focus by foreign companies such as Perishable Movements Kenya Limited, Fresh Handing Kenya Limited, Improvon among others in setting up production factories and storage facilities. This was in efforts to localise sourcing of raw materials and production of goods, on the back of a depreciating local currency against major trading currencies which has drastically increased the costs of importing inputs.
For notable highlights during the year please see our Cytonn Q1’ 2023 Market Review, Cytonn H1’2023 Market Review, and Cytonn Q3’2023 Market Review reports. During Q4’2023;
- Global print and packaging firm Printcare Packaging Limited announced it had picked Africa Logistics Properties (ALP) West Logistics Park to service its expansion. The park comprises 100,000 SQM of Grade A warehousing space sitting on 49.0 acres within Tilisi development, Limuru, Kenya. Printcare settled on ALP’s West Logistics Park situated in Limuru due to; i) its strategic location, iii) high-quality amenities, and, iii) ALP’s commitment to offer international quality warehousing solutions and facilities in the region. For more please visit our Cytonn weekly #51/2023, and,
- Sameer Africa launched the construction of a new Kshs 260.0 mn industrial warehousing facility, as part of its expansion in the Real Estate business. The facility, situated along Mombasa Road, is 31 slated to start operations mid next year, and will include amenities such as high-speed fibre internet connectivity, ample utility water and a dedicated in-house property management team. For more please visit our Cytonn November 2023 Monthly Report.
We expect the Kenyan industrial sector will continue on an upward trajectory supported by; i) rising demand for e-commerce warehouses in the retail sector, fueled by the rising demand for space to store goods meant for delivery to clients across the country, as more people shift towards home delivery as a convenient and efficient way to purchase goods, ii) government's accelerated focus on exporting agricultural and horticultural products to the international market, with an aim to improve the quantity, quality, efficiency, and reliability of Kenya-farmed produce thereby increasing the country’s competitiveness, iii) Kenya’s continued recognition as a regional hub hence attracting investments, iv) increased demand for cold storage facilities for drugs and vaccines whose demand is driven by the Universal Health Coverage program by the government and accelerated campaign in provision of better and cheaper health services by private and Non-Governmental health organisations, and, v) continued improvement in infrastructure through projects such as the Standard Gauge Railway (SGR), the Eastern and Northern Bypasses connecting Jomo Kenyatta International Airport (JKIA) and other regions in the Nairobi Metropolitan Area, among other key infrastructural improvements which we expect will increase the output of Special Economic Zones and Inland Container Depots (ICDs).
- Statutory Reviews
In 2023, the Kenyan government continued to implement various amendments to relevant existing laws and regulations in the Real Estate sector. Additionally, new legislative measures were introduced with the overarching goal of elevating transactional standards within the sector, fostering increased efficiency, ensuring tax compliance, augmenting overall transparency in the industry, and boosting the Affordable Housing Program (AHP).
During the week, Nairobi City County Government announced that the new valuation scheme for land rates payment within the county will come into effect in January 2024. This comes more than a year after the county issued a notice in November 2022, highlighting the increment of land rates to 0.115% of the current value of undeveloped land based on the 2019 Draft Valuation roll, in line with the Nairobi City Finance Act 2022. The new rates will also include owners of units in apartment blocks who have registered titles for their units under the Sectional Properties Act. Additionally, they will be required to pay for the common areas within the apartment including swimming pools, elevators and playing grounds. This new valuation is aimed at raising more revenue for the county government. For more information, see Cytonn Weekly #47 2022
For other notable highlights during the year;
- The Affordable Housing Bill 2023 was tabled to the National Assembly by Majority Leader Kimani Ichung’wah. With its introduction at the First Reading, this proposal attempts to provide a legal framework for the establishment of the Affordable Housing Fund and subsequent imposition of the Affordable Housing Levy, which the High Court ruled unconstitutional in November. Additionally, the bill is attempting to extend the levy's applicability to various income sources and imposes higher penalties for non-compliance. Moreover, the bill aims to bolster funding for the affordable housing scheme. If passed into law, it could herald significant changes in housing finance and accessibility. For more information see Cytonn Weekly #49,
- The Finance Bill 2023 was assented to law by President William Ruto into the Finance Act 2023 on 26th June 2023. The Act amends laws relating to various taxes and duties policies affecting the Real Estate sector in Kenya. Effective 1 July 2023, the Third Schedule of The Income Tax Act paragraph 5 (ja) was amended to reduce the rate of Monthly Rental Income (MRI) tax to 7.5% from 10.0%. Additionally, the under the act, the Tax Procedures Act, 2015 was amended by inserting a new section 42(C), which assigns the Commissioner-General of the Kenya Revenue Authority powers to appoint withholding tax agents for the purpose of collection and remittance of rental income tax to the commissioner. For more information, please see our Cytonn H1’2023 Markets Review, and,
- The Finance Act 2022, became effective as of 1 January 2023, with the Capital Gains Tax (CGT) chargeable on net gains upon transfer of property tripling to 15.0% from the 5.0% previously chargeable. For more information, see Cytonn Weekly #01/2023 report.
- Regulated Real Estate Funds
- Real Estate Investments Trusts (REITs)
During the week, Acorn Student Accommodation Development REIT (ASA D-REIT) announced it had sold its latest stabilized asset, Qwetu Aberdare Heights II, to the Acorn Student Accommodation Income REIT (ASA I-REIT) in a Kshs 1.5 bn deal. The acquisition of the 630-bed capacity hostel located adjacent to Qwetu Aberdare Heights I and United States International University (USIU) brings the total number of assets acquired by the I-REIT to four over the last three years. Other projects acquired by the ASA I-REIT include; Qwetu Wilsonview in February 2021, Qwetu Aberdare Heights I in October 2022 and recently Qwetu Hurlingham in June 2023.
Through the sale, ASA D-REIT will repay Kshs 600.0 mn of the Acorn Green Bond, pushing the repayment of the Kshs 5.7 bn bond to Kshs 3.0 bn ahead of its maturity in November 2024. The bond which was first floated in 2019, was issued in partnership with Private Equity Fund Helios and had attracted an 85.0% subscription rate, raising Kshs 4.3 bn of the targeted amount of Kshs 5.0 bn. The bond was priced at a rate of 12.3%, and was intended to be used to finance sustainable and climate-resilient student accommodation with a combined capacity of 40,000 beds. For more information, please see our Cytonn Q3’2019 Markets Review report. Acorn D-REIT also announced its debut dividend payout of Kshs 240.0 mn, after a three-year grace period in line with its offering memorandum , through which unitholders will achieve a dividend yield of 3.4%.
In the Nairobi Securities Exchange, ILAM Fahari I-REIT closed the week trading at an average price of Kshs 6.3 per share, remaining relatively unchanged from the previous week. The performance represents a 7.1% Year-to-Date (YTD) loss from Kshs 6.8 per share recorded on 3 January 2023, taking it to a 68.5% Inception-to-Date (ITD) loss from the Kshs 20.0 price. The dividend yield currently stands at 10.3%. The graph below shows Fahari I-REIT’s performance from November 2015 to 29th December 2023;
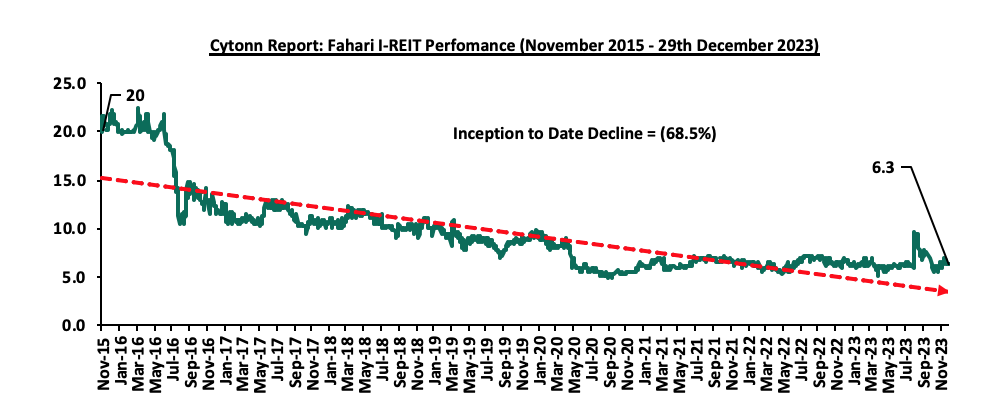
In the Unquoted Securities Platform, Acorn D-REIT and I-REIT traded at Kshs 25.3 and Kshs 21.7 per unit, respectively, as of 1st December 2023. The performance represented a 26.6% and 8.3% gain for the D-REIT and I-REIT, respectively, from the Kshs 20.0 inception price. The volumes traded for the D-REIT and I-REIT came in at 12.3 mn and 30.7 mn shares, respectively, with a turnover of Kshs 257.5 mn and Kshs 633.8 mn, respectively, since inception in February 2021.
For notable highlights during the year, please see our Q1'2023 Markets Review, H1'2023 Markets Review, and Q3’2023 Markets Review. Notable highlights during Q4'2023 include;
- Unitholders of ILAM Fahari I-REIT approved the proposed operational restructuring and delisting of the REIT from the Main Investment Market Segment of the Nairobi Securities Exchange (NSE). The decision follows an Extraordinary General Meeting (EGM) held last week on Friday 24th that resulted in the approval of all the resolutions endorsed by the REIT manager and agreed by the Trustee. For more information, please see our Cytonn Monthly – November 2023,
- LAPTrust Imara I-REIT traded for the first time on 25th October 2023 since its listing, with a total of 30.0 mn shares traded in two deals valued at Kshs 600.0 mn, with the share price remaining unchanged from its listing price of Kshs 20.00. The I-REIT which is structured as a close-ended fund consisting of 346.2 mn units worth Kshs 6.9 bn was initially intended to remain non-public, with no securities offered to the general market for the next three years. For more information, please see our Cytonn Weekly #43/2023,
- Trading of ILAM Fahari I-REIT units resumed trading on the Nairobi Securities Exchange after a two-week trading suspension from Friday 6th October 2023. The suspension was to allow for the redemption of 36.6 mn units from Non-Professional investors in order to facilitate the conversion of the I-REIT into a restricted REIT from an un-restricted REIT. For more information, please see our Cytonn Weekly #43/2023,
- ILAM Fahari I-REIT released results for the redemption offer of 36.6 mn units from Non-Professional investors following the conclusion and subsequent lapsing of the conversion offer period by ICEA Lion Asset Managers (ILAM) on Friday 6th October. The redemption offer was oversubscribed by 113.4%, receiving applications for redemption of 41.4 mn units from Non-Professional investors at an offer price of Kshs 11.0. For more information, please see our Cytonn Weekly #42/2023, and,
- The trading of ICEA Lion Asset Management (ILAM) Fahari I-REIT units was suspended, with effect from Friday 6th October upon the conclusion and subsequent lapsing of the conversion offer period by ICEA Lion Asset Managers. For more information, please see our Cytonn Weekly #41/2023.
Notably, the performance of the Kenyan REITs sector has been lackluster in comparison to other African countries such as South Africa which enacted its REITs regulations in 2013, similarly to Kenya. This is attributable to various factors such as; i) lack of sufficient investor awareness regarding the potential of REITs as an investment tool, ii) lengthy approval procedures for establishing REITs have hindered their formation and deployment in the market, iii) high minimum capital requirement of Kshs 100.0 mn for trustees which restricts the involvement of non-bank entities in the role of trustees, and, iv) steep minimum investment amount of Kshs 5.0 mn discourages potential investors from engaging in REITs. These factors have impeded the optimum performance of the sector.
On the other hand, we expect recent developments including; i) the proposed establishment of the Kenya National REIT (KNR), ii) business operational restructuring strategies employed by key industry players such as Fahari I-REIT geared towards achieving business and financial optimization as well as sustainability, and iii) the launch of the Vuka Investment Platform towards the end of 2022 are poised to bring about positive changes in the Kenyan Real Estate capital markets. These initiatives, in addition to the existing REIT institutions, offer several advantages which include deepening liquidity in the Real Estate sector. As such, they act as a means of accessing additional sources of capital which can be used to finance Real Estate development, and contribute towards the provision of affordable housing. Additionally, individuals stand to benefit from REITs by diversifying investment portfolios, generating consistent and long-term returns that are tax-exempt, and flexibility offered by the asset class.
Moving forward, we also expect the trend of strategic acquisitions to persist, with REITs actively seeking opportunities to broaden and diversify their portfolios, cater to evolving market demands and also set standards in promoting environmental sustainability such as execution of green bonds by Acorn holding. For more information on the REITs sector in Kenya, please see our Kenya’s REITs H1’2023 report.
- Cytonn High Yield Fund (CHYF)
Cytonn High Yield Fund (CHYF) closed the week with an annualized yield of 18.0%, remaining relatively unchanged the previous week. The performance represented a 4.1%-points Year-to-Date (YTD) increase from 13.9% yield recorded on 1st January 2023, and 2.3%-points Inception-to-Date (ITD) increase from the 15.7% yield. The graph below shows Cytonn High Yield Fund’s performance from November 2019 to 29th December 2023;
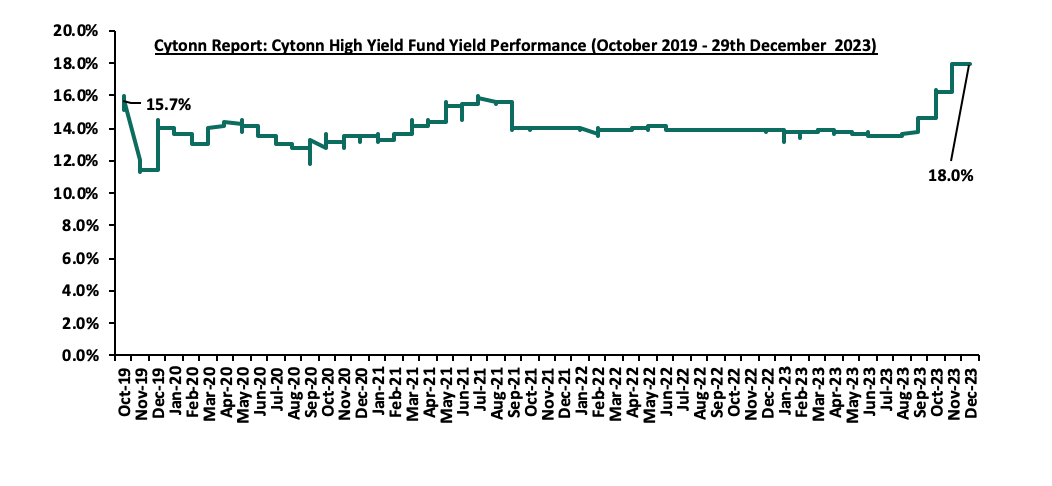
Notably, the CHYF has outperformed other regulated Real Estate funds with an annualized yield of 18.0%, as compared to Fahari I-REIT and Acorn I-REIT with yields of 10.3%, and 2.8% respectively. As such, the higher yields offered by CHYF makes the fund one of the best alternative investment resource in the Real Estate sector. The graph below shows the yield performance of the Regulated Real Estate Funds;
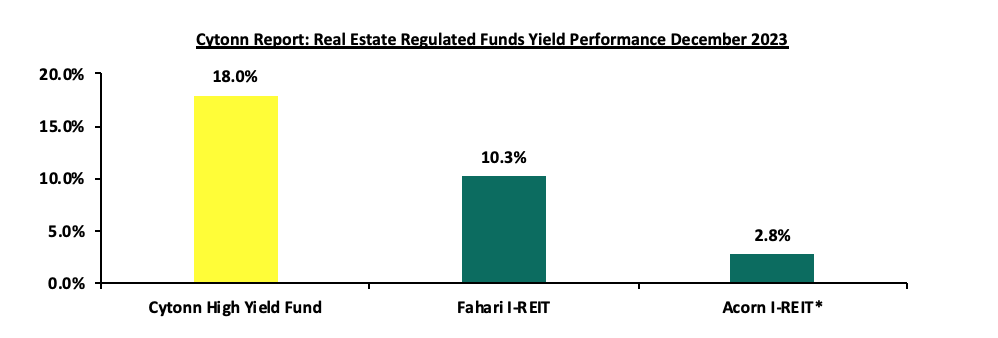
*H1’2023
Source: Cytonn Research
We retain a NEUTRAL outlook for the overall Kenya Real Estate sector whose market performance is expected to be supported by; i) increased and consistently growing demand for Real Estate developments facilitated by the country’s positive demographic profile, ii) government’s continued focus on provision of affordable housing, iii) initiation and implementation of various infrastructural improvements opening up new areas for investment and boosting property prices, iv) renewed investor confidence in the hospitality sector as a result of continuous recovery, as evidenced by increased international arrivals, v) efforts by the government through the Kenya Mortgage Refinance Company (KMRC) to provide affordable home loans to buyers, vi) initiation and implementation of infrastructure projects, vi) aggressive expansion efforts by both local and international retailers, and, vii) continued recognition of Kenya as a regional business hub, attracting foreign investments. However, rising construction costs, existing oversupply of physical space in the commercial office and retail sectors, slow delivery of affordable housing projects, recently issued travel advisories by multiple governments, impacting tourism, the deteriorating business environment and, low investor appetite for REITs is expected to hinder the optimum performance of the sector.
Disclaimer: The views expressed in this publication are those of the writers where particulars are not warranted. This publication, which is in compliance with Section 2 of the Capital Markets Authority Act Cap 485A, is meant for general information only and is not a warranty, representation, advice or solicitation of any nature. Readers are advised in all circumstances to seek the advice of a registered investment advisor.

- Talk to us
- Kenya
- P.O Box 20695 - 00200, Nairobi, Kenya
- Cell +254709101200
- Tel +254709101200
- WhatsApp +254741676635
- United States
- +254709101200
- DOWNLOAD OUR APP
-


- Kenya
- 8th Floor, Pinetree Plaza, Kaburu Drive, Ngong Road, Nairobi, Kenya
- USA
- Suite 1150, 1775 Eye Street NW, USA, Washington DC 20006, USA
- Investments
- High Yield
- Private Equity
- Real Estate
- Real Estate
- RiverRun Estates
- Cytonn Towers
- The Ridge
- Taraji Heights
- The Alma