Cytonn Weekly #13.2020
By Cytonn Research Team, Mar 29, 2020
Executive Summary
Fixed Income
During the week, T-bills were undersubscribed, for the second week in a row, with the subscription rate coming in at 57.0%, down from 87.9% the previous week. The undersubscription is attributable to investor’s preference to hold on to their cash due to low confidence in the market attributable to the Coronavirus outbreak. The yields on the 91-day paper and 364-day paper declined by 0.1% point to 7.2% and 9.0% from 7.3% and 9.1%, respectively, recorded the previous week while the yield on the 182-day paper increased by 0.1% point to 8.1%, from the 8.0% recorded the previous week. The Monetary Policy Committee (MPC) met on 23rd March 2020 to review the prevailing macroeconomic conditions amid the ongoing global COVID-19 pandemic and decide on the direction of the Central Bank Rate (CBR). The MPC lowered the CBR by 100 bps to 7.25% from 8.25%, which was in line with our expectations in our MPC- March 2020 Note. The decline of the MPC rate was in a bid to cushion the economy from adverse effects attributable to COVID-19 as evidenced by volatility in the foreign exchange markets and the expected decline in the economic growth if the pandemic is to continue. During the week, the Central Bank of Kenya (CBK) adjusted Kenya’s GDP forecast for the year 2020 from a baseline estimate of 6.4% at the beginning of the year, to a current estimate of 3.4%;
Equities
During the week, the equities market was on a downward trajectory, with NASI, NSE 20 and NSE 25 declining by 4.2%, 5.3%, and 7.1%, respectively, taking their YTD performance to losses of 23.5%, 27.8%, and 26.9%, for the NASI, NSE 20 and NSE 25, respectively, with the NSE 20 share index trading at a 17-year low, closing at 1,917.7 points compared to the previous low of 1,948.5 points recorded in 2003. The YTD losses of all the three indices breach the threshold of a bear market, which is a condition in which securities prices fall by 20.0% or more. During the week, KCB Group announced that it had set aside a Kshs 30.0 bn credit facility in an effort to cushion individuals and businesses grappling with the effects of the Coronavirus pandemic. The credit facility will be accessed through the lenders mobile lending platform, KCB M-Pesa, and will issue loans from Kshs 50.0 to Kshs 1.0 mn, depending on the customer’s credit rating. During the week, Equity Group was given the green light by the Committee Responsible for Initial Determination (CID), a Commission mandated to monitor and investigate possible breaches of the COMESA Competition Regulations, to acquire a 66.5% controlling stake worth Kshs 10.9 bn in Banque Commerciale du Congo (BCDC). For earnings releases during the week, ABSA Bank Kenya, I&M Holdings and NCBA Group released their FY’2019 financial results, recording core earnings per share growths of 21.2%, 26.6% and (12.4%), respectively;
Real Estate
During the week, Knight Frank released the Knight Frank Africa Report 2020/2021, a report that provides an overview of the continent's diverse property markets. According to the report, Kenya’s retail market recorded the highest rental yield at 9.0%, compared to the industrial, office, and residential sectors at 8.5%, 8.0%, and 5.5%, respectively. In the hospitality sector, the government implemented a ban on all international flights effective Wednesday 25th March 2020, with the exception of cargo flights, as a strategy to contain the spread of Coronavirus. Additionally, various hotels across the country, such as the Tribe Hotel and Ole Sereni in Nairobi County, Grand Royal Swiss, and Sovereign Hotel, in Kisumu County, announced their temporary closure. The Maasai Mara Game Reserve in Narok County also announced that they had suspended operations in the face of the Coronavirus pandemic while Jambo Jet, a local airline carrier, announced that it would be combining some of its flights to Western Kenya to boost the number of passengers on a flight. On infrastructure, the National Government, through the Kenya Roads Board, released Kshs 29.0 bn to road agencies and County Governments meant for the first half of the 2019/2020 fiscal year for road maintenance;
- Weekly Rates:
- Cytonn Money Market Fund closed the week at a yield of 11.0% p.a. To subscribe, just dial *809#;
- Cytonn High Yield Fund closed the week at a yield of 13.98% p.a. To subscribe, email us at sales@cytonn.com;
- Following the Kenyan Government's directive in containing the spread of COVID-19, we have adjusted our working hours to: 8 am - 4 pm on weekdays and 8 am- 12 pm on Saturdays. For convenience, you can reach us online on clients.cytonn.com, WhatsApp at 0748 070 000, or email at clientservices@cytonn.com
- In response to the recently announced measures to contain COVID-19 as announced by H.E. President Uhuru Kenyatta, Cytonn Investments has put in the following measures to ensure we continue serving our clients even as we comply with the safety measures. Please see our client communication here;
- Beatrice Mwangi, Real Estate Research Analyst at Cytonn Investments, attended an interview on NTV (Property Focus Show) where she talked about off plan investments. Watch Beatrice here;
- Michael Obaga, Financial Advisor at Cytonn Investments, attended an interview on Hot 96 FM where he discussed the impact of Coronavirus on businesses and on the economy. Listen to Michael here;
- Michael Obaga, Financial Advisor at Cytonn Investments, attended an interview on K24 where he discussed the effects of COVID-19 on Kenya’s economy. Watch Michael here;
- Rodney Omukhulu, Investments Analyst at Cytonn Investments, attended an interview on KBC Channel 1 to discuss the new tax measures proposed by H.E. President Uhuru Kenyatta in the wake of Coronavirus. Watch Rodney here;
- Having completed and handed over Phase 1 of The Alma, and on track to hand over Phase 2, we have now turned our attention towards construction of The Ridge in Ridgeways. The Ridge is Cytonn’s 800-unit residential mixed-use development on the Northern Bypass. For more information, please email us at sales@cytonn.com;
- Phase 1 of The Alma is now 100% sold with early buyers having achieved up to 55% capital appreciation. We are now running a promotion in Phase 2: Buy a unit in Phase 2 with a 15-year payment plan and 0% deposit. For inquiries, please email us on clientservices@cytonn.com;
- For an exclusive tour of Cytonn’s real estate developments, visit: Sharp Investor's Tour and for more information, email us at sales@cytonn.com;
- We continue to hold weekly workshops and site visits on how to build wealth through real estate investments. The weekly workshops and site visits target both investors looking to invest in real estate directly and those interested in high yield investment products to familiarize themselves with how we support our high yields. Watch progress videos and pictures of The Alma, Amara Ridge, and The Ridge;
- We continue to see very strong interest in our weekly Private Wealth Management Training (largely covering financial planning and structured products). The training is at no cost and is open only to pre-screened participants. We also continue to see institutions and investment groups interested in the training for their teams. Cytonn Foundation, under its financial literacy pillar, runs the Wealth Management Training. If interested in our Private Wealth Management Training for your employees or investment group, please get in touch with us through wmt@cytonn.com. To view the Wealth Management Training topics, click here;
- For recent news about the company, see our news section here;
- We have 10 investment-ready projects, offering attractive development and buyer targeted returns. See further details here: Summary of Investment-Ready Projects.
Money Markets, T-Bills & T-Bonds Primary Auction:
During the week, T-bills were undersubscribed, for the second week in a row, with the subscription rate coming in at 57.0%, down from 87.9% the previous week. The undersubscription is attributable to investor’s preference to hold on to their cash due to low confidence in the market attributable to the Coronavirus outbreak. The subscription rate of the 91-day paper increased to 89.6%, from 13.7% the previous week, with most investors showing more interest in the shortest dated paper to avoid duration risk as a result of increased uncertainty due to the outbreak of COVID-19. The subscription on the 182-day and 364-day paper declined to 33.5% and 67.4% from 36.1% and 169.4%, respectively, the previous week. The yields on the 91-day paper and 364-day paper declined by 0.1% point to 7.2% and 9.0% from 7.3% and 9.1%, respectively, recorded the previous week while the yield on the 182-day paper increased by 0.1% point to 8.1%, from the 8.0% recorded the previous week. The acceptance rate decreased to 85.3%, from 99.7% recorded the previous week, with the government accepting Kshs 11.7 bn of the Kshs 13.7 bn bids received.
During the week, the Kenyan government issued a new 9-year amortized (50% of unencumbered outstanding principal amount and a 100% final redemption of all outstanding amount) Infrastructure bond. IFB1/2020/9 has an effective tenor of 9.0 years, and a coupon rate of 10.9% and will be issued in a bid to raise Kshs 60.0 bn for funding of infrastructure projects in the FY 2019/20 budget estimates. The first redemption date will be on 7th April 2025 while the final redemption will be on 2nd April 2029. Compared to the March issue of the FXD1/2018/20 & FXD1/2018/25, which subscription rate came in at 70.3%, we expect the IFB1/2020/9 to attract more interest due to its short tenor as well as the tax-free incentive for infrastructure bonds, translating to a higher return. We expect the weighted average of accepted bids to come in at 11.1% - 11.3% given that an infrastructure bond of a similar tenor is currently trading at 11.1% on the yield curve.
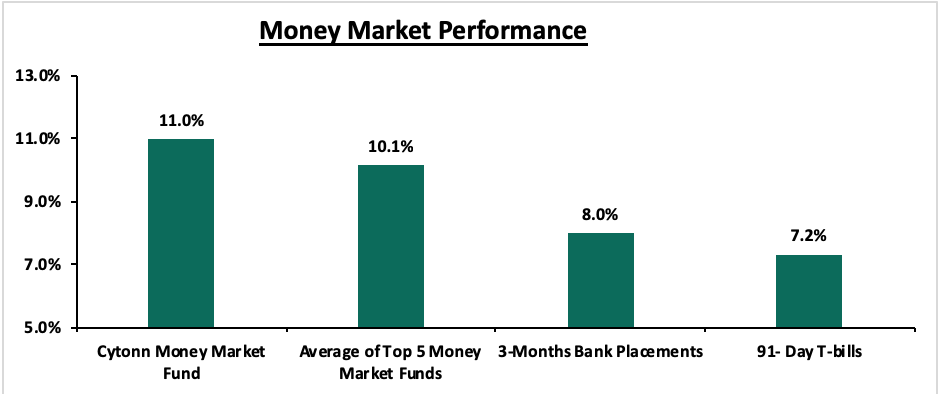
In the money markets, 3-month bank placements ended the week at 8.0% (based on what we have been offered by various banks), the 91-day T-bill declined by 0.1% point to 7.2%, from 7.3% recorded the previous week, while the average of Top 5 Money Market Funds remained unchanged at 10.1%. The yield on the Cytonn Money Market came in at 11.0%, unchanged from the previous week.
Liquidity:
During the week, liquidity in the money markets tightened, with the average interbank rate increasing to 4.6%, from 4.3% the previous week, attributable to the tax payments, which offset government payments. An additional Ksh. 35.2 bn was availed following the reduction of the Cash Reserve Ratio to 4.25% from 5.25% to provide additional liquidity to commercial banks for onward lending to distressed borrowers during the COVID-19 pandemic. Commercial banks’ excess reserves came in at Kshs 38.8 bn in relation to the 4.25% cash reserves requirement (CRR). The average interbank volumes increased by 12.6% to Kshs 15.8 bn, from Kshs 14.0 bn recorded the previous week.
Kenya Eurobonds:
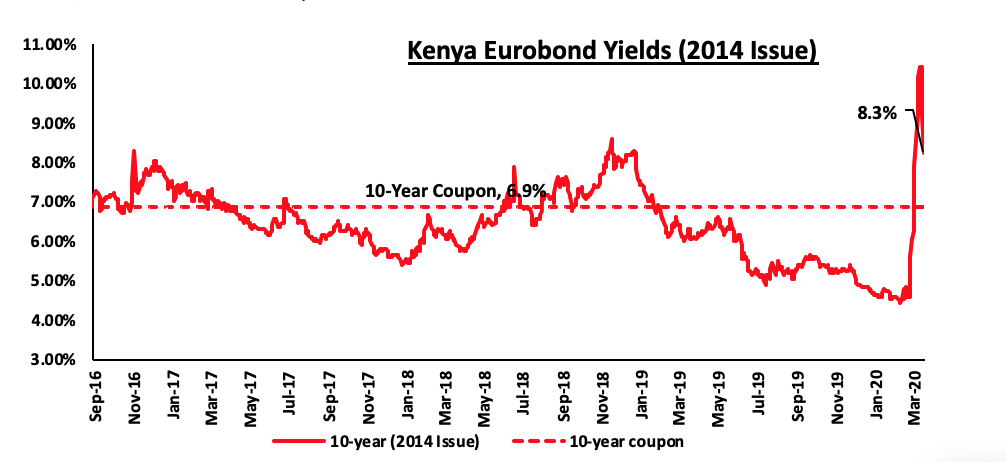
During the week, the yields on all the Eurobonds declined, as the market corrected from the sharp increase recorded in the last two weeks, a trend which was replicated in the performance of other Sub-Saharan African Eurobonds. According to Reuters, the yield on the 10-year Eurobond issued in June 2014 declined by 1.9% point to 8.3%, from 10.2% recorded the previous week.
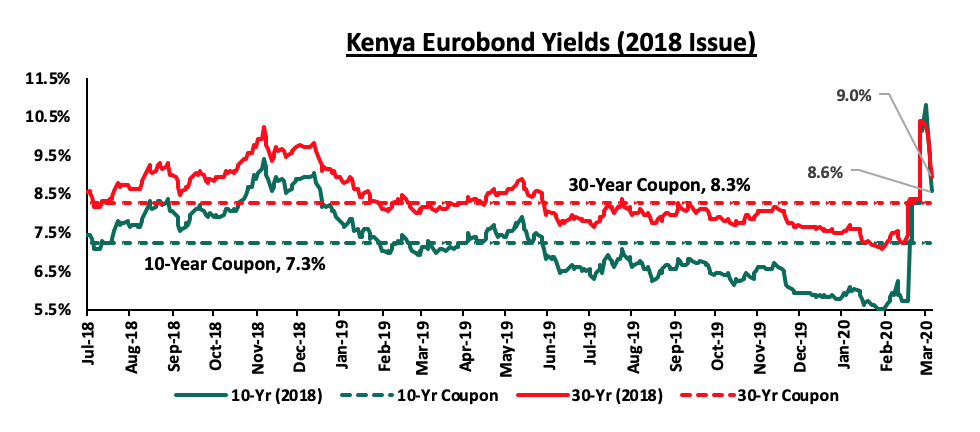
During the week, both the yields on the 10-year and 30-year Eurobonds issued in 2018, declined by 1.5% points and 1.4% points to 8.6% and 9.0%, respectively, from 10.1% and 10.4% recorded previous week.
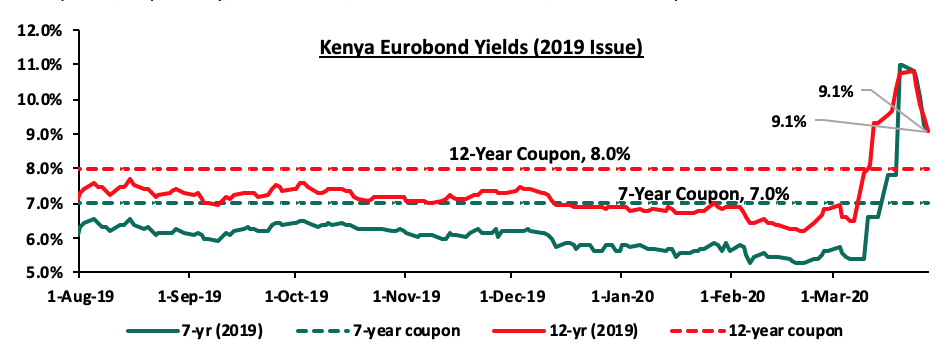
During the week, the yields on the 7-year and 12-year Eurobonds issued in 2019 declined by 1.9% points and 1.7% points, respectively, to 9.1% each, from 11.0% and 10.8%, recorded the previous week.
Overall, all Kenyan Eurobond yields have declined as the market corrects from the sharp increase recorded in the last two weeks. The spread between developed markets rates, considering the US 10-year Government Bond and Kenyan Eurobond has increased from 4.0% 2-weeks ago to 8.5% currently.
Kenya Shilling:
The Kenya Shilling remained unchanged against the US Dollar during the week, closing at 105.1. On a YTD basis, the shilling has depreciated by 3.7% against the dollar, in comparison to the 0.5% appreciation in 2019. We expect depreciation of the shilling in 2020 as a result of:
- Rising uncertainties in the global market due to the Coronavirus outbreak, which has seen the disruption of global supply chains. The shortage of imports from China for instance, which accounts for an estimated 21.0% of the country’s imports, is likely to cause local importers to look for alternative import markets, which may be more expensive and as such higher demand for the dollar from merchandise importers, and,
- Subdued diaspora remittances growth following the close of the 10.0% tax amnesty window in July 2019. We also foresee reduced diaspora remittances, owing to the decline in economic activities globally hence a reduction in disposable incomes. This coupled with increased prices of household items abroad might see a reduction in money expatriated into the country.
The shilling is however expected to be supported by:
- High levels of forex reserves, currently at USD 8.0 mn (equivalent to 4.8-months of import cover), above the statutory requirement of maintaining at least 4.0-months of import cover, and the EAC region’s convergence criteria of 4.5-months of import cover, and,
- CBK’s supportive activities in the money markets, with the Central Bank of Kenya (CBK) having already indicated that it’s looking to purchase USD 400.0 mn from banks for four months beginning from March to bolster the forex reserves.
Weekly Highlight
The Monetary Policy Committee (MPC) met on 23rd March 2020 to review the prevailing macroeconomic conditions amid the ongoing global COVID-19 pandemic and decide on the direction of the Central Bank Rate (CBR). The MPC lowered the CBR by 100 bps to 7.25%, from 8.25% previously, which was in line with our expectations in our MPC- March 2020 Note, driven by factors such as the instability in the Kenyan Shilling and the expected cost-push inflation caused by shortages arising from supply chain disruptions. The MPC also lowered the Cash Reserve Ratio (CRR) by 100 bps to 4.25% from 5.25% to provide additional liquidity, approximated at Kshs. 35.0 bn, to commercial banks for onward lending to distressed borrowers. From the last MPC briefing, the Central Bank of Kenya (CBK) Governor had indicated that the economy was operating below its potential level concluding that there was room for accommodative monetary policy to support economic activity.
The 100 bps rate cut by the MPC is a move to help mitigate the economic and financial impact of the COVID-19 health crisis. The MPC noted that the effects of the virus are already being felt in the economy as evidenced by:
- Volatility in the foreign exchange market driven by uncertainties concerning the impact of COVID-19 as evidenced by the recent downward trend of the shilling,
- Economic growth, which is expected to decline from a baseline estimate of 6.4% to 3.4% as per the Central Bank of Kenya, attributable to reduced demand by Kenya’s main trading partners, disruptions of supply chains and domestic production caused by COVID-19 pandemic. Based on the impact on other economies, Cytonn Investments, have also reduced Kenya’s forecasted GDP growth. Based on the impact to other economies, we believe that Coronavirus may have a 10.0% to 25.0% impact on GDP growth for the year 2020. The 10.0% impact is an optimistic case in the event the outbreak is contained, and a 25.0% impact in the event it is not contained. As such, the Coronavirus could reduce Kenya’s GDP growth to 4.3% for the year 2020 depending on the severity of the outbreak and economic implications for Kenya. The table below shows GDP projections from 10 firms with the consensus GDP growth as per the 10 firms below expected to come in at 5.5%. However, we expect this growth rate to be revised downwards as global research houses downgrade their GDP growth estimates for 2020 once they factor in the economic impact of Coronavirus.
|
Kenya 2020 Annual GDP Growth Outlook |
|||
|
No. |
Organization |
Q1’2020* |
Q1’2020** |
|
1. |
Citigroup Global Markets |
6.2% |
6.2% |
|
2. |
International Monetary Fund |
6.0% |
6.0% |
|
3. |
African Development Bank |
6.0% |
6.0% |
|
4. |
World Bank |
6.0% |
6.0% |
|
5. |
National Treasury |
6.0% |
6.0% |
|
6. |
African Development Bank (AfDB) |
6.0% |
6.0% |
|
7. |
Capital Economics |
5.9% |
5.9% |
|
8. |
United Nations Conference on Trade and Development (UNCTAD) |
5.5% |
5.5% |
|
9. |
Cytonn Investments Management PLC** |
5.7% |
4.3% |
|
10. |
Central Bank of Kenya** |
6.2% |
3.4% |
|
|
Average |
6.0% |
5.5% |
|
*As at the beginning of the year **Revised GDP Growth |
|||
The MPC, however, noted that:
- Month on month inflation remained within the 2.5% - 7.5% target range, largely driven by lower food prices with favorable weather conditions and a decline in international oil prices as a result of an ongoing price war as well as a significant reduction in demand due to the Coronavirus Pandemic. Inflation stood at 6.4% in February, an increase from 5.8% recorded in January 2020, due to an increase in food prices and non-alcoholic beverages, and,
- Foreign exchange reserves, which stood at USD 8.3 bn (equivalent to 5.0-months of import cover), above the statutory requirement of maintaining at least 4.0-months of import cover, and the East African Community (EAC) region’s convergence criteria of 4.5-months of import cover. The MPC noted that the foreign exchange reserves would continue to provide adequate cover and a buffer against short-term shocks in the foreign exchange market.
As such, the MPC concluded that due to the adverse economic outlook attributable to the COVID-19 health crisis, it will ensure that the interbank market and liquidity management across the sector continue to function smoothly. The committee also pointed out that it will closely monitor the impact of this change and therefore, reconvene after a month for an early assessment of the COVID-19 pandemic.
During the week, the Kenyan Government announced several measures that would be taken to help cushion the Kenyans as well as the economy against the COVID-19 pandemic. The measures include:
- A 100.0% tax relief for those earning less than Kshs 24,000, and reduction of the Pay As You Earn (PAYE) to a maximum of 25.0% from 30.0% for all citizens earning above Kshs 24,000. This will effectively reduce the PAYE liability for taxpayers within this bracket and will afford these workers more disposable income. This reduction is effective starting 1st April 2020,
- A reduction in resident corporates’ income from 30.0% to 25.0%, effective from 1st April 2020.
- Reduction of Turnover Tax from 3.0% to 1.0% for SMEs. The reduction should ease the tax burden for micro and small to medium enterprises (MSMEs),
- Temporary suspension of listing with the Credit Reference Bureaus (CBR) of individuals, MSMEs, and corporate entities,
- Reduction of Value Added Tax (VAT) from 16.0% to 14.0%. The Kenya Revenue Authority (KRA) was also directed to expedite payments for all verified VAT refunds within 3-weeks or allow for offsetting of Withholding VAT to improve cash flow for businesses,
- The senior members of the Executive arm of the government have also voluntarily agreed to take salary cuts. The President and Deputy President will each take an 80.0% cut, Cabinet Secretaries and Chief Administrative Secretaries will each take a 30.0% pay cut and Principal Secretaries will take a 20.0% pay cut.
These fiscal measures in conjunction with the monetary policy measures taken by the MPC are all in a bid to cushion businesses and the economy at large against the adverse effects of the ongoing COVID-19 virus. In as much as the measures put in place by the government are welcome and we applaud the efforts by the government, we believe that they won’t be effective in cushioning a greater multitude of the population with our sentiments guided by:
- Before the 100% tax relief, income tax for an employee earning Kshs 24,000 stood at Kshs 2,955 with a personal relief of Kshs 1,408, thus a net tax payable of Kshs 1,547. By implementing the new PAYE regime, the net tax benefit to such employees would, therefore, be a meagre Kshs 1,547, which may not be enough to cater for the economic disruption,
- The reduction of PAYE to a maximum of 25.0% from 30.0% for all citizens earning above Kshs 24,000 tax rate will also have a minimum effect on the ‘take-home’ pay for most middle-income earners. According to statistics by the Kenya National Bureau of Statistics (KNBS), about 74.0% of all Kenyans working in the formal sector earn a monthly salary of below Kshs. 50,000. With the new PAYE tax regime, employees who earn a taxable income of Kshs 50,000 will have a meagre tax relief of slightly below Kshs 150 from the reduction in PAYE,
- The pay cut for senior members of the Executive Arm of the Government is in the order of Kshs 800.0 mn per year, merely 0.02% out of the National Government wage bill of Kshs 400.0 bn. The pay cut will save less than 0.05% of the wage bill. Therefore, in our view, the pay cut was in a bid to strengthen Public Relations rather than mitigate the effects of COVID-19, and,
- The suspension of the Credit Reference Bureau (CRB) does not interfere with previous credit rating with more than 3.0 mn Kenyans having been blacklisted for defaulting mobile loans such as Tala and Branch, and as such, they will still not be able to access credit.
In our Topical for this week, we discuss additional economic containment policies for the Kenyan Government to consider.
Rates in the fixed income market have remained relatively stable as the government rejects expensive bids. The government is 15.2 % behind of its domestic borrowing target, having borrowed Kshs 195.9 bn against a pro-rated target of Kshs 231.0 bn. We expect an improvement in private sector credit growth considering the repeal of the interest rate cap. This will result in increased competition for bank funds from both the private and public sectors, resulting in upward pressure on interest rates. Owing to this, our view is that investors should be biased towards short-term fixed-income securities to reduce duration risk.
Market Performance
During the week, the equities market was on a downward trajectory, with NASI, NSE 20 and NSE 25 declining by 4.2%, 5.3%, and 7.1%, respectively, taking their YTD performance to losses of 23.5%, 27.8%, and 26.9%, for the NASI, NSE 20 and NSE 25, respectively, with the NSE 20 share index trading at a 17-year low, closing at 1,917.7 compared to the previous low of 1,948.5 recorded in 2003. The YTD losses of all the three indices breach the threshold of a bear market, which is a condition in which securities prices fall by 20.0% or more. The performance of the NASI was driven by losses recorded by most large-cap stocks, with EABL, Equity, KCB Group and ABSA recording losses of 15.1%, 14.8%, 13.7%, and 10.7%, respectively. The losses are attributable to the ongoing Coronavirus pandemic, with investors selling out of the equities market.
Equities turnover decreased by 25.3% during the week to USD 37.3 mn, from USD 50.0 mn recorded the previous week, taking the YTD turnover to USD 428.2 mn. Foreign investors remained net sellers for the week, with a net selling position of USD 17.6 mn, from a net selling position of USD 28.9 mn recorded the previous week. The trend reflects the global equity markets with foreign investors disposing riskier assets in favor of safe havens.
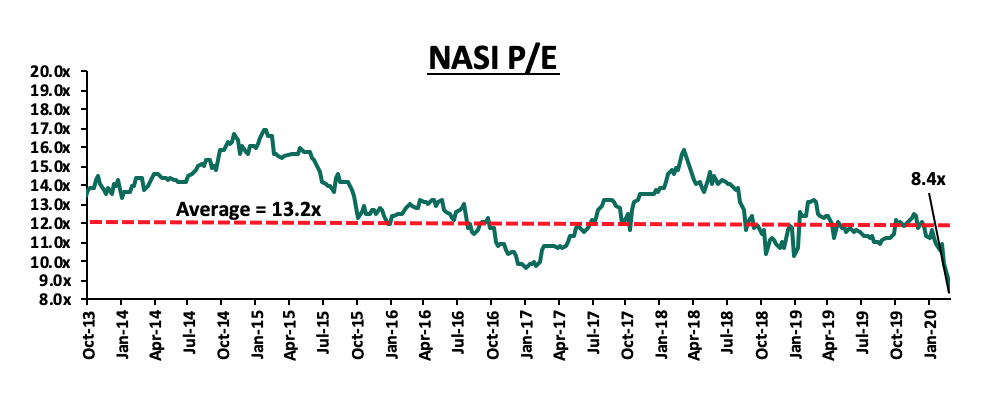
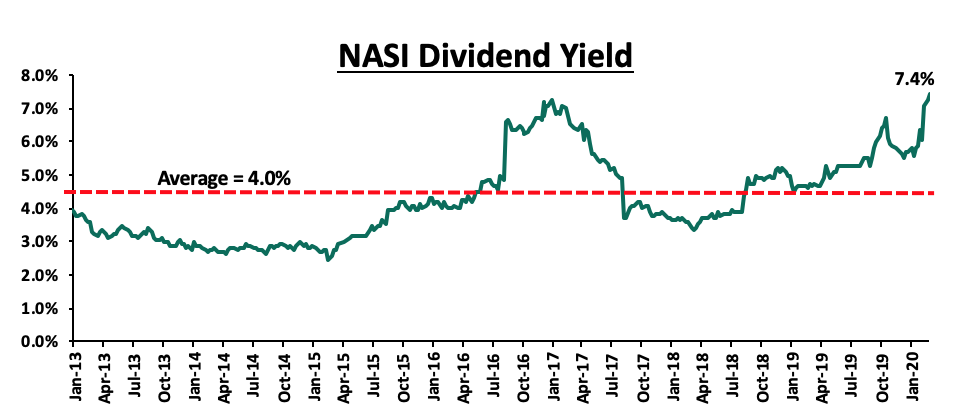
The market is currently trading at a price to earnings ratio (P/E) of 8.4x, 36.7% below the historical average of 13.2x, and a dividend yield of 7.4%, 3.4% points above the historical average of 4.0%. With the market trading at valuations below the historical average, we believe there is value in the market. The current P/E valuation of 8.4x is 13.8% below the most recent trough valuation of 9.7x experienced in the first week of February 2017, and 0.7% above the previous trough valuation of 8.3x experienced in December 2011. The charts below indicate the historical P/E and dividend yields of the market.
Weekly Highlight
During the week, KCB group announced that it has set aside a Kshs 30.0 bn credit facility, in an effort to cushion individuals and businesses grappling with the effects of the Coronavirus pandemic. The credit facility will be accessed through the lender's mobile lending platform, KCB M-Pesa, and will issue loans from Kshs 50.0 to Kshs 1.0 mn, depending on the customer’s credit rating. The loan facility offers repayment periods of 30-days, 60-days, and 90-days with interest rates of between 2.0% and 6.0%, per month. The credit facility is part of measures announced by the Central Bank of Kenya (CBK) and Kenya Bankers Association (KBA) to cushion the economy against the impact of the Coronavirus pandemic. The move by KCB Group mirrors the actions of ABSA Bank Kenya to offer support to Small and Medium Enterprises (SMEs) and individuals amidst the pandemic. This is after ABSA Bank Kenya announced its intentions to pay all supplier invoices within 14-days, with invoices of Kshs 1.0 mn and below being paid within 7-days. This is part of the lender’s measures to help SMEs meet their financial obligations and ensure working capital is available to them. ABSA Bank Kenya is also willing to restructure the loan terms for their customers to enable them to cope with any financial difficulty that may arise due to the worldwide pandemic. This comes on the backdrop of Central Bank of Kenya Governor, Dr. Patrick Njoroge’s announcement that banks will provide on a case-to-case basis, a personal relief on loan repayments for up to one year, to individuals affected by circumstances arising from the Coronavirus pandemic. The Monetary Policy Committee (MPC) also lowered the Cash Reserve Ratio (CRR), which is a fraction of total customer deposits that the commercial banks have to hold with the central bank, from 5.25% to 4.25%. This move is expected to release approximately Kshs 35.2 bn in additional liquidity and will see banks get more headroom in terms of deposits they can allocate to loans. In our view, these measures by the Kenyan banks, which follow the global trend with the International Monetary Fund (IMF) saying that it is prepared to mobilize USD 1.0 tn in lending, will cushion SMEs and individuals against the economic impact of the Coronavirus pandemic. We, however, believe that this will also lead to a rise in non-performing loans, because of the lax measure that has seen the suspension of listing at the Credit Reference Bureau (CRB) for default loans for the next 90-days.
During the week, Equity group was given the green light by the Committee Responsible for Initial Determination (CID), a Commission mandated to monitor and investigate possible breaches of the COMESA Competition Regulations, to acquire a 66.5% controlling stake worth Kshs 10.9 bn in Banque Commerciale du Congo (BCDC), effectively valuing BCDC at Kshs 16.4 bn. BCDC’s profit after tax stood at 1.2 bn as at 2018 with a shareholders’ equity of Kshs 10.0 bn. The transaction will see Equity Group pay Kshs 17,430 per share to acquire 625,354 shares in BCDC, a deal inclusive of dividends issued as at 1st January 2020, from the George Arthur Forrest family, and will see Equity integrate the bank with its subsidiary, Equity Bank Congo, to create the second-largest bank in Democratic Republic of Congo (DRC). The Price to book (P/B) for the transaction is 1.6x, due to the transaction value being Kshs 10.9 bn, and the book value acquired by Equity being Kshs 6.7 bn. COMESA Competition Commission, noting the deal will increase Equity Group’s market share without hurting competition, also endorsed the decision. The transaction is still subject to regulatory approvals from the Central Bank of Kenya (CBK) and Banque Centrale du Congo. Below is a summary of the deals that have either happened, been announced or are expected to be concluded locally. Transactions have been carried out at an average P/BV of 1.4x, compared to the current listed banking sector average of 1.2x:
|
Acquirer |
Bank Acquired |
Book Value at Acquisition (Kshs. Bns) |
Transaction Stake |
Transaction Value |
P/Bv Multiple |
Date |
|
Co-operative Bank |
Jamii Bora Bank |
3.4 |
100.0% |
Undisclosed |
N/A |
Mar-20** |
|
Access Bank PLC (Nigeria) |
Transnational Bank PLC. |
1.9 |
100.0% |
Undisclosed |
N/A |
Feb-20* |
|
Commercial International Bank |
Mayfair Bank |
1.1 |
Undisclosed |
Undisclosed |
N/A |
Dec-19** |
|
Oiko Credit |
Credit Bank |
3.0 |
22.8% |
1.0 |
1.5x |
Aug-19 |
|
KCB Group |
National Bank of Kenya |
7.0 |
100.0% |
6.6 |
0.9x |
Sep-19 |
|
CBA Group |
NIC Group |
33.5 |
53%:47% |
23.0 |
0.7x |
Sep-19 |
|
CBA Group*** |
Jamii Bora Bank |
3.4 |
100.0% |
1.4 |
0.4x |
Jan-19 |
|
AfricInvest Azure |
Prime Bank |
21.2 |
24.2% |
5.1 |
1.0x |
Jan-19 |
|
KCB Group |
Imperial Bank |
Unknown |
Undisclosed |
Undisclosed |
N/A |
Dec-18 |
|
SBM Bank Kenya |
Chase Bank Ltd |
Unknown |
75.0% |
Undisclosed |
N/A |
Aug-18 |
|
DTBK |
Habib Bank Kenya |
2.4 |
100.0% |
1.8 |
0.8x |
Mar-17 |
|
SBM Holdings |
Fidelity Commercial Bank |
1.8 |
100.0% |
2.8 |
1.6x |
Nov-16 |
|
M Bank |
Oriental Commercial Bank |
1.8 |
51.0% |
1.3 |
1.4x |
Jun-16 |
|
I&M Holdings |
Giro Commercial Bank |
3.0 |
100.0% |
5.0 |
1.7x |
Jun-16 |
|
Mwalimu SACCO |
Equatorial Commercial Bank |
1.2 |
75.0% |
2.6 |
2.3x |
Mar-15 |
|
Centum |
K-Rep Bank |
2.1 |
66.0% |
2.5 |
1.8x |
Jul-14 |
|
GT Bank |
Fina Bank Group |
3.9 |
70.0% |
8.6 |
3.2x |
Nov-13 |
|
Average |
|
|
75.7% |
|
1.4x |
|
|
* Expected completion date **Announcement date ***Deals that were dropped |
||||||
Earnings Release
During the week, ABSA Bank Kenya, I&M Holdings and NCBA Group released their FY’2019 financial results. Below is a summary of their earnings.
ABSA Bank Kenya;
Income Statement
- Core earnings per share (excluding exceptional items), increased by 21.2% to Kshs 1.65, from Kshs 1.37 in FY’2018, above our expectation of a 5.1% increase to Kshs 1.44. Earnings per share inclusive of exceptional items remained flat at Kshs 1.37, following a one-off exceptional item of Kshs 1.5 bn that the bank incurred in rebranding expenses from Barclays to Absa. The performance was driven by a 6.5% increase in total operating income, despite the 2.1% increase in total operating expenses. The variance in core earnings per share growth against our expectations was largely due to the 8.5% increase in Loan Loss Provisions (LLP) to Kshs 4.2 bn, from Kshs 3.9 bn in FY’2018, against our expectation of a 31.4% increase in LLP to Kshs 5.1 bn,
- Total operating income rose by 6.5% to Kshs 33.8 bn, from Kshs 31.7 bn in FY’2018. This was due to a 9.1% rise in Non-Funded Income (NFI) to Kshs 10.6 bn, from Kshs 9.7 bn in FY’2018, coupled with a 5.4% rise in Net Interest Income (NII) to Kshs 23.2 bn, from Kshs 22.0 bn in FY’2018,
- Interest income rose by 6.8% to Kshs 31.0 bn, from Kshs 29.1 bn in FY’2018. This was driven by a 9.7% growth in interest income from government securities to Kshs 8.1 bn, from Kshs 7.4 bn in FY’2018, and a 4.7% increase in interest income on loans and advances to Kshs 22.5 bn, from Kshs 21.5 bn in FY’2018. The yield on interest-earning assets, however, declined to 10.4%, from 11.4% in FY’2018, attributed to the faster 17.6% y/y increase in average interest earning assets to Kshs 299.3 bn, from Kshs 254.5 bn in FY’2018, that outpaced the 6.8% growth in interest income,
- Interest expenses rose by 11.0% to Kshs 9 bn, from Kshs 7.1 bn in FY’2018, following a 32.8% increase in the interest expense on placement liabilities to Kshs 1.3 bn from Kshs 0.9 bn in FY’2018, coupled with the 5.4% rise in interest expense on customer deposits to Kshs 6.5 bn from Kshs 6.1 bn in FY’2018, on the back of the strong 14.6% y/y deposit growth recorded in 2019. Cost of funds, on the other hand, declined marginally to 3.45%, from 3.52% in FY’2018, owing to the faster 13.1% growth in average interest bearing liabilities, which outpaced the 11.0% growth in interest expense. The Net Interest Margin (NIM) however declined to 7.7%, from 8.6% in FY’2018, owing to the faster 17.6% growth in average interest earning assets which outpaced the 5.4% growth in Net Interest Income (NII),
- Non-Funded Income (NFI) rose by 9.1% to Kshs 10.6 bn, from Kshs 9.7 bn in FY’2018. The growth was mainly driven by an 11.0% rise in forex trading income to Kshs 3.6 bn, from Kshs 3.3 bn in FY’2018, coupled with an 8.8% growth in total fees and commissions on loans to Kshs 6.1 bn from Kshs 5.6 bn in FY’2018. As a result, the revenue mix adjusted marginally to 68.6:31.4 from 69.4:30.6 recorded in FY’2018, funded to non-funded income, owing to the faster 9.1% growth in NFI, that outpaced the 5.4% growth in NII,
- Total operating expenses rose by 2.1% to Kshs 21.5 bn from Kshs 21.1 bn, largely driven by an 8.5% increase in Loan Loss Provisions (LLP) to Kshs 4.2 bn in FY’2019, from Kshs 3.9 bn in FY’2018, coupled with a 4.0% increase in staff costs to Kshs 10.2 bn in FY’2019, from Kshs 9.8 bn in FY’2018, with the bank having hired an additional 463 staff as it undertook rebranding in 2019. The rise in operating expenses was however mitigated by a 91.9% decline in rental charges to Kshs 0.1 bn from Kshs 1.2 bn in FY’2018, owing to the bank closing some of its branches across the country and opting to rent smaller spaces in some areas,
- The Cost to Income Ratio (CIR) improved to 63.6%, from 66.4% in FY’2018, owing to the faster 6.5% rise in total operating income to Kshs 33.8 bn, from Kshs 31.7 bn in FY’2018, which outpaced the 2.1% rise in total operating expenses to Kshs 21.5 bn, from Kshs 21.1 bn in FY’2018. Without LLP, the cost to income ratio also improved to 51.2%, from 54.2% in FY’2018, an indication of improved efficiency,
- Profit before tax rose by 15.4% to Kshs 12.3 bn, from Kshs 10.6 bn in FY’2018. Profit after tax before exceptional items grew by 21.2% to Kshs 9.0 bn in FY’2019, from Kshs 7.4 bn in FY’2018, while profit after tax and exceptional items, which relates to a one-off transition expense of Kshs 1.5 bn, grew by a marginal 0.5% to Kshs 7.5 bn in FY’2019, from Kshs 7.4 bn in FY’2018, with the effective tax rate increasing to 30.7% from 30.0% in FY’2018, and,
- The bank recommends a final dividend of Kshs 0.9 per share, inclusive of a Kshs 0.2 per share interim dividend paid in October, translating to a total Dividend per Share (DPS) of Kshs 1.1 for the year, unchanged from the Kshs 1.1 per share paid in FY’2018. This translates to a dividend yield of 11.2% at the current price of Kshs 9.8, and a payout ratio of 80.1%.
Balance Sheet
- The balance sheet recorded an expansion as total assets increased by 15.1% to Kshs 374.0 bn, from Kshs 324.8 bn in FY’2018. This growth was largely driven by a 32.3% increase in government securities to Kshs 123.0 bn, from Kshs 92.9 bn in FY’2018, coupled with a 9.9% increase in their loan book to Kshs 194.9 bn, from Kshs 177.4 bn in FY’2018,
- Total liabilities rose by 17.2% to Kshs 328.8 bn, from Kshs 280.6 bn in FY’2018, driven by a 14.6% increase in customer deposits to Kshs 237.7 bn, from Kshs 207.4 bn in FY’2018, coupled with a 26.2% increase in balances due to banking institutions in the group to Kshs 72.0 bn, from Kshs 57.0 bn in FY’2018. The growth in liabilities was mitigated by a 23.1% decline in placement liabilities to Kshs 4.1 bn, from Kshs 5.3 bn in FY’2018. Deposits per branch increased by 12.5% to Kshs 2.7 bn, from Kshs 2.4 bn in FY’2018, with the number of branches having increased by 4 to 88 from 84 in FY’2018,
- The faster 14.6% growth in deposits, which outpaced the 9.9% growth in loans led to a decline in the loan to deposit ratio to 82.0% from 85.5%, recorded in FY’2018,
- Gross Non-Performing Loans (NPLs) declined by 2.8% to Kshs 13.5 bn in FY’2019, from Kshs 13.9 bn in FY’2018. The NPL ratio thus improved to 6.6% in FY’2019, from 7.4% in FY’2018, owing to the faster 9.8% growth in gross loans (after adding back interest suspense), coupled with a 2.8% decline in non-performing loans. General Loan Loss Provisions rose by 19.3% to Kshs 7.8 bn, from Kshs 6.5 bn in FY’2018. Consequently, the NPL coverage increased to 77.0% in FY’2019, from 69.2% in FY’2018, owing to the 19.3% increase in general loan loss provisions, coupled with a 2.8% decline in gross non-performing loans,
- Shareholders’ funds increased by 2.2% to Kshs 45.2 bn in FY’2019 from Kshs 44.2 bn in FY’2018, driven by a 3.4% increase in retained earnings to Kshs 37.1 bn, from Kshs 35.9 bn in FY’2018. However, the growth was weighed down by a 46.9% decline in revaluation reserve to Kshs 0.3 bn from Kshs 0.5 bn in FY’2018,
- ABSA Bank Kenya is currently sufficiently capitalized with a core capital to risk-weighted assets ratio of 13.9%, 3.4% points above the 10.5% statutory requirement. In addition, the total capital to risk-weighted assets ratio was 16.6%, exceeding the 14.5% statutory requirement by 2.1% points. Adjusting for IFRS 9, the core capital to risk weighted assets stood at 14.3%, while total capital to risk-weighted assets came in at 17.0%, and,
- The bank currently has a Return on Average Assets (ROaA) of 2.3%, and a Return on Average Equity (ROaE) of 16.7%.
Key Take-Outs:
- There was an improvement in efficiency levels as the cost to income ratio without LLP improved to 51.2% from 54.2% in FY’2018. The improvement was largely attributable to a 91.9% decrease in rental charges to Kshs 0.1 bn from Kshs 1.2 bn in FY’2018, owing to the bank closing some of its branches across the country and opting to rent smaller spaces in some areas, which in turn boosted the bottom line,
- The bank’s asset quality improved, with the NPL ratio improving to 6.6% from 7.4% in FY’2018. The improving NPL ratio is attributable to a 2.8% decline in gross non-performing loans to Kshs 13.5 bn, from Kshs 13.9 bn in FY’2018 compared to the 9.8% growth in gross loans to Kshs 205.3 bn, from Kshs 187.0 bn in FY’2018. The bank continued to demonstrate prudence, as the coverage remained relatively high, at 77.0%, higher than the 69.2% in FY’2018,
- The banks’ reported earnings per share remained flat at Kshs 1.37, weighed down by the Kshs 1.5 bn one-off exceptional item that the bank incurred in rebranding expenses. However, core earnings per share recorded a 21.2% growth to Kshs 1.65, from Kshs 1.37 in FY’2018, and,
- The bank recorded a relatively strong growth in its balance sheet, as deposits grew by 14.6% y/y, and were channeled to Government Securities investments, which grew by 32.3%, and loans and advances, which grew, by 9.9% y/y. The growth in interest earning assets helped support increased interest income revenue, despite the decline in yields of government securities.
Going forward, we expect the bank’s growth to be driven by:
- Increased Channel diversification, which is likely to help the bank to continue improving its operational efficiency. The benefits of this are already being felt with “Timiza” already recording accelerated growth, and consequently higher Non-Interest. This coupled with the expansion of its agent-banking network and product offerings such as bancassurance and fixed income trading will see the bank expand its topline revenue, going forward.
For more analysis, please see our ABSA Bank Kenya FY’2019 Earnings Note.
I&M Holdings;
Income Statement
- Core earnings per share increased by 26.6% to Kshs 13.0, from Kshs 10.3 (normalized EPS) in FY’2018, largely in line with our projections of a 28.2% increase to Kshs 13.2. The performance was driven by a 2.6% increase in total operating income, as well as a 17.8% decrease in total operating expenses. The variance in core earnings per share growth against our expectations was largely due to the 2.6% rise in total operating income to Kshs 23.8 bn, from Kshs 23.2 bn in FY’2018, which was slower than our expectation of an 11.8% rise,
- Total operating income rose by 2.6% to Kshs 23.8 bn, from Kshs 23.2 bn in FY’2018. This was driven by a 9.1% increase in Non-Funded Income (NFI) to Kshs 8.3 bn, from Kshs 7.6 bn in FY’2018, offsetting the 0.5% decline in Net Interest Income (NII) to Kshs 15.5 bn, from Kshs 15.6 bn in FY’2018,
- Interest income rose by 4.5% to Kshs 27.2 bn, from Kshs 26.0 bn in FY’2018. This was driven by an 8.2% growth in interest income from loans and advances to Kshs 22.4 bn, from Kshs 20.7 bn in FY’2018. The yield on interest-earning assets, however, declined to 10.4%, from 11.2% in FY’2018, largely attributable to a decline in yields on government securities recording a decline of 17.0% to Kshs 4.1 bn from Kshs 5.0 bn in FY’2018 offsetting the 2.2% increase in average government securities to Kshs 53.0 bn from 51.9 bn in FY’ 2018,
- Interest expense rose by 12.0% to Kshs 11.7 bn, from Kshs 10.4 bn in FY’2018, following a 14.6% increase in the interest expense on customer deposits to Kshs 10.1 bn, from Kshs 8.8 bn in FY’2018, offsetting the 7.2% decline in interest expense on placements to Kshs 542.6 mn, from Kshs 584.7 mn in FY’2018. Other interest expenses also increased by 1.0% to Kshs 1.03 bn from Kshs 1.02 mn in FY’2018. Despite the higher interest expenses, the cost of funds declined marginally to 4.8% from 4.9% in FY’2018, owing to a slower increase in interest-bearing liabilities that rose by 6.9% to Kshs 249.0 bn from Kshs 232.5 bn in FY’2018 that was outpaced by the growth in interest expense. Net Interest Margin (NIM) declined to 6.3%, from 7.6% in FY’2018 due to a 0.5% decline in NII offsetting the 12.7% increase in average interest-earning assets,
- Non-Funded Income rose by 9.1% to Kshs 8.3 bn, from Kshs 7.6 bn in FY’2018. The increase was mainly due to a 5.0% increase in fees and commissions on loans to Kshs 1.9 bn from Kshs 1.8 bn in FY’2018. In addition, the FX trading income increased marginally by 0.4% to Kshs 2.58 bn from Kshs 2.57 bn in FY’2018 while other income rose by 56.7% to Kshs 1.7 bn from Kshs 1.1 bn. The revenue mix shifted to 65:35 funded to non-funded income, from 67:33, owing to the growth in NFI, coupled with the decline in NII,
- Total operating expenses declined by 17.8% to Kshs 10.1 bn from Kshs 12.3 bn in FY’2018, largely driven by an 83.3% decline in Loan Loss Provisions (LLP) to Kshs 636.5 mn from Kshs 3.8 bn in FY’2018. There was however a 15.1% increase in staff costs to Kshs 4.7 bn from Kshs 4.1 bn in FY’2018,
- Owing to the 83.3% decline in Loan Loss Provisions (LLP), Cost to Income Ratio (CIR), with LLP improved to 42.4%, from 53.0% in FY’2018. Without LLP, the cost to income ratio deteriorated to 39.8% from 36.6% in FY’2018, an indication of reduced efficiency,
- Profit before tax rose by 27.0% to Kshs 14.6 bn, up from Kshs 11.5 bn in FY’2018. Profit after tax grew by 26.6% to Kshs 10.8 bn in FY’2019, from Kshs 8.5 bn in FY’2018, with the effective tax rate increasing to 34.2%, from 30.5% in FY’2018,
- The bank recommends a first and final dividend of Kshs 2.55 per share, which is a 30.8% increase from Kshs 1.95 per share paid in FY’2018, which translates to a dividend yield of 5.1% at the current price of Kshs 49.8 and a payout ratio of 19.6%.
Balance Sheet
- The balance sheet recorded an expansion as total assets grew by 9.3% to Kshs 315.4 bn, from Kshs 288.5 bn in FY’2018. Growth was supported by a 20.5% increase in placements to Kshs 40.6 bn from Kshs 33.7 bn in FY’2018. The loan book also expanded by 5.2% to Kshs 175.3 bn from Kshs 166.7 bn in FY’2018, while Government securities rose by 3.4% to Kshs 53.9 bn from Kshs 52.2 bn in FY’2018,
- Total liabilities rose by 7.1% to Kshs 254.4 bn, from Kshs 237.6 bn in FY’2018, driven by a 7.6% increase in customer deposits to Kshs 229.7 bn from Kshs 213.1 bn in FY’2018. Deposits per branch increased by 5.2% to Kshs 5.5 bn from Kshs 5.2 bn in FY’2018, with the number of branches increasing by 1 to 42 branches. Borrowings declined by 21.1% to Kshs 10.9 bn, from Kshs 13.8 bn in FY’2018,
- The faster growth in deposits as compared to the growth in loans led to a decline in the loan to deposit ratio to 76.3% from 78.2% in FY’2018,
- Gross non-performing loans declined by 5.3% to Kshs 21.3 bn in FY’2019 from Kshs 22.5 bn in FY’2018. The NPL ratio, thus, improved to 11.3% in FY’2019 from 12.6% in FY’2018 attributable to a 5.3% decline in Non-Performing Loans, outpacing the 5.1% growth in gross loans. With general Loan Loss Provisions increasing by 7.6% to Kshs 8.6 bn from Kshs 8.0 bn in FY’2018, the NPL coverage improved to 59.1% in FY’2019 from 53.9% in FY’2018 despite the 5.3% decline in gross non-performing loans,
- Shareholders’ funds increased by 20.6% to Kshs 57.7 bn in FY’2019, from Kshs 47.9 bn in FY’2018, supported by a 25.9% increase in retained earnings to Kshs 33.9 bn, from Kshs 26.9 bn,
- I&M Holdings Plc remains sufficiently capitalized with a core capital to risk-weighted assets ratio of 17.3%, 6.8% points above the statutory requirement. In addition, the total capital to risk-weighted assets ratio came in at 21.2%, exceeding the statutory requirement by 6.7% points. Adjusting for IFRS 9, the core capital to risk-weighted assets stood at 17.2%, while total capital to risk-weighted assets came in at 21.0%.
- The bank currently has a Return on Average Assets (ROaA) of 3.4%, and a Return on Average Equity (ROaE) of 19.5%
Key Take-Outs:
- The bank maintained its continued rise in NFI recording a 9.1% growth to Kshs 8.3 bn, from Kshs 7.6 bn in FY’2018. This resulted in the revenue contribution mix shifting to 65:35 funded to non-funded income, from 67:33, owing to the high growth in NFI that outpaced growth in NII. This, however, remains below the current industry average of 32.6% NFI,
- The bank’s asset quality improved, with the NPL ratio improving to 11.3%, from 12.6% in FY’2018. NPL coverage also improved to 59.1%, up from 53.9% in FY’2018 as the 7.6% rise in general provisions to Kshs 8.6 bn, from Kshs 8.0 bn in FY’2018, outpaced the 5.3% decline in gross NPL to Kshs 21.3 bn in FY’2019 from Kshs 22.5 bn in FY’2018, and,
- There was a decline in efficiency levels as the cost to income ratio without LLP worsened to 39.8% from 36.6% in FY’2018. The deterioration was largely attributable to a 15.1% rise in staff cost, which depressed the bottom line.
Going forward, the factors that would drive the bank’s growth would be:
- Non-Funded Income Growth Initiatives – I&M Holdings’ NFI growth is improving as the bank focuses on digital innovation to augment transaction volumes and increase fee income. The bank needs to increase the capacity of its brokerage and advisory businesses to increase income contribution from investment and advisory services, and,
- Geographical Diversification – The bank has been aggressively expanding into other regions, namely Tanzania, Rwanda, and Uganda. This is expected to drive growth in the near future.
For a comprehensive analysis, please see our I&M Holdings FY’2019 Earnings Note.
NCBA Group;
Key to note: Results released by NCBA were on a prospective basis (a continuation of CBA) representing the 9 months performance of CBA Bank and 3 months performance of NCBA Bank (Merged bank); prior year comparatives are of those of CBA Bank. In our analysis we have used the pro forma combined statements of the 2 Banks as a 2018 comparative;
Income Statement
- Core earnings per share declined by 12.4% to Kshs 11.1 from Kshs 12.7 in FY’2018. The performance was driven by a 7.6% decline in total operating income to Kshs 33.7 bn from Kshs 36.4 bn in FY’2018, despite the 15.7% decline in total operating expenses. The variance in core earnings per share growth against our expectations was largely due to the 34.2% decline in Net Interest Income to Kshs 13.3 bn, from Kshs 20.3 bn in FY’2018, against our expectation of a 9.7% increase in NII to Kshs 22.3 bn, The downside was however mitigated by a 15.7% decline in total operating expenses to Kshs 20.4 bn in FY’2019, from Kshs 24.2 bn in FY’2018,
- Total operating income declined by 7.6% to Kshs 33.7 bn in FY’2019, from Kshs 36.4 bn in FY’2018. This was driven by a 34.2% decline in Net Interest Income (NII) to Kshs 13.3 bn from Kshs 20.3 bn recorded in 2018 which outpaced the 25.9% growth in Non-Funded Income (NFI) to Kshs 20.3 bn in FY’2019 from Kshs 16.1 bn in FY’2018,
- Interest income declined by 34.1% to Kshs 25.5 bn from Kshs 38.7 bn in FY’2018. This was driven by a 35.5% decline in interest income on government securities to Kshs 9.2 bn, from Kshs 14.2 bn in FY’2018, coupled with the 34.3% decline in interest from loans and advances to Kshs 15.7 bn, from Kshs 23.9 bn in FY’2018. The yield on interest earning assets declined to 6.3% in FY’2019 from 9.9% in FY’2018, attributable to the 6.8% y/y increase in average interest earning assets to Kshs 419.9 bn, from Kshs 393.0 bn, despite the 34.1% decline in interest income,
- Interest expense declined by 34.0% to Kshs 12.2 bn from Kshs 18.5 bn in FY’2018, following a 32.6% decline in interest expense on customer deposits to Kshs 10.6 bn, from Kshs 15.7 bn in FY’2018. The cost of funds fell to 3.1%, from 4.9% in FY’2018, owing to the 4.2% growth in average interest bearing liabilities, despite the 34.0% decline in interest expense. The Net Interest Margin declined to 3.3%, from 5.2% in FY’2018, owing to the faster 6.8% growth in average interest earning assets despite the 34.2% decline in Net Interest Income (NII),
- Non-Funded Income rose by 25.9% to Kshs 20.3 bn from Kshs 16.1 bn in FY’2018. The growth in NFI was driven by a 14.4% increase in fees and commissions on loans to Kshs 9.4 bn from Kshs 8.2 bn in FY’2018. Other incomes also grew to Kshs 5.6 bn, from Kshs 1.3 bn, recorded in FY’2018. As a result, the revenue mix shifted to 40:60 funded to non-funded income in FY’2019 from 56:44 in FY’2018, owing to the increase in NFI by 25.9% coupled with the decline in NII by 34.2%,
- Total operating expenses declined by 15.7% to Kshs 20.4 bn, from Kshs 24.2 bn in FY’2018, largely driven by a 26.0% decline in staff costs to Kshs 5.6 bn, from Kshs 7.5 bn in FY’2018, coupled with a 19.1% decline in other operating expenses to Kshs 8.5 bn, from Kshs 10.5 bn in FY’2018, however, the decline was mitigated by a 3.1% growth in loan loss provisions (LLP) to Kshs 6.3 bn, from Kshs 6.1 bn in FY’2018,
- The cost to income ratio improved to 60.5% from 66.3% in FY’2018, owing to the slower 7.6% decline in total operating income to Kshs 33.7 bn, from Kshs 36.4 bn in FY’2018, which was outpaced by the 15.7% decline in total operating expenses to Kshs 20.4 bn, from Kshs 24.1 bn in FY’2018. Without LLP, the cost to income ratio also improved to 41.9% from 49.7% in FY’2018, an indication of improved efficiency,
- Profit before tax declined by 7.8% to Kshs 11.3 bn from Kshs 12.3 bn in FY’2018. Profit after tax before exceptional items grew by 9.9% to Kshs 9.8 bn, from Kshs 8.9 bn in FY’2018, while profit after tax and exceptional items, which relates to merger costs of Kshs 2.0 bn, declined by 12.4% to Kshs 7.8 bn in FY’2019 from Kshs 8.9 bn in FY’2018, with the effective tax rate increasing to 30.7% from 27.1% in FY’2018, and,
- The bank recommends a final dividend of Kshs 1.5 per share, inclusive of a Kshs 0.25 per share interim dividend, translating to a total dividend of Kshs 1.75 per share for the year. This translates to a dividend yield of 6.6% at the current price of 26.4, and a payout ratio of 33.4%.
Balance Sheet
- The balance sheet recorded an expansion as total assets increased by 9.1% to Kshs 494.8 bn, from Kshs 453.6 bn in FY’2018. This growth was largely driven by an 11.8% increase in government securities to Kshs 145.0 bn, from Kshs 129.7 bn in FY’2018, coupled with a 4.1% growth in their loan book to Kshs 249.4 bn, from Kshs 239.6 bn in FY’2018,
- Total liabilities rose by 10.4% to Kshs 427.6 bn, from Kshs 387.2 bn in FY’2018, driven by a 10.9% increase in customer deposits to Kshs 378.2 bn, from Kshs 341.0 bn in FY’2018. The growth in liabilities was mitigated by a 29.0% decline in placement liabilities to Kshs 10.9 bn, from Kshs 15.4 bn in FY’2018. Deposits per branch stood at Kshs 8.8 bn with the bank operating 43 branches,
- The faster 10.9% growth in deposits, which outpaced the 4.1% growth in loans led to a decline in the loan to deposit ratio to 65.9% from 70.3%, recorded in FY’2018,
- Gross non-performing loans increased by 16.5% to Kshs 33.7 bn in FY’2019, from Kshs 28.9 bn in FY’2018. Consequently, the NPL ratio deteriorated to 12.6% in FY’2019 from 11.3% in FY’2018, owing to the faster 16.5% growth in gross non-performing loans which outpaced the 4.7% growth in gross loans (after adding back interest suspense),
- Shareholders’ funds increased by 1.5% to Kshs 67.0 bn in FY’2019, from Kshs 66.0 bn in FY’2018, owing to the 186.7% increase in share premium to Kshs 22.2 bn in FY’2019, from Kshs 7.7 bn in FY’2018. The growth was however weighed down by a 16.6% decline in retained earnings to Kshs 36.0 bn, from Kshs 43.1 bn in FY’2018, coupled with a 2.6% decline in proposed dividends to Kshs 2.2 bn, from Kshs 2.3 bn in FY’2018,
- NCBA Group is currently sufficiently capitalized with a core capital to risk weighted assets ratio of 16.6%, 6.1% points above the 10.5% statutory requirement. In addition, the total capital to risk weighted assets ratio is 17.3%, exceeding the 14.5% statutory requirement by 2.8% points. Adjusting for IFRS 9, the core capital to risk weighted assets stood at 17.5%, while total capital to risk weighted assets came in at 18.2%, and,
- NCBA Group currently has a Return on Average Assets (ROaA) of 1.7% and a Return on Average Equity (ROaE) of 11.8%.
Key Take-Outs:
- NCBA’s Non-funded income (NFI) growth came in at 25.9%, higher than the industry average of 17.1%, mainly supported by the 14.4% increase in fees and commissions on loans to Kshs 9.4 bn from Kshs 8.2 bn in FY’2018,
- The bank’s NFI to total operating income came in at 60.0% compared to the industry average of 32.6%, meaning that a significant portion of the bank’s revenue came from non-interest income,
- The bank’s asset quality deteriorated, with NPL ratio deteriorating to 12.6% in FY’2019 from 11.3% in FY’2018. The deteriorating NPL ratio is attributable to the faster 16.5% growth in gross non-performing loans, which outpaced the 4.7% growth in gross loans (after adding back interest suspense).
Going forward, we expect the bank’s growth to be further driven by:
- The completed merger has enabled NCBA capitalize on the strengths of the previous entities. We expect the value or “dividends” from the merger to be experienced in 2020
For a comprehensive analysis, please see our NCBA Group FY’2019 Earnings Note.
The table below summarizes the performance of listed banks that have released their FY’2019 results:
|
Bank |
Core EPS Growth |
Interest Income Growth |
Interest Expense Growth |
Net Interest Income Growth |
Net Interest Margin |
Non-Funded Income Growth |
NFI to Total Operating Income |
Growth in Total Fees & Commissions |
Deposit Growth |
Growth in Government Securities |
Loan to Deposit Ratio |
Loan Growth |
Return on Average Equity |
|
I&M |
26.6% |
4.5% |
12.0% |
(0.5%) |
6.3% |
9.1% |
34.8% |
5.0% |
7.6% |
3.4% |
76.3% |
5.2% |
19.5% |
|
ABSA |
21.2% |
6.8% |
11.0% |
5.4% |
7.7% |
9.1% |
31.4% |
8.8% |
14.6% |
32.3% |
82.0% |
9.9% |
16.7% |
|
Equity |
13.8% |
12.2% |
24.8% |
8.6% |
8.5% |
19.0% |
40.6% |
16.1% |
14.2% |
6.2% |
75.9% |
23.3% |
22.8% |
|
COOP |
12.4% |
1.4% |
0.8% |
1.7% |
8.5% |
33.1% |
5.9% |
34.7% |
8.7% |
46.8% |
80.1% |
8.7% |
19.2% |
|
KCB |
3.6% |
12.2% |
4.4% |
15.0% |
8.2% |
22.6% |
33.4% |
39.0% |
27.7% |
41.0% |
78.0% |
17.4% |
20.4% |
|
SCBK |
1.7% |
(5.9%) |
(22.4%) |
0.4% |
7.4% |
0.3% |
32.2% |
(4.7%) |
1.8% |
0.9% |
56.3% |
8.5% |
17.5% |
|
DTBK |
1.6% |
(6.9%) |
(7.3%) |
(6.5%) |
5.6% |
6.2% |
23.6% |
3.1% |
(0.9%) |
12.9% |
71.1% |
3.1% |
12.9% |
|
Stanbic |
1.6% |
8.1% |
7.1% |
10.7% |
5.2% |
14.0% |
46.1% |
11.7% |
2.4% |
(12.7%) |
85.1% |
9.3% |
13.6% |
|
NCBA |
(12.4%) |
(34.1%) |
(34.0%) |
(34.2%) |
3.3% |
25.9% |
60.0% |
14.4% |
10.9% |
11.8% |
65.9% |
4.1% |
11.8% |
|
FY'19 Mkt Weighted Average* |
9.6% |
5.0% |
5.2% |
5.1% |
7.5% |
17.1% |
32.6% |
18.5% |
12.9% |
19.7% |
75.4% |
13.4% |
19.0% |
|
FY'18 Mkt Weighted Average** |
13.8% |
6.5% |
10.6% |
2.6% |
7.9% |
3.8% |
33.2% |
(1.0%) |
10.3% |
9.1% |
75.5% |
4.3% |
19.0% |
|
*Market cap weighted as at 27/03/2020 |
|||||||||||||
|
**Market cap weighted as at 31/12/2018 |
|||||||||||||
The key take-outs from the table above include:
- Nine banks have released their FY’2019 financial results, recording a 9.6% average increase in core Earnings Per Share (EPS), compared to a growth of 13.8% in FY’2018 for the entire banking sector,
- The banks that have released results have recorded a deposit growth of 12.9%, faster than the 10.3% growth recorded in FY’2018. Despite the relatively fast deposit growth, interest expenses growth of 5.2% was slower than the 10.6% growth recorded in FY’2018, indicating that banks have been able to mobilize relatively cheaper deposits after the September 2018 implementation of the Finance Act 2018, which saw the removal of the minimum interest rate payable on deposits, which stood at 70.0% of the Central Bank Rate (CBR). This helped mitigate high increments in interest expense, despite the relatively fast deposit growth,
- Average loan growth came in at 13.4%, which was faster than the 4.3% recorded in FY’2018, indicating that there was an improvement in credit extension, with banks targeting select segments such as corporate entities and Small and Medium Enterprises (SMEs), the growth in loans was accelerated towards the tail end of FY’2019 following the repeal of interest rate cap in November 2019. Government securities, on the other hand, recorded a growth of 19.7% y/y, which was faster compared to the loans and the 9.1% growth recorded in FY’2018. This highlights banks’ continued preference towards investing in government securities, which offer better risk-adjusted returns. Interest income increased by 5.0%, compared to a growth of 6.5% recorded in FY’2018. The growth in interest income, albeit slower than the 6.5% recorded in FY’2018, may be attributable to the 13.4% growth in loans and increased allocation to government securities. Consequently, the Net Interest Margin (NIM) now stands at 7.5%, compared to the 7.9% recorded in FY’2018 for the whole banking sector, and,
- Non-Funded Income grew by 17.1% y/y, faster than 3.8% recorded in FY’2018. The growth in NFI was supported by the 18.5% average increase in total fee and commission income, which was faster than the (1.0%) growth recorded in FY’2018.
Universe of Coverage
|
Banks |
Price at 20/03/2020 |
Price at 27/03/2020 |
w/w change |
YTD Change |
Year Open |
Target Price* |
Dividend Yield |
Upside/ Downside** |
P/ TBv Multiple |
Recommendation |
|
Diamond Trust Bank |
90.0 |
81.8 |
(9.2%) |
(25.0%) |
109.0 |
189.0 |
3.3% |
104.9% |
0.4x |
Buy |
|
Kenya Reinsurance |
2.3 |
2.2 |
(3.9%) |
(26.4%) |
3.0 |
4.8 |
4.9% |
94.7% |
0.2x |
Buy |
|
I&M Holdings*** |
46.2 |
49.8 |
7.8% |
(7.8%) |
54.0 |
75.2 |
5.1% |
67.5% |
0.7x |
Buy |
|
KCB Group*** |
40.6 |
35.0 |
(13.7%) |
(35.2%) |
54.0 |
64.2 |
10.0% |
60.5% |
0.9x |
Buy |
|
Sanlam |
15.0 |
13.9 |
(7.7%) |
(19.5%) |
17.2 |
21.7 |
0.0% |
55.6% |
0.6x |
Buy |
|
Jubilee Holdings |
296.0 |
250.0 |
(15.5%) |
(28.8%) |
351.0 |
453.4 |
3.6% |
53.5% |
0.8x |
Buy |
|
Co-op Bank*** |
12.8 |
12.1 |
(5.1%) |
(26.0%) |
16.4 |
18.1 |
8.3% |
44.9% |
0.9x |
Buy |
|
Equity Group*** |
39.0 |
33.2 |
(14.8%) |
(37.9%) |
53.5 |
56.7 |
7.5% |
42.9% |
1.2x |
Buy |
|
Liberty Holdings |
8.2 |
8.4 |
2.9% |
(18.5%) |
10.4 |
10.1 |
5.9% |
37.6% |
0.7x |
Buy |
|
NCBA |
28.3 |
26.4 |
(6.5%) |
(28.4%) |
36.9 |
37.0 |
6.6% |
30.2% |
0.6x |
Buy |
|
ABSA Bank*** |
11.0 |
9.8 |
(10.7%) |
(26.4%) |
13.4 |
13.0 |
11.2% |
23.3% |
1.2x |
Buy |
|
Standard Chartered |
193.3 |
178.3 |
(7.8%) |
(12.0%) |
202.5 |
211.6 |
11.2% |
22.6% |
1.4x |
Buy |
|
Stanbic Holdings |
99.0 |
92.0 |
(7.1%) |
(15.8%) |
109.3 |
103.1 |
7.7% |
15.6% |
0.9x |
Accumulate |
|
CIC Group |
2.3 |
2.3 |
(0.4%) |
(14.6%) |
2.7 |
2.6 |
0.0% |
13.3% |
0.8x |
Accumulate |
|
HF Group |
4.2 |
4.2 |
(0.5%) |
(35.6%) |
6.5 |
4.2 |
0.0% |
1.9% |
0.2x |
Lighten |
|
Britam |
6.8 |
6.5 |
(4.1%) |
(28.0%) |
9.0 |
6.8 |
0.0% |
(0.7%) |
0.7x |
Sell |
|
*Target Price as per Cytonn Analyst estimates **Upside/ (Downside) is adjusted for Dividend Yield ***Banks in which Cytonn and/or its affiliates are invested in |
||||||||||
We are “Positive” on equities for investors as the sustained price declines have seen the market P/E decline to below its historical average. We expect increased market activity, and possibly increased inflows from foreign investors, as they take advantage of the attractive valuations, to support the positive performance.
- Industry Reports
During the week, Knight Frank, a local and international real estate consultancy firm, released the Knight Frank Africa Report 2020/2021, which provides an overview of the continent's diverse property markets and the key-take outs were as follows;
- Kenya’s retail market recorded the highest prime yields at 9.0%, compared to the industrial, office, and residential sectors at 8.5%, 8.0%, and 5.5%, respectively. The performance of the retail sector was supported by; (i) an influx of international retailers into the local market such as Carrefour, Game and Shoprite, and (ii) longer letting lead times for new developments, which has resulted to a tenant-favored market thus minimizing the effects of an oversupply of retail space,
- The industrial sector performance was primarily shaped by the continued infrastructural developments in Kenya such as the Northern, Eastern and Western Bypass and the completion of the Phase 2A of the Standard Gauge Railway, which has continued to facilitate the unlocking of new modern industrial facilities in Kenya away from the ones that have been in existence,
- The performance of the office sector was attributed to oversupply in the sector and subdued occupier demand. However, demand for Grade A office space continued to be boosted by the expansion of prime tenants mainly in strategic office nodes, as new trends such as co-working continue to gain traction in the local market.
The above report is in tandem with the Cytonn’s Real Estate Annual Markets Review Note 2019, according to which, retail, office and residential sectors recorded average rental yields of 78%, 7.5%, and 5.0%, respectively, with key trends shaping the commercial and retail real estate sectors including entry of international retailers as well as demand for top-notch office space and serviced offices. For 2020, we expect the real estate sector performance to continue picking up against increased infrastructural upgrades, increase in foreign investments especially with continuing entry and expansion of international retailers, positive demographics.
- Hospitality Sector
During the week, several adjustments were made by key players in the hospitality sector with the aim of containing the spread of the Coronavirus, which has significantly affected the sector. Some of the key adjustments include:
- The government implemented a ban on all international flights effective Wednesday 25th March 2020, with the exception of cargo flights,
- Temporary closure of some major hotels in Kenya, such as Tribe Hotel and Ole Sereni in Nairobi County; Grand Royal Swiss and Sovereign Hotel, in Kisumu County
- Suspension of operations at Maasai Mara Game Reserve in Narok County, due to travel restrictions and strategies aimed at adhering to social distancing rules introduced by the government,
- Villa Rosa Kempinski Hotel limiting its business to room service only, suspending other activities such as hosting of meetings, events, and operations in their restaurant and bars,
- Jambo jet, a local airline carrier, combining some of its flights to Western Kenya, mainly trips to Eldoret and Kisumu, to try and boost the number of passengers per flight. Additionally, the carrier reduced its fares in response to the low number of passengers occasioned by the Coronavirus pandemic.
The ban on all international flights and reduced local direct flights as a result of the continued spread of Coronavirus continues to hurt the hospitality sector. This will result in a reduced number of tourist arrivals in Kenya, thus lowering the demand for hospitality services, which is expected to impact the performance of the sector, evidenced by the suspension of operations in several hospitality facilities. Globally, the hospitality industry has been the most affected by the pandemic, for example in the United States, a research done by the American Hotel and Lodging Association showed that the occupancy of hotels has reduced to an average 25.0% in March 2020, from an average of 65.0% in January 2020, representing a 40.0% points drop.
In our view, the hospitality sector will be hit the hardest by the Coronavirus Pandemic owing to its heavy reliance upon tourism and the MICE (Meetings, Incentives, Exhibitions, and Conferencing) sectors. However, unlike hotels, which tend to attract short-stay visitors, serviced apartment revenues will continue to be sustained by the presence of long-stay visitors. In addition, the magnitude of the impact will depend on the duration of the outbreak and counteracting measures. However, we expect the performance to be cushioned by government compensating factors in the wake of reduced demand for hospitality services. The Cabinet Secretary for tourism, Najib Balala, announced that the ministry has set aside Kshs 500 mn for the post-corona recovery strategy, which will be used to restore destination confidence to ensure that Kenya remains a preferred travel destination globally.
- Retail Sector
During the week, Choppies supermarket put up for sale its retail equipment and property in Kenya, scaling down its local stores from more than 15 to 2. Choppies, which has its roots in Botswana, aims to utilize the proceeds for clearing some of its outstanding liabilities after revealing plans to exit the Kenyan market four years after acquiring 75% Ukwala stores for Kshs 1.0 bn. The retailer has been struggling to grow its market share in an increasingly competitive retail market characterized by the merger of some of its rivals like Quick Mart and Tumaini and the declining fortunes of big players like Uchumi and Nakumatt. Competition in Kenya’s retail sector has been growing tough with multinational supermarket chains like Carrefour, Shoprite and Game Stores continuing to increase their local footprint across the country. Key issues facing retailers such as Nakumatt and Choppies include poor governance and expansion strategy as well as supply chain mismanagement leading up to crippling financial constraints.
The continued exits by troubled retailers are expected to result in lower occupancy rates in the retail sector. However, we expect the sector’s performance to be cushioned by the continued interest in Kenya’s retail scene by international players.
- Infrastructure
During the week, the National Government, through the Kenya Roads Board, released Kshs 29.0 bn to road agencies and county governments meant for the first half of the 2019/2020 fiscal year. The funds are to be distributed among the Kenya National Highways Authority (KeNHA), Kenya Urban Roads Authority and the Kenya Rural Roads Authority.
The above development is an indication of the continued government focus on the improvement of infrastructure with the aim of elevating the country to upper-middle-class status by 2030. According to Cytonn’s Nairobi Metropolitan Area Infrastructure Note 2019, the sector has in the past years experienced a steady growth which was fueled by; (i) availability of various forms of financing to support the sector, (ii) establishment of the governments public-private partnerships unit, and (iii) enhanced government incentives towards the development of the sector. With the continued government focus on the same, we expect this to support development activities by opening up areas and thus a resultant boost for the real estate sector as the accessibility of an area remains a key factor of consideration by both investors and homebuyers. Despite the reduced development activities in the wake of tough economic times, we still expect the government to continue focusing on infrastructural improvement as it is vital for any economy to grow, thus, equally boosting the real estate market.
We retain a neutral outlook for the real estate sector in Kenya as we continue to witness the effects of the COVID-19 pandemic, which has continued to have a dire impact on the economy. However, the real estate sector is expected to be cushioned by infrastructural development and government's fiscal and monetary policies, such as the recent lowering of the Central Bank rate, which is expected to sustain private sector credit growth.
Disclaimer: The views expressed in this publication are those of the writers where particulars are not warranted. This publication is meant for general information only and is not a warranty, representation, advice or solicitation of any nature. Readers are advised in all circumstances to seek the advice of a registered investment advisor.

- Talk to us
- Kenya
- P.O Box 20695 - 00200, Nairobi, Kenya
- Cell +254709101200
- Tel +254709101200
- WhatsApp +254741676635
- United States
- +254709101200
- DOWNLOAD OUR APP
-


- Kenya
- 8th Floor, Pinetree Plaza, Kaburu Drive, Ngong Road, Nairobi, Kenya
- USA
- Suite 1150, 1775 Eye Street NW, USA, Washington DC 20006, USA
- Investments
- High Yield
- Private Equity
- Real Estate
- Real Estate
- RiverRun Estates
- Cytonn Towers
- The Ridge
- Taraji Heights
- The Alma