Cytonn Weekly #20/2018
By Cytonn Research Team, May 20, 2018
Executive Summary
Fixed Income
T-bills were oversubscribed during the week, with the subscription rate coming in at 183.1%, up from 165.7% the previous week. Yields on the 91, 182 and 364-day papers remained unchanged at 8.0%, 10.3% and 11.1%, respectively. Electricity prices are set to fall in May for the first time this year as Hydroelectric Power (HEP) generation increases due to the heavy rains experienced; while fuel prices are up this month, with petrol, diesel and kerosene prices increasing by 0.3%, 0.8% and 2.0% to Kshs 107.2, Kshs 98.6 and Kshs 78.2 per litre, respectively, effective 15th May to 15th June 2018, driven by increased global fuel prices;
Equities
During the week, the equities market recorded mixed performance with NASI and NSE 25 gaining by 0.6% and 0.7%, respectively, while the NSE 20 declined by 3.0%. Equity Group, KCB Group and NIC Group released Q1’2018 financial results, with the three banks registering an increase in core earnings per share by 21.7%, 14.1% and 2.2%, respectively;
Private Equity
In the FinTech space, Cellulant, a leading Pan-African digital payments service provider, has raised Kshs 4.8 bn (USD 47.5 mn) in its Series C funding round from a consortium of investors that include US based alternative investment manager Texas Pacific Group (TPG), through its fund known as The Rise Fund, Endeavour Catalyst and Satya Capital. In the education sector, One Thousand & One Voices (1K1V), a private family capital fund backed exclusively by families from around the globe, invested in Higher Ed Partners South Africa (HEPSA), a South African online education company;
Real Estate
During the week, the residential sector recorded increased activity with (i) Cool Breeze Development announcing plans to develop a 524-unit residential community along Mombasa Road, (ii) UBA Bank announcing a 1,000-unit affordable housing scheme in Kakamega, which will be in partnership with the National Housing Corporation (NHC), among other entities, and (iii) Consonance Kuramo Special Opportunities Fund I, a subsidiary of New York-based Kuramo Capital, signing a Kshs 20.0 bn deal with Century Developments Limited, to construct 10,000 Purpose-Built Student Housing units and 7,500 affordable housing units for the young population, across East Africa. In the commercial office sector, the Federation of Kenyan Employers announced plans to put up an office building in Upperhill, at a cost of Kshs 620.0 mn, excluding land costs, while in the hospitality sector, the Tourism Regulatory Authority classified 31 hotels across the country, in Meru, Embu, Laikipia, Nyeri and Samburu Counties, in line with the East African Community Classification Criteria.
- On Friday, 18th May 2018, Cytonn Investments Management Plc and Cytonn Cash Management Solutions LLP, held their Annual General Meeting for the financial year ended December 2017, at Radisson Blu Hotel, Upperhill. Cytonn Investments also released its Annual Report for the period, having posted a 276.7% increase in Profit after Tax (PAT) to Kshs 398.0 mn in 2017, from Kshs 105.7 mn in 2016, driven by investment income from the gains made in the stock market and progress made in their real estate developments. Balance sheet growth was also robust, with total assets growing by 49.4%, to Kshs 17.7 bn as at 31st December 2017 from Kshs 11.8 bn as at 31st December 2016. See Event Note and a Statement on the Release of the Financials
- Our Investment Analyst, Stephanie Onchwati, discussed the Kshs 40.0 bn being raised by the Kenyan Government through the issue of a new 15-year Treasury Bond. Watch Stephanie on CNBC here
- We continue to hold weekly workshops and site visits on how to build wealth through real estate investments. The weekly workshops and site visits target both investors looking to invest in real estate directly and those interested in high yield investment products to familiarize themselves with how we support the high yields. Watch progress videos and pictures of The Alma, Amara Ridge, The Ridge, and Taraji Heights. Key to note is that our cost of capital is priced off the loan markets, where all-in pricing ranges from 16.0% to 20.0%, and our yield on real estate developments ranges from 23.0% to 25.0%, hence our top-line gross spread is about 6.0%. If interested in attending the site visits, kindly register here
- We continue to see very strong interest in our weekly Private Wealth Management Training (largely covering financial planning and structured products). The training is at no cost and is open only to pre-screened participants. We also continue to see institutions and investment groups interested in the trainings for their teams. The Wealth Management Trainings are run by the Cytonn Foundation under its financial literacy pillar. If interested in our Private Wealth Management Training for your employees or investment group please get in touch with us through wmt@cytonn.com. To view the Wealth Management Training topics, click here
- For recent news about the company, see our news section here
- We have 10 investment-ready projects, offering attractive development and buyer targeted returns of around 23.0% to 25.0% p.a. See further details here: Summary of Investment-Ready Projects
- We continue to beef up the team with ongoing hires for: Quality Control and Assurance Manager & Associate, Sales & Marketing Manager, Procurement Manager, Relationship Manager – Corporate Affairs, Portfolio Manager and Investments Associate – Public Markets, among others. Visit the Careers section at Cytonn’s website to apply
T-bills were oversubscribed during the week, with the subscription rate coming in at 183.1%, up from 165.7% the previous week. The subscription rates for the 91, 182 and 364-day papers came in at 82.7%, 78.6%, and 327.8% compared to 120.8%, 150.8%, and 198.4%, respectively, the previous week. Yields on the 91, 182 and 364-day papers remained unchanged at 8.0%, 10.3% and 11.1%, respectively. We note that the 364-day paper continued to receive the most interest from investors, having recorded the highest subscription rate of the 3 papers this week of 327.8%, from 198.4% the previous week, as investors seek to lengthen duration. The acceptance rate for T-bills declined to 69.7%, from 91.2% the previous week, with the government accepting a total of Kshs 30.6 bn of the Kshs 43.9 bn worth of bids received, against the Kshs 24.0 bn on offer. The government is currently 31.0% ahead of its pro-rated domestic borrowing target for the current fiscal year, having borrowed Kshs 345.0 bn, against a target of Kshs 263.3 bn (assuming a pro-rated borrowing target throughout the financial year of Kshs 297.6 bn).
For the month of May 2018, the Kenyan Government has issued a new 15-year Treasury bond (FXD 1/2018/15) with the coupon set at 12.7%, in a bid to raise Kshs 40.0 bn for budgetary support. Given that (i) the government is currently 31.0% ahead of its pro-rated domestic borrowing target, and has collected 72.9% of its total foreign borrowing target, and (ii) the KRA is not significantly behind target, having collected 91.2% of its half year 2017/18 target, we don’t expect the government to come under pressure to borrow during the current fiscal year, neither do we expect upward pressure on interest rates during the same period. Treasury bonds with the same tenor are currently trading in the secondary market at a yield of 13.0%. As such, we expect the average yield to come in between 13.0% and 13.3%.
Liquidity levels improved in the money market as indicated by the decline in the average interbank rate to 4.4%, from 5.0% recorded the previous week, and the reduction in the average volumes traded in the interbank market by 18.1% to Kshs 12.7 bn, from Kshs 15.5 bn the previous week. The reduced pressure on liquidity can be attributed to the end of the monthly Cash Reserve Requirement (CRR) cycle for the month of May, which ended on the 14th. The CRR is the percentage of deposits that commercial banks are required to keep with the Central Bank of Kenya. It is a mandatory requirement, and Kenya’s CRR currently stands at 5.25% of deposits held by a commercial bank. How the CRR cycle works is that, all commercial banks are required to maintain a CRR of 5.25% of their deposits for a month, ending on the 14th of every month, but can let the ratio get to a low of 3.0% during the month, as long as the average for the month gets to 5.25%. Towards the end of a cycle, banks are always under pressure to meet the requirement if they had not met it earlier on in the cycle, but after one cycle ends and another begins, the pressure on liquidity for banks reduces.
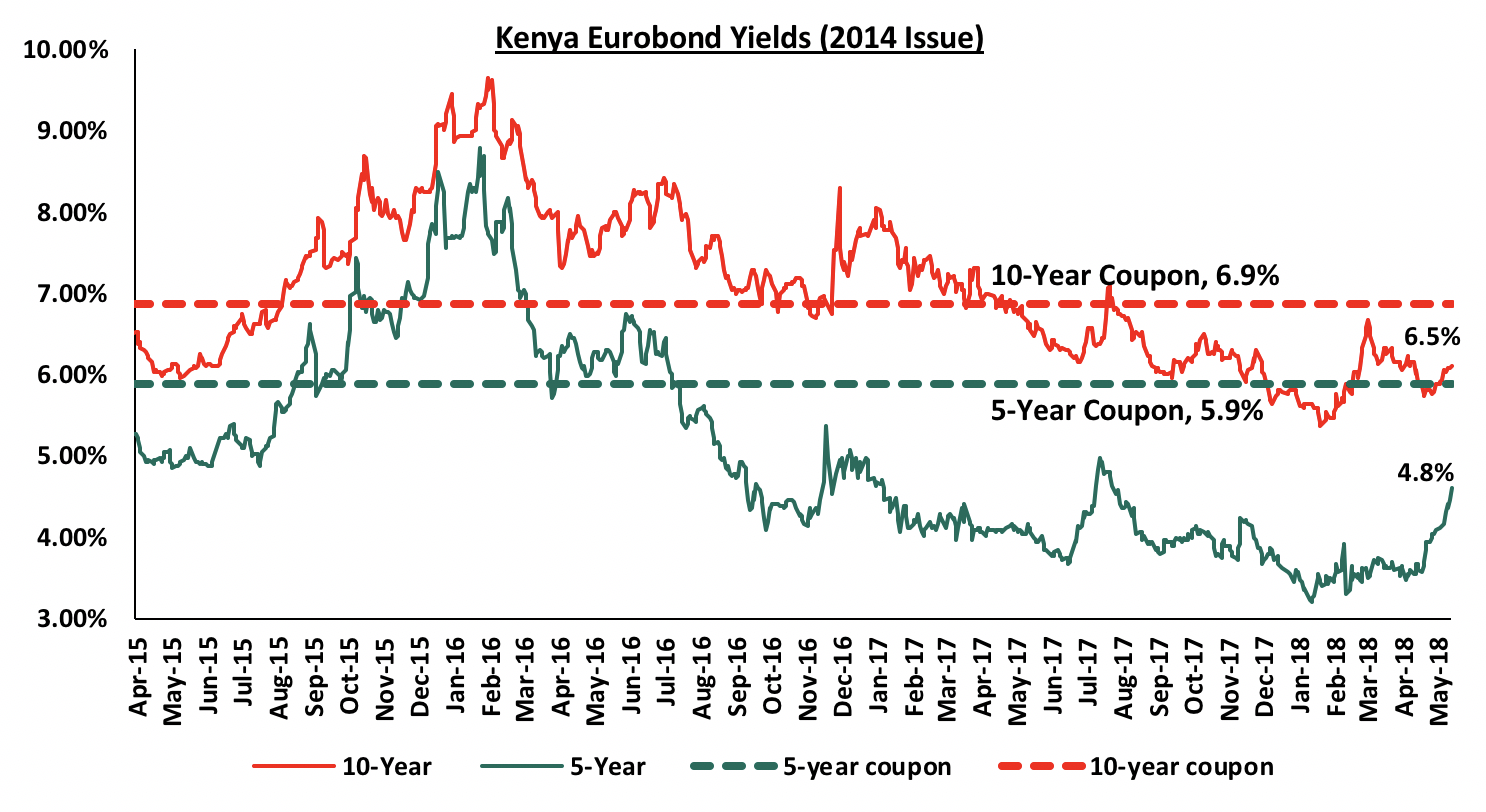
According to Bloomberg, the yield on the 5-year Eurobond issued in June 2014 increased by 30 bps to 4.8% from 4.5%, the previous week, while the yield on the 10-year Eurobond increased by 10 bps to 6.5% from 6.4% the previous week. The increase during the week can be attributed to varying market sentiments from foreign investors. Since the mid-January 2016 peak, yields on the Kenya Eurobonds have declined by 4.0% points and 3.2% points for the 5-year and 10-year Eurobonds, respectively, due to the relatively stable macroeconomic conditions in the country.
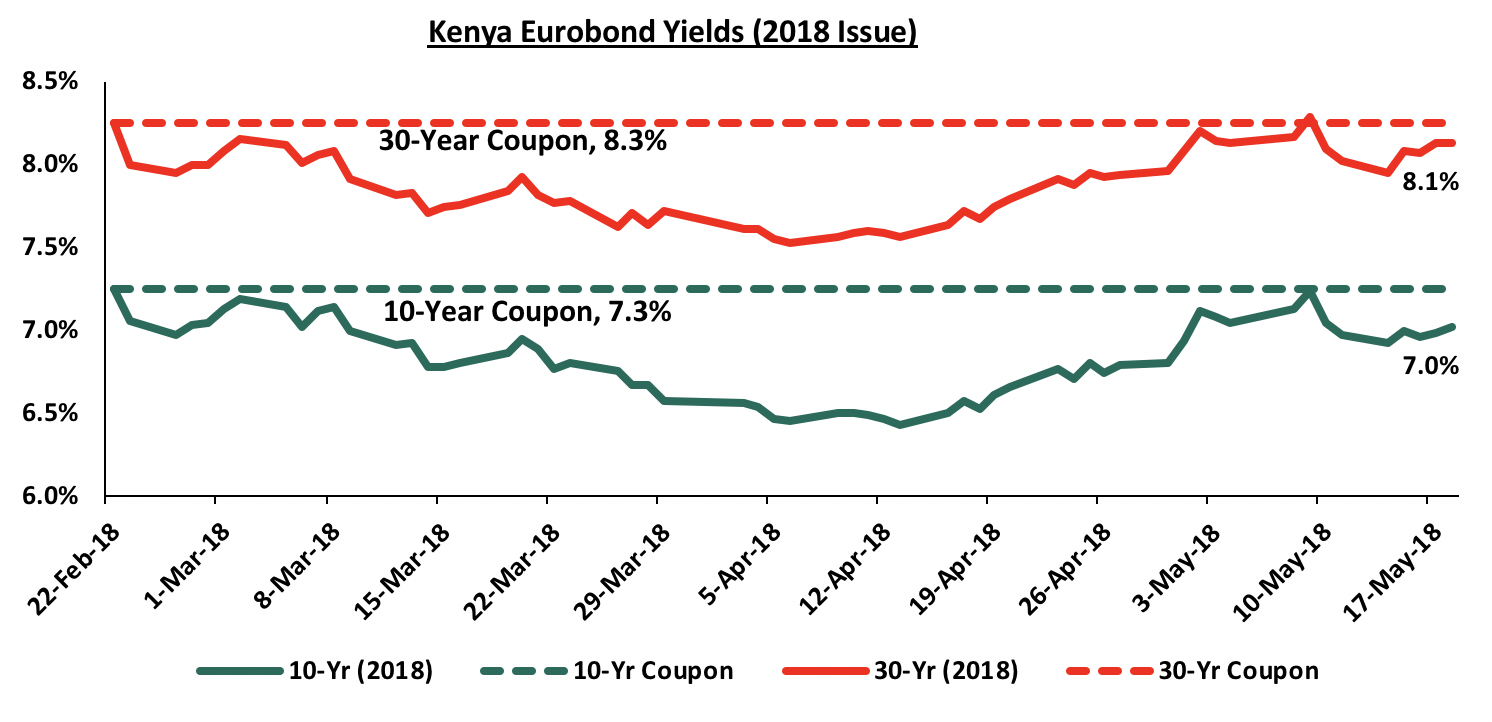
For the February 2018 Eurobond issue, during the week, the yield on the 10-year Eurobond remained unchanged at 7.0%, while the yield on the 30-year Eurobond increased by 10 bps to 8.1%, from 8.0% the previous week. Since the issue date, yields on the 10-year and 30-year Eurobonds have both declined by 0.3% points and 0.2% points for the 10-year and 30-year Eurobonds, respectively, indicating foreign investor confidence in Kenya’s macroeconomic prospects.
During the week, the Kenya Shilling remained stable, closing at Kshs 100.4 to the US Dollar, as dollar inflows from diaspora and portfolio investors matched demand from oil importers. On a YTD basis, the shilling has gained 2.7% against the USD. In our view, the shilling should remain relatively stable against the dollar in the short term, supported by:
- Stronger horticulture export inflows driven by increasing production and improving global prices,
- Improving diaspora remittances, which increased by 50.6% to USD 222.2 mn in March 2018 from USD 147.5 mn in March 2017, attributed to (a) recovery of the global economy, (b) increased uptake of financial products by the diaspora due to financial services firms, particularly banks, targeting the diaspora, and (c) new partnerships between international money remittance providers and local commercial banks making the process more convenient. Key to note is that in 2017, diaspora remittances became the largest foreign exchange earner at Kshs 202.9 bn, exceeding tea exports and tourism receipts, which earned Kshs 119.9 bn and Kshs 147.2 bn, respectively, and,
- High forex reserves, currently at USD 9.1 bn (equivalent to 6.2 months of import cover) and the USD 1.5 bn stand-by credit and precautionary facility by the IMF, still available until September 2018, after which a new facility will be discussed.
During the week, South Africa raised USD 2.0 bn through the issue of 12-year and 30-year Eurobonds at yields of 5.9% and 6.3%, respectively. The issue was 1.7x oversubscribed, as the increase in investor appetite for the African bonds continues. The issue came a month after Moody’s Investor Service confirmed South Africa’s sovereign long-term issuer and senior unsecured ratings of “Baa3”, and changed the outlook to “positive” from “negative” citing the potential of economic recovery with the recent change in leadership of the country. This was the second Eurobond issue in Africa in the 2nd quarter of 2018 after Ghana managed to raise a similar amount a week earlier through the issuance of 10-year and 30-year Eurobonds at yields of 7.6% and 8.6%, respectively. Ghana’s issue was also oversubscribed at 4.0x the targeted amount, higher than South Africa, which we attribute to their relatively higher yields. Moody’s Investor Service affirmed Ghana’s sovereign long-term issuer and senior unsecured bond ratings at “B3” maintaining the outlook at “stable”. Ghana’s economy has continued to improve, recording GDP growth of 8.5% in 2017, up from 3.7% in 2016. The country however still grapples with increasing public debt, with the International Monetary Fund (IMF) estimating their public debt-to-GDP at 70.5% in 2017, 20.5% points above the 50.0% recommended threshold, but with the country implementing the IMF credit-facility program, the budget deficit has since narrowed to 6.3% of GDP in 2017 from 9.3% in 2016. From the Eurobond issuances that have taken place so far this year, we note that governments have begun issuing more long-term Eurobonds, 30-years on average, to increase their liability tenures, a commendable debt management move.
Following the March 2018 IMF visit to Kenya, the Treasury has been seeking ways to increase revenue collected going forward, in a bid to reduce the budget deficit and Kenya’s public debt burden. With respect to this, the following changes have been tabled in parliament through various tax bills, including the Income Tax Bill, 2018 and the Tax Laws (Amendment) Bill, 2018:
- 35.0% tax on individuals earning Kshs 750,000 per month and above as well as large corporations with a monthly taxable income of more than Kshs 500 mn, and,
- Amendments to the VAT Act that include changing the status of various products such as milk and cream, maize (corn) flour, bread and wheat among others from zero-rated to exempt, meaning that producers of these products cannot claim Value Added Tax (VAT) on inputs from the government, thus increasing their retail prices.
These changes as well as the expected 16.0% VAT on petroleum products as from September 2018 is aimed at increasing revenue collections by the KRA and reducing the budget deficit to 6.0% of GDP in the fiscal year 2018/19, and further to 3.0% of GDP by 2021/22, from 7.2% in this fiscal year. Prices of basic goods, however, will take a hit as suppliers will pass on the additional tax cost burden to the final consumers, thus leading to a rise in food inflation in the period of implementation. As we continue to see significant changes to taxes, we are of the view that this should be accompanied by equally significant reduction efforts in recurrent expenditure, as only this joint effort will lead to a substantial decline in the budget deficit and in turn the public debt burden.
On inflation for the month of May;
- Electricity prices are set to fall in May for the first time this year attributed to (a) a 7.5% decline in the fuel levy to Kshs 5.0 from Kshs 5.4 per Kilowatt Hour (KwH) previously, due to reduced reliance on the more expensive thermal electricity powered by diesel generators, as generation of the cheaper Hydroelectric Power (HEP) increases now that dams are filling up thanks to the heavy rainfall experienced recently, and (b) a decline in the forex levy by 15.3% to Kshs 1.2, from Kshs 1.4 per KwH previously in May, due to continued appreciation of the Kenya Shilling, and,
- According to the Energy Regulatory Commission (ERC), petrol, diesel and kerosene prices have increased by 0.3%, 0.8% and 2.0% to Kshs 107.2, Kshs 98.6 and Kshs 78.2 per liter, respectively, effective 15th May to 15th June, driven by increased global fuel prices, which edged closer to USD 70.0 per barrel, from USD 66.1 per barrel previously.
The rise in fuel prices is expected to push the transport and fuel indices up, hence reflecting in the rise in m/m inflation. This however is expected to be offset by the decline in electricity prices. We will release our inflation projection for the month of May 2018 in next week’s report.
Given the current fiscal year is nearly coming to a close, we carried out a review of the seven indicators of interest rates that we track in order to re-evaluate our view. The table below highlights the different economic drivers, and their effects on interest rates. Notably, there is no change in any of the indicators going forward, and the outlook remains very similar to our Q1’2018 view:
|
Macro-Economic Indicators |
2017 Experience |
YTD Experience |
Outlook Going Forward |
Previous View |
Current View |
|
Government Borrowing |
Government had been behind its target on its domestic borrowing schedule since the fiscal year 2017/18 begun, having borrowed Kshs 61.0 bn against a pro-rated target of Kshs 140 bn as at the end of the year
The government had met 39.2% of its H1’2017/18 foreign borrowing target |
The domestic borrowing target was revised downwards to Kshs 297.6 bn from Kshs 410.2 bn
The government is currently 31.0% ahead of its pro-rated domestic borrowing target for the current fiscal year, and has borrowed 72.9% of its total foreign borrowing target |
Government to be under no pressure to borrow as it is ahead of both domestic and not far off from meeting its foreign borrowing target for FY 2017/18, and KRA is not significantly behind its target
Past June, at the start of the next fiscal year however, the government will once again begin a new borrowing cycle, and will likely be behind target as per historical data. Despite this, with the interest rate cap still in place, we don’t expect this to result in upward pressure on interest rates, like we saw at the start of the current fiscal year. Should the cap be repealed, we expect this to result in upward pressure on interest rates in the next borrowing cycle, as the government will be behind target and will no longer have an easy time collecting funds from the domestic market. However, with National Assembly against a complete repeal and the National Treasury working on a Bill to amend the law, we still remain positive on government borrowing until we have a feel of how the Bill will seek to amend the cap and how this in turn will affect borrowing by the government and the interest rate environment
Also, with the Treasury’s efforts to increase revenue collections and reduce expenditure as per directive by the IMF, the borrowing targets for the next fiscal year might be lower |
Positive |
Positive |
|
Revenue Collection |
The KRA missed their collection target for the 2016/2017 FY having collected Kshs 1.4 tn against a target of Kshs 1.5 tn. The 2017/2018 FY target was set at Kshs 1.7 tn. As per the Q1’2017/18 budget review, the KRA met 89.1% of its first quarter target |
The KRA collected Kshs 709.4 bn, 91.2% of their target for H1’2017/18, and 86.3% of the pro-rated target for the same period |
KRA is unlikely to meet its collection target due to expected suppressed corporate earnings in 2017, which is half of the fiscal year. However, KRA is not expected to be significantly behind target, and the deficit can be easily plugged in from the local market borrowing
Corporate earnings are expected to be better this year than last year, with earnings growth expected at 12.0% in 2018, higher than the expected 8.0% growth for 2017. This coupled with the VAT on petroleum products effective September 2018 is expected to boost revenue collections in the next fiscal year |
Neutral |
Neutral |
|
Monetary Policy |
CBR was maintained at 10.0% throughout 2017
The Government remained disciplined in the auction market rejecting expensive bids. The 91 Day T-Bill hit 8.0% from 8.8% recorded at the end of January 2017 |
In the March 2018 MPC meeting, the committee reduced the CBR to 9.5% |
No upward pressure on interest rates, with the government ahead of its pro-rated borrowing targets for the fiscal year. Also, with the interest rate cap still in place, we still maintain that the effectiveness of monetary policy has been weakened |
Neutral |
Neutral |
|
|
Kenya’s Inflation rate averaged 8.0% for the year 2017 up from 6.3% in 2016, mainly due to a rise in prices for Food and Non-alcoholic beverages by 8.0% y/y. Inflation declined to 5.7% in October from 7.1% in September, on account of improved weather conditions. The inflation rate hit a high of 11.7% in May, driven by an increase in basic food prices, and was at 7.0% in January
|
Inflation has averaged 4.3% in the first 4 months of 2018. The year on year inflation rate for the month of April declined to 3.7%, its lowest level since January 2013 driven by food inflation declining to 0.3% from 2.2% in March on account of improved weather conditions |
We expect Inflation to average 7.0% in 2018 down from 8.0% in 2017 and within the government target range of 2.5% - 7.5%. Inflation in H1’2018 is expected to remain low mainly due to the base effect. Inflation in H2’2018 however is expected to experience upward pressure, partly due to the base effect, and the expected rise in fuel and transport prices with the introduction of 16.0% VAT on petroleum products as from September 2018 and also a rise in items in the food basket due to the proposed change of various products from zero-rated to tax-exempt status |
Positive |
Positive |
|
Exchange Rate |
The shilling depreciated by 0.7% against the dollar in 2017, having remained relatively stable for the better part of the year, with volatility only witnessed during the election period following the August 8th election and the repeat presidential poll on 26th October. Volatility was mainly driven by speculation in the forex market and demand from oil importers |
The Shilling has appreciated by 2.7% against the USD YTD to Kshs 100.4 from Kshs 103.2 at the end of December 2017, hitting a high of Kshs 100.0 due to increased inflows from horticulture exports and diaspora remittances Forex reserves are currently at USD 9.1 bn, equivalent to 6.2 months of import cover |
We expect the currency to remain relatively stable against the dollar supported by (i) stronger horticulture export inflows driven by increasing production and improving global prices, (ii) improving diaspora remittances, and (iii) the ample reserves with the IMF having extended the standby credit facility of USD 1.5 bn (approx. 1-month import cover) by 6-months, to allow for review |
Neutral |
Neutral |
|
Investor Sentiments |
Investor sentiment has been high, with foreign investors entering the market in search of attractive valuations, amid a relatively peaceful election period. However, foreign investors were net sellers in 2017, with a net outflow of USD 117.1 mn compared to net inflows of USD 88.8 mn recorded in 2016 |
The Kenya Eurobond was 7.0x oversubscribed partly showing the appetite for Kenyan securities by the foreign community, and investor confidence in Kenya’s stable and relatively diversified economy |
Given (i) the now settling operating environment following the elections in Q3’2017, (ii) the expectation that long term investors will enter the market seeking to take advantage of the valuations which are still historically low, and (iii) expectations of a relatively stable shilling, we expect investor sentiment to improve in 2018 |
Positive |
Positive |
|
Security |
In January, the U.S. Department of State issued a travel warning regarding threats by Al-Shabaab on the Somalia border, coastal and north-eastern counties. In March, the U.K government issued a warning due to security concerns in parts of Laikipia County. As the election date approached, security was beefed up across the country |
The political climate in the country has eased, compared to Q3’2017 with security maintained and business picking up |
We expect security to be maintained in 2018, especially given that the elections are now concluded and the government has settled into office |
positive |
Positive |
Of the 7 indicators we track, 4 are positive (government borrowing, inflation, investor sentiment and security) and 3 are neutral (revenue collection, monetary policy and currency). Rates in the fixed income market have remained stable as the government rejects expensive bids. The government is under no pressure to borrow for the remaining part of the current fiscal year as: (i) they are currently ahead of their domestic borrowing target by 31.0%, (ii) they have met 72.9% of their total foreign borrowing target and 82.4% of their pro-rated target for the current fiscal year, and (iii) the KRA is not significantly behind target in revenue collection. Come the next fiscal year, the government is likely to remain behind target for the better part of the first half as per historical data, but we do not expect this to result in a rise in interest rates with the interest rate cap still in place. Therefore, we expect interest rates to remain stable. With the expectation of a relatively stable interest rate environment, we maintain our view that investors should be biased towards medium to long-term fixed income instruments.
During the week, the equities market recorded mixed performance with NASI and NSE 25 gaining by 0.6% and 0.7%, respectively, while the NSE 20 declined by 3.0%, taking their YTD performance to 4.7%, (5.9%) and 5.9% for NASI, NSE 20 and NSE 25, respectively. This week’s performance of the NASI was due to gains in Safaricom, BAT and Cooperative Bank that gained by 5.4%, 2.7% and 1.1%, respectively. For the last twelve months (LTM), NASI, NSE 20 and NSE 25 have gained 29.1%, 7.7%, and 28.1%, respectively.
Equities turnover declined by 33.1% to USD 33.1 mn, from USD 47.7 mn registered last week. We expect the market to remain supported by positive investor sentiment this year, as investors take advantage of the attractive stock valuations on select counters.
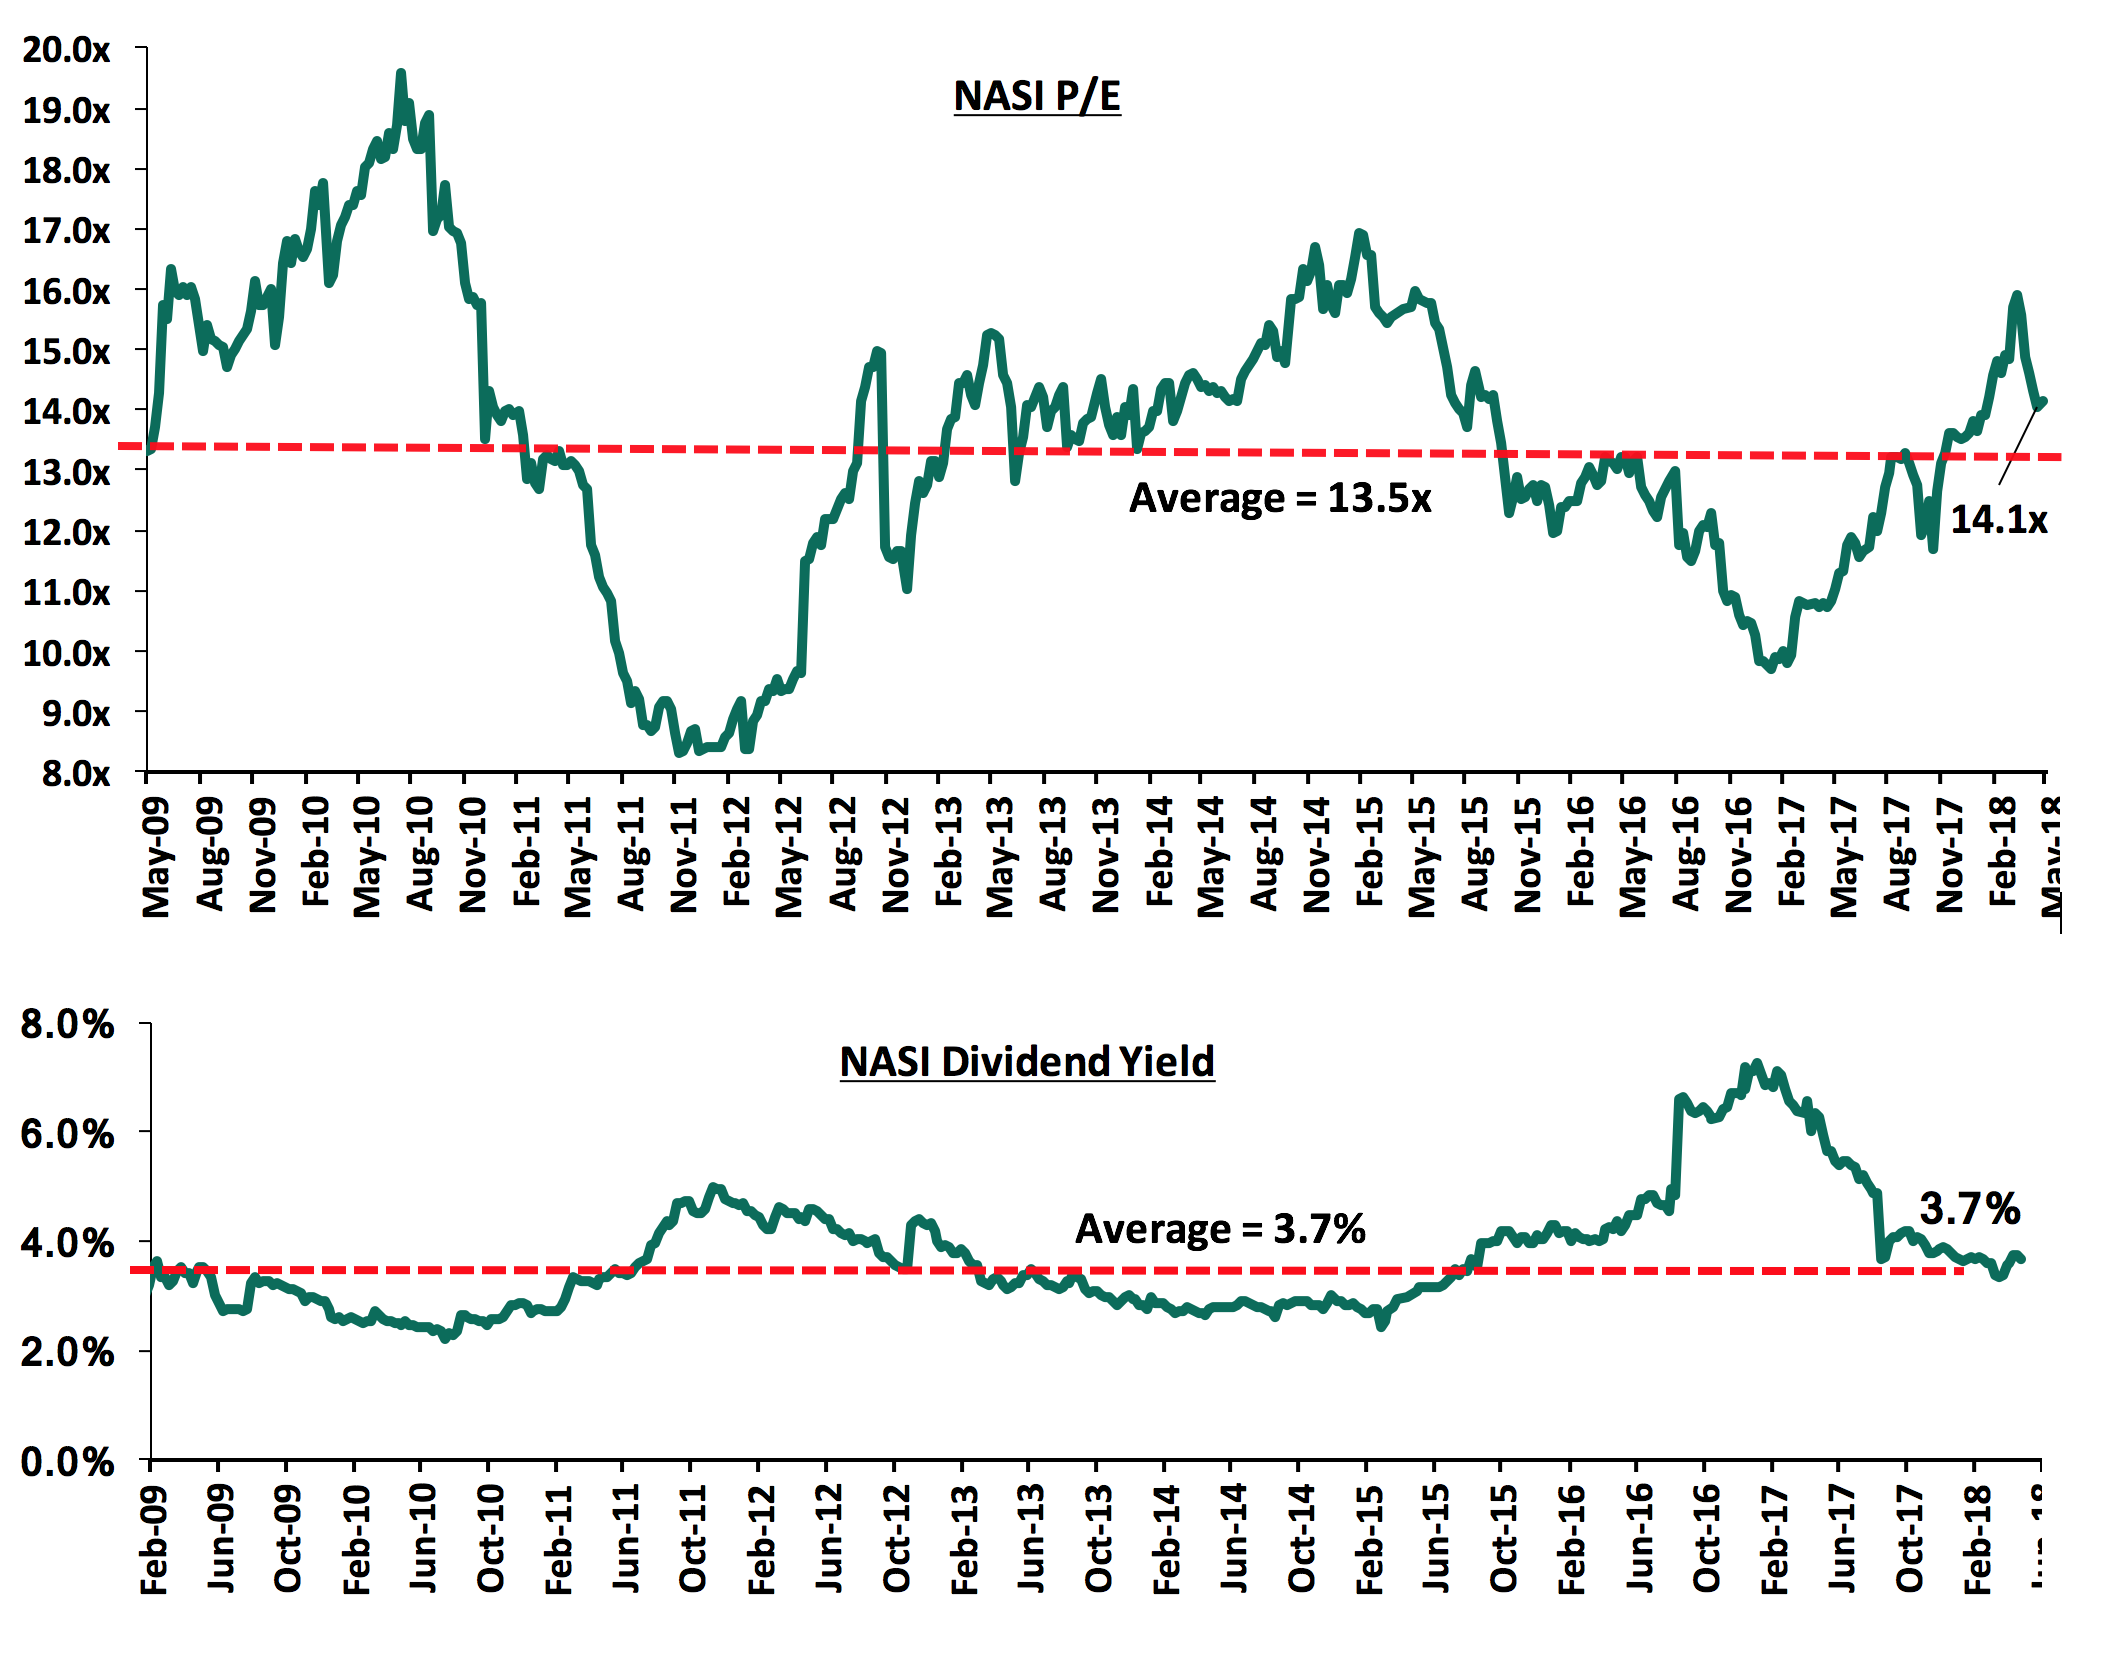
The market is currently trading at a price to earnings ratio (P/E) of 14.1x, which is 4.4% above the historical average of 13.5x, and a dividend yield of 3.7%, which is similar to the historical average of 3.7%. The current P/E valuation of 14.1x is 45.4% above the most recent trough valuation of 9.7x experienced in the first week of February 2017, and 69.9% above the previous trough valuation of 8.3x experienced in December 2011. Below are the P/E and dividend yield charts of the NASI:
KCB Group released Q1’2018 results during the week;
KCB Group released Q1’2018 results, with its core earnings per share increasing by 14.0% to Kshs 6.8 from Kshs 5.9 in Q1’2017, compared to our expectation of a 2.2% increase to Kshs 6.0. The performance was driven by a 6.7% increase in total operating income, which outpaced the 1.8% increase in total operating expenses, to Kshs 9.5 bn in Q1’2018 from Kshs 9.3 bn in Q1’2017. The variance in core earnings per share growth against our expectations was largely due to a 37.0% decline in KCB’s provisioning levels despite the compliance with IFRS 9 that adopts a forward-looking approach to credit risk assessment. We expected provisioning levels of Kshs 1.0 bn, that came in at Kshs 0.6 bn. Highlights of the performance from Q1’2017 to Q1’2018 include:
- Total operating income increased by 6.7% to Kshs 17.0 bn, from Kshs 15.9 bn in Q1’2017, driven by an increase in Net Interest Income (NII) that rose by 10.0% to Kshs 11.4 bn, from Kshs 10.3 bn in Q1’2017. Non-Funded Income (NFI) declined marginally by 0.4% to Kshs 5.5 bn, from Kshs 5.6 bn in Q1’2017,
- Interest income increased by 11.0% to Kshs 15.7 bn from Kshs 14.1 bn in Q1’2017. The interest income on loans and advances increased by 10.9% y/y to Kshs 12.6 bn from 11.3 bn, while interest income on government securities increased by 17.2% y/y to Kshs 3.0 bn from Kshs 2.6 bn. As a result, the yield on interest-earning assets increased slightly to 12.0%, from 11.9% in Q1’2017,
- Interest expense increased 13.0% to Kshs 4.2 bn, from Kshs 3.8 bn in Q1’2017, following an 18.9% increase in the interest expense on customer deposits to Kshs 3.8 bn in Q1’2018, from Kshs 3.1 bn in Q1’2017, increasing the cost of funds to 3.1% from 3.0% in Q1’2017. The Net Interest Margin remained stable at 8.2%, as the rate of change in yield on interest income and cost of interest expense was the same,
- Non-Funded Income (NFI) declined marginally by 0.4% to Kshs 5.5 bn, from Kshs 5.6 bn in Q1’2017, due to a decline in total fees and commissions, which declined by 2.3% to Kshs 1.4 bn from Kshs 1.43 bn in Q1’2017, and forex trading income declined 19.7% to Kshs 1.0 bn from Kshs 1.3 bn in Q1’2017. However, other income rose 7.6% to Kshs 0.9 bn from Kshs 0.8 bn,
- The current revenue mix stands at about 67:33 funded to non-funded income, from 65:35 recorded in Q1’2017. The decline in the proportion of NFI to total income is due to a faster growth in NII coupled with a 0.4% decline in NFI,
- Total operating expenses increased by 1.8% to Kshs 9.5 bn from Kshs 9.3 bn in Q1’2017, largely driven by an increase in other operating expenses, which rose by 13.9% to Kshs 3.3 bn from Kshs 2.9 bn in Q1’2017. Rental charges rose 8.0% to Kshs 337.5 mn from Kshs 312.5 mn. Staff costs rose by 0.2% to Kshs 4.5 bn in Q1’2018 from Kshs 4.4 bn in Q1’2017. However, loan loss provisions (LLP) decreased by 37.0% to Kshs 0.6 bn from Kshs 1.0 bn in Q1’2017,
- The cost to income ratio improved to 55.9% from 58.6% in Q1’2017. Without LLP, the Cost to income ratio also improved, albeit marginally to 52.4% in Q1’2018 from 52.5% in Q1’2017,
- Profit before tax increased by 14.0% and to stand at Kshs 7.5 bn, up from Kshs 6.6 bn in Q1’2017. Profit after tax also increased 14.0% to Kshs 5.2 bn from Kshs 4.5 bn in Q1’2017,
- The balance sheet recorded an expansion in Q1’2018. Total assets increased by 7.0% to Kshs 647.5 bn from Kshs 605.8 bn in Q1’2017. The loan book increased by 6.0% to stand at Kshs 418.6 bn from Kshs 395.5 bn in Q1’2017. Government securities increased by 5.8% to Kshs 112.1 bn from Kshs 106.0 bn in Q1’2017 while fixed assets increased by 5.1% to Kshs 11.0 bn from Kshs 9.5 bn,
- Total liabilities rose by 8.6% to Kshs 547.8 bn from Kshs 504.5 bn in Q1’2017, driven by an 8.7% increase in customer deposits to Kshs 496.4 bn from Kshs 456.8 bn in Q1’2017. Deposits per branch closed the quarter at Kshs 1.9 bn, up by 11.8% from Kshs 1.7 bn in Q1’2017,
- The faster growth in deposits compared to loans led to a decline in the loan to deposit ratio to 84.3% in Q1’2018 from 86.6% in Q1’2017,
- Shareholders’ funds declined by 4.4% from Kshs 101.2 bn in Q1’2017 to Kshs 99.6 bn in Q1’2018, mainly due to the 92.7% decline in the statutory loan loss reserve to Kshs 0.9 bn from Kshs 11.7 bn in Q1’2017,
- Gross non-performing loans (NPLs) increased by 36.2% to Kshs 43.8 bn from Kshs 32.2 bn in Q1’2017. The NPL ratio as a consequence deteriorated to 9.9% in Q1’2018 from 7.7% in Q1’2017, as NPLs increased at a faster rate than the loan book,
- KCB Group Plc is currently sufficiently capitalized with a core capital to risk weighted assets ratio of 15.1%, 4.6% above the statutory requirement of 10.5%. The total capital to risk weighted assets ratio is 15.3%, exceeding the statutory requirement of 14.5% by just 0.8%, an indication that the bank may seek to raise additional Tier II capital this year. Adjusting for IFRS 9, the core capital to risk weighted assets stood at 15.9%, while total capital to risk weighted assets came in at 16.9%, indicating that the bank’s total capital relative to its risk-weighted assets declined by 0.8% owing to IFRS 9 implementation,
- KCB Group currently has a return on average assets of 3.2% and a return on average equity of 20.3%.
Going forward, we expect the bank’s growth to be propelled by;
- Non-Funded Income Growth Initiatives - This includes increasing other fees and commission income by leveraging on mobile and internet banking to increase the transaction income. Additionally, the brand is underutilized in fee income businesses such as investment banking, brokerage, asset and investment management, and advisory, and it does not seem like the current management has the ability to diversify the revenue streams. KCB’s NFI ratio currently stands at 33.0%, slightly lower than the industry average of 33.6%. KCB should diversify its sources of revenue in order to compete favorably in the interest rate cap environment,
- Alternative Distribution Channels – By leveraging on alternative distribution channels for the bank’s products and services, such as agency banking, internet and mobile banking platforms, would address the stagnating growth in non-funded sources of income for the bank thereby creating efficiencies and improving overall profitability for the bank, and,
- Furthermore, the bank hopes to reduce the non-performing loans by aiding in reinstating of collapsed businesses, which will enable them to service their loans, and thus improve the bank’s asset quality.
For a comprehensive analysis, see our KCB Group Q1’2018 Earnings Note.
Equity Group Holding released Q1’2018 financial results;
Equity Group Holdings released Q1’2018 results, with its core earnings per share increasing by 21.7% to Kshs 5.9 from Kshs 4.9 in Q1’2017, compared to our expectation of a 17.5% increase to Kshs 5.7. Performance was driven by an 8.6% increase in total operating income, coupled with a 1.2% decrease in the total operating expenses. The variance in core earnings per share growth against our expectations was largely due to a 55.0% decline in Equity’s provisioning levels despite the compliance with IFRS 9 that adopts a prospective approach to credit risk assessment. We expected provisioning levels of Kshs 0.9 bn, that came in at Kshs 0.4 bn. Highlights of the performance from Q1’2017 to Q1’2018 include:
- Total operating income increased by 8.6% to Kshs 16.5 bn in Q1’2018, from Kshs 15.2 bn in Q1’2017. This was due to a 10.5% increase in Net Interest Income (NII) to Kshs 9.8 bn in Q1’2018 from Kshs 8.9 bn in Q1’2017, coupled with a 6.3% increase in Non-Funded Income (NFI) to Kshs 6.7 bn in Q1’2018 from Kshs 6.3 bn in Q1’2017,
- Interest income increased by 10.5% to Kshs 12.7 bn in Q1’2018 from Kshs 11.5 bn in Q1’2017 bn. The interest income on loans and advances increased by 7.0% to Kshs 8.8 bn in Q1’2018 from Kshs 8.2 bn in Q1’2017. Interest income on government securities increased by 21.9% to Kshs 3.9 bn in Q1’2018 from Kshs 3.2 bn in Q1’2017. The yield on interest earning assets however declined to 11.3% in Q1’2018 from 13.0% in Q1’2017, due to the relatively faster increase in the interest earning assets to Kshs 458.3 bn from Kshs 407.1 bn in Q1’2017,
- Interest expense increased by 10.5% to Kshs 2.9 bn in Q1’2018 from Kshs 2.6 bn in Q1’2017, following a 16.8% increase in the interest expense on customer deposits to Kshs 2.4 bn in Q1’2018 from Kshs 2.0 bn in Q1’2017. Other interest expenses declined by 18.7% to Kshs 0.4 bn in Q1’2018 from Kshs 0.5 bn in Q1’2017. The cost of funds remained unchanged at 2.7%. Net Interest Margin declined to 8.4% from 8.5% in Q1’2017,
- Non-Funded Income increased by 6.3% to Kshs 6.7 bn from Kshs 6.3 bn in Q1’2017. The growth in NFI was driven by a 7.2% increase in Fees and commissions on loans to Kshs 1.5 bn from Kshs 1.4 bn in Q1’2017, and a 3.2% increase in other fees and commission income to Kshs 3.2 bn from Kshs 3.1 bn in Q1’2017. Foreign exchange income however declined by 26.9% to Kshs 0.7 bn from Kshs 0.9 bn in Q1’2017. The current revenue mix stands at 59:41 funded to non-funded income as compared to 58:42 in Q1’2017. The proportion of non-funded income to total revenue declined slightly owing to the faster growth in NII as compared to NFI,
- Total operating expenses declined by 1.2% to Kshs 8.2 bn from Kshs 8.3 bn, largely driven by a 55% decrease in the loan loss provision to Kshs 0.4 bn in Q1’2018 from Kshs 0.8 bn in Q1’2017, coupled with a 9.5% decline in the depreciation charge on property and equipment to Kshs 0.8 bn in Q1’2018 from Kshs 0.9 bn in Q1’2017. Staff costs however rose by 6.0% to Kshs 2.6 bn in Q1’2018 from Kshs 2.5 bn in Q1’2017, owing to increased staff reorganization costs as 400 employees were laid off,
- The cost to income ratio improved to 49.6% from 54.7% in Q1’2017. Without LLP, the Cost to income ratio also improved to 47.5% from 49.4% in Q1’2017,
- Profit before tax increased by 21.0% to Kshs 8.3 bn, up from Kshs 6.9 bn in Q1’2017. Profit after tax increased 21.7% to Kshs 5.9 bn in Q1’2018 from Kshs 4.9 bn in Q1’2017,
- The balance sheet recorded an expansion as total assets increased by 2.0% to Kshs 402.2 bn from Kshs 393.9 bn in Q1’2017. This growth was largely driven by a 32.9% increase in the government securities to Kshs 150.2 bn from Kshs 113.0 bn. Net loans and advances increased by 3.5% to Kshs 271.1 bn in Q1’2018 from Kshs 261.9 bn in Q1’2017,
- Total liabilities rose by 8.0% to Kshs 445.7 bn from Kshs 412.7 bn in Q1’2017, driven by a 10.0% increase in total deposits to Kshs 382.4 bn in Q1’2018 from Kshs 349.3 bn in Q1’2017. Deposits per branch increased by 9.5% to Kshs 1.4 bn from Kshs 1.2 bn in Q1’2017,
- The faster growth in deposits as compared to loans led to the decline in the loan to deposit ratio to 70.9% from 75.0% in Q1’2017,
- Gross non-performing loans decreased by 7.2% to Kshs 18.1 bn in Q1’2018 from Kshs 19.5 bn in Q1’2017. Consequently, the NPL ratio improved to 6.3% in Q1’2018 from 7.1% in Q1’2017. The NPL coverage increased to 105.1% in Q1’2018 from 64.9% in Q1’2017, as the group implemented provisioning under the IFRS 9 reporting standard,
- Shareholders’ funds increased by 3.0% to Kshs 82.1 bn in Q1’2018 from Kshs 79.4 bn in Q1’2017.
- Equity Group Holdings is currently sufficiently capitalized with a core capital to risk weighted assets ratio of 19.3%, 8.8% above the statutory requirement. In addition, the total capital to risk weighted assets ratio was 20.2%, exceeding the statutory requirement by 5.7%. Adjusting for IFRS 9, the core capital to risk weighted assets stood at 20.2%, while total capital to risk weighted assets came in at 20.3%, indicating that the bank had its capital position decline by 0.5% due to implementation of IFRS 9,
- Equity Group currently has a return on average assets of 3.9% and a return on average equity of 24.7%.
Going forward, we expect the bank’s growth to be further propelled by;
- Increased focus on alternative distribution channels, as the bank rides on the digital revolution wave, as evidenced by the increase in the number of transactions done via the Equity Eazzy Banking app, which had the number of transactions increase by 239.0% to 48.7 mn transactions from 14.4 mn transactions in Q1’2017. This consequently saw the value of transactions done via the channel increase by 146.0% to Kshs 26.7 bn from Kshs 10.9 bn in Q1’2017. Equitel on the other hand had the number of transactions decline by 16.0% to 60.1 mn transactions from 71.4 mn transactions in Q1’2017. However, the value of transactions done via Equitel increased by 17.0% to Kshs 138.5 bn from 118.0 bn in Q1’2017. Thus, the adoption of these alternative channels will help in improving the cost to income ratio by cost rationalization and revenue expansion, thereby aiding the group in achieving a sustainable growth,
- The bank’s operating model of enhancing balance sheet agility is likely to place the bank in a prime position to take advantage of any opportunities that may arise, such as attractive inorganic growth opportunities via acquisitions or fast lending in the event of a repeal of the interest rate cap, and,
- Increased focus on regional expansion as the bank focuses on increasing its footprint in regions it has already established itself as it aims to diversify across geographies.
For a comprehensive analysis, see our Equity Group Q1’2018 Earnings Note.
NIC Group Holding released Q1’2018 financial results;
NIC Group released Q1’2018 results, recording core earnings per share (Core EPS) growth of 2.2% to Kshs 1.38 from Kshs 1.35 in Q1’2017, compared to our expectation of a 3.4% growth in core EPS to Kshs 1.4. The performance was driven by a faster decline in total operating expenses by 8.1% outpacing the decline in total operating revenue, which declined by 4.6%. The variance in core earnings per share growth against our expectations was largely due to a 36.6% decline in NIC’s provisioning levels despite the compliance with IFRS 9 that adopts a forward-looking approach to credit risk assessment. We expected provisioning levels of Kshs 0.9 bn, that came in at Kshs 0.6 bn. Highlights of the performance from Q1’2017 to Q1’2018 include:
- Total operating revenue declined by 4.6% to Kshs 3.5 bn from Kshs 3.7 bn in Q1’2017. This was due to an 8.3% decline in Net Interest Income (NII) to Kshs 2.5 bn from Kshs 2.7 bn, despite a 5.5% increase in Non - Funded Income (NFI) to Kshs 1.0 bn from Kshs 988.9 mn in Q1’2017,
- Interest Income increased by 8.2% to Kshs 4.7 bn from Kshs 4.3 bn in Q1’2017, driven by a 66.1% increase in interest income on government securities to Kshs 1.6 bn from Kshs 962.8 mn in Q1’2017. Interest income on loans and advances declined by 8.9% to Kshs 3.0 bn from Kshs 3.3 bn in Q1’2017. The yield on interest earning assets decreased to 11.2% from 12.2% in Q1’2017,
- Interest expense increased by 35.9% to Kshs 2.2 bn, from Kshs 1.6 bn in Q1’2017, driven by a 43.7% increase in interest expense on customer deposits to Kshs 1.8 bn, from Kshs 1.2 bn in Q1’2017. The cost of funds came in at 5.2%, from 4.8% in Q1’2017. The Net Interest Margin thus declined to 6.3% from 7.9% in Q1’2017, as a result of a faster increase in interest expense as compared to the increase in interest income,
- Non-funded income recorded a growth of 5.5% to Kshs 1.0 bn from Kshs 988.9 mn in Q1’2017. The growth in NFI was driven by a 33.1% increase in other income to Kshs 178.6 mn, from Kshs 134.2 mn in Q1’2017. Components of other income include rental income, gains/losses on disposal of motor vehicles & equipment, bad debt recoveries and trust & other fiduciary fees and it is not clear which component drove the 33.1% growth, and it appears a one-time increase as opposed to a sustainable fundamental increase. Total fees and commissions also increased by 1.8% to Kshs 564.0 mn from Kshs 554.0 mn in Q1’2017,
- Owing to the increase in NFI coupled with the decline in NII, the current revenue mix came in at 70:30 funded to non-funded income from 73:27 in Q1’2017,
- Total operating expenses declined by 8.1% to Kshs 2.1 bn from Kshs 2.3 bn in Q1’2017, following a 36.6% y/y decline in Loan loss provisions (LLP) to Kshs 0.6 bn from Kshs 0.9 bn in Q1’2017. Without LLP, operating expenses grew by 9.2% to Kshs 1.6 bn from Kshs 1.5 bn registered in Q1’2017. Staff costs grew by 12.0% to Kshs 0.8 bn from Kshs 0.7 bn in Q1’2017,
- The Cost to Income ratio improved to 60.7% from 63.0% in Q1’2017. Without LLP, cost to Income ratio deteriorated to 45.0% from 39.3% in Q1’2017,
- Profit before tax increased by 1.3% to Kshs 1.39 bn from Kshs 1.37 bn. Profit after tax increased by 2.2% to Kshs 972.7 mn from Kshs 952.0 mn in Q1’2017,
- The balance sheet recorded an expansion in Q1’2018, with total assets increasing by 14.9% to Kshs 199.8 bn from Kshs 173.8 bn in Q1’2017. This expansion was driven by an 81.2% increase in government security holdings to Kshs 54.7 bn from Kshs 30.2 bn in Q1’2017,
- The Loan book declined by 0.4% to Kshs 115.9 bn from Kshs 116.3 bn in Q1’2017,
- Total liabilities increased by 17.5% to Kshs 167.8 bn from Kshs 142.8 bn in Q1’2017, driven by a 22.1% increase in customer deposits to Kshs 143.9 bn from Kshs 117.8 bn in Q1’2017,
- Deposits per branch increased by 14.8% to Kshs 2.9 bn from Kshs 2.5 bn in Q1’2017, with the bank’s branch network increasing by four branches that opened in 2018. The bank’s efforts to strengthen its network channels through 4 new branches at the Coast in 2018 are aimed at boosting its deposit mobilization capabilities,
- The faster growth in deposits compared to loans resulted in a decline in the loan to deposit ratio to 80.5% from 98.7% in Q1’2017,
- Gross non-performing loans (NPLs) increased by 15.5% to Kshs 15.9 bn from Kshs 13.8 bn in Q1’2017. The faster growth in NPLs coupled with a contraction in the loan book resulted in the NPL ratio deteriorating to 12.9% from 11.3% in Q1’2017. Gross NPL coverage ratio increased to 48.0% from 43.3% in Q1’2017,
- Shareholders’ funds increased by 3.4% to Kshs 31.6 bn from Kshs 30.5 bn in Q1’2017,
- NIC Group is currently sufficiently capitalized with a core capital to risk weighted assets ratio at 18.2%, 7.7% above the statutory requirement of 10.5%, with total capital to total risk weighted assets exceeding statutory requirement by 6.3% to close the period at 20.8%. Adjusting for IFRS 9, the core capital to risk weighted assets stood at 19.0%, while total capital to risk weighted assets came in at 21.6%, indicating the bank took a capital hit of 0.8% owing to IFRS 9 compliance,
- NIC Group currently has a return on average assets of 2.2% and a return on average equity of 13.4%. The ROAE of 13.4% is way below industry average of 17.6%, an indicator that the franchise is underperforming
Going forward NIC Group has an opportunity to address its poor performance by targeting the following areas:
- NIC Group’s NFI is still below industry average, coming in at 30.0% while the industry is at 33.6%; yet it has fee income businesses such as NIC Securities and NIC Capital. NIC Group is really performing below its potential on fee income businesses, with total fees rising a mere 1.8%, and this should be a key area of focus to improve profitability,
- Better deployment of deposits, which grew strongly by 22.1%, leading to a 35.9% growth in interest expense, but the bank was not able to deploy the strong deposit growth into yielding assets, leading to an 8.3% drop in Net Interest Income.
- Bring down the cost of funds, as it’s not clear why the bank is aggressive in mobilizing expensive deposits that it is not able to deploy, as the loan book actually declined even as deposits grew aggressively at 22.1%, leading to cost of money at 5.2%, which is too high, above Tier 1 and 2 averages of 3.1%, and almost double the cost of other players such as Equity Group at 2.7%. The bank needs to urgently address its cost of funding,
- Focusing on improving their asset quality, with the establishment of the Credit Risk Advisory Group (CRAG) division expected to improve the credit appraisal process and loan recovery efforts. This in turn should reduce NIC Group’s NPLs. NIC Group’s Gross Non-Performing Loans ratio came in at 12.9%, which is way above industry average of 8.3%,
- NIC should strive to manage its rising staff costs, which increased by 12.0%, which is way higher than the average industry increase of 3.6%. Increased adoption of alternative distribution channels such as mobile and internet banking will aid in increasing the bank’s operation efficiency, by cost reduction, as well as increase the bank’s transaction income, thereby achieving sustainable growth.
For a comprehensive analysis, see our NIC Group Q1’2018 Earnings Note.
Below is a summary of the Q1’2018 results for the four listed banks that have released:
|
Bank |
Core EPS Growth |
Interest Income Growth |
Interest Expense Growth |
Cost of Funds |
Net Interest Income Growth |
Net Interest Margin |
Non-Funded Income (NFI) Growth |
NFI to Total Operating Income |
Growth in Total Fees & Commissions |
Deposit Growth |
Loan Growth |
Growth in Govt. Securities |
IFRS 9 Capital Ratios Effect |
|
Stanbic |
79.0% |
17.7% |
17.4% |
3.3% |
17.9% |
7.0% |
55.4% |
49.0% |
73.7% |
13.2% |
11.4% |
83.5% |
(0.6%) |
|
Equity Group |
21.7% |
10.5% |
10.5% |
2.7% |
10.5% |
8.4% |
6.3% |
41.0% |
7.2% |
10.0% |
3.5% |
32.9% |
(0.5%) |
|
KCB Group |
14.1% |
11.0% |
13.0% |
3.1% |
10.0% |
8.2% |
(0.4%) |
32.8% |
(2.3%) |
8.7% |
5.8% |
(10.7%) |
(0.8%) |
|
NIC Group |
2.2% |
8.2% |
35.9% |
5.2% |
(8.3%) |
6.3% |
(5.5%) |
29.6% |
1.8% |
22.1% |
(0.4%) |
81.2% |
(0.8%) |
|
Weighted Average Q1’ 2018 |
22.7% |
11.1% |
13.7% |
3.1% |
9.8% |
8.1% |
7.8% |
41.6% |
9.1% |
10.5% |
4.8% |
29.6% |
(0.6%) |
|
Weighted Average Q1’2017 |
(8.6%) |
(11.6%) |
(10.3%) |
3.0% |
(10.1%) |
9.2% |
18.6% |
37.8% |
8.7% |
11.7% |
7.1% |
43.1% |
- |
Weighted Average* is market cap weighted
Key takeaways from the table include:
- All listed banks recorded an increase in core EPS growth, with the average increase coming in at 22.7%. Growth is driven by an increase in the Net Interest Income (NII), which came in at 9.8%;
- Average deposit growth came in at 10.5%. Interest expense paid on deposits recorded a faster growth of 13.7% on average, indicating that more interest earning accounts have been opened, which increased the cost of funds;
- Average loan growth came in at 4.8%, while investment in government securities has grown by 29.6%, outpacing the loan growth, showing increased lending to the government by banks as they avoid the risky borrowers;
- The average Net Interest Margin in the banking sector currently stands at 8.1%, a decline from the 9.2% recorded in Q1’2017, and,
- Non-funded income has grown by 7.8%, which included a Fee and Commissions growth of 9.1%. This shows that banks are charging more fee income to improve their income on loans above the rate cap maximum.
During the week, the Nairobi Securities Exchange (NSE) announced plans to roll out a test launch of the derivatives market segment, within 6-months. The exchange has obtained the required approval from the Central Bank of Kenya (CBK). Stanbic Bank of Kenya and Cooperative Bank of Kenya have been granted approval to participate as clearing and settlement houses during the pilot testing phase. Initially, six banks were to participate in the pilot phase, including NIC Group, Commercial Bank of Africa (CBA), Barclays and Chase Bank (under receivership), however only Cooperative and Stanbic were granted approval to participate in the test. The establishment of the derivatives market will aid in enhancing the depth of the financial market as it would (i) enable trading and clearing of multi-asset classes, and (ii) create synthetic structured products, thus ultimately providing investors with new investing channels and thereby diversifying their portfolios.
Below is our equities universe of coverage:
|
all prices in Kshs unless stated otherwise |
||||||||||||
|
Banks |
Price as at 11/05/2018 |
Price as at 18/05/2018 |
w/w change |
YTD Change |
LTM Change |
Target Price* |
Dividend Yield |
Upside/(Downside)** |
P/TBv Multiple |
|||
|
NIC Bank*** |
38.3 |
36.0 |
(5.9%) |
(0.7%) |
40.2% |
56.0 |
2.8% |
53.0% |
0.9x |
|||
|
KCB Group |
50.0 |
49.8 |
(0.5%) |
16.4% |
31.8% |
63.7 |
4.0% |
31.4% |
1.6x |
|||
|
Zenith Bank |
28.9 |
28.0 |
(3.1%) |
9.2% |
55.8% |
33.3 |
9.6% |
31.0% |
1.1x |
|||
|
Union Bank Plc |
6.8 |
6.1 |
(9.6%) |
(21.8%) |
40.6% |
8.2 |
0.0% |
30.4% |
0.7x |
|||
|
Diamond Trust Bank |
205.0 |
202.0 |
(1.5%) |
5.2% |
50.7% |
272.9 |
1.3% |
28.8% |
1.1x |
|||
|
Ghana Commercial Bank |
6.4 |
6.5 |
1.6% |
28.7% |
24.8% |
7.7 |
5.8% |
28.2% |
1.5x |
|||
|
I&M Holdings |
124.0 |
118.0 |
(4.8%) |
(7.1%) |
29.7% |
151.2 |
3.0% |
23.9% |
1.2x |
|||
|
Stanbic Bank Uganda |
31.0 |
31.0 |
0.0% |
13.8% |
14.8% |
36.3 |
3.8% |
21.7% |
2.5x |
|||
|
CRDB |
180.0 |
160.0 |
(11.1%) |
0.0% |
-13.5% |
207.7 |
0.0% |
15.4% |
0.6x |
|||
|
Co-operative Bank |
18.5 |
18.7 |
1.1% |
16.9% |
32.3% |
20.5 |
4.3% |
14.9% |
1.6x |
|||
|
Equity Group |
51.0 |
49.8 |
(2.5%) |
25.2% |
44.2% |
54.3 |
4.0% |
14.4% |
2.5x |
|||
|
Barclays |
11.7 |
11.8 |
0.4% |
22.4% |
47.8% |
13.7 |
8.5% |
11.9% |
1.7x |
|||
|
Bank of Kigali |
290.0 |
290.00 |
0.0% |
(3.3%) |
18.4% |
299.9 |
4.8% |
8.2% |
1.6x |
|||
|
National Bank |
7.5 |
6.5 |
(14.0%) |
(31.0%) |
-11.9% |
8.6 |
0.0% |
8.1% |
0.4x |
|||
|
UBA Bank |
11.7 |
11.5 |
(2.1%) |
11.2% |
63.3% |
10.7 |
13.1% |
5.7% |
0.8x |
|||
|
HF Group*** |
10.0 |
9.7 |
(3.0%) |
(7.2%) |
6.2% |
10.0 |
3.3% |
2.6% |
0.4x |
|||
|
Stanbic Holdings |
90.0 |
92.0 |
2.2% |
13.6% |
42.6% |
87.1 |
5.7% |
2.5% |
1.6x |
|||
|
Bank of Baroda |
150.0 |
150.0 |
0.0% |
32.7% |
36.4% |
130.6 |
1.7% |
(0.9%) |
1.2x |
|||
|
Standard Chartered |
211.0 |
209.0 |
(0.9%) |
0.5% |
5.6% |
192.6 |
6.0% |
(1.9%) |
1.7x |
|||
|
Ecobank |
11.7 |
11.7 |
0.0% |
53.3% |
60.7% |
10.7 |
0.0% |
(6.7%) |
3.3x |
|||
|
SBM Holdings |
7.7 |
7.9 |
2.1% |
5.1% |
4.0% |
6.6 |
3.8% |
(11.0%) |
1.1x |
|||
|
Access Bank |
11.3 |
10.9 |
(3.1%) |
4.3% |
49.7% |
9.5 |
3.7% |
(11.5%) |
0.6x |
|||
|
Guaranty Trust Bank |
44.3 |
44.0 |
(0.6%) |
8.0% |
39.2% |
37.2 |
5.5% |
(11.8%) |
2.5x |
|||
|
Stanbic IBTC Holdings |
49.0 |
50.0 |
(0.1%) |
18.0% |
88.3% |
37.0 |
1.2% |
(24.0%) |
2.7x |
|||
|
CAL Bank |
1.8 |
1.7 |
(5.6%) |
57.4% |
120.8% |
1.4 |
0.0% |
(28.9%) |
1.7x |
|||
|
Standard Chartered GH |
34.8 |
32.5 |
(6.8%) |
28.5% |
105.0% |
19.5 |
0.0% |
(44.3%) |
4.4x |
|||
|
FBN Holdings |
12.3 |
11.1 |
(9.8%) |
25.6% |
176.3% |
6.6 |
2.3% |
(44.7%) |
0.7x |
|||
|
Ecobank Transnational |
21.1 |
20.6 |
(2.1%) |
21.2% |
108.1% |
9.3 |
0.0% |
(53.8%) |
0.7x |
|||
|
*Target Price as per Cytonn Analyst estimates |
||||||||||||
|
**Upside / (Downside) is adjusted for Dividend Yield |
||||||||||||
|
***Banks in which Cytonn and/or its affiliates holds a stake. For full disclosure, Cytonn and/or its affiliates holds a significant stake in NIC Bank, ranking as the 5th largest shareholder |
||||||||||||
We are “NEUTRAL” on equities for investors with a short-term investment horizon since the market has rallied and brought the market P/E slightly above its’ historical average. However, pockets of value exist, with a number of undervalued sectors like Financial Services, which provide an attractive entry point for long-term investors, and with expectations of higher corporate earnings this year, we are “POSITIVE” for investors with a long-term investment horizon.
Cellulant, a leading Pan-African digital payments service provider that prompts, collects, settles and reconciles payments in real time, has raised Kshs 4.8 bn (USD 47.5 mn) from a consortium of investors led by: Texas Pacific Group (TPG), through The Rise Fund, the impact fund run by the private equity group, Endeavour Catalyst, and Satya Capital, the private equity firm owned by Sudanese-British billionaire Mo Ibrahim. The USD 47.5 million represents the largest deal of its kind dedicated solely to Africa’s FinTech and payments space. However, the stake acquired was not disclosed. Cellulant offers digital payments platforms and mobile banking services aimed at those who do not have a bank account. Initially founded in Nigeria and Kenya in 2004, it has since expanded to nine other African countries with its solutions available to 12% of Africa’s mobile consumers. It partners with over 90 banks and several mobile payments platforms across the continent. The new investment would enable the company to expand into new markets and to also invest in its existing operations. Cellulant will also introduce consumer-focused products on which no further details were given. TPG Growth was established in 2007 as the global growth equity and middle market buyout platform of US based alternative asset firm TPG. It has more than USD 13.0 bn in assets and investments in key sectors for impact, including healthcare, financial services, industrials, and technology, as well as established networks in emerging and frontier markets throughout Africa, India, and Southeast Asia. The deal marks Rise Fund’s first investment in Africa since raising USD 2.0 bn in October 2017.The investment in Cellulant is the latest endorsement of the key role African FinTech companies are playing in bridging the crucial payments and financial inclusion gaps on the continent. Over the past three-years, the sector has garnered momentum and has become the most attractive for investors on the continent. According to The African Tech Start-ups Funding Report 2017 by Disrupt Africa, Venture funding for African start-ups jumped by 51% to USD 195.0 mn in 2017 from USD 130.0 mn in 2016. A third of this funding was in the FinTech sector as investors bet on increasing demand for financial services in a region where just 17% of the population have banking accounts.
In its first investment in the education sector in Africa, One Thousand & One Voices (1K1V), a private family capital fund backed exclusively by families from around the globe, invested an undisclosed amount in Higher Ed Partners South Africa (HEPSA), a South African online education company. Based in Johannesburg, HEPSA is an integrated provider of online program management services to the leading tertiary educational institutions in South Africa. The Company assists universities in converting their on-campus degree programs into an online format, recruits qualified students for those programs, and supports enrolled students through graduation. It was founded by Best Associates, the company that founded and grew multiple leading online program management and higher education companies around the globe, including Academic Partnerships in the United States and Illumno in Latin America.It plans to use the funds to expand its operations. 1K1V is a private family capital fund that invests in companies headquartered in, or with significant operations in Sub-Saharan Africa’s rising markets. Based in Cape Town, South Africa, it has offices in Johannesburg, South Africa, Ebene in Mauritius and Denver in Colorado, USA. This transaction represents 1K1V’s fourth investment in Africa, adding to its existing portfolio companies: Redsun Dried Fruit & Nuts, a raisin processor located on the banks of the Orange River in the Kalahari Desert, Beefmaster, South Africa’s largest beef exporter, and SanLei, a specialist aquaculture business headquartered in the Kingdom of Lesotho.
Private equity investments in Africa remains robust as evidenced by the increasing investor interest, which is attributed to; (i) rapid urbanization, a resilient and adapting middle class and increased consumerism, (ii) the attractive valuations in Sub Saharan Africa’s private markets compared to its public markets, (iii) the attractive valuations in Sub Saharan Africa’s markets compared to global markets, and (iv) better economic projections in Sub Sahara Africa compared to global markets. We remain bullish on PE as an asset class in Sub-Sahara Africa. Going forward, the increasing investor interest and stable macro-economic environment will continue to boost deal flow into African markets.
Investors continue to cash in on the real estate sector in Kenya driven by (i) the huge housing deficit, (ii) high returns which came in at 24.3% as of December 2017, and (ii) various government incentives and continued infrastructural improvements. The following were the key highlights this week;
Consonance Kuramo Special Opportunities Fund I, a subsidiary of New York-based Kuramo Capital, bought an undisclosed equity stake in Century Developments Limited, a Nairobi based Pan-African real estate development and investments company, focusing on building affordable housing communities across Africa. The deal will see Kuramo invest Kshs 20.0 bn over the next five years towards the development of 10,000 Purpose-Built Student Housing units and 7,500 affordable houses targeted for young people and middle-income families in major towns and cities and along growth corridors across East African countries. This is a step in the right direction towards addressing the high demand for accommodation across Kenyan institutions of higher learning, as well as addressing the housing deficit by construction of affordable housing. According to a Jumia Research in 2016, there are approximately 280,000 bed spaces in institutions of higher learning against a student population of 769,000 in Kenya. Other firms that have shown interest in the sector, are Helios, a UK-based private equity firm, which signed a memorandum with Kenyan-based property development firm, Acorn, for construction of 3,800 student housing units across Nairobi at an estimated cost of Kshs 7.4 bn. According to Cytonn Research 2017, several private hostels have come up in areas neighboring universities due to the lack of adequate accommodation for the growing student population. For example, in areas such as Juja with Jomo Kenyatta University of Agriculture and Technology (JKUAT) and Rongai with Catholic University of East Africa, JKUAT Karen, Multimedia University, and Nazarene University, private investors have developed hostels where students pay rent ranging from Kshs 4,000 - Kshs 8,000 per month for a studio room of approximately 20-30 SQM. However, we have seen modern hostel facilities coming up along Lang’ata Rd, Jogoo road and Thika Road, who charge higher monthly rents of Kshs 15,000- 20,000 per student mainly due to the added facilities such as elevators, CCTV cameras, generators, gym and services such as 24-hr security, transport to and from school, garbage collection and entertainment. With rent ranging from Kshs 750 - 1,000 per SQM, occupancy of above 80% and an estimated development cost of Kshs 100,000 per SQM, modern student hostels have potentially high yields of between 7.2% - 9.6% compared to the conventional real estate sectors i.e., commercial office, retail, industrial and residential, whose average yields were 7.4% as at 2017, and thus in our view, this is a viable investment for both Consonance Kuramo and Century Developments.
Cool Breeze Development Limited, a Nairobi-based group of investors, unveiled plans to construct five 14-floor blocks in a gated community behind Nextgen Mall along Mombasa Road, on a 2.3-acre parcel of land acquired from Nextgen Suites. The development will consist of 120 studio apartments, 240 one-bedroom apartments, 148 two-bedroom units and 16 three-bedroom units. Prices have not been revealed but according to the developers, the project targets middle to high income earners. The residential sector has continued to offer high returns to investors with returns averaging at over 20.0% in the last five years, with demand growing in areas of low supply such as areas along Mombasa Road, while the availability of land and continued infrastructural improvements along the area, continue to attract investors. Also in the residential sector arena, United Bank of Africa (UBA) Bank, a bank operating in 20 African Countries including Kenya, announced plans of an affordable housing scheme in Kakamega County, in which it will finance over 1,000 affordable housing units for Kshs 3.0 bn, the estimated development cost, and will be in partnership with National Housing Corporation. The continued investment in homes for low and mid income earners is in tandem with the government’s affordable housing initiative, which aims to deliver 1.0 mn homes in the next 5 years, out of which 80.0% will be affordable housing and 20.0% will be social housing. The residential sector continues to present a huge opportunity for investors, especially in the affordable housing sector for the low to mid income earners, with an estimated deficit of 2.0 mn units. Government incentives that continue to attract investors, both local and international include (i) 50.0% cut on corporate tax for developers of at least 100 low cost units from 30.0% to 15.0%, (ii) Continued provision of infrastructure, and (iii) The proposed land bank to be acquired from land already owned by government entities such as Kenya Prisons, International Livestock Research Institute, Ministry of Agriculture and Livestock, among others.
The Federation of Kenya Employers (FKE), a trade union which seeks to represent collective interests of employers in Kenya, unveiled plans to put up an 8-storey office building in Upperhill, along Argwings Kodhek Road, estimated to cost Kshs 620.0 mn, exclusive of land costs. The project, which will be funded from the scheme’s internal reserves is aimed at generating extra revenue for the union. The move affirms increased appetite for real estate investment as investors seek to diversify their sectoral exposure and benefit from the high yields. The office sector ‘s rental yields have averaged at 9.2% in the last two-years, a result of (i) increased foreign direct investment from international institutions, (ii) demand for office space from growing local SMEs, and (iii) Nairobi’s status as a key regional hub that has continued to attract foreign firms. It is imperative to note, however, that we expect Upperhill’s performance to decline in the short to mid-term, given the oversupply of office stock in the node which came in at 700,000 SQFT in 2017, representing 14.9% of the total office sector oversupply that came in at 4.7 mn SQFT, according to Cytonn Research. As at 2017, offices in Upperhill recorded a rental yield of 9.0%, which was the same as 2016, and 82.0% average occupancy rates, a 7.8% points decline in occupancy from 89.8% in 2016. In our view, addition of more stock will result to further decline of occupancy rates and returns. We therefore recommend the development of differentiated concepts such as green office buildings, which attract higher rents, serviced offices with yields of up to 13.4%, and mixed-use developments.
The hospitality sector recorded activity with 31 hotels across Nyeri, Meru, Laikipia, Isiolo, Samburu and Embu Counties getting classified into respective hotel star ranks as per the East African Community Classification Criteria. The criteria which is based on the facilities’ location, services, size of rooms, cuisine, amenities, style, décor and staff competency, follows directives by the Tourism Regulatory Authority for all tourism facilities to be classified within the next 6-months. The move is in line with the government’s efforts of marketing Kenya as the ultimate tourist destination. Some of the hotels that got a 5-star rating include Segera Retreat Lodge in Laikipia County, Lake Elementaita Serena Camp and Enashipai Resort and Spa in Nakuru County, Olare Mara Kempinski, and Mara Serena Safari Lodge in Narok County, while White Rhino Hotel, Aberdare Country Club in Nyeri County and Fairmont Mt Kenya Safari Club in Laikipia County, among others, were rated as 4-star hotels. In addition to promoting tourism through better visibility and credibility of local hotel brands, the rating is also bound to promote healthy competition among hoteliers in Kenya, especially in terms of quality of hospitality services offered in a bid to attract tourists, and attain better ratings.
The tourism and hospitality sector in Mombasa is set to get a boost after Ethiopian Airlines was this week granted a second frequency flight to Mombasa, meaning the airline will now fly twice a day to Mombasa. This is a move in the right direction as it will increase tourist arrivals in the general coastal region. However, more needs to be done to increase international direct flights to the Coast region as currently, Ethiopian Airlines and RwandAir are the only regional airlines with direct access, while other airlines need to land tourists in Nairobi who then have to connect to Mombasa or Malindi. The Coast region is a main tourist destination in Kenya accounting for majority of the total occupied bed nights at 42.6% in Kenya in 2017, according to the KNBS Economic Survey 2018, and out of these 48.1% were local while 51.9% were international visitors. The inclusion of more direct flights, coupled with infrastructural developments in the region such as the Mombasa West Integrated Urban Roads Network, which entails upgrading of the Moi International Airport, and construction of Port Reitz, and their respective access roads, is thus, expected to continue boosting the performance of the hospitality sector in the region.
Other highlights during the week include:
- Garden City, a 355,000-SQFT mixed use development located along Thika Road, announced plans to have a Huduma Centre within the mall set to open by June 2018. The Huduma Centre, whose role is decentralizing access to various government services, aims at serving the eastern and northern parts of Nairobi and will be the first of its kind within a fully privately-owned facility. In our view, this will help increase occupancy at the mall, which came in at 86.0% as at 2017 and in our view, will increase footfall due to the convenience created for shoppers and residents who can access government services as well as other retail services all under one roof,
- Also, Homa Bay County Government announced plans to construct a modern industrial park that will cost approximately Kshs 1.0 bn, in line with the government plan to have at least one Export Processing Zone (EPZ) in every county and increase the contribution of the manufacturing sector to the nation’s GDP to at least 15.0% (the sector recorded a GDP contribution of 8.4% in 2017). Currently, industrial parks in Nairobi metropolis offer relatively low rental yields of 5.8% compared to other sector in the commercial sector such as retail and office, which registered yields of 8.5% and 9.2%, respectively, in 2017.
We expect to the real estate sector to maintain the expansionary trend given (i) the high returns averaging at over 24.3% as at December 2017, (ii) Investment in infrastructure, and (iii) continued growth of the hospitality and tourism sectors.
Disclaimer: The views expressed in this publication are those of the writers where particulars are not warranted. This publication, which is in compliance with Section 2 of the Capital Markets Authority Act Cap 485A, is meant for general information only and is not a warranty, representation, advice or solicitation of any nature. Readers are advised in all circumstances to seek the advice of a registered investment advisor.

- Talk to us
- Kenya
- P.O Box 20695 - 00200, Nairobi, Kenya
- Cell +254709101200
- Tel +254709101200
- WhatsApp +254741676635
- United States
- +254709101200
- DOWNLOAD OUR APP
-


- Kenya
- 8th Floor, Pinetree Plaza, Kaburu Drive, Ngong Road, Nairobi, Kenya
- USA
- Suite 1150, 1775 Eye Street NW, USA, Washington DC 20006, USA
- Investments
- High Yield
- Private Equity
- Real Estate
- Real Estate
- RiverRun Estates
- Cytonn Towers
- The Ridge
- Taraji Heights
- The Alma