Cytonn Weekly #30/2025
By research team, Jul 27, 2025
Executive Summary
Fixed Income
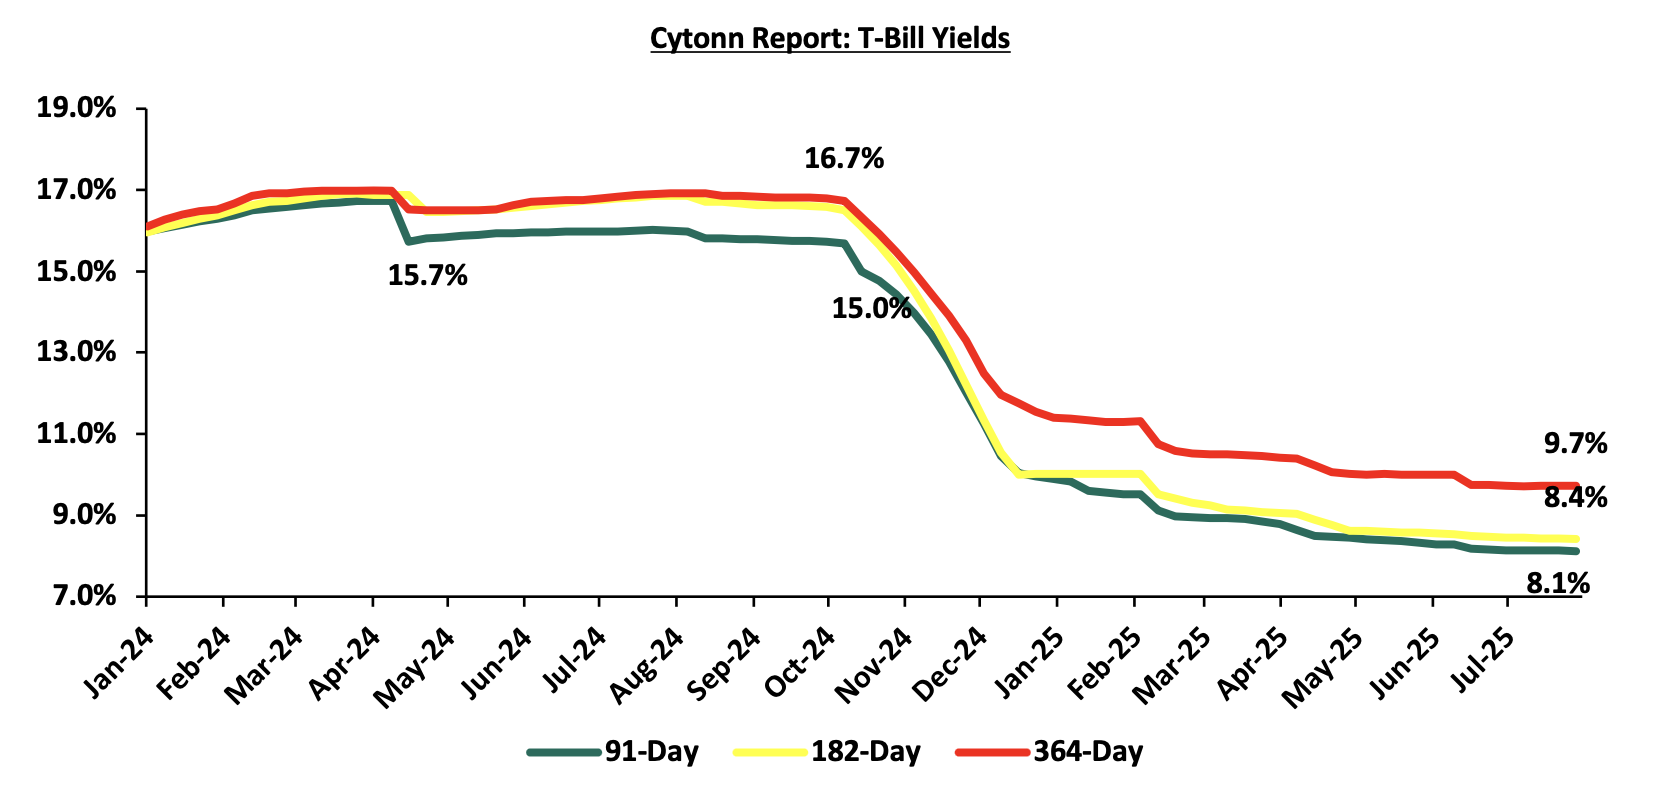
This week, T-bills were oversubscribed for the second consecutive week, with the overall subscription rate coming in at 166.7%, higher than the subscription rate of 115.9% recorded the previous week. Investors’ preference for the shorter 91-day paper persisted, with the paper receiving bids worth Kshs 16.2 bn against the offered Kshs 4.0 bn, translating to a subscription rate of 405.8%, significantly higher than the subscription rate of 49.1%, recorded the previous week. The subscription rate for the 182-day paper decreased to 32.0% from the 76.2% recorded the previous week, while that of the 364-day paper increased to 205.9%, from the 182.3% recorded the previous week. The government accepted a total of Kshs 25.5 bn worth of bids out of Kshs 40.0 bn bids received, translating to an acceptance rate of 63.8%. The yields on the government papers were on a downward trajectory with the yields on the 91-day, 182-day and 364-day papers decreasing by 1.2 bps, 1.2 bps and 0.8 bps respectively to 8.11%, 8.41% and 9.72% respectively, from the 8.13%, 8.43% and 9.73% respectively recorded the previous week;
In the primary bond market, the government is looking to raise Kshs 90.0 bn for funding infrastructure projects through the reopened bonds; IFB1/2018/015 and IFB1/2022/019 with fixed coupon rates of 12.5% and 13.0% respectively and tenors to maturity of 7.5 years and 15.6 years respectively. The period of sale for the two bonds opened on Tuesday, 21st July 2025 and will close on 13th August 2025. Our bidding range for IFB1/2018/015 and IFB1/2022/019 is 13.00%-13.50% and 13.75%-14.50% respectively;
During the week, the National Treasury gazetted the revenue and net expenditures for the year FY’2024/2025, ending 30thJune 2025, highlighting that the total revenue collected as at the end of June 2025 amounted to Kshs 2,430.1 bn, equivalent to 97.4% of the revised estimates III of Kshs 2,496.2 bn for FY’2024/2025.
We are projecting the y/y inflation rate for July 2025 to increase to within the range of 3.9% - 4.4% mainly on the back ofincreased fuel prices in June.
Equities
During the week, the equities market was on an upward trajectory, with NASI, NSE 25, NSE 10 and NSE 20 gaining by 1.6%, 1.6%, 1.5% and 1.4% respectively, taking the YTD performance to gains of 28.1%, 23.2%, 18.7% and 18.2% for NASI, NSE 20, NSE 25 and NSE 10 respectively. The equities market performance was driven by gains recorded by large-cap stocks such as BAT, KCB and NCBA of 4.6%, 2.8% and 2.8% respectively. The performance was however weighed down by losses recorded by large cap stocks such as DTB-K, Co-operative Bank of Kenya and ABSA Bank Kenya of 1.6%, 0.6% and 0.3% respectively;
Additionally, in the regional equities market, the East African Exchanges 20 (EAE 20) share index lost by 0.1%, attributable to losses recorded by large cap stocks such as Tanzania Cigarette, Tanzania Breweries Limited and Co-operative Bank of Kenya of 2.0%, 2.0% and 1.5% respectively. The performance was however supported by gains recorded by large cap stocks such as Bank of Baroda Uganda, Safaricom and KCB Group of 13.3%, 3.1% and 3.0% respectively;
During the week, British American Tobacco Kenya Plc released their H1’2025 financial results, recording a 39.7% increase in Profits after Tax (PAT) to Kshs 3.0 bn, from Kshs 2.1 bn recorded in H1’2024. The increase in PAT was mainly attributed to the 5.5% decrease in the cost of sales to Kshs 7.5 bn in H1’2025, from Kshs 7.9 bn recorded in H1’2024, as well as the 113.5% decrease in the finance cost to a finance income of Kshs 0.1 bn, from a finance cost of Kshs 0.7 bn in H1’2024, which outweighed the 5.9% decrease in the gross sales to Kshs 18.5 bn from Kshs 19.6 bn;
During the week, Shri Krishana Overseas Limited (SKL), a packaging solutions provider, was officially listed on the Nairobi Securities Exchange (NSE) on 24th July 2025. This marked the first listing on the NSE in five years, with the last listing being Homeboyz Entertainment Plc in 2020. Earlier, on 16th July 2025, the Satrix MSCI World Feeder ETF was also listed on the NSE, bringing the total number of Exchange Traded Funds (ETFs) on the exchange to two. The Satrix ETF joins the previously listed Absa New Gold ETF, expanding the range of ETF investment options available to local investors. Also, during the week Linzi Finco LLP, a subsidiary of Liaison Group listed the Linzi 003 Infrastructure Asset-Backed Security (IABS) on the NSE, valued at Kshs. 44.9 bn;
Real Estate
During the week, Hass Consult, a Kenyan consulting and Real Estate development firm, released its Property Index Q2’2025 Report , focusing on the residential Real Estate sector's performance in the Nairobi Metropolitan Area (NMA).
During the week, Hass Consult also released Land Price Index Q2’2025 Report which highlighted the performance of the Real Estate land sector in the Nairobi Metropolitan Area (NMA).
During the week, the Kenya Airports Authority (KAA) unveiled a detailed plan to revamp Wilson Airport’s infrastructure, with a strong focus on runway rehabilitation and public safety. This announcement comes as the authority raises concern over illegal developments near the airport's flight paths, which pose significant safety risks. KAA has initiated a Strategic Environmental and Social Assessment (SESA) and scheduled public forums to collect stakeholder views, underscoring its commitment to sustainable, inclusive airport modernization.
During the week, Linzi Finco LLP, a subsidiary of Liaison Group, successfully listed the Linzi 003 Infrastructure Asset-Backed Security on the Nairobi Securities Exchange (NSE), raising Kshs 44.9 bn. This landmark transaction, lauded by President William Ruto, marks one of the largest securitization deals in East Africa and a bold stride toward leveraging capital markets for infrastructure funding. Positioned as a market-first solution, the listing showcases the growing appetite for asset-backed securities and is expected to catalyze future structured finance innovations in Kenya’s capital markets.
On the Unquoted Securities Platform, Acorn D-REIT and I-REIT traded at Kshs 26.7 and Kshs 22.9 per unit, respectively, as per the last updated data on 25th July 2025. The performance represented a 33.4% and 14.5% gain for the D-REIT and I-REIT, respectively, from the Kshs 20.0 inception price. Additionally, ILAM Fahari I-REIT traded at Kshs 11.0 per share as of 25th July 2025, representing a 45.0% loss from the Kshs 20.0 inception price. The volume traded to date came in at 1.2 mn shares for the I-REIT, with a turnover of Kshs 1.5 mn since inception in November 2015;
Investment Updates:
- Weekly Rates: Cytonn Money Market Fund closed the week at a yield of 13.3 % p.a. To invest, dial *809# or download the Cytonn App from Google Play store here or from the Appstore here;
- We continue to offer Wealth Management Training every Tuesday, from 7:00 pm to 8:00 pm. The training aims to grow financial literacy among the general public. To register for any of our Wealth Management Trainings, click here;
- If interested in our Private Wealth Management Training for your employees or investment group, please get in touch with us through wmt@cytonn.com;
- Cytonn Insurance Agency acts as an intermediary for those looking to secure their assets and loved ones’ future through insurance namely; Motor, Medical, Life, Property, WIBA, Credit and Fire and Burglary insurance covers. For assistance, get in touch with us through insuranceagency@cytonn.com;
- Cytonn Asset Managers Limited (CAML) continues to offer pension products to meet the needs of both individual clients who want to save for their retirement during their working years and Institutional clients that want to contribute on behalf of their employees to help them build their retirement pot. To more about our pension schemes, kindly get in touch with us through pensions@cytonn.com;
Hospitality Updates:
- We currently have promotions for Staycations. Visit cysuites.com/offers for details or email us at sales@cysuites.com;
Money Markets, T-Bills and T-Bonds Primary Auction:
This week, T-bills were oversubscribed for the second consecutive week, with the overall subscription rate coming in at 166.7%, higher than the subscription rate of 115.9% recorded the previous week. Investors’ preference for the shorter 91-day paper persisted, with the paper receiving bids worth Kshs 16.2 bn against the offered Kshs 4.0 bn, translating to a subscription rate of 405.8%, significantly higher than the subscription rate of 49.1%, recorded the previous week. The subscription rate for the 182-day paper decreased to 32.0% from the 76.2% recorded the previous week, while that of the 364-day paper increased to 205.9%, from the 182.3% recorded the previous week. The government accepted a total of Kshs 25.5 bn worth of bids out of Kshs 40.0 bn bids received, translating to an acceptance rate of 63.8%. The yields on the government papers were on a downward trajectory with the yields on the 91-day, 182-day and 364-day papers decreasing by 1.2 bps, 1.2 bps and 0.8 bps respectively to 8.11%, 8.41% and 9.72% respectively, from the 8.13%, 8.43% and 9.73% respectively recorded the previous week;
The chart below shows the yield performance of the 91-day, 182-day and 364-day papers over the period;
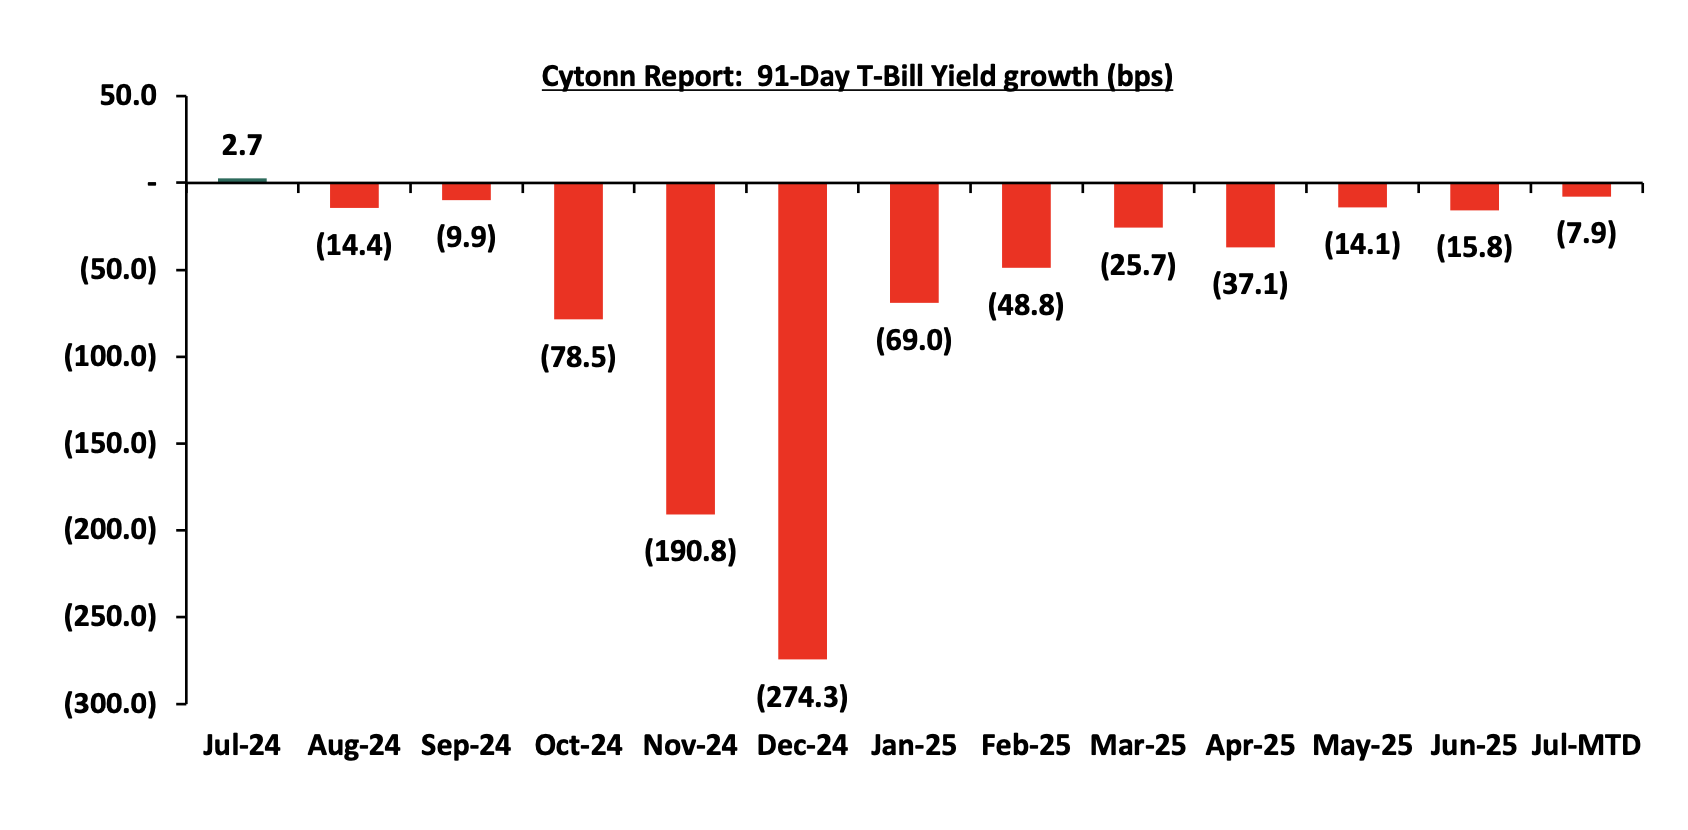
The chart below shows the yield growth for the 91-day T-bill:
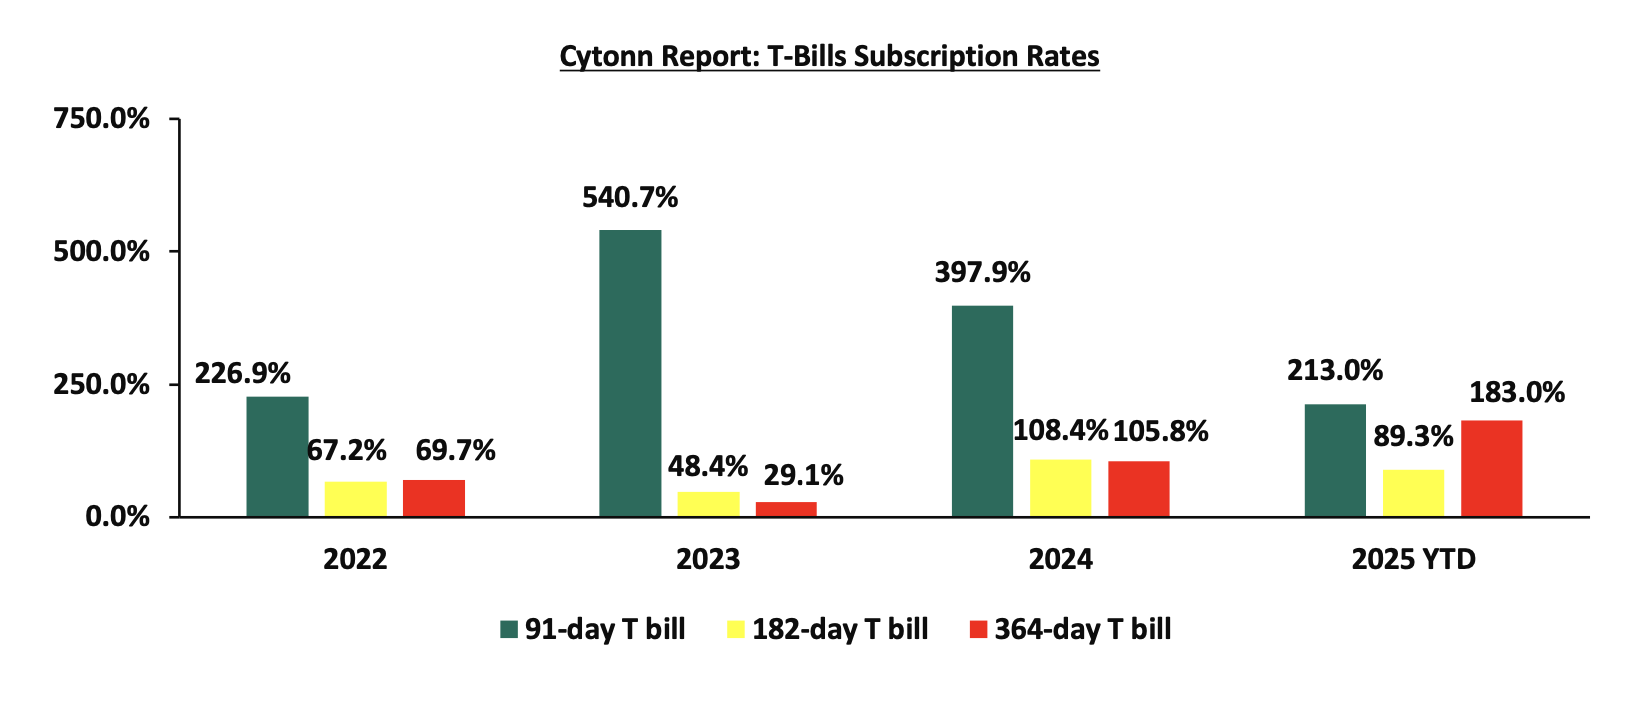
The chart below compares the overall average T-bill subscription rates obtained in 2022,2023, 2024 and 2025 Year-to-date (YTD):
In the primary bond market, the government is looking to raise Kshs 90.0 bn for funding infrastructure projects through the reopened bonds; IFB1/2018/015 and IFB1/2022/019 with fixed coupon rates of 12.5% and 13.0% respectively and tenors to maturity of 7.5 years and 15.6 years respectively. The period of sale for the two bonds opened on Tuesday, 21st July 2025 and will close on 13th August 2025. Our bidding range for IFB1/2018/015 and IFB1/2022/019 is 3.00%-13.50% and 13.75%-14.50% respectively;
Money Market Performance:
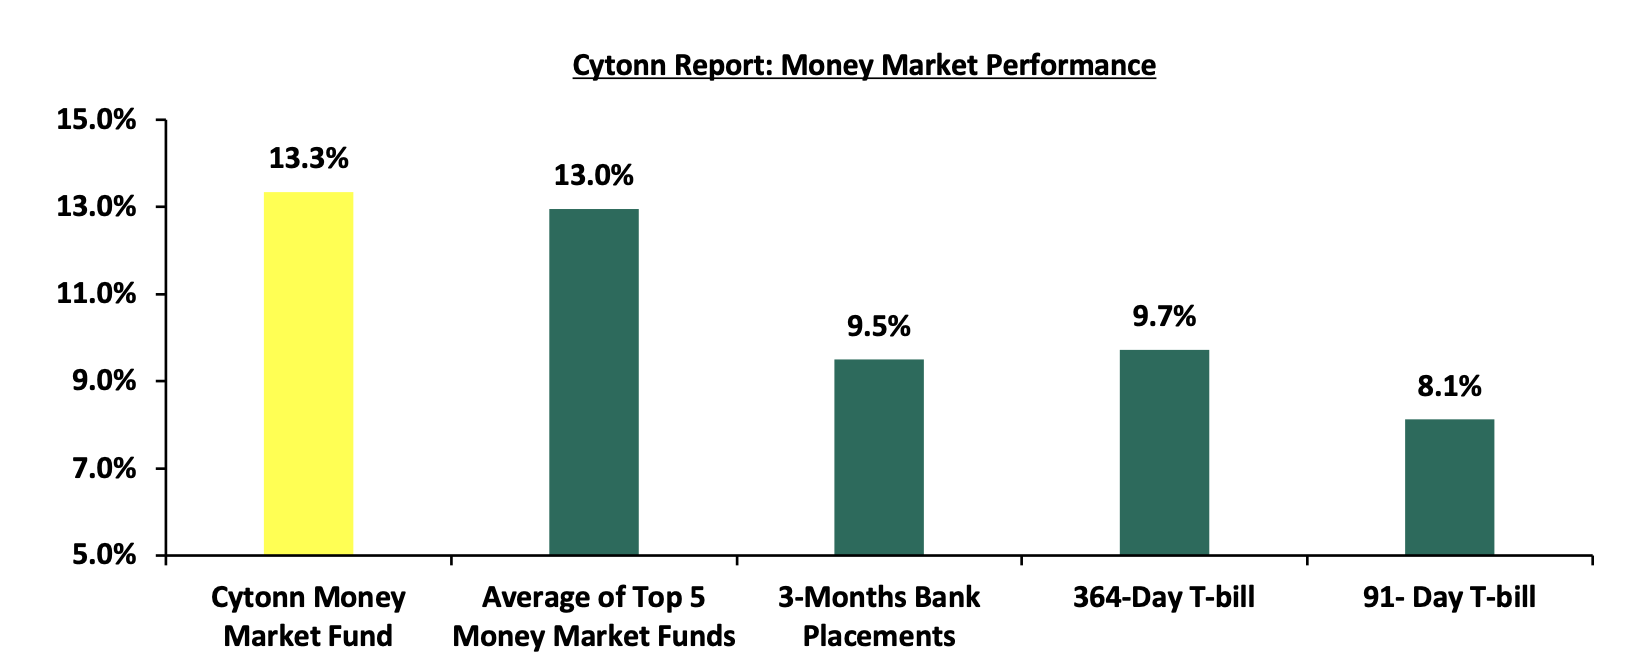
In the money markets, 3-month bank placements ended the week at 9.5% (based on what we have been offered by various banks) and the yields on the government papers were on a downward trajectory with the yields on 91-day and 364-day papers decreasing by 1.2 bps and 0.8 bps respectively, to remain relatively unchanged at 8.1% and 9.7% respectively, recorded the previous week. The yield on the Cytonn Money Market Fund decreased by 2.0 bps to 13.3% from the 13.4% recorded the previous week, while the average yields on the Top 5 Money Market Funds decreased marginally by 1.6 bps to remain relatively unchanged from the 13.0% recorded the previous week.
The table below shows the Money Market Fund Yields for Kenyan Fund Managers as published on 25th July 2025:
|
Money Market Fund Yield for Fund Managers as published on 25th July 2025 |
||
|
Rank |
Fund Manager |
Effective Annual Rate |
|
1 |
Cytonn Money Market Fund (Dial *809# or download Cytonn App) |
13.3% |
|
2 |
Gulfcap Money Market Fund |
13.1% |
|
3 |
Ndovu Money Market Fund |
13.1% |
|
4 |
Lofty-Corban Money Market Fund |
12.7% |
|
5 |
Kuza Money Market fund |
12.5% |
|
6 |
Orient Kasha Money Market Fund |
12.5% |
|
7 |
Etica Money Market Fund |
12.1% |
|
8 |
Nabo Africa Money Market Fund |
11.9% |
|
9 |
GenAfrica Money Market Fund |
11.5% |
|
10 |
British-American Money Market Fund |
11.3% |
|
11 |
Madison Money Market Fund |
11.1% |
|
12 |
Old Mutual Money Market Fund |
11.0% |
|
13 |
Jubilee Money Market Fund |
11.0% |
|
14 |
Arvocap Money Market Fund |
10.9% |
|
15 |
Enwealth Money Market Fund |
10.9% |
|
16 |
Sanlam Money Market Fund |
10.3% |
|
17 |
Apollo Money Market Fund |
10.3% |
|
18 |
Faulu Money Market Fund |
10.2% |
|
19 |
Dry Associates Money Market Fund |
10.1% |
|
20 |
KCB Money Market Fund |
9.9% |
|
21 |
ICEA Lion Money Market Fund |
9.4% |
|
22 |
Mali Money Market Fund |
9.3% |
|
23 |
Co-op Money Market Fund |
9.3% |
|
24 |
Genghis Money Market Fund |
8.8% |
|
25 |
CIC Money Market Fund |
8.8% |
|
26 |
Absa Shilling Money Market Fund |
8.6% |
|
27 |
Mayfair Money Market Fund |
8.3% |
|
28 |
AA Kenya Shillings Fund |
8.0% |
|
29 |
CPF Money Market Fund |
7.8% |
|
30 |
Ziidi Money Market Fund |
6.9% |
|
31 |
Stanbic Money Market Fund |
6.8% |
|
32 |
Equity Money Market Fund |
5.1% |
Source: Business Daily
Liquidity:
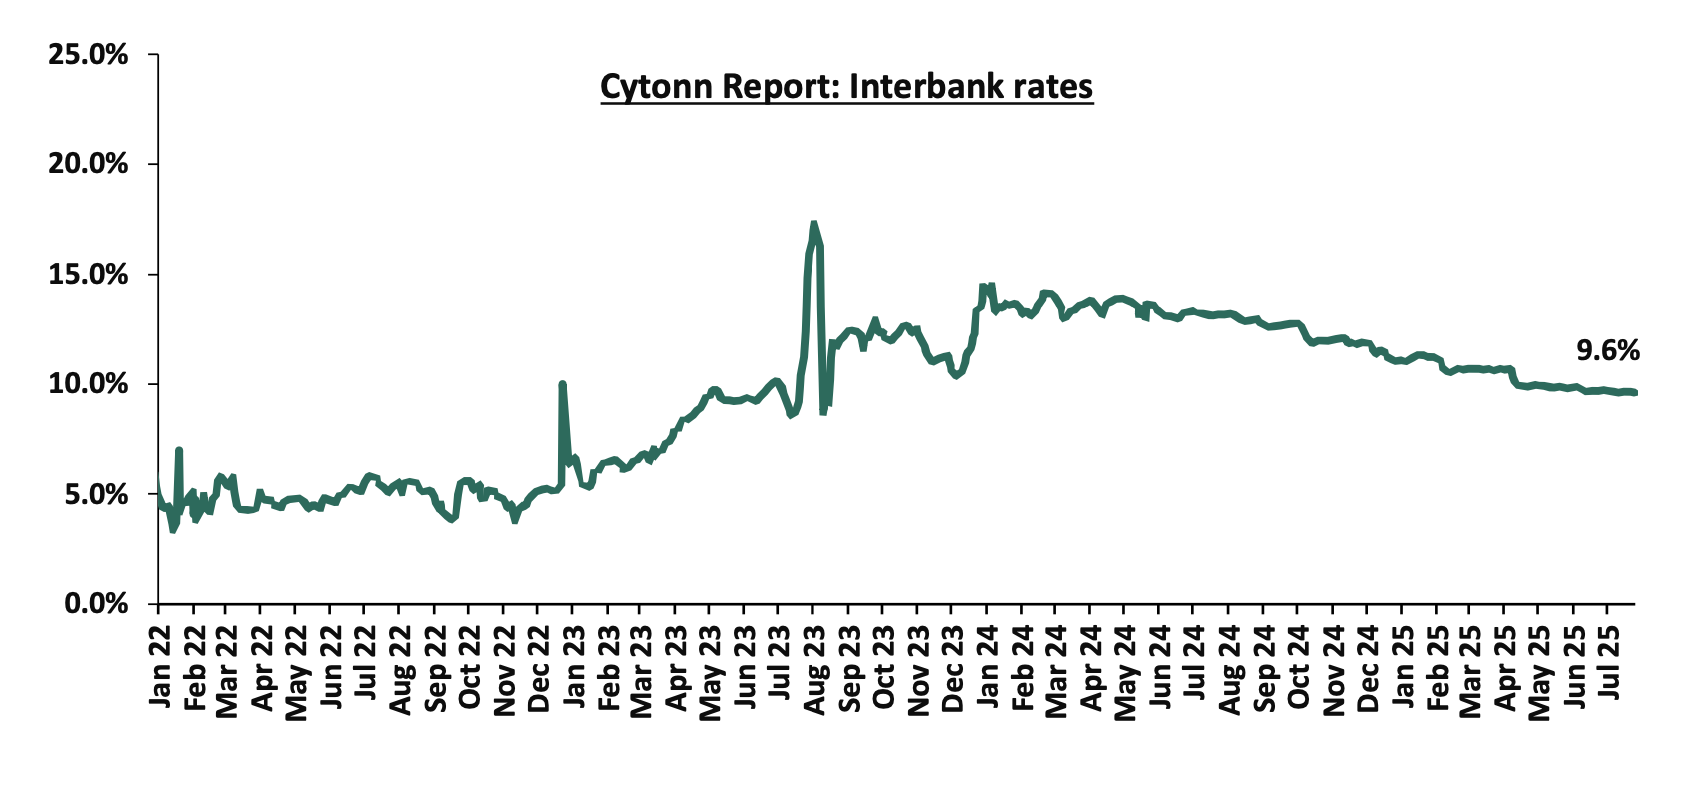
During the week, liquidity in the money markets marginally eased, with the average interbank rate decreasing by 1.7 bps, to remain relatively unchanged from the 9.6% recorded the previous week, partly attributable to tax remittances that were offset by government payments. The average interbank volumes traded increased by 21.2% to Kshs 13.0 bn from Kshs 10.8 bn recorded the previous week. The chart below shows the interbank rates in the market over the years:
Kenya Eurobonds:
During the week, the yields on Kenya’s Eurobonds were on a downward trajectory with the yield on the 10-year Eurobond issued in 2018 decreasing the most by 60.1 bps to 8.0% from the 8.6% recorded the previous week. The table below shows the summary performance of the Kenyan Eurobonds as of 24th July 2025;
|
Cytonn Report: Kenya Eurobond Performance |
|||||||
|
|
2018 |
2019 |
2021 |
2024 |
2025 |
||
|
Tenor |
10-year issue |
30-year issue |
7-year issue |
12-year issue |
13-year issue |
7-year issue |
11-year issue |
|
Amount Issued (USD) |
1.0 bn |
1.0 bn |
0.9 bn |
1.2 bn |
1.0 bn |
1.5 bn |
1.5 bn |
|
Years to Maturity |
2.7 |
22.7 |
1.9 |
6.9 |
9.0 |
5.7 |
10.7 |
|
Yields at Issue |
7.3% |
8.3% |
7.0% |
7.9% |
6.2% |
10.4% |
9.9% |
|
02-Jan-25 |
9.1% |
10.3% |
8.5% |
10.1% |
10.1% |
10.1% |
|
|
01-Jul-25 |
8.0% |
10.3% |
- |
9.4% |
9.7% |
9.3% |
|
|
17-Jul-25 |
8.6% |
10.7% |
- |
9.8% |
10.1% |
9.6% |
|
|
18-Jul-25 |
8.4% |
10.6% |
- |
9.7% |
10.0% |
9.5% |
|
|
21-Jul-25 |
8.2% |
10.5% |
- |
9.6% |
9.9% |
9.4% |
|
|
22-Jul-25 |
8.2% |
10.5% |
- |
9.6% |
9.9% |
9.4% |
|
|
23-Jul-25 |
8.1% |
10.4% |
- |
9.5% |
9.8% |
9.3% |
|
|
24-Jul-25 |
8.0% |
10.3% |
- |
9.4% |
9.7% |
9.2% |
|
|
Weekly Change |
(0.6%) |
(0.4%) |
- |
(0.5%) |
(0.4%) |
(0.5%) |
- |
|
MTD Change |
(0.1%) |
(0.0%) |
- |
(0.1%) |
0.0% |
(0.1%) |
- |
|
YTD Change |
(1.1%) |
0.0% |
- |
(0.7%) |
(0.4%) |
(0.9%) |
- |
Source: Central Bank of Kenya (CBK) and National Treasury
Kenya Shilling:
During the week, the Kenyan Shilling depreciated marginally against the US Dollar by 1.6 bps, to Kshs 129.3 from the Kshs 129.2 recorded the previous week. On a year-to-date basis, the shilling has appreciated by 3.3 bps against the dollar, compared to the 17.6% appreciation recorded in 2024.
We expect the shilling to be supported by:
- Diaspora remittances standing at a cumulative USD 5,084.0 mn in the twelve months to June 2025, 12.1% higher than the USD 4,535.0 mn recorded over the same period in 2024. These has continued to cushion the shilling against further depreciation. In the June 2025 diaspora remittances figures, North America remained the largest source of remittances to Kenya accounting for 57.9% in the period,
- The tourism inflow receipts which came in at Kshs 452.2 bn in 2024, a 19.8% increase from Kshs 377.5 bn inflow receipts recorded in 2023, and owing to tourist arrivals that improved by 8.0% to 2,303,028 in the 12 months to February 2025 from 2,133,612 in the 12 months to February 2024 and,
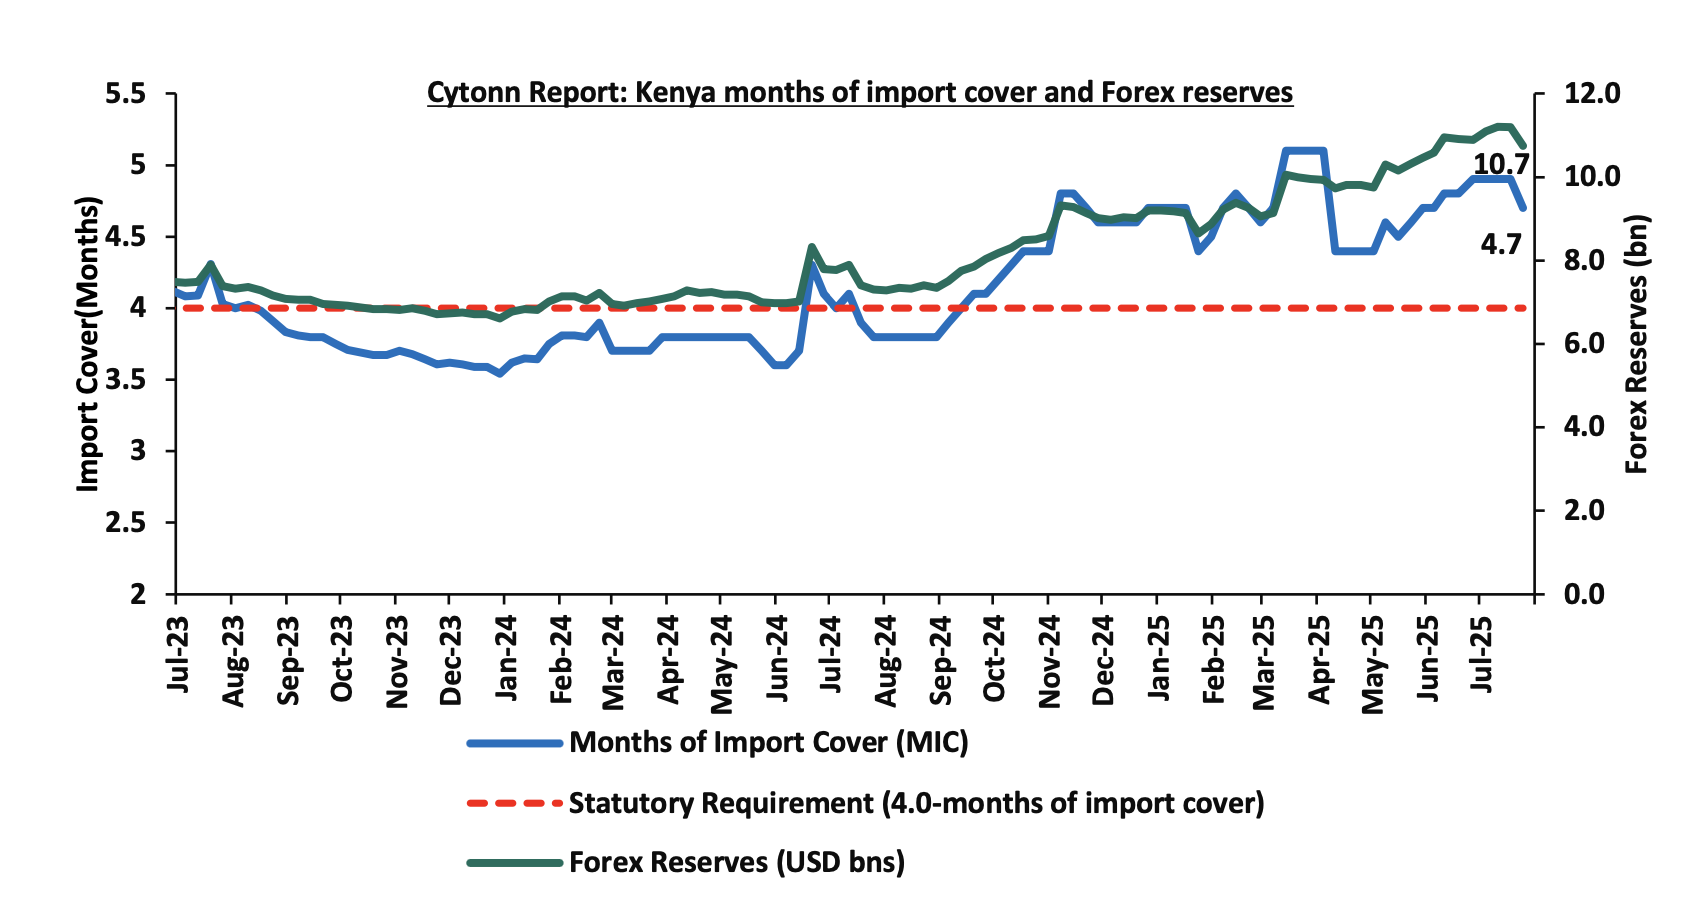
- Improved forex reserves currently at USD 10.7 bn (equivalent to 4.7-months of import cover), which is above the statutory requirement of maintaining at least 4.0-months of import cover and above the EAC region’s convergence criteria of 4.5-months of import cover.
The shilling is however expected to remain under pressure in 2025 as a result of:
- An ever-present current account deficit which came at 1.8% of GDP in the twelve months to April 2025, and,
- The need for government debt servicing, continues to put pressure on forex reserves given that 62.0% of Kenya’s external debt is US Dollar-denominated as of December 2024.
Key to note, Kenya’s forex reserves decreased marginally by 3.9% during the week, to USD 10.7 bn from the USD 11.2 bn recorded in the previous week, (equivalent to 4.7 months of import cover), and above the statutory requirement of maintaining at least 4.0-months of import cover and above the EAC region’s convergence criteria of 4.5-months of import cover.
The chart below summarizes the evolution of Kenya's months of import cover over the years:
Weekly highlights
- Exchequer highlight July 2025
The National Treasury gazetted the revenue and net expenditures for the year FY’2024/2025, ending 30th June 2025. Below is a summary of the performance:
|
FY'2024/2025 Budget Outturn - As at 30th June 2025 |
|
||||||
|
Amounts in Kshs Billions unless stated otherwise |
|
||||||
|
Item |
12-months Original Estimates |
Revised Estimates I |
Revised Estimates II |
Revised Estimates III |
Actual Receipts/Release |
Percentage Achieved of the Revised Estimates III |
|
|
Opening Balance |
|
|
|
|
1.2 |
|
|
|
Tax Revenue |
2,745.2 |
2,475.1 |
2,400.7 |
2,305.1 |
2,257.8 |
97.9% |
|
|
Non-Tax Revenue |
172.0 |
156.4 |
180.2 |
191.1 |
171.1 |
89.6% |
|
|
Total Revenue |
2,917.2 |
2,631.4 |
2,580.9 |
2,496.2 |
2,430.1 |
97.4% |
|
|
External Loans & Grants |
571.2 |
593.5 |
718.4 |
501.5 |
481.0 |
95.9% |
|
|
Domestic Borrowings |
828.4 |
978.3 |
1,167.0 |
1,200.7 |
1,077.5 |
89.7% |
|
|
Other Domestic Financing |
4.7 |
4.7 |
8.5 |
8.5 |
4.4 |
52.1% |
|
|
Total Financing |
1,404.3 |
1,576.5 |
1,894.0 |
1,710.8 |
1,563.0 |
91.4% |
|
|
Recurrent Exchequer issues |
1,348.4 |
1,307.9 |
1,412.7 |
1,448.6 |
1,442.7 |
99.6% |
|
|
CFS Exchequer Issues |
2,114.1 |
2,137.8 |
2,289.0 |
1,988.8 |
1,790.7 |
90.0% |
|
|
Development Expenditure & Net Lending |
458.9 |
351.3 |
354.9 |
351.3 |
335.1 |
95.4% |
|
|
County Governments + Contingencies |
400.1 |
410.8 |
418.3 |
418.3 |
418.3 |
100.0% |
|
|
Total Expenditure |
4,321.5 |
4,207.9 |
4,474.9 |
4,206.9 |
3,986.7 |
94.8% |
|
|
Fiscal Deficit excluding Grants |
1,404.3 |
1,576.5 |
1,894.0 |
1,710.8 |
1,556.6 |
91.0% |
|
|
Total Borrowing |
1,399.6 |
1,571.8 |
1,885.4 |
1,702.2 |
1,558.6 |
91.6% |
|
|
Public Debt |
1,910.5 |
1910.5 |
2,042.1 |
1741.8 |
1,559.9 |
89.6% |
|
The Key take-outs from the release include;
- Total revenue collected as at the end of June 2025 amounted to Kshs 2,430.1 bn, equivalent to 97.4% of the revised estimates III of Kshs 2,496.2 bn for FY’2024/2025. Cumulatively, tax revenues amounted to Kshs 2,257.8 bn, equivalent to 97.9% of the revised estimates III of Kshs 2,305.1 bn.
- Total financing amounted to Kshs 1,563.0 bn, equivalent to 91.4% of the revised estimates III of Kshs 1,710.8 bn. Additionally, domestic borrowing amounted to Kshs 1,077.5 bn, equivalent to 89.7% of the revised estimates III of Kshs 1,200.7 bn,
- The total expenditure amounted to Kshs 3,986.7 bn, equivalent to 94.8% of the revised estimates III of Kshs 4,206.9 bn. Additionally, the net disbursements to recurrent expenditures came in at Kshs 1,442.7 bn, equivalent to 99.6% of the revised estimates III of Kshs 1,448.6 bn.
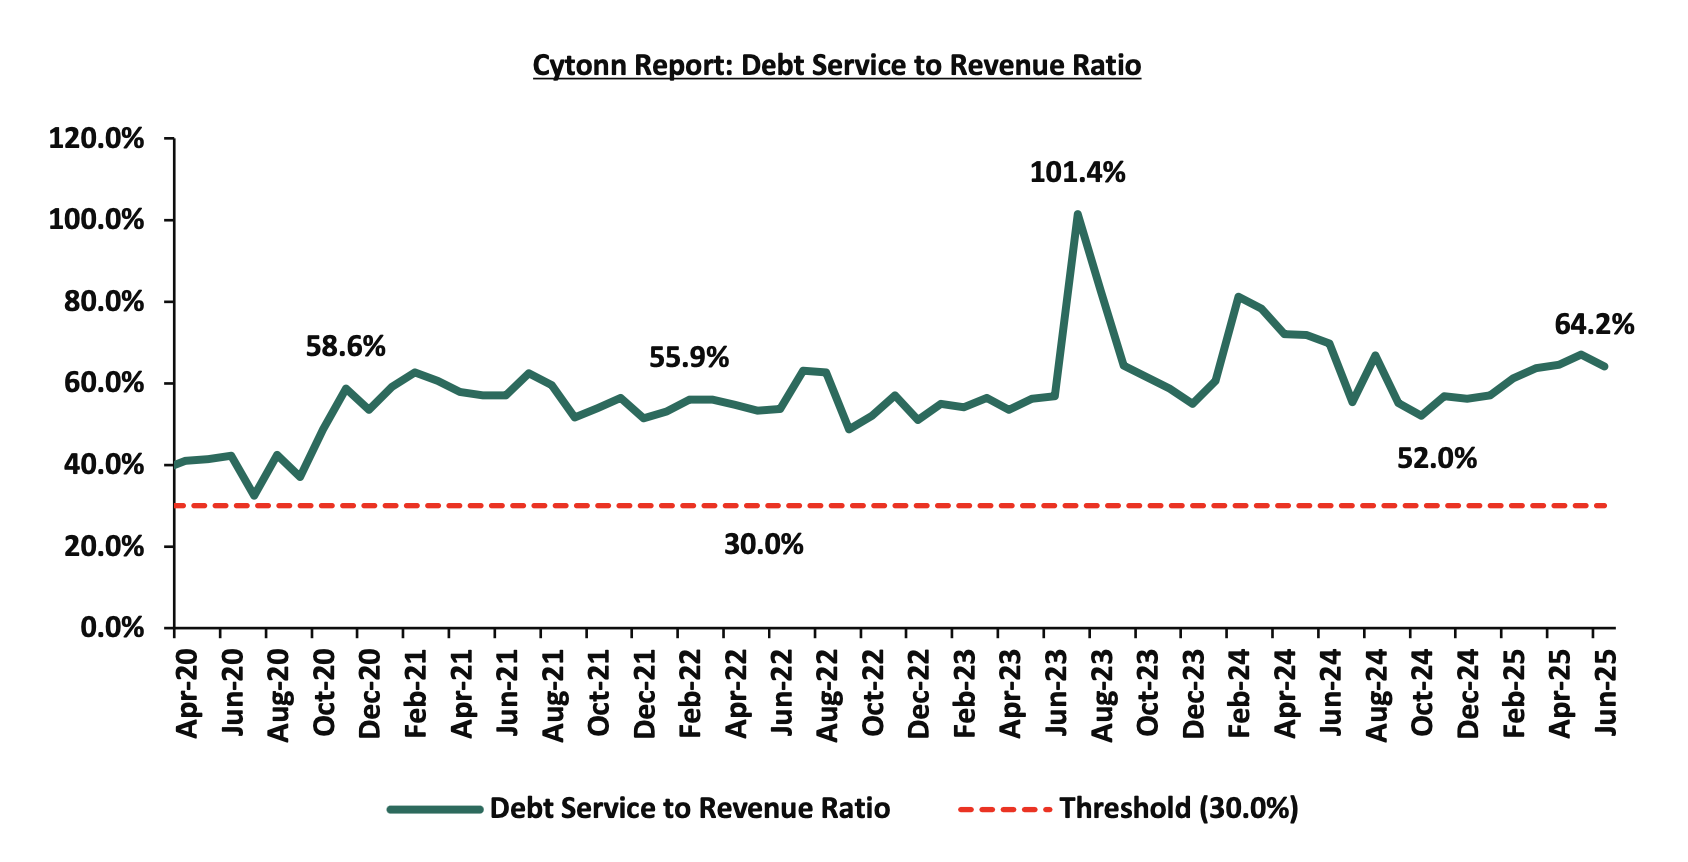
- Consolidated Fund Services (CFS) Exchequer issues came in at Kshs 1,790.7 bn, equivalent to 90.0% of the revised estimates III of Kshs 1988.8 bn. The cumulative public debt servicing cost amounted to Kshs 1,559.9 bn which is 89.6% of the revised estimates III of Kshs 1,741.8 bn. Additionally, the Kshs 1,559.9 bn debt servicing cost is equivalent to 64.2% of the actual cumulative revenues collected as at the end of June 2025. The chart below shows the debt servicing cost to revenue ratio over the period;
- Total Borrowings as at the end of June 2025 amounted to Kshs 1,558.6 bn, equivalent to 91.6% of the revised estimates III of Kshs 1,702.2 bn for FY’2024/2025. The cumulative domestic borrowing of Kshs 1,200.7 bn comprises of Net Domestic Borrowing Kshs 817.3 bn and Internal Debt Redemptions (Rollovers) Kshs 383.4 bn.
The government missed its prorated revenue targets for all twelve months in FY’2024/2025, however registering a significant performance, achieving 97.4% of the prorated revenue targets as of end of June 2025. Further, tax revenue remained close to the target, achieving 97.9% of the set target of the year. The shortfall is largely due to the challenging business environment experienced in previous months with the Purchasing Managers’ Index (PMI), averaging at 48.6 in June 2025, down from 49.6 in May 2025, marking a second consecutive month the index fell below the 50.0 neutral mark, signaling worsening business conditions, mainly attributable to decreased output. However, the cost of credit has declined, providing some relief to businesses and households. While efforts to enhance revenue collection, such as broadening the tax base, curbing tax evasion, and suspending tax relief payments, are yet to yield full benefits, future revenue performance will depend on how quickly private sector activity gains momentum. This is expected to be supported by a stable Shilling, lower borrowing costs, and continued efforts to enhance economic growth. The reduction in the Central Bank Rate (CBR) by 25 basis points to 9.75% from 10.00%, following the Monetary Policy Committee’s (MPC) meeting on June 10th, 2025, is expected to further ease credit conditions and support private sector expansion.
- July 2025 Inflation Projection Highlight
We are projecting the y/y inflation rate for July 2025 to increase to within the range of 3.9% - 4.4% mainly on the back of:
- Rising Fuel Prices in June– In their last fuel prices release, EPRA released their monthly statement on the maximum retail fuel prices in Kenya, effective from 15th July 2025 to 14th August 2025. The price for Super Petrol, Diesel and Kerosene increased by Kshs 9.0, Kshs 8.7 and Kshs 9.7 which brings the new retail prices to Kshs 186.3, Kshs 171.6 and Kshs 156.6 per litre, from Kshs 177.3, Kshs 162.9 and Kshs 146.9 per litre respectively. This notable increase in fuel prices will continue to exert upward pressure on inflation, given fuel's significant role in transportation and production costs across the economy.
- The decrease in the Central Bank Rate (CBR) by 25.0 bps to 9.75% from 10.00% – In 2025, the CBK Monetary Policy Committee has continued reducing the Central Bank Rate (CBR) by a cumulative 150.0 bps from 11.25% at the beginning of the year, to 9.75%. This reduction in the CBR is likely to increase the money supply through lower borrowing costs, which may cause a slight rise in inflation rates as the effects of the CBR continue to gradually take hold in the broader economy.
We, however, expect that inflation rate will, however, be supported by:
- Reduced electricity prices – In July 2025, electricity prices reduced by 21.1% where EPRA set the price to Kshs 3.0 in July 2025 from Kshs 3.8 in June 2025. However, the forex adjustment increased to Kshs 1.8 from Kshs 0.7 in June 2025. With electricity being one of the major inputs of inflation, this decrease is expected to reduce production costs for businesses as well as reduced electricity costs for households and thus easing inflation.
Going forward, we expect inflationary pressures to remain anchored in the short term, remaining within the CBK’s target range of 2.5%-7.5%, aided by reduced electricity prices and stable exchange rate. However, risks remain, particularly from the increase in fuel prices and the potential for increased demand-driven inflation due to accommodative monetary policy.The CBK’s ability to balance growth and inflation through close monitoring of both inflation and exchange rate stability will be key to maintaining inflation within the target range.
Rates in the Fixed Income market have been on a downward trend due to high liquidity in the money market which allowed the government to front load most of its borrowing. The government is 26.3% ahead of its prorated net domestic borrowing target of Kshs 47.1, having a net borrowing position of Kshs 59.5 bn (inclusive of T-bills). However, we expect a stabilization of the yield curve in the short and medium term, with the government looking to increase its external borrowing to maintain the fiscal surplus, hence alleviating pressure in the domestic market. As such, we expect the yield curve to stabilize in the short to medium-term and hence investors are expected to shift towards the long-term papers to lock in the high returns
Market Performance
During the week, the equities market was on an upward trajectory, with NASI, NSE 25, NSE 10 and NSE 20 gaining by 1.6%, 1.6%, 1.5% and 1.4% respectively, taking the YTD performance to gains of 28.1%, 23.2%, 18.7% and 18.2% for NASI, NSE 20, NSE 25 and NSE 10 respectively. The equities market performance was driven by gains recorded by large-cap stocks such as BAT, KCB and NCBA of 4.6%, 2.8% and 2.8% respectively. The performance was however weighed down by losses recorded by large cap stocks such as DTB-K, Co-operative Bank of Kenya and ABSA Bank Kenya of 1.6%, 0.6% and 0.3% respectively.
Additionally, in the regional equities market, the East African Exchanges 20 (EAE 20) share index lost by 0.1%, attributable to losses recorded by large cap stocks such as Tanzania Cigarette, Tanzania Breweries Limited and Co-operative Bank of Kenya of 2.0%, 2.0% and 1.5% respectively. The performance was however supported by gains recorded by large cap stocks such as Bank of Baroda Uganda, Safaricom and KCB Group of 13.3%, 3.1% and 3.0% respectively.
During the week, equities turnover increased by 12.1% to USD 20.2 mn, from USD 18.0 mn recorded the previous week, taking the YTD total turnover to USD 501.2 mn. Foreign investors remained net sellers for the second consecutive week, with a net selling position of USD 2.8 mn, from a net selling position of USD 2.6 mn recorded the previous week, taking the YTD foreign net selling position to USD 32.0 mn, compared to a net selling position of USD 16.9 mn in 2024.
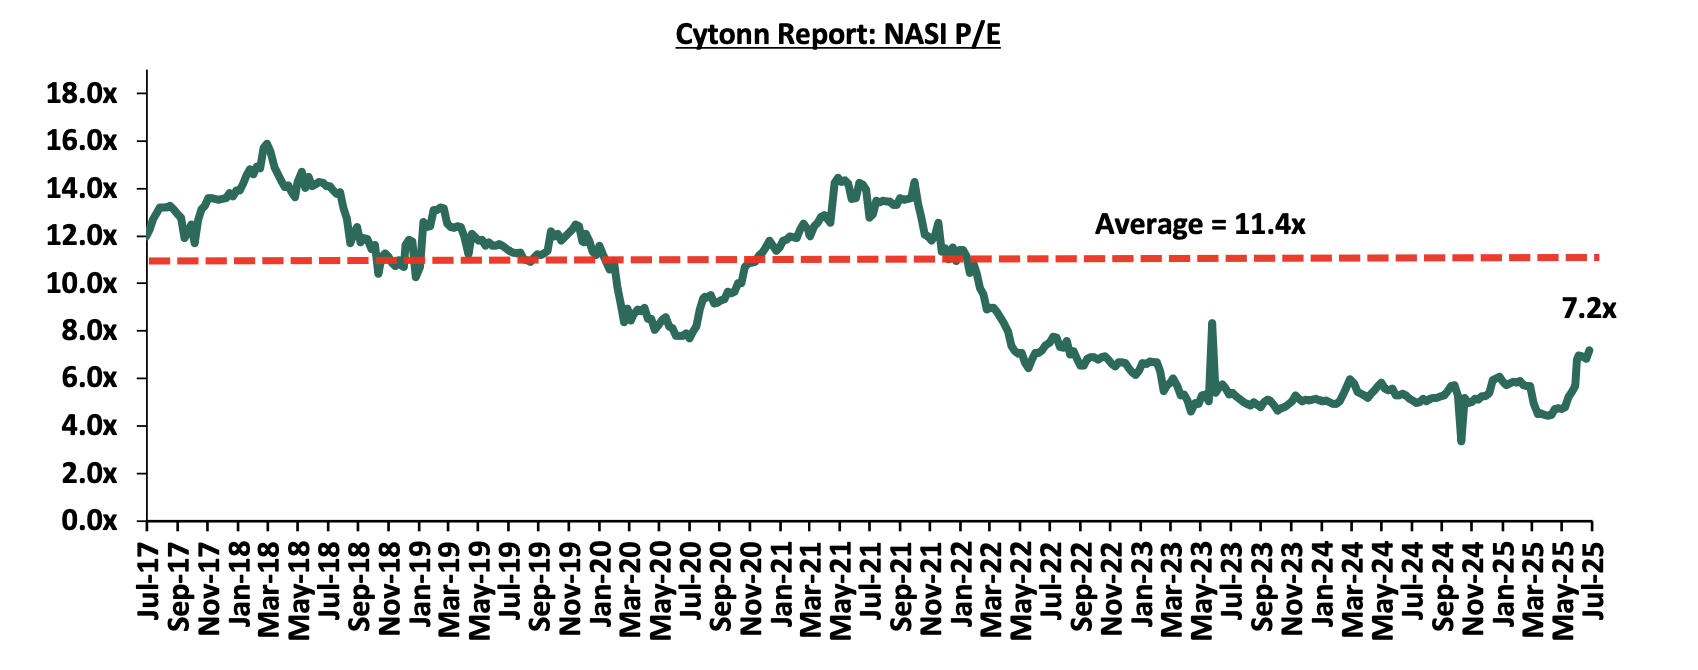
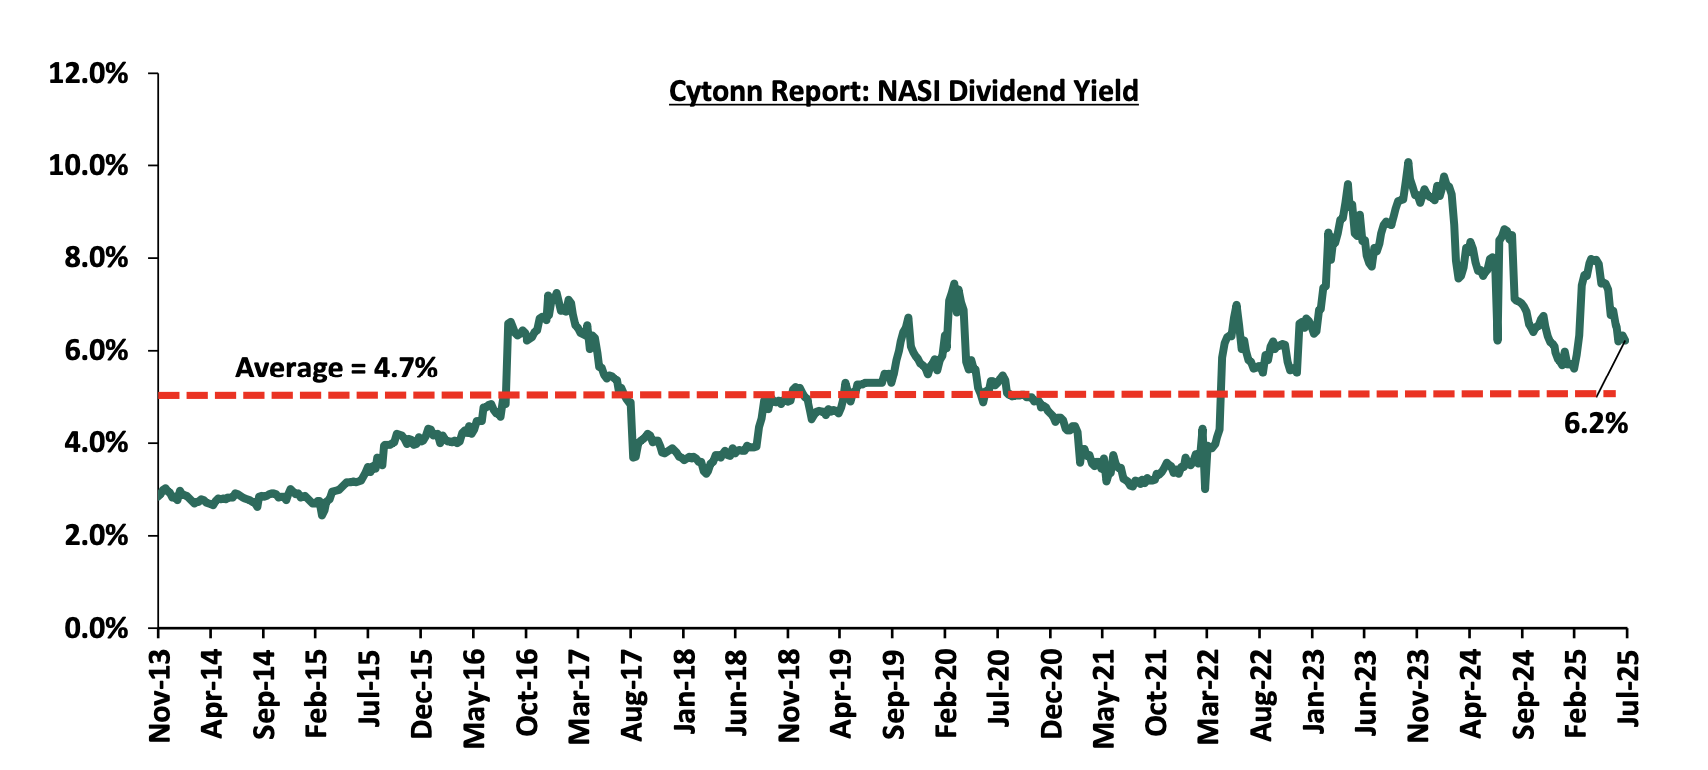
The market is currently trading at a price-to-earnings ratio (P/E) of 7.2x, 37.2% below the historical average of 11.4x. The dividend yield stands at 6.2%, 1.5% points above the historical average of 4.7%. Key to note, NASI’s PEG ratio currently stands at 0.9x, an indication that the market is undervalued relative to its future growth. A PEG ratio greater than 1.0x indicates the market is overvalued while a PEG ratio less than 1.0x indicates that the market is undervalued. The charts below indicate the historical P/E and dividend yields of the market;
|
Cytonn Report: Equities Universe of Coverage |
|||||||||||
|
Company |
Price as at 18/07/2025 |
Price as at 25/07/2025 |
w/w change |
YTD Change |
Year Open 2025 |
Target Price* |
Dividend Yield |
Upside/ Downside** |
P/TBv Multiple |
Recommendation |
|
|
Diamond Trust Bank |
78.3 |
77.0 |
(1.6%) |
15.4% |
66.8 |
90.4 |
9.1% |
26.5% |
0.3x |
Buy |
|
|
CIC Group |
3.3 |
3.4 |
0.9% |
57.0% |
2.1 |
4.0 |
3.9% |
23.8% |
0.9x |
Buy |
|
|
Equity Group |
49.5 |
50.5 |
2.0% |
5.2% |
48.0 |
58.0 |
8.4% |
23.3% |
0.9x |
Buy |
|
|
Co-op Bank |
16.8 |
16.7 |
(0.6%) |
(4.6%) |
17.5 |
18.9 |
9.0% |
22.7% |
0.6x |
Buy |
|
|
Standard Chartered Bank |
304.5 |
309.0 |
1.5% |
8.3% |
285.3 |
328.8 |
14.6% |
21.0% |
1.8x |
Buy |
|
|
KCB Group |
46.2 |
47.5 |
2.8% |
12.0% |
42.4 |
53.7 |
6.3% |
19.4% |
0.6x |
Accumulate |
|
|
Jubilee Holdings |
235.0 |
231.8 |
(1.4%) |
32.6% |
174.8 |
260.4 |
5.8% |
18.2% |
0.3x |
Accumulate |
|
|
Stanbic Holdings |
173.5 |
176.8 |
1.9% |
26.5% |
139.8 |
185.8 |
11.7% |
16.9% |
1.1x |
Accumulate |
|
|
ABSA Bank |
19.6 |
19.5 |
(0.3%) |
3.4% |
18.9 |
21.0 |
9.0% |
16.7% |
1.3x |
Accumulate |
|
|
I&M Group |
36.5 |
36.9 |
1.1% |
2.5% |
36.0 |
39.0 |
8.1% |
13.8% |
0.6x |
Accumulate |
|
|
Britam |
8.3 |
8.8 |
6.3% |
51.2% |
5.8 |
9.5 |
0.0% |
8.2% |
0.8x |
Hold |
|
|
NCBA |
63.0 |
64.8 |
2.8% |
27.0% |
51.0 |
60.2 |
8.5% |
1.4% |
1.0x |
Lighten |
|
|
*Target Price as per Cytonn Analyst estimates **Upside/ (Downside) is adjusted for Dividend Yield ***Dividend Yield is calculated using FY’2024 Dividends |
|||||||||||
Weekly Highlights
- BAT PLC H1’2025 Financial Performance
During the week, British American Tobacco Kenya Plc released their H1’2025 financial results, recording a 39.7% increase in Profits after Tax (PAT) to Kshs 3.0 bn, from Kshs 2.1 bn recorded in H1’2024. The increase in PAT was mainly attributed to the 5.5% decrease in the cost of sales to Kshs 7.5 bn in H1’2025, from Kshs 7.9 bn recorded in H1’2024, as well as the 113.5% decrease in the finance cost to a finance income of Kshs 0.1 bn, from a finance loss of Kshs 0.7 bn in H1’2024 which outweighed the 5.9% decrease in the gross sales to Kshs 18.5 bn from Kshs 19.6 bn. The tables below show the breakdown of BAT’s H1’2025 financial performance;
|
Cytonn Report: British American Tobacco (BAT) Kenya Plc Summarized Income Statement |
|||
|
Income Statement |
H1’2024 |
H1’2025 |
Y/Y Change |
|
Kshs (bn) |
Kshs (bn) |
||
|
Gross Sales including Indirect Taxes |
19.6 |
18.5 |
(5.9%) |
|
Excise Duty and Value-Added Taxes |
(7.9) |
(6.8) |
(14.8%) |
|
Net Revenue |
11.7 |
11.7 |
0.1% |
|
Cost of operations |
(7.9) |
(7.5) |
(5.5%) |
|
Profit from operations |
3.8 |
4.2 |
12.0% |
|
Net Finance Costs |
(0.7) |
0.1 |
(113.5%) |
|
Profit Before Income Tax |
3.1 |
4.3 |
41.6% |
|
Income Tax Expenses |
(0.9) |
(1.3) |
46.2% |
|
Profit After Tax |
2.1 |
3.0 |
39.7% |
|
Dividend Per Share (Kshs) |
5.0 |
10.0 |
100.0% |
|
Dividend Payout ratio |
234.1% |
335.2% |
101.2% points |
|
Dividend Yield |
1.4% |
2.5% |
1.1% points |
|
Earnings Per Share (Kshs) |
21.4 |
29.8 |
39.7% |
Source: British American Tobacco (BAT) Kenya Plc H1’2025 Financial Report
|
Cytonn Report: British American Tobacco (BAT) Kenya Plc Summarized Balance Sheet |
|||
|
Balance Sheet |
H1’2024 |
H1’2025 |
Y/Y Change |
|
Kshs (bn) |
Kshs (bn) |
||
|
Current Assets |
10.8 |
13.3 |
23.3% |
|
Non-Current Assets |
11.5 |
9.7 |
(15.3%) |
|
Total Assets |
22.3 |
23.1 |
3.4% |
|
Current Liabilities |
5.5 |
6.3 |
16.2% |
|
Non-Current Liabilities |
2.4 |
1.9 |
(19.0%) |
|
Total Liabilities |
7.9 |
8.3 |
5.5% |
|
Total Equity |
14.4 |
14.8 |
2.2% |
Source: British American Tobacco (BAT) Kenya Plc H1’2025 Financial Report
Key take outs from the financial performance include;
- Net Revenue remained relatively unchanged, recording a marginal 0.1% increase to Kshs 11.7 bn in H1’2025. This was despite a 5.9% decline in gross sales to Kshs 18.5 bn and a 14.8% decline in indirect taxes, which helped cushion revenue pressures.
- Net finance costs decreased significantly by 113.5% to a net finance income of Kshs 0.1 bn in H1’2025, from a net finance loss of Kshs 0.7 bn in H1’2024. This reversal was largely attributable to increased foreign exchange gains and a shift in the Group’s financing position, reflecting either higher interest income or lower borrowing expenses. The deterioration in net finance cost boosted the overall profitability, supported by strong cost control measures and improved operational performance.
- Cost of operations decreased by 5.5% to Kshs 7.5 bn in H1’2025, from Kshs 7.9 bn in H1’2024, mainly attributed to ongoing efficiency efforts, including supply chain optimization and prudent cost management measures undertaken by the Group. This reduction in costs helped boost profitability amid stagnant revenues.
- The Group’s balance sheet position improved slightly, with total assets increasing by 3.4% to Kshs 23.1 bn in H1’2025, from Kshs 22.3 bn in H1’2024, mainly supported by a 23.3% increase in current assets to Kshs 13.3 bn, from Kshs 10.8 bn. However, this growth was partially weighed down by a 15.3% decline in non-current assets to Kshs 9.7 bn, from Kshs 11.5 bn, suggesting asset disposals or depreciation-related declines,
- The Group’s Total liabilities increased by 5.5% to Kshs 8.3 bn in H1’2025, from Kshs 7.9 bn in H1’2024, driven by a 16.2% increase in current liabilities to Kshs 6.3 bn, from Kshs 5.5 bn. This reflects increased short-term obligations, possibly linked to trade or operational financing, despite a 19.0% reduction in long-term liabilities to Kshs 1.9 bn,
- Earnings per share increased by 39.7% to Kshs 29.8 in H1’2025, from Kshs 21.4 in H1’2024, reflecting enhanced profitability per unit of shareholding. The strong improvement in EPS was largely driven by the significant increase in net earnings during the period, supported by reduced finance cost and effective cost management. The rise in EPS signals improved shareholder value generation and reinforces the Group’s underlying financial strength in the face of a complex operating environment.
- The Group declared an interim dividend of Kshs 10.0 bn in H1’2025, marking a 100.0% increase from the Kshs 5.0 bn paid in a similar period in H1’2024 translating to 1% points increase in dividend yield to 2.5% from a dividend yield of 1.4% in H1’2024 and significant 101.2% increase in dividend payout ratio to 335.2% in H1’2025, from 234.1% in H1’2024. The increase in the interim dividend payout, alongside a 39.7% increase in earnings per share to Kshs 29.8 from Kshs 21.4, underscores the Group’s strong profitability and liquidity position. This generous payout reflects management’s confidence in the business’s cash flow generation capabilities and its focus on maximizing shareholder value, even in a challenging operating environment.
BAT’s profit after tax increased by 39.7% to Kshs 3.0 bn in H1’2025, up from Kshs 2.1 bn recorded in H1’2024, marking a significantly improved half-year performance. The growth in profitability was largely driven by a 5.5% decline in the cost of operations to Kshs 7.5 bn in H1’2025 from Kshs 7.9 bn in H1’2024, coupled with stable net revenue, which rose marginally by 0.1% to Kshs 11.7 bn. Additionally, the bottom line was supported by a 113.5% decrease in net finance costs, which shifted from a net finance loss of Kshs 0.7 bn in H1’2024 to a net finance income of Kshs 0.1 bn in H1’2025, reflecting favourable changes in financing dynamics. Despite the improved earnings, BAT continues to operate in a challenging environment marked by regulatory uncertainty and escalating tax pressures. Notably, the continued ban on modern oral nicotine pouches in the local market has prevented the Group from fully utilizing its Nairobi-based manufacturing facility. As a result, the company is considering offers for the disposal of related machinery to safeguard shareholder value and optimize asset use.
In line with its strong liquidity position, the Group declared an interim dividend of Kshs 10.0 bn in H1’2025, representing a 100.0% increase from the Kshs 5.0 bn paid in H1’2024. This was supported by a 39.7% increase in earnings per share (EPS) to Kshs 29.8, up from Kshs 21.4 in H1’2024, reflecting enhanced value delivered to shareholders during the period.
Looking ahead, profit margins remain under pressure due to persistent regulatory hurdles and rising operational costs. Nevertheless, the Group’s disciplined cost management, prudent financial strategy, and active regulatory engagement, especially in the modern oral nicotine segment, are expected to cushion the impact of these challenges. Furthermore, the Group’s consistent dividend policy is likely to bolster investor confidence in the stock despite prevailing macroeconomic headwinds.
- The Nairobi Securities Exchange Listings Update
Shri Krishana Overseas Limited (SKL), a packaging solutions provider, recently listed on the Nairobi Securities Exchange (NSE) on 24th July 2025 on the SME segment following the approval by the Capital Markets Authority (CMA). This marked the first listing on the NSE in five years, with the last listing being Homeboyz Entertainment Plc in 2020. Notably, this marks the first packaging company listing on the NSE.
Shri Krishana Overseas Limited (SKL) is a Kenyan packaging solutions provider founded in 2013 by Dr. Sonvir Singh and Nirmal Chaudhary. The company offers a diverse range of products, including corrugated boxes, mono-boxes, labels, tapes, and printing services, serving various sectors such as manufacturing, floriculture, agriculture, and fast-moving consumer goods (FMCG). In addition to its core packaging business, SKL operates a footwear division under the brand "SKL Shoes," which supplies affordable and durable footwear to both local and regional markets. Operating from its headquarters in Nairobi, SKL has grown to become a significant player in Kenya’s packaging industry, employing advanced manufacturing technologies.
SKL was listed by introduction, meaning its shares were listed on the stock exchange without raising new capital through an initial public offering (IPO). The company listed 50.5 mn ordinary shares at Kshs 5.90 per share with a par value of Kshs 0.20 each. Of the 50.5 mn ordinary shares, 8.7 mn shares were made available to the public. As of 25th July 2025, SKOL’s market cap was Kshs 299.0 mn and the share price had gained by 0.3%, closing at Kshs 5.92 from the Kshs 5.90 inception price.
SKL listed on the NSE to enhance its visibility and attract a broader investor base, providing liquidity for existing shareholders and improving market presence. The listing also supports the company’s long-term growth plans by offering access to capital needed to expand operations and meet rising demand for sustainable packaging solutions in the region.
On 16th July 2025, Satrix MSCI World Feeder ETF, a Johannesburg Stock Exchange (JSE) listed ETF, was listed on the NSE, marking Kenya’s first Equity-based ETF. This brings the total number of Exchange Traded Funds (ETFs) listed on the NSE to two, with the Satrix MSCI World Feeder ETF joining the previously listed Absa New Gold ETF. The ETF tracks the MSCI Emerging Markets Index which includes large and mid-cap companies from 23 Emerging Markets countries such as China, Taiwan, India, South Korea and Brazil.
The fund will be traded in Kenyan shillings, hedging investors against currency risk, and will have an annual total expense ratio of 0.35%. The Total Expense Ratio (TER) is the annual percentage of a fund's assets used to cover all operational costs, including management, administrative, legal, audit, and marketing expenses.
The listing of the Satrix MSCI World ETF on the NSE enhances Kenya’s capital markets by providing local investors access to global equity exposure, promoting market diversification and strengthening the NSE’s global positioning in capital markets. For Satrix, this marks a strategic expansion into East Africa, advancing its pan-African growth agenda and deepening its footprint across the continent.
Following the addition of the Satrix MSCI World Feeder ETF and Shri Krishana Overseas Limited, a total of 65 companies are listed on the NSE as of 25th July 2025, with 59 actively trading and 6 currently suspended.
The following graph shows the total number of companies listed on the NSE over the years:
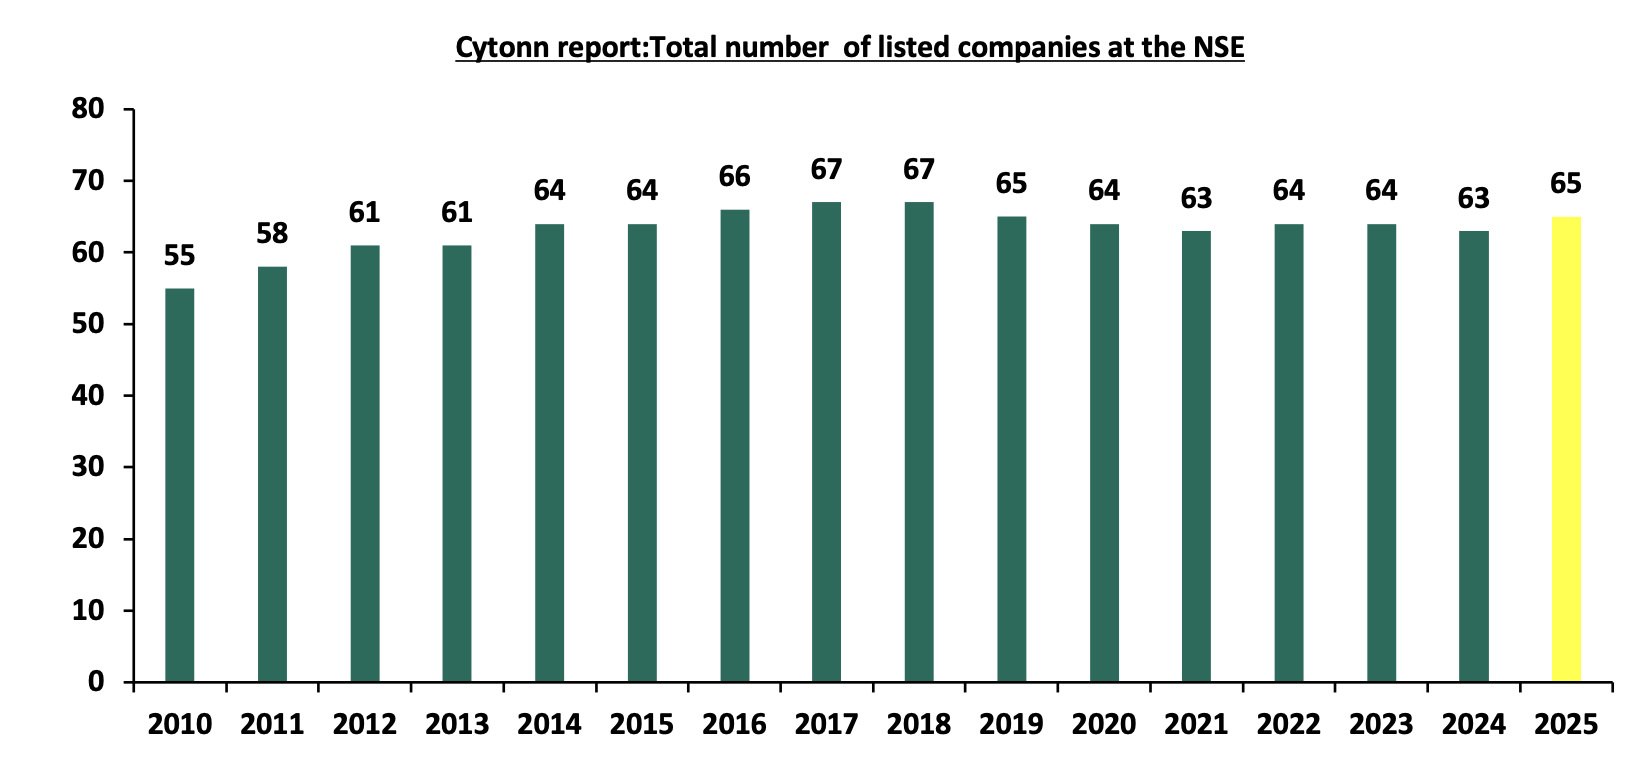
Source: NSE
Additionally, during the week Linzi Finco LLP, a subsidiary of Liaison Group listed the Linzi 003 Infrastructure Asset-Backed Security (IABS) on the NSE, valued at Kshs 44.9 bn. The securities were listed on the Nairobi Securities Exchange’s Restricted Fixed Income Market Sub-Segment (RFISMS). Linzi Finco LLP is a financial structuring and advisory firm that designs and issues innovative capital‑market instruments (such as Sukuk and infrastructure asset-backed securities) to channel private-sector funding into large-scale infrastructure and development projects across Kenya and Africa.
The Linzi FinCo 003 IABS is a financial instrument created to attract private investment for the construction of Talanta Sports City, a 60,000-seat stadium planned for the 2027 Africa Cup of Nations. It is backed by expected future revenues from the Sports, Arts, and Social Development Fund (SASDF), offering investors a medium-term, tax-efficient bond with an AA rating, a 15-year maturity, and an annual return of 15.04%. Interest and principal will be paid semi-annually.
This is the second listed issuance by Linzi FinCo, following the successful listing of the Linzi Sukuk in May 2024, under the Unquoted Securities Platform (USP). The Linzi Sukuk is Kenya’s first Shariah-compliant bond, which raised Kshs 3.0 bn to finance the construction of affordable housing units, thereby supporting the government’s affordable housing agenda. The bond has a 15-year maturity and offers an attractive internal rate of return of 11.13%, providing investors with a stable and ethical investment opportunity.
The listing of the Linzi FinCo 003 IABS on the NSE provides the government with a new way to finance major infrastructure projects by tapping into private-sector funds. For the capital markets, it introduces an innovative investment product that diversifies available securities and enhances market depth. Investors benefit from access to a relatively secure, tax-efficient fixed-income instrument with attractive returns linked to a significant national development project.
The listing of Shri Krishana Overseas Ltd and the Satrix MSCI World Feeder ETF marks a significant step forward for Kenya’s capital markets. Shri Krishana’s debut as the first packaging company on the NSE’s Growth Enterprise Market Segment reflects growing confidence among SMEs to tap public funding, while the Satrix ETF opens up global investment opportunities for local investors, allowing them to diversify beyond the Kenyan market. These milestones align well with the NSE’s current strategy to attract more listings, boost market activity, and expand investment products. They also support the government's broader agenda to revitalize the exchange, as recently emphasized by the President’s announcement that Kenya Pipeline Company will be listed by the end of 2025. Overall, these developments signal renewed momentum in positioning the NSE as a more dynamic and globally connect.
We are “Bullish” on the Equities markets in the short term due to current cheap valuations, lower yields on short-term government papers and expected global and local economic recovery, and, “Neutral” in the long term due to persistent foreign investor outflows. With the market currently trading at a discount to its future growth (PEG Ratio at 0.9x), we believe that investors should reposition towards value stocks with strong earnings growth and that are trading at discounts to their intrinsic value. We expect the current high foreign investors sell-offs to continue weighing down the economic outlook in the short term.
- Industrial Sector
- Hass Consult Land and property price index
During the week, Hass Consult, a Kenyan consulting and Real Estate development firm, released its Property Index Q1’2025 Report , focusing on the residential Real Estate sector's performance in the Nairobi Metropolitan Area (NMA). The following are the key takeouts from the report;
- The average selling prices for all properties posted a 3.8% increase on a quarter-on-quarter (q/q) basis in Q2’2025,1.3% points increase up from 2.5% recorded in Q1’2025. The performance was largely driven by increased activity in detached housing, where asking prices rose sharply by 5.0% q/q. In contrast, Nairobi’s suburbs, which had previously experienced consistent contractions, registered a modest rebound with a 1.6% increase, ending a five-quarter streak of decline. On a year-on-year (y/y) basis, property prices recorded a robust 7.8% growth, a 2.9% increase up from 4.9% in Q2’2024, reflecting growing confidence and improved demand across key market segments. Detached houses posted the highest quarterly growth at 5.0%, followed by apartments at 1.1%, and semi-detached houses at 1.3%. This trend underscores a continued buyer preference for more spacious and independent housing, especially in satellite towns that offer greater affordability, enhanced living standards and infrastructure upgrades. The rise in property prices further increased the cost of financing home purchases, exerting pressure on buyers amid elevated interest rates. While market volatility in mid-2024 driven by political unrest and inflationary uncertainty had previously dampened pricing momentum, Q2’2025 points to a broad-based recovery. Developers are facing elevated construction costsdriven by persistent global supply challenges and high material prices, particularly for cement and steel. These increased expenses are being passed on to homebuyers, reinforcing the 5.0% q/q price surge in detached units.
- The average asking rents of housing units in the Nairobi Metropolitan Area during Q2’2025 contracted by 0.2% quarter‑on‑quarter basis, a reversal from the 0.3% increase seen in Q1’2025. Rents for detached houses fell by 1.6%, and semi‑detached units declined by 0.4%, while apartment rents rose by about 2.4%, driven by strong demand in high‑occupancy areas such as Mlolongo, which recorded a 4.4% increase. Overall, landlords deferred rent hikes to maintain occupancy in a more price‑sensitive environment.
- Apartments recorded a 2.4% quarter-on-quarter increase in rents in Q2’2025, while semi-detached units declined by 0.4%, and detached units fell by 1.6%. On an annual basis, houses in Mlolongo had the highest rental price increase at 14.9%, followed by Ngong at 9.9% and Tassia at 9.1%, reflecting strong demand in satellite towns. However, Kileleshwa registered the steepest annual rental price drop at 12.0%. The overall rental trends reflect shifting demand, with increased tenant preference for apartments in affordable, high-density areas, while detached and semi-detached units face pressure from pricing sensitivity and changing renter priorities.
- In Nairobi’s suburbs, property in Runda posted the highest quarterly sales price increase at 5.2%, driven by continued demand supported by high-end developments and robust infrastructure. In contrast, apartments in Westlands recorded the steepest quarterly price drop at 6.6%, and an annual decline of 13.3%, making them the weakest-performing segment. Likewise, Kileleshwa saw an annual apartment rent drop of 12.0%, while Muthaiga and Nyari recorded significant rental declines of 5.9% and 4.7%, respectively. These trends underscore a shift in tenant and buyer preferences toward satellite towns offering greater value and similar amenities at more competitive prices.
- In the satellite towns, Juja posted the highest year-on-year price appreciation at 13.8% in Q2’2025, up from 11.2% in Q1’2025, marking a continued strong upward trend. This surge is attributed to: (i) excellent connectivity via the Thika Superhighway, (ii) a growing preference among the middle class to settle and raise families in the area, (iii) proximity to major retail hubs such as Unicity Mall and Juja City Mall, and (iv) access to key amenities including Jomo Kenyatta University of Agriculture and Technology (JKUAT) and nearby hospitals. On the other hand, Athi River recorded the lowest year-on-year price growth at 4.2% in Q2’2025, down from 5.0% in Q1’2025, largely due to increased competition from similarly priced neighboring areas like Kitengela and Ongata Rongai, which are gaining favor due to improved infrastructure and a better residential environment. This divergence highlights how infrastructure, accessibility, and local amenities continue to shape real estate demand and pricing trends across Nairobi’s satellite towns.
- Among apartments in satellite towns, Ruaka registered the steepest decline, with a 2.4% quarter-on-quarter drop and a 2.9% year-on-year depreciation in Q2’2025, making it the worst-performing apartment node during the period. This subdued performance reflects elevated land prices, market saturation, and increasing competition from neighboring areas such as Kiambu and Gigiri, which offer superior amenities and better infrastructure access. In contrast, Kitengela apartments posted a 1.4% q/q price increase and a 6.0% y/y gain, supported by its affordability, continued infrastructure upgrades including expanded access via Namanga Road and the Nairobi-Konza Techno City corridor and proximity to key social amenities such as schools, shopping malls, and hospitals. Meanwhile, Mlolongo recorded a 4.4% q/q increase in apartment rents, reflecting rising demand for rental units in well-connected locations along Mombasa Road and the Nairobi Expressway. These trends highlight shifting buyer and tenant preferences toward affordable, accessible, and well-serviced nodes in Nairobi’s metropolitan periphery.
The findings of the report are in line with our Cytonn H1’2025 Markets Review, which highlighted that residential property prices in the Nairobi Metropolitan Area (NMA) appreciated by 1.2% year-on-year in the first half of 2025. This improvement reflects growing market activity and increased transaction volumes compared to H1’2024, when price appreciation stood at just 0.5%. The uptick in pricing has been supported by stronger investor confidence, improved infrastructure in key nodes, and a shift in buyer preference towards more affordable and spacious developments, particularly in Nairobi’s satellite towns.
Hass Consult released Land Price Index Q2’2025 Report which highlighted the performance of the Real Estate land sector in the Nairobi Metropolitan Area (NMA). The following were the key take outs from the report;
- In Q2’2025, the average quarter-on-quarter selling prices for land in Nairobi suburbs increased by 1.7%, maintaining the same pace as Q1’2025, indicating a stable trend. On a year-on-year basis, land prices in the suburbs appreciated by 6.9%, a marginal improvement from 6.5% recorded previously. Meanwhile, in Nairobi’s satellite towns, land prices grew by 1.25% q/q, down from 2.4% in Q1, and posted a 9.9% y/y increase, slightly lower than the 10.6% recorded in the previous quarter. This softening in satellite town growth suggests cooling momentum after the strong run in 2024. Despite this, the overall land market continues to demonstrate resilience, buoyed by improved infrastructure, expanding road networks, and steady demand from developers eyeing opportunities in residential, logistics, and mixed-use projects. Strategic corridors such as the Thika Superhighway, Eastern Bypass, and Nairobi Expressway remain key focal points for land acquisition as urban growth extends further into the Nairobi Metropolitan Area.
- In the Nairobi suburbs, Spring Valley recorded the highest quarter-on-quarter price gain at 2.3%, followed closely by Parklands at 2.2%. These were the only two suburbs to post growth above two percent in the quarter, driven by their strategic locations, access to quality infrastructure, and proximity to major commercial and diplomatic hubs. All 18 suburbs tracked in the report recorded positive land price movement, albeit at varied rates. Growth in other suburbs remained more modest as buyers shifted focus to areas with better returns or lower entry prices. The performance of Spring Valley and Parklands reflects a broader market preference for low-density, amenity-rich neighbourhoods where long-term capital appreciation is more likely.
- In the satellite towns, land markets reflected cooling momentum compared to the previous quarters. Nodes such as Kiserian, Kitengela, Ngong, Ongata Rongai, Juja, and Thika recorded slower price gains, mainly due to weakening demand from middle-income buyers and the after-effects of a strong rally in 2024, where satellite town prices had hit a seven-year high annual growth of 12.5%. In Q2’2025, none of the satellite towns exceeded a 5.0% q/q growth rate. The general market trend pointed to softened growth amid economic constraints and shifting buyer sentiment. Notably, Ruaka posted a slight contraction of (0.1%) q/q, making it the only town in the satellite cluster to register a decline, signaling possible price saturation relative to nearby alternatives.
These findings align with broader market trends observed in the Cytonn H1’2025 Markets Review, which reported that the overall average selling prices for land in the Nairobi Metropolitan Area (NMA) appreciated by 2.7% in H1’2025, reaching Kshs 130.9 mn, up from Kshs 128.9 mn in H1’2024. This growth was supported by: i) sustained housing demand driven by favorable demographics, with Kenya’s population and urbanization rates at 2.0% and 3.7% respectively, both higher than global averages; ii) constrained land supply in key urban nodes, particularly for residential and commercial development; iii) rising land investment interest from a growing middle class with access to more structured financing and investment tools; iv) continued rollout of key infrastructure projects such as the Nairobi Expressway, Eastern Bypass, and water and sewerage extensions, which are opening up new development frontiers; v) land’s entrenched role as a preferred wealth preservation vehicle for Kenyan households; and vi) the Affordable Housing Program under BETA, which remains a critical driver of construction activity and has continued to support upward pressure on land prices in and around key housing project zones.
- Infrastructure Sector
- Wilson Airport Revamp Plans
During the week, the Kenya Airports Authority (KAA) announced plans to modernize Wilson Airport’s infrastructure, with particular focus on rehabilitating the runways and enhancing safety. KAA called for public participation through a Strategic Environmental and Social Assessment (SESA) in line with legal environmental obligations. The motivation behind this initiative stems from increasing safety threats posed by uncontrolled development and illegal structures within the airport's flight paths, especially in surrounding areas like Lang’ata and South C. KAA plans to hold three public forums to gather views from residents and stakeholders, a move signaling greater transparency and engagement.
The proposed Kshs 350.0 mn rehabilitation of Wilson Airport is set to reshape the real estate and economic landscape surrounding the facility. The planned upgrades focused on resurfacing the runway, taxiways, and aprons will enhance safety and operational efficiency, positioning the airport to support increased aviation traffic. This investment is expected to stimulate demand for aviation-linked infrastructure such as aircraft maintenance hangars, aviation training schools, and logistics centers. In turn, this could attract commercial real estate interest in the area, particularly for developments aligned with aviation and freight operations. Residential housing demand is also likely to rise, especially among professionals working in aviation and its support sectors. Moreover, if Nairobi County enforces zoning regulations and addresses illegal encroachments, land values in the surrounding zones may appreciate unlocking new investment opportunities in both commercial and residential segments.
Nonetheless, the success of the revamp hinges on more than technical upgrades. Coordinated efforts between KAA, the Nairobi County Government and community stakeholders will be critical in addressing the current urban planning lapses and preventing further encroachment. If properly managed, the project offers Wilson Airport a path toward becoming a model of urban-compatible airport development while unlocking significant value for investors and improving safety for Nairobi’s domestic air traffic.
We expect that the revamp of Wilson Airport will spur significant activity in the real estate sector, particularly within the hospitality segment. As airport operations become safer and more efficient, the area is likely to see increased domestic and regional air traffic driving demand for hotels, serviced apartments, and conference facilities catering to tourists, business travelers, and aviation professionals. This growth will attract developers targeting short-stay accommodation, dining, and transport services, positioning the airport's surroundings as a hub for aviation-linked hospitality and commercial real estate. Enhanced infrastructure and stricter zoning enforcement will further support property value appreciation, making the area more attractive for long-term real estate investment.
- Listing of Linzi 003 Infrastructure Asset-Backed Security
During the week, Linzi Finco LLP, an affiliate of the Liaison Group made headlines with the Kshs 44.9 bn listing of the Linzi 003 Infrastructure Asset-Backed Security (IABS) on the Nairobi Securities Exchange (NSE). This milestone represents not only one of the largest securitization transactions in East Africa, but also a strategic breakthrough in how Kenya finances large-scale infrastructure. The transaction was strongly endorsed by President William Ruto, who termed it a prime example of financing innovation through public-private partnerships.
The security was structured and led by Linzi Finco LLP, a Nairobi-based firm specializing in infrastructure finance and asset-backed solutions. The firm’s Managing Director described the listing as a “market-first solution” aligned with Kenya’s broader economic and infrastructural development goals. It opens up a pathway for the private sector to participate more effectively in funding projects traditionally reliant on government financing.
According to NSE, the listing is a testament to deepening investor confidence and the potential of capital markets to facilitate infrastructure growth. Beyond the numbers, Linzi 003 sets a compelling precedent for structured finance, paving the way for future listings in infrastructure, real estate, and utility sectors.
From a real estate and infrastructure lens, this development signals an important shift—where capital market instruments like IABS could become viable alternatives to traditional bank lending or government bonds in funding roads, housing, energy, and logistics projects. By securitizing underlying assets, developers and agencies can unlock liquidity upfront, thereby accelerating project execution and scale. The Linzi 003 success positions Kenya as a regional leader in financial innovation and offers a replicable model for other African markets keen on leveraging domestic capital for sustainable infrastructure delivery.
- Residential Sector
- Real Estate Investment Trusts (REITs)
On the Unquoted Securities Platform, Acorn D-REIT and I-REIT traded at Kshs 26.7 and Kshs 22.9 per unit, respectively, as per the last updated data on 25th July 2025. The performance represented a 33.4% and 14.5% gain for the D-REIT and I-REIT, respectively, from the Kshs s 20.0 inception price. The volumes traded for the D-REIT and I-REIT came in at Kshs s 12.3 mn and Kshs 31.6 mn shares, respectively, with a turnover of Kshs 311.5 mn and Kshs 702.7 mn, respectively, since inception in February 2021. Additionally, ILAM Fahari I-REIT traded at Kshs 11.0 per share as of 25th July 2025, representing a 45.0% loss from the Kshs 20.0 inception price. The volume traded to date came in at 1.2 mn shares for the I-REIT, with a turnover of Kshs 1.5 mn since inception in November 2015.
REITs offer various benefits, such as tax exemptions, diversified portfolios, and stable long-term profits. However, the ongoing decline in the performance of Kenyan REITs and the restructuring of their business portfolios are hindering significant previous investments. Additional general challenges include:
- Insufficient understanding of the investment instrument among investors leading to a slower uptake of REIT products,
- Lengthy approval processes for REIT creation,
- High minimum capital requirements of Kshs 100.0 mn for REIT trustees compared to Kshs 10.0 mn for pension funds Trustees, essentially limiting the licensed REIT Trustee to banks only
- The rigidity of choice between either a D-REIT or and I-REIT forces managers to form two REITs, rather than having one Hybrid REIT that can allocate between development and income earning properties
- Limiting the type of legal entity that can form a REIT to only a trust company, as opposed to allowing other entities such as partnerships, and companies,
- We need to give time before REITS are required to list – they would be allowed to stay private for a few years before the requirement to list given that not all companies maybe comfortable with listing on day one, and,
- Minimum subscription amounts or offer parcels set at Kshs 0.1 mn for D-REITs and Kshs 5.0 mn for restricted I-REITs. The significant capital requirements still make REITs relatively inaccessible to smaller retail investors compared to other investment vehicles like unit trusts or government bonds, all of which continue to limit the performance of Kenyan REITs.
We expect Kenya’s Real Estate sector to maintain a positive growth trajectory, driven by key developments across infrastructure, residential, and industrial segments. The listing of the Linzi 003 Infrastructure Asset-Backed Securityhas unlocked new capital market pathways to finance large-scale infrastructure, while the planned revamp of Wilson Airport is expected to stimulate aviation-linked commercial and hospitality investments. On the residential front, performance continues to be shaped by shifting preferences captured in the Hass Consult Property Index, while the REITs market presents growing potential to attract institutional and retail investment into housing and rental portfolios. The industrial sector remains supported by demand for development-ready land, as indicated in the Hass Consult Land Price Index, especially in strategic urban peripheries. Despite these positives, challenges such as elevated construction costs, infrastructure pressure in urban centers, and capital constraints within the REITs space may continue to hinder optimal sector performance.
Disclaimer: The views expressed in this publication are those of the writers where particulars are not warranted. This publication, which is in compliance with Section 2 of the Capital Markets Authority Act Cap 485A, is meant for general information only and is not a warranty, representation, advice or solicitation of any nature. Readers are advised in all circumstances to seek the advice of a registered investment advisor

- Talk to us
- Kenya
- P.O Box 20695 - 00200, Nairobi, Kenya
- Cell +254709101200
- Tel +254709101200
- WhatsApp +254741676635
- United States
- +254709101200
- DOWNLOAD OUR APP
-


- Kenya
- 8th Floor, Pinetree Plaza, Kaburu Drive, Ngong Road, Nairobi, Kenya
- USA
- Suite 1150, 1775 Eye Street NW, USA, Washington DC 20006, USA
- Investments
- High Yield
- Private Equity
- Real Estate
- Real Estate
- RiverRun Estates
- Cytonn Towers
- The Ridge
- Taraji Heights
- The Alma