Cytonn H1’2025 Markets Review
By Research Team, Aug 3, 2026
Executive Summary
Global Markets Review
According to the World Bank the global economy is projected to grow at 2.3% in 2025, lower than the 2.7% growth recorded in 2024. This forecast marks a slight downward revision from earlier projection in January of 2.7%, reflecting anticipated economic slowdown, particularly due to rising international trade disputes and policy uncertainties. The World Bank’s growth projection is 0.5% points lower than the IMF’s 2025 forecast of 2.8%, which was also revised from the January 2025 projection of 3.3%. Both the World Bank and the IMF revised their global growth forecasts downward due to weakening global trade, largely driven by rising U.S. tariffs and the resulting trade tensions, which disrupted global supply chains and slowed cross-border economic activity. Notably, advanced economies are expected to record a 1.2% growth in 2025, up from the 1.7% expansion recorded in 2024. However, emerging markets and developing economies are projected to expand by 3.8% in 2025, down from the 4.2% expansion recorded in 2024;
Sub-Saharan Africa Regional Review
According to the World Bank, the Sub-Saharan economy is projected to grow at a moderate rate of 3.7% in 2025, which is 0.2% points higher than the 3.5% growth recorded in 2024, and a downward revision from the January 2025 projection of 4.1%. The downward revision is mainly due to the rising trade barriers coupled with the weakened global investor confidence. The expected recovery from 2024 is primarily driven by global economic stability, and easing of monetary policy rates in the region, which is expected to boost private consumption and investment. However, most countries face the risk of increased inflation due to increased food prices resulting from drought, prompting them to increase or hold off on further easing of the rates. Nevertheless, the risk of debt distress remains high with more than half of countries facing unsustainable debt burdens. The public debt is expected to remain high due to increased debt servicing costs as a result of high interest rates in developed economies and a reduction in donor support;
In H1’2025, most of the select Sub-Saharan currencies appreciated against the US Dollar, primarily due to the respective central bank efforts, increased foreign currency inflows and debt-restructuring and policy reforms which have improved forex reserves. Notably, the Ghanaian Cedi emerged as the best performer among the selected currencies, appreciating by 29.9% against the USD on a year-to-date basis, closing H1'2025 at GHS 10.3, from GHS 14.7 at the beginning of the year. The Ghanaian Cedi’s performance is majorly attributable to tight monetary policy and stronger remittance flows;
Kenya Macro-Economic Review
According to the Kenya National Bureau of Statistics (KNBS) Q1'2025 Quarterly GDP Report, the Kenyan economy recorded a 4.9% growth in Q1’2025, unchanged from the growth rate recorded in Q1’2024. The main contributor to Kenyan GDP remains to be the Agriculture, fishing and forestry sector which grew by 6.0% in Q1’2025, higher than the 5.6% expansion recorded in Q1’2024. All sectors in Q1’2025 recorded positive growths, with varying magnitudes across activities. Most sectors recorded contraction in growth rates compared to Q1’2024 with Accommodation & Food Services, Financial Services Indirectly Measured and Professional Administration recording growth rate declines of 34.0%, 13.4% and 4.8% points to 4.1%, 9.0% and 4.6% from 38.1%, 15.4% and 9.4% respectively. Other sectors recorded an expansion in growth rates, from what was recorded in Q1’2024, with Mining and Quarrying, Taxes on products and Construction recording the highest growths in rates of 26.0%, 2.8% and 2.6% points, to 10.0%, 5.7% and 0.4% from (16.1%), 2.9% and 3.0% respectively. Notably, the overall economic performance highlighted a slight slowdown in momentum following tough operating environment characterized by the high costs of living, and the lower private sector credit growth;
Fixed Income
During H1’2025, T-bills were oversubscribed, with the overall subscription rate coming in at 154.5%, up from 132.6% in H1’2024. Investors’ preference for the 91-day paper persisted with the paper receiving bids worth Kshs 233.7 bn against the offered Kshs 104.0 bn, translating to an oversubscription rate of 224.8%, albeit lower than the oversubscription rate of 404.4% recorded in H1’2024. Overall subscription rates for the 364-day and 182-day papers came in at 191.6% and 89.3% respectively, higher than the 80.7% and 75.7%, respectively, recorded in H1’2024. The average yields on the 364-day, 182-day, and 91-day papers decreased by 6.2% points, 7.5% points, and 7.4% points to 10.4%, 9.1%, and 8.8% in H1’2025, respectively, from 16.7%, 16.6%, and 16.2%, respectively, in H1’2024. The downward trajectory in yields is primarily driven by improved investor confidence, stemming from reduced credit risk in the country and eased inflationary pressures. This has lowered the risk premium demanded by investors. Despite the government's sustained domestic borrowing, strong demand for government securities has supported the decline in yields. During the period, the acceptance rate stood at 85.4%, down from 92.3% in H1’2024, with the government accepting Kshs 823.2 billion out of the Kshs 964.0 billion worth of bids received;
During the week, T-bills were undersubscribed for the second consecutive week, with the overall subscription rate coming in at 90.9%, higher than the subscription rate of 60.4% recorded the previous week. Investors’ preference for the shorter 91-day paper waned, with the paper receiving bids worth Kshs 2.7 bn against the offered Kshs 4.0 bn, translating to a subscription rate of 67.4%, higher than the subscription rate of 36.2%, recorded the previous week. The subscription rates for the 182-day paper increased to 111.7% from the 12.0% recorded the previous week, while the 364-day paper decreased to 79.6% from the 118.4% recorded the previous week. The government accepted a total of Kshs 21.77 bn worth of bids out of Kshs 21.83 bn bids received, translating to an acceptance rate of 99.7%. The yields on the government papers registered a mixed performance with the yields on the 91-day paper increasing by 0.7 bps to 8.15% from the 8.14% recorded the previous week, while the yields on the 182-day and 364-day papers decreased by 1.1 bps and 0.9 bps to 8.45% and 9.71%, from the 8.46% and 9.72% respectively recorded the previous week;
During the week, the Kenya National Bureau of Statistics released the Q1’2025 Quarterly Balance of Payment Report, highlighting that Kenya’s balance of payments position deteriorated significantly by 313.8% in Q1’2025, with a deficit of Kshs 77.0 bn, from a surplus of Kshs 36.0 bn in Q1’2024;
During the week, the Kenya National Bureau of Statistics (KNBS) released the Q1’2025 Quarterly Gross Domestic Product Report, highlighting that the Kenyan economy recorded a 4.9% growth in Q1’2025, remaining unchanged from Q1’2024. The main contributor to Kenyan GDP remains to be the Agriculture, fishing and forestry sector which grew by 6.0% in Q1’2025, higher than the 5.6% expansion recorded in Q1’2024;
During the week, Linzi FinCo 003 Trust announced the successful full subscription of its Kshs. 44.8 bn Infrastructure Asset-Backed Securities (IABS) issuance, with bids totaling KSh. 44.9 billion translating to a subscription rate of 100.2%. The 15-year notes, offering a fixed annual return of 15.04%, will finance the Talanta Sports Complex through receivables from the Sports, Arts and Social Development Fund (SASDF).
Equities
During Q2’2025, the equities market was on an upward trajectory, with NASI, NSE 10, NSE 25, and NSE 20 gaining by 17.3%, 13.0%, 11.5%, and 9.6%, respectively, taking the H1’2025 performance to gains of 22.4%, 18.5%, 14.3% and 13.9% for NASI, NSE 20, NSE 10, and NSE 25 respectively. The equities market performance during the quarter was driven by gains recorded by large caps such as Safaricom, NCBA, and Cooperative Bank of 36.6%, 13.3%, and 11.9% respectively. The gains were however weighed down by losses recorded by large cap stocks such as Bamburi and BAT of 4.4% and 2.8% respectively;
During Q2’2025, in the regional equities market, the East African Exchanges 20 (EAE 20) share index declined by 11.0 bps, attributable to decline recorded by large cap stocks such as Airtel Uganda, MTN Rwandacell and Tanzania Breweries of 13.6%, 9.1% and 2.8% respectively. The performance was however supported by gains recorded by large cap stocks such as Bank of Baroda Uganda, Safaricom and KCB Group of 1,317.9%, 42.1% and 22.1% respectively;
During the week, the equities market was on an upward trajectory, with NASI, NSE 25, NSE 10 and NSE 20 gaining by 5.7%, 5.1%, 4.8%, and 4.5%, respectively, taking the YTD performance to gains of 28.6%, 21.6%, 19.0% and 18.8% for NASI, NSE 20, NSE10, and NSE 25 respectively. The equities market performance was mainly driven by gains recorded by large-cap stocks such as Stanbic Bank, Safaricom, and NCBA of 9.9%, 8.0%, and 6.8%, respectively. The gains were however weighed down by losses recorded by large cap stocks such as Cooperative Bank of 0.3%;
Additionally, in the regional equities market, the East African Exchanges 20 (EAE 20) share index ddeclined by 54.6 bps, attributable to losses recorded by large cap stocks such as Tanga Cement, Cooperative Bank and Tanzania cigarette of 33.4%, 1.6% and 1.4% respectively. The performance was however supported by gains recorded by large cap stocks such as Safaricom, Bank of Baroda Uganda and Absa of 6.1%, 4.4% and 3.5% respectively;
During the week,the Nairobi Securities Exchange (NSE) announced the inclusion of Sasini Plc as a constituent in the NSE 25 Share Index to replace TransCentury Plc following the court order placing it under receivership and subsequent suspension of trading of TransCentury Plc and its subsidiary East Africa Cables;
Real Estate
In Q1’2025, the general Real Estate sector continued to witness considerable growth in activity in terms of property transactions and development activities. Consequently, the sector’s activity contribution to Gross Domestic Product (GDP) grew by 5.3 % to Kshs 358.4 bn in Q1’2025, from Kshs 334.1 bn recorded during the same period in 2024. In Q1’2025, the sector contributed 10.2% to the country’s GDP, remaining unchanged from Q1’2024. Cumulatively, the Real Estate and construction sectors contributed 15.5% to GDP in Q1’2025, 0.1% points decrease from 15.6% in Q1’2024, attributable to decline in construction contribution to GDP by 0.1% points, to 5.2% in Q1’2025, from 5.3% recorded in Q1’2024;
During the week, the Kenya National Bureau of Statistics (KNBS) released the Q1'2025 Quarterly Gross Domestic Product Report that outlined the performance of various sectors to the GDP, with real estate sector contributing 10.2% of GDP;
During the week, the National carrier, Kenya Airways inked a code-sharing pact with Qatar Airways, allowing the latter to introduce a third daily frequency between Doha and Nairobi while Kenya Airways will launch Qatar Airways-marketed flights between Mombasa and Doha during the coming winter season. This agreement makes Qatar Airways the 15th codeshare partner of the local carrier in a growing list that has seen Kenya Airways widen its global route network;
During the week, Kenya’s capital, Nairobi, was named Africa’s Leading Business Travel Destination 2025 at the 32nd World Travel Awards. This marks Nairobi’s seventh consecutive win in the category, maintaining its dominant position since first clinching the title in 2019. Nairobi was nominated in the category alongside Accra, Cairo, Cape Town and Lagos;
During the week, lifestyle hotel group, African Hotel Development, entered a management agreement with Aleph Hospitality for 26 ONOMO branded hotels across 14 African countries. This strategic move is part of African Hotel Development’s business realignment strategy;
On the Unquoted Securities Platform, Acorn D-REIT and I-REIT traded at Kshs 26.7 and Kshs 22.9 per unit, respectively, as per the last updated data on 27th June 2025. The performance represented a 33.4% and 14.5% gain for the D-REIT and I-REIT, respectively, from the Kshs 20.0 inception price. Additionally, ILAM Fahari I-REIT traded at Kshs 11.0 per share as of 20th June 2025, representing a 45.0% loss from the Kshs 20.0 inception price. The volume traded to date came in at 1.2 mn shares for the I-REIT, with a turnover of Kshs 1.5 mn since inception in November 2015;
Investment Updates:
- Weekly Rates: Cytonn Money Market Fund closed the week at a yield of 13.4% p.a. To invest, dial *809# or download the Cytonn App from Google Play store here or from the Appstore here;
- We continue to offer Wealth Management Training every Tuesday, from 7:00 pm to 8:00 pm. The training aims to grow financial literacy among the general public. To register for any of our Wealth Management Trainings, click here;
- If interested in our Private Wealth Management Training for your employees or investment group, please get in touch with us through wmt@cytonn.com;
- Cytonn Insurance Agency acts as an intermediary for those looking to secure their assets and loved ones’ future through insurance namely; Motor, Medical, Life, Property, WIBA, Credit and Fire and Burglary insurance covers. For assistance, get in touch with us through insuranceagency@cytonn.com;
- Cytonn Asset Managers Limited (CAML) continues to offer pension products to meet the needs of both individual clients who want to save for their retirement during their working years and Institutional clients that want to contribute on behalf of their employees to help them build their retirement pot. To more about our pension schemes, kindly get in touch with us through pensions@cytonn.com;
Hospitality Updates:
- We currently have promotions for Staycations. Visit cysuites.com/offers for details or email us at sales@cysuites.com;
Global Economic Growth:
According to the World Bank the global economy is projected to grow at 2.3% in 2025, lower than the 2.7% growth recorded in 2024. This forecast marks a slight downward revision from earlier projection in January of 2.7%, reflecting anticipated economic slowdown, particularly due to rising international trade disputes and policy uncertainties. The World Bank’s growth projection is 0.5% points lower than the IMF’s 2025 forecast of 2.8%, which was also revised from the January 2025 projection of 3.3%. Both the World Bank and the IMF revised their global growth forecasts downward due to weakening global trade, largely driven by rising U.S. tariffs and the resulting trade tensions, which disrupted global supply chains and slowed cross-border economic activity. Notably, advanced economies are expected to record a 1.2% growth in 2025, up from the 1.7% expansion recorded in 2024. However, emerging markets and developing economies are projected to expand by 3.8% in 2025, down from the 4.2% expansion recorded in 2024.
The downturn in global economic growth in 2025 as compared to 2024 is majorly attributable to;
- Heightened trade tensions and rising U.S. tariffs. Escalating U.S. tariffs, particularly on imports from China and key trading partners have disrupted global supply chains and increased the cost of goods. This has led to the slowdown in international trade volumes and weakened export-driven growth in the emerging markets and developing economies. However, if the major economies settle their trade disputes, it could ease global economic pressures, and,
- Trade policy uncertainty. The global economic landscape in 2025 is clouded by unpredictable trade policies, especially from major economies such as the United States, China and the European Union. Sudden tariff hikes, retaliatory measures and inconsistent enforcement have created a volatile environment for global trade. Developing countries, particularly those reliant on exports are facing reduced trading volumes and lower commodity prices.
The global economy is expected to remain subdued in 2025, mainly as a result of rising global trade tensions as well as volatile and unclear trade policies, which are expected to slow down economic growth.
Global Commodities Market Performance:
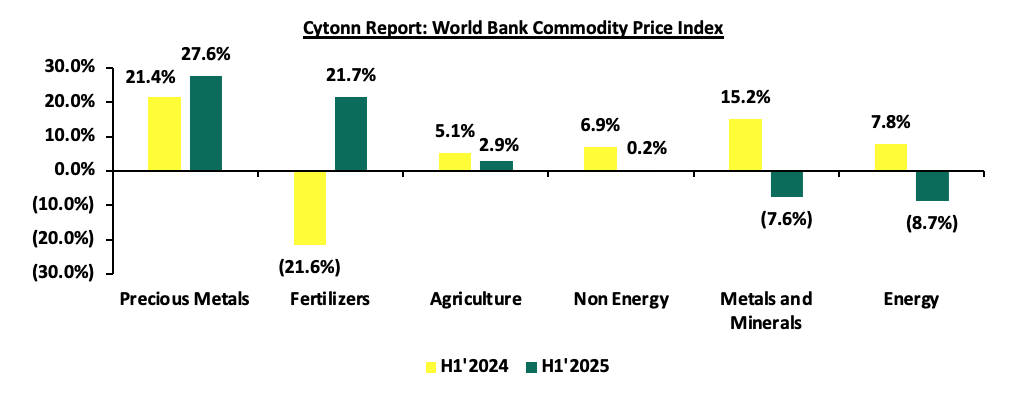
Global commodity prices registered mixed performance in H1’2025, with prices of energy declining by 8.7%, compared to the 7.8% increase recorded in H1’2024, mainly as a result of a surplus of oil supply coupled with adoption of electric vehicles. Additionally, prices of metals and minerals declined by 7.6% in H1’2025, compared to the 15.2% increase growth recorded in H1’2024, mainly due to reduced demand especially by China, which is the world’s largest metal consumer, as well as trade tensions and unexpected disruptions by suppliers. On the other hand, prices of Precious Metals, Fertilizers, Agriculture, and Non-Energy increased by 27.6%, 21.7%, 2.9%, and 0.2% respectively, on the back of geopolitical tensions (especially in the Middle East), extreme weather impacting crop yields, rising input costs for fertilizers, and strong demand from clean-energy sectors. Tariffs and supply disruptions have further fueled these increases. Below is a summary performance of various commodities;
Source: World Bank
Global Equities Market Performance:
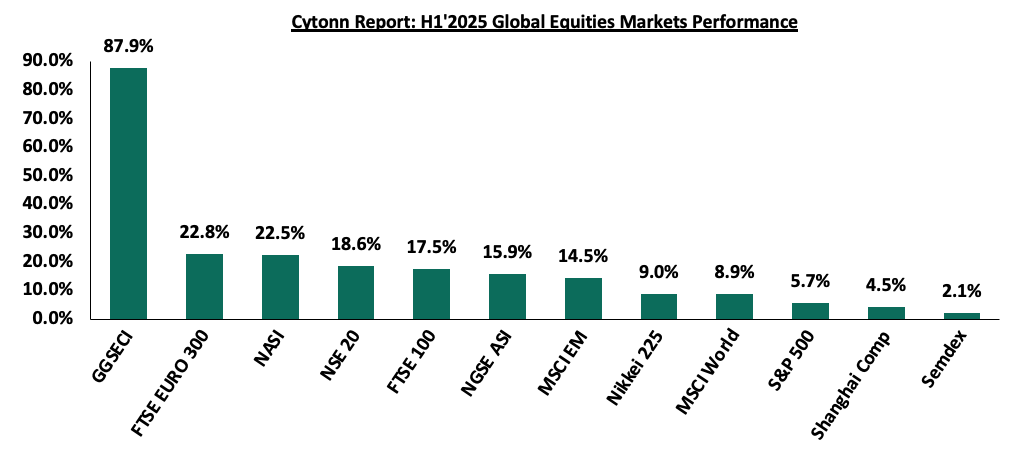
The global stock market was on an upward trajectory in H1’2025, with most indices recording gains during the period, largely attributable to improved investor sentiments as a result of strong corporate earnings, easing inflation pressures, and a weaker U.S. dollar, which has boosted international stock returns. Additionally, geopolitical tensions like tariff threats temporarily subsided and investors rotated into undervalued European and emerging markets. Notably, GGSECI was the best performer during the period, recording a gain at 87.9% in H1’2025 largely driven by gains in the large-cap stocks such as Access Bank, Standard Chartered Bank and MTN Ghana gaining by 161.5%, 21.2% and 17.2%, following improved earnings during the period, supported by easing inflation. Below is a summary of the performance of key indices as at the end of H1’2025:
*Dollarized performance
According to the World Bank, the Sub-Saharan economy is projected to grow at a moderate rate of 3.7% in 2025, which is 0.2% points higher than the 3.5% growth recorded in 2024, and a downward revision from the January 2025 projection of 4.1%. The downward revision is mainly due to the rising trade barriers coupled with the weakened global investor confidence. The expected recovery from 2024 is primarily driven by global economic stability, and easing of monetary policy rates in the region, which is expected to boost private consumption and investment. However, most countries face the risk of increased inflation due to increased food prices resulting from drought, prompting them to increase or hold off on further easing of the rates. Nevertheless, the risk of debt distress remains high with more than half of countries facing unsustainable debt burdens. The public debt is expected to remain high due to increased debt servicing costs as a result of high interest rates in developed economies and a reduction in donor support.
Currency Performance:
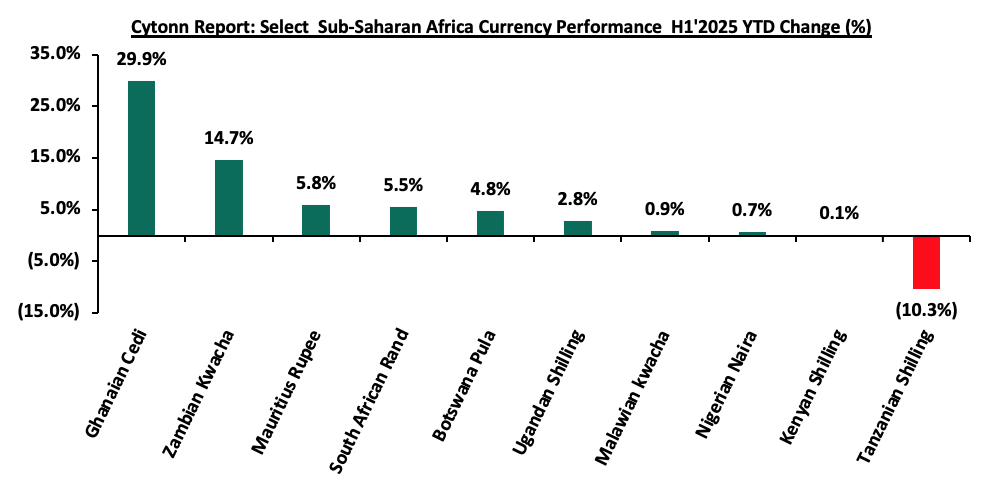
In H1’2025, most of the select Sub-Saharan currencies appreciated against the US Dollar, primarily due to the respective central bank efforts, increased foreign currency inflows and debt-restructuring and policy reforms which have improved forex reserves. Notably, the Ghanaian Cedi emerged as the best performer among the selected currencies, appreciating by 29.9% against the USD on a year-to-date basis, closing H1'2025 at GHS 10.3, from GHS 14.7 at the beginning of the year. The Ghanaian Cedi’s performance is majorly attributable to tight monetary policy and stronger remittance flows. Below is a table showing the performance of select African currencies against the US Dollar:
|
Cytonn Report: Select Sub-Saharan Africa Currency Performance vs USD |
|||||
|
Currency |
Jun-24 |
Jan-25 |
Jun-25 |
Last 12 months |
YTD change (%) |
|
Ghanaian Cedi |
15.3 |
14.7 |
10.3 |
32.6% |
29.9% |
|
Zambian Kwacha |
24.0 |
27.9 |
23.8 |
0.8% |
14.7% |
|
Mauritius Rupee |
47.2 |
47.7 |
44.9 |
4.8% |
5.8% |
|
South African Rand |
18.2 |
18.8 |
17.7 |
2.5% |
5.5% |
|
Botswana Pula |
13.6 |
14.0 |
13.3 |
2.2% |
4.8% |
|
Ugandan Shilling |
3710.1 |
3,697.6 |
3594.4 |
3.1% |
2.8% |
|
Malawian kwacha |
1,734.0 |
1,750.3 |
1,734.0 |
(0.0%) |
0.9% |
|
Nigerian Naira |
1,535.4 |
1,540.7 |
1,529.7 |
0.4% |
0.7% |
|
Kenyan Shilling |
129.5 |
129.3 |
129.2343 |
0.2% |
0.1% |
|
Tanzanian Shilling |
2,626.9 |
2,374.7 |
2,618.3 |
0.3% |
(10.3%) |
Source: Yahoo Finance, Central Banks
The chart below shows the year-to-date performance of different sub-Saharan African countries in Q1’2025;
Source: Yahoo Finance
Key take outs from the above table and chart include:
- The Ghanaian Cedi was the largest gainer against the USD Dollar, gaining by 29.9% year to date to close at GHS 10.3 as at the end of June from the GHS 14.7 recorded at the beginning of the year. The Cedi’s strength has been supported by several factors, including increased foreign exchange reserves resulting from increased commodity prices, particularly gold, as well as reforms under the International Monetary Fund program. The IMF program (Extended Credit Program) focuses on debt sustainability and economic stabilization, following the external debt default in 2022, and includes structural reforms and monetary policy adjustments. and,
- The Tanzanian Shilling was the worst performing currency in H1’2025, depreciating by 10.3%, mainly as a result of rising imports and increased public debt linked to major infrastructure projects.
African Eurobonds:
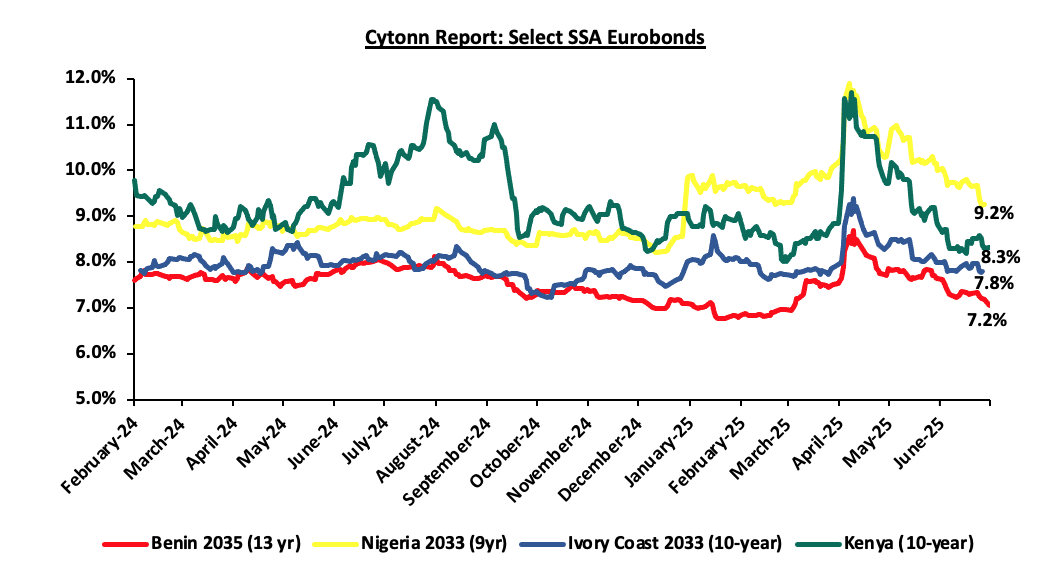
Africa’s appetite for foreign-denominated debt has increased in recent times with the latest issuers during the three months to end of Q1’2025 being Ivory Coast and Benin raising a total of USD 0.7 bn and USD 0.5 bn respectively. Additionally, 2024 issuers were Ivory Coast, Benin, Kenya, Senegal and Cameroon raising a total of USD 2.6 bn, USD 0.8 bn, USD 1.5 bn, USD 0.8 bn and USD 0.6 bn respectively. Notably, all the bonds were oversubscribed with the high support being driven by the yield hungry investors and also the outlook of positive recovery in the regional economies. It is good to note that there was a general decline in the yields of the various bonds from most countries due to general improvement in investor sentiment as the economy recovers and the easing inflationary pressures in the region. The Yields of the Kenya’s 10-year Eurobond maturing in 2028 decreased by 2.0% points to 8.3% as at the end of June 2025 from 10.4% in June 2024, partly attributable to improved investor confidence following the successful buy-back in March 2025, of the 2027 Eurobond maturity, increased IMF Credit funding and the stabilizing of the Kenyan shilling against the dollar. Similarly, the yields for Benin’s 13-year and Ivory Coast’s 10-year Eurobonds maturing in 2035 and 2033 respectively decreased by 1.0% and 0.5% to 7.1% and 7.7% respectively at the end of June 2025. However, the yields of Nigerian 9-year Eurobond maturing in 2033 increased marginally by 0.2% to 9.1% from 8.9% in June 2024. Below is a graph showing the Eurobond secondary market performance of select Eurobonds issued by the respective countries:
Source: Bloomberg, CBK
Equities Market Performance:
Sub-Saharan Africa (SSA) stock markets recorded mixed performance in H1’2025, with Ghana’s stock market (GSECI) being the best performing market gaining by 81.3% YTD attributable to gains in the large-cap stocks such as Access Bank, Standard Chartered Bank and MTN Ghana gaining by 161.5%, 21.2% and 17.2%, following improved earnings during the period, additionally supported by easing inflation. Rwanda’s RSEASI was the worst performing stock market, declining by 2.5% YTD, mainly attributable to losses recorded by large-cap stocks such as MTN Rwanda of 23.1%, coupled with currency depreciation of the Rwandan Franc. Below is a summary of the performance of key indices:
|
Cytonn Report: Equities Market Performance H1'2025(Dollarized*) |
||||||
|
Country |
Index |
Jun-24 |
Jan-25 |
Jun-25 |
Last 12 months |
YTD Change |
|
Ghana |
GSECI |
252.3 |
333.8 |
605.4 |
139.9% |
81.3% |
|
Zambia |
LASILZ |
567.7 |
578.8 |
848.8 |
49.5% |
46.7% |
|
Kenya |
NASI |
0.8 |
1.0 |
1.2 |
41.1% |
24.3% |
|
South Africa |
JALSH |
4,383.5 |
4,502.1 |
5,424.8 |
23.8% |
20.5% |
|
Nigeria |
NGEASI |
66.2 |
67.5 |
77.8 |
17.6% |
15.3% |
|
Uganda |
USEASI |
0.3 |
0.3 |
0.4 |
28.9% |
13.7% |
|
Tanzania |
DARSDEI |
0.8 |
0.9 |
0.9 |
17.7% |
3.5% |
|
Rwanda |
RSEASI |
0.1 |
0.1 |
0.1 |
(5.7%) |
(2.5%) |
|
*The index values are dollarized for ease of comparison |
||||||
Source: Cytonn Research, Kwayisi, Yahoo Finance
The chart below shows the YTD performance of the Sub-Saharan Equities Market;
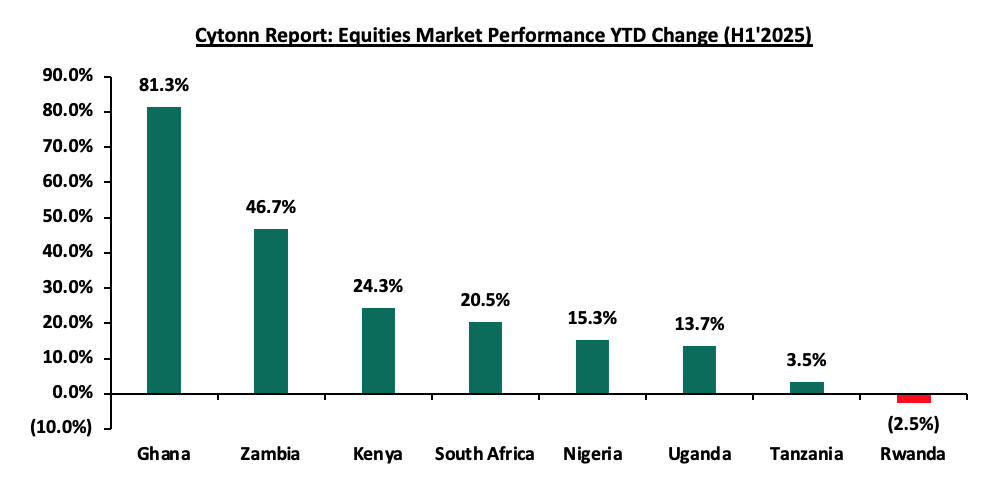
Dollarized performance
GDP growth in the Sub-Saharan Africa region is expected to improve, in contrast with the rest of the global economy. However, public debt continues to be a major headwind, with high debt levels experienced in the region on the back of continued weakening of local currencies, which will make debt servicing costlier, making the region less attractive to foreign capital.
According to the Kenya National Bureau of Statistics (KNBS) Q1'2025 Quarterly GDP Report, the Kenyan economy recorded a 4.9% growth in Q1’2025, unchanged from the growth rate recorded in Q1’2024. The main contributor to Kenyan GDP remains to be the Agriculture, fishing and forestry sector which grew by 6.0% in Q1’2025, higher than the 5.6% expansion recorded in Q1’2024. All sectors in Q1’2025 recorded positive growths, with varying magnitudes across activities. Most sectors recorded contraction in growth rates compared to Q1’2024 with Accommodation & Food Services, Financial Services Indirectly Measured and Professional Administration recording growth rate declines of 34.0%, 13.4% and 4.8% points to 4.1%, 9.0% and 4.6% from 38.1%, 15.4% and 9.4% respectively. Other sectors recorded an expansion in growth rates, from what was recorded in Q1’2024, with Mining and Quarrying, Taxes on products and Construction recording the highest growths in rates of 26.0%, 2.8% and 2.6% points, to 10.0%, 5.7% and 0.4% from (16.1%), 2.9% and 3.0% respectively. Notably, the overall economic performance highlighted a slight slowdown in momentum following tough operating environment characterized by the high costs of living, and the lower private sector credit growth. In 2025, the Kenyan economy is expected to rebound, returning to its growth path, with the average projected growth estimated at 5.0% by various organizations as outlined below:
|
Cytonn Report: Kenya 2025 Growth Projections |
||
|
No. |
Organization |
2025 GDP Projections |
|
1 |
International Monetary Fund |
4.8% |
|
2 |
National Treasury |
5.3% |
|
3 |
World Bank |
4.5% |
|
4 |
Fitch Solutions |
5.1% |
|
5 |
Cytonn Investments Management PLC |
5.4% |
|
Average |
5.0% |
|
Source: Cytonn Research
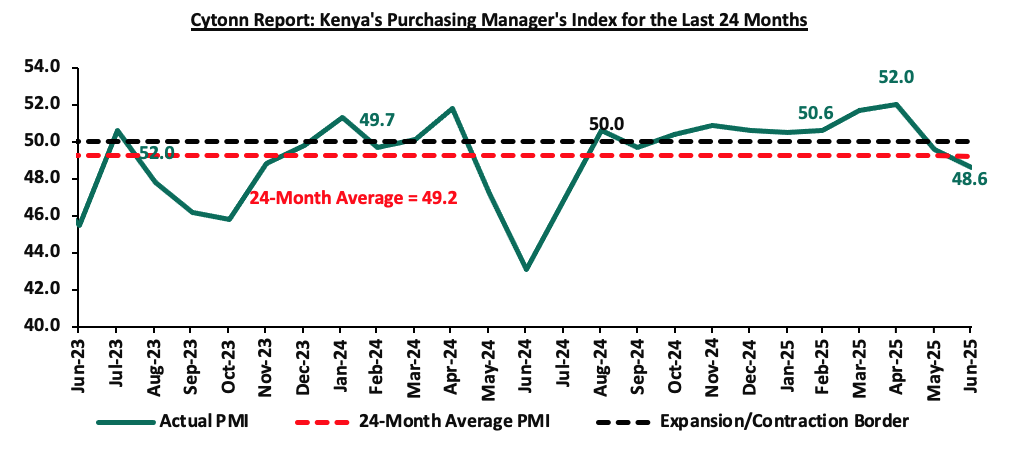
Key to note, Kenya’s general business environment improved slightly in the first half of 2025, with the average Purchasing Manager’s Index for the first six months of the year coming at 50.5, compared to 50.0 recorded in a similar period in 2024. The improvement was mainly on the back of a stronger and stable Shilling, coupled with eased inflation averaging at 3.7% in H1’2025, 1.6% points lower than the 5.6% average rate for H1’2024. Additionally, the easing monetary policy stance is expected to continue to reduce the cost of borrowing and increase spending therefore supporting business activity. The chart below summarizes the evolution of PMI over the last 24 months. (A reading above 50.0 signals an improvement in business conditions, while readings below 50.0 indicate a deterioration):
Stanbic Bank’s June 2025 Purchasing Manager’s Index (PMI)
During the week, Stanbic Bank released its monthly Purchasing Manager's Index (PMI) highlighting that the index for the month of June 2025 remained in the negative territory, coming in at 48.6, down from 49.6 in May 2025, marking a second consecutive month the index fell below the 50.0 neutral mark, signalling worsening in business conditions, mainly attributable to decreased output and new orders. On a year-to-year basis, the index recorded 1.4% points increase from the 47.2 recorded in June 2024, indicating a slight improvement in business conditions compared to the same period last year. The improvement was largely driven by a slower pace of decline in output and new orders, as some firms reported gains from new marketing strategies and client acquisition efforts. Input prices rose at the fastest rate in five months, mainly due to increased purchase prices and higher taxation, while output charges rose at their slowest pace since October 2024 as firms tried to limit price hikes to support demand.
In June, business output continued to contract, marking the second consecutive monthly decline, partly attributable to the political unrest and demonstrations that limited business activity. Around 34.0% of firms reported falling output, mainly in construction, retail and services, while agriculture and manufacturing continued to show relative resilience. New orders fell for the second consecutive month since September 2024, attributed to weaker customer demand and rising prices, though some businesses reported gains from new marketing and client acquisition efforts. Despite the downturn, inventory stockpiling and some sectoral resilience helped soften the impact.
Employment levels continued to rise marginally for the fifth consecutive month in June, supported by short-term hiring to fulfil existing orders. The employment index remained above the 50.0 mark, suggesting ongoing efforts by businesses to maintain capacity despite reduced output. Meanwhile, the Backlogs of Work Index dropped slightly below the 50.0-mark threshold, implying steady levels of unfinished work and no major accumulation of operational pressure.
Purchasing activity dipped slightly, marking one of the sharpest declines in eleven months, as firms scaled back orders in response to softening demand. Despite this, inventories grew for the sixth month running, with some firms preparing for anticipated future orders or hedging against possible input shortages.
Supplier delivery times continued to improve modestly, with vendors more responsive in securing payments and maintaining faster delivery cycles.
Input prices rose at the fastest pace in five months, largely due to higher material costs, taxes, and customs fees. The purchase price index also accelerated, with manufacturers particularly affected. Staff costs increased marginally, reaching the highest level since July 2023. However, with demand under pressure, most firms avoided aggressive pricing, resulting in a modest and slowing increase in output prices, the weakest pace in seven months.
Going forward, we anticipate that the business environment will improve in the short to medium term as a result of the anticipated improvement in the economic environment driven by lower interest rates following the easing monetary policy with the CBR decreasing by 25.0 bps to 9.75% in June 2025 from 10.00%, the stability of the Kenyan Shilling against the USD, the low inflation rates currently at 3.8% and stable fuel prices. However, we expect businesses to be weighed down by the ongoing political unrest and demonstrations, high cost of living coupled with the high taxation, which are set to limit business activity and increase input costs.
Inflation:
The average inflation rate decreased to 3.7% in H1’2025, compared to 5.6% in H1’2024, attributable to a stronger and stable Shilling, leading to reduced fuel prices. Notably, fuel prices of Super petrol, Diesel, and Kerosene decreased by 6.6%, 5.9% and 9.9% in June 2025 to Kshs 177.3 Kshs 162.9 and Kshs 146.9, from Kshs 189.8, Kshs 173.1, and Kshs 163.1 per litre in June 2024 respectively. Inflation for the month of June 2025 remained unchanged at 3.8% recorded in May 2025, mainly driven by a 1.0% increase in the food and non-alcoholic beverages index which was offset by the 0.1% decrease in the housing, water, electricity, gas and other fuels index. Below is a chart showing the inflation trend for the last five years:
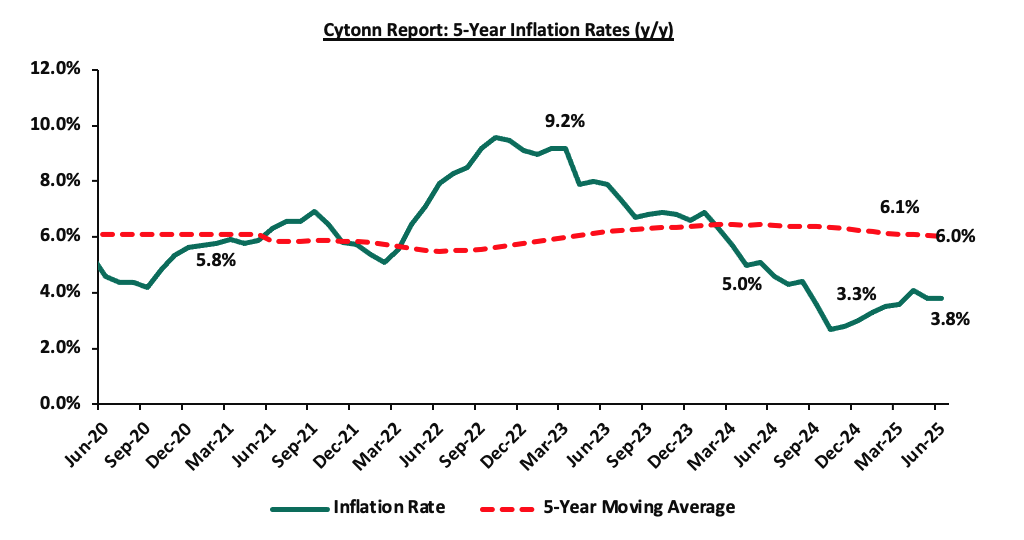
For the last 24 months, Kenya’s inflation has persistently remained within the Central Bank of Kenya (CBK) target range of 2.5% - 7.5%, owing to a stronger Shilling, reduced fuel and electricity prices. With the continued easing of monetary policy following the MPC’s observation that its earlier measures had stabilized the Shilling and anchored inflation, the focus has now shifted to lowering borrowing costs, supporting the private sector, and promoting economic growth. As a result, we expect this to exert upward pressure on inflation. The Monetary Policy Committee (MPC) has lowered the Central Bank Rate (CBR) by cumulative of 325 bps since August 2024, to 9.75% in June 2025 from 13.00%, 2024. Going forward, we still expect the inflationary pressures to remain within the CBK’s preferred target range of 2.5% - 7.5%.
June 2025 Inflation
The y/y inflation in June 2025 remained unchanged at 3.8%, maintaining the same rate recorded in May 2025. The headline inflation was mainly driven by increases in prices of commodities in the following categories: Food & Non-Alcoholic Beverages at 6.6%, Transport at 3.2%, and Housing, Water, Electricity, Gas and Other Fuels at 0.2%. The table below shows a summary of both the year on year and month on month commodity indices performance:
|
Cytonn Report: Major Inflation Changes – June 2025 |
|||
|
Broad Commodity Group |
Price change m/m (June-2025/ May -2025) |
Price change y/y (June-2025/June-2024) |
Reason |
|
Food and non-alcoholic beverages |
1.0% |
6.6% |
The m/m increase was mainly driven by higher prices of carrots, cabbages and sugar which rose by 11.1%, 10.8% and 5.5% respectively. However, the overall increase was moderated by declines in the prices of cooking salad oil, fresh unpacked cow milk and Irish potatoes, which dropped by 0.4%, 0.4%, and 0.2% respectively. |
|
Transport |
0.7% |
3.2% |
The transport sector recorded 0.7% price increase on a m/m basis. Petrol prices, personal vehicle operating costs and country bus fares increased by 1.6%, 1.2% and 1.0% respectively. City bus and regular matatu fares registered slight upticks of 0.2% each. However, the decline in diesel prices by 1.1% helped ease some of the pressure on fuel-related transport costs. |
|
Housing, water, electricity, gas and other fuels |
(0.1%) |
0.2% |
The m/m performance was mainly driven by the decrease in electricity costs, recording notable declines of 1.6% for a 50kWh unit and 1.5% for a 200kWh unit. Additionally, the price of gas/LPG and kerosene dropped by 0.2% and 1.2% respectively. |
|
Overall Inflation |
0.5% |
3.8% |
The m/m increase was majorly attributable to the 1.0% increase in food and non-alcoholic beverages |
In June 2025, overall inflation remained unchanged at 3.8% on y/y basis, indicating relative price stability across key sectors. This marked the twenty-fourth consecutive month that inflation remained within the Central Bank of Kenya’s preferred range of 2.5%–7.5%. The stability was supported by minimal changes in fuel prices, Petrol recorded a slight increase of 1.6%, while Diesel prices declined by 1.1% helping ease pressure on transport and energy-related costs. The Kenya Shilling also remained stable during the month of June at 129.2 against the dollar and recorded a 5.5 bps year-to-date gain to Kshs 129.2 as of 30th June, 2025, from the Kshs 129.3 recorded at the beginning of the year. This stabilization in the exchange rate and fuel prices is expected to continue anchoring inflationary pressures in the country remaining within the CBK’s preferred range of 2.5%-7.5%. However, the reduction in the CBR to 9.75% from 10.00% is likely to increase the money supply through lower borrowing costs, which may cause a gradual rise in inflation rates as the effects of the CBR gradually take hold in the broader economy.
Going forward, we expect inflation to remain within the CBK’s preferred range of 2.5%-7.5%, mainly on the back of a stable currency and stable fuel prices. Additionally, favourable weather conditions will also contribute to stabilizing food prices, further supporting stable inflation rates. The risk, however, lies in the fuel prices which despite their stability, still remain elevated compared to historical levels. Additionally, the progressive cuts in the CBR are likely to elevate inflationary pressures gradually as consumer spending rises from increased money supply. The committee is expected to lower rates further, though gradually, to provide further support for the economy.
The Kenyan Shilling:
The Kenyan Shilling remained stable against the US Dollar, gaining slightly by 5.5 bps in H1’2025, to close at Kshs 129.2, from Kshs 129.3 as at the beginning of the year, mainly attributable to the improved forex reserves during the period which increased by 20.6% to USD 11.1 bn as of 4th July 2025 from USD 9.2 bn recorded at the start of 2025. Additionally, the Eurobond buyback program of the USD 900.0mn tranche maturing in 2027 in February 2025 alleviated the credit risk on the country, increasing dollar supply in the market. Additionally, during the week, the Kenya Shilling appreciated slightly against the US Dollar by 1.2 bps to close at 129.2 from 129.3 recorded the previous week.
We expect the shilling to be supported by:
- Diaspora remittances standing at a cumulative USD 5,033.0 mn in the twelve months to May 2025, 11.6% higher than the USD 4,510.0 mn recorded over the same period in 2024. These has continued to cushion the shilling against further depreciation. In the May 2025 diaspora remittances figures, North America remained the largest source of remittances to Kenya accounting for 57.0% in the period,
- High Forex reserves currently at USD 11.1 bn (equivalent to 4.9-months of import cover), which is above the statutory requirement of maintaining at least 4.0-months of import cover and above the EAC region’s convergence criteria of 4.5-months of import cover, and,
- The tourism inflow receipts which came in at Kshs 452.2 bn in 2024, a 19.8% increase from Kshs 377.5 bn inflow receipts recorded in 2023, and owing to tourist arrivals that improved by 8.0% to 2,303,028 in the 12 months to February 2025 from 2,133,612 in the 12 months to February 2024
The shilling is however expected to remain under pressure in 2024 as a result of:
- An ever-present current account deficit which came at 1.8% of GDP in the twelve months to April 2025, and,
- The need for government debt servicing, continues to put pressure on forex reserves given that 62.0% of Kenya’s external debt is US Dollar-denominated as of December 2024.
Monetary Policy:
The Monetary Policy Committee (MPC) met three times in H1’2025 and lowered the Central Bank Rate (CBR) in all three meetings, owing to the sustained stability of the Kenyan Shilling, anchored inflationary pressures and a dire need to support the economy. The Committee noted that economic growth slowed in 2024, creating room for further easing of monetary policy to support economic activity while maintaining exchange rate stability. in the country on the back of high fuel and commodity prices. The MPC lowered the CBR rate by 25.0 bps to 9.75%, from 10.00% in June 2025 against a backdrop of elevated uncertainties to the global outlook for growth, lower but sticky inflation in advanced economies heightened trade tensions as well as persistent geopolitical tensions. Below are some of the key highlights from the June 2025 meeting:
- The overall inflation decreased by 0.3% points to 3.8% in May 2025, from 4.1% in April 2025, remaining below the mid-point of the preferred CBK range of 2.5%-7.5%. Core inflation increased to 2.8% in May 2025, from 2.5% in April, reflecting increasing demand pressures in the economy. This increase was largely attributed to higher prices of processed foods, particularly sugar and maize flour. Conversely, non-core inflation decreased to 6.0% in May 2025, from 8.4% in April, driven by lower prices of food crops, especially vegetables, due to seasonal factors. Lower energy and utilities costs, including reduced electricity and fuel prices, continued to help moderate non-core inflation. Overall inflation is expected to stay below the mid-point of the target range in the near term, supported by low and stable core inflation, an anticipated reduction in energy prices, and a stable exchange rate.
- The recently released Economic Survey 2025, for 2024 showed a slowdown in the performance of the Kenyan economy, with real GDP growing by 4.7%, although slower than the growth of 5.7% recorded in 2023. This was attributable to deceleration in growth in most sectors of the economy. The economy is expected to continue to strengthen in 2025 with real GDP growth projected at 5.2%, from the 4.7% growth recorded in 2024 supported by resilient services sector and agriculture, expected recovery in growth of credit to the private sector and enhanced exports. However, this positive outlook is tempered by potential domestic and external risks.
- The Kenya National Bureau of Statistics (KNBS) updated the balance of payments data to better capture cross-border transactions, especially those involving petroleum imports and re-exports under government-to-government deals. The revisions also include the use of alternative data sources to enhance accuracy in reporting international trade in services, notably travel and financial services. These adjustments refine the recording of regional oil product re-exports and international travel earnings.
- Based on the revised balance of payments data goods exports increased by 3.8% in the 12 months to April 2025, compared to 2024, reflecting a rise in exports of agricultural commodities, especially horticulture and coffee. Goods imports rose by 7.6% reflecting increases in intermediate and capital goods imports. The current account deficit in 12 months to April 2025 is estimated at 1.8% of GDP, down from 2.2% in similar period in 2024, driven by stronger goods exports and robust diaspora remittance inflows. The current account deficit was fully financed by capital and financial inflows, leading to an overall balance of payments surplus of USD 2,104.0 mn. For 2025, the current account deficit is projected at 1.5% of GDP, up from 1.3% in 2024 and is expected to be fully financed by capital and financial inflows, yielding a balance of payments surplus of USD 1,107.0 mn.
- The CBK foreign exchange reserves, which currently stand at USD 10,946.0 representing 4.8 months of import cover, continue to provide adequate cover and a buffer against any short-term shocks in the foreign exchange market,
- The banking sector remains stable and resilient, with strong liquidity and capital adequacy ratios. The ratio of gross non-performing loans (NPLs) to gross loans increased to 17.6% in April 2025 compared to 17.2% in February 2025. Increases in NPLs were noted in the trade, personal and household, tourism and hotels, and building and construction sectors. Banks have continued to make adequate provisions for the NPLs,
- The CEOs Survey and Market Perceptions Survey conducted ahead of the MPC meeting revealed sustained optimism about business activity and economic growth prospects for the next 12 months. The optimism was attributed to the stable macroeconomic environment reflected in the low inflation rate and stability in the exchange rate, expectations of a decline in interest rates and favorable weather conditions supporting agriculture. Nevertheless, respondents expressed concerns about high cost of doing business and subdued consumer demand,
- The Survey of the Agriculture Sector for May 2025 revealed an expectation for moderate downward pressure on overall headline inflation in the next three months, on account of expected stability in food prices attributed to favorable weather conditions, stability in pump prices and the stable exchange rate,
- Global economic growth showed steady recovery in 2024 coming in at 3.3%. However, the outlook for 2025 is projected to decline to 2.8%, particularly for the United States and China, due to the impact of increased U.S. import tariffs and retaliatory measures imposed by other trading partners, as well as escalating geopolitical risks, particularly ongoing conflicts in the Middle East and the Russia-Ukraine war, which continue to threaten global growth prospects,
- Global headline inflation has eased, though uncertainty persists due to the potential inflationary effects of rising import tariffs. Central banks in advanced economies have continued to cut interest rates, albeit cautiously. International oil prices have declined amid higher production and weak demand mainly from China, yet volatility risks remain elevated due to trade tensions and ongoing geopolitical conflicts. Food inflation has also eased, largely due to lower prices of cereals and sugar, although inflation in edible oil prices remains high.
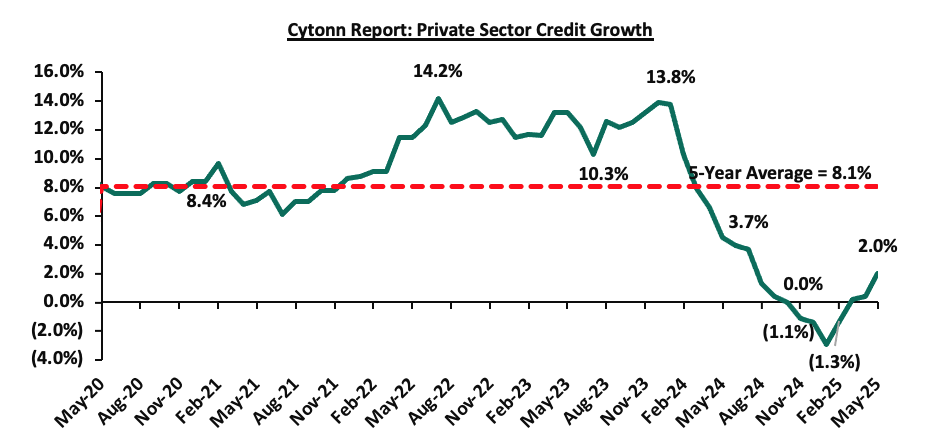
- Growth in private sector credit grew by 1.6% in May 2025 from 0.4% in April and a contraction of 2.9% in January 2025, mainly attributed to the dissipation of exchange rate valuation effects on foreign currency-denominated loans due to the appreciation of the Shilling and increased demand attributable to declining lending interest rates. Average commercial banks’ lending rates declined to 15.4% in May from 15.7% in April 2025 and 17.2% in November 2024.
- The Committee acknowledged the ongoing implementation of the FY’2024/25 Supplementary Budget II and the proposed Budget for FY’2025/26. These measures are anticipated to further support fiscal consolidation, which should reduce debt vulnerabilities in the medium-term.
The MPC noted that overall inflation is expected to remain below the midpoint of the 2.5%-7.5% target range in the near term, supported by stable core inflation, low energy prices, and exchange rate stability. Additionally, central banks in major economies have continued to lower interest rates at a cautious pace. The Committee also noted that economic growth slowed in 2024, creating room for further easing of monetary policy to support economic activity while maintaining exchange rate stability. The MPC noted that it will continue to monitor the effects of these policy measures, as well as global and domestic economic developments, and will remain ready to take additional action if necessary. Going forward, we expect the MPC to adopt a more cautious approach to rate adjustments in the coming meetings in a bid to continue supporting the private sector, while also keeping an eye on the effect on the inflation and exchange rate. The next MPC meeting is scheduled for August 2025.
Fiscal Policy:
The total Kenyan budget for the FY’2025/2026 National Budget increased by 7.1% to Kshs 4.3 tn from the Kshs 4.0 tn in FY’2024/2025 while the total revenue inclusive of grants increased by 8.0% to Kshs 3.4 tn from the Kshs 3.1 tn in FY’2024/2025. The expenditure will be funded by revenue collections of Kshs 3.4 tn and borrowings amounting to Kshs 923.2 bn. Of the Kshs 923.2 bn total borrowing, Kshs 635.5 bn is estimated to be domestic while Kshs 287.7 bn is estimated to be net foreign borrowing.
The increase in revenues is mainly due to an 6.7% increase in ordinary revenue to Kshs 2.8 tn for FY’2025/2026, from the Kshs 2.6 tn in FY’2024/2025 with the increase largely dependent on the effectiveness of the Kenya Revenue Authority in collecting taxes as well as an increase in some of the existing taxes to meet its revenue target. The government’s efforts have seemingly resulted in improved revenue collection as evidenced by 93.2% of the revenue targets in FY’2023/24, and having attained 91.2% of the prorated revenue numbers for FY’2024/25 as of end May 2025. However, there are still concerns about the government's ability to meet its revenue collection targets in FY’2025/2026 mainly on the back of the current operating environment with the high cost of living and the political unrest in the country.
The table below summarizes the key buckets and the projected changes:
|
Amounts in Kshs billions unless stated otherwise |
|||
|
Cytonn Report: Comparison between FY’2024/2025 and FY’2025/2026 Budgets Estimates |
|||
|
Item |
FY'2024/25 Supplementary Budget II |
FY'2025/26 Estimates |
Change y/y (%) |
|
Ordinary Revenue |
2,580.9 |
2,754.7 |
6.7% |
|
Ministerial Appropriation-in-Aid |
486.8 |
567.0 |
16.5% |
|
Total grants |
52.6 |
46.9 |
(10.8%) |
|
Total Revenue & Grants |
3,120.3 |
3,368.6 |
8.0% |
|
Recurrent expenditure |
1,705.7 |
1,805.0 |
5.8% |
|
Recurrent Consolidated Funds Services (CFS) |
1,242.7 |
1,337.3 |
7.6% |
|
Development expenditure |
624.7 |
693.2 |
13.0% |
|
County Transfer & Contingencies |
445.6 |
474.9 |
6.6% |
|
Total expenditure |
4,007.5 |
4,291.9 |
7.1% |
|
Fiscal deficit inclusive of grants |
(887.2) |
(923.3) |
4.1% |
|
Projected Deficit as % of GDP |
(5.1%) |
(4.8%) |
(0.3%) pts |
|
Net foreign borrowing |
281.5 |
287.7 |
2.2% |
|
Net domestic borrowing |
605.7 |
635.5 |
4.9% |
|
Total borrowing |
887.2 |
923.2 |
4.1% |
Source: National Treasury of Kenya, www.parliament.go.ke
For the FY’2024/2025, we do not expect the government to meet its revenue collection target having collected Kshs 2,157.8 bn, equivalent to 83.6% of the revised estimates of Kshs 2,580.9 bn for FY’2024/2025 and 91.2% of the prorated estimates of Kshs 2,365.8 bn in the eleven months of FY’2024/2025. Notably, the total expenditure amounted to Kshs 3,519.2 bn, equivalent to 78.6% of the revised estimates of Kshs 4,474.9 bn, and 85.8% of the prorated expenditure estimates of Kshs 4,102.0 bn, an indication of modest spending by the government. The total borrowings as at the end of May 2025 amounted to Kshs 1,359.0 bn, equivalent to 72.1% of the revised estimates of Kshs 1,885.4 bn and 78.6% of the prorated estimates of Kshs 1,728.3 bn.
Going forward, we believe that the persistent fiscal deficit owing to lower revenues relative to expenditure will force the government to borrow more. We therefore expect the government to cut on its expenditure, mostly the development expenditure in order to finance the growing debt maturities and the ballooning recurrent expenditure.
Money Markets, T-Bills Primary Auction:
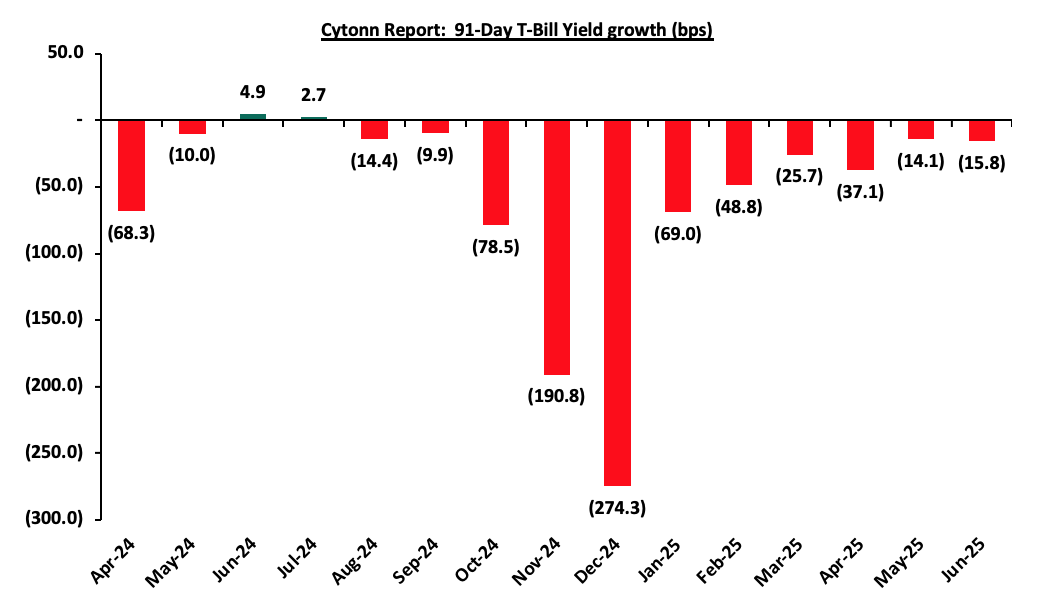
During H1’2025, T-bills were oversubscribed, with the overall subscription rate coming in at 154.5%, up from 132.6% in H1’2024. Investors’ preference for the 91-day paper persisted with the paper receiving bids worth Kshs 233.7 bn against the offered Kshs 104.0 bn, translating to an oversubscription rate of 224.8%, albeit lower than the oversubscription rate of 404.4% recorded in H1’2024. Overall subscription rates for the 364-day and 182-day papers came in at 191.6% and 89.3% respectively, higher than the 80.7% and 75.7%, respectively, recorded in H1’2024. The average yields on the 364-day, 182-day, and 91-day papers decreased by 6.2% points, 7.5% points, and 7.4% points to 10.4%, 9.1%, and 8.8% in H1’2025, respectively, from 16.7%, 16.6%, and 16.2%, respectively, in H1’2024. The downward trajectory in yields is primarily driven by improved investor confidence, stemming from reduced credit risk in the country and eased inflationary pressures. This has lowered the risk premium demanded by investors. Despite the government's sustained domestic borrowing, strong demand for government securities has supported the decline in yields. During the period, the acceptance rate stood at 85.4%, down from 92.3% in H1’2024, with the government accepting Kshs 823.2 billion out of the Kshs 964.0 billion worth of bids received. The chart below shows the yield growth rate for the 91-day paper during the year:
During the week, T-bills were undersubscribed for the second consecutive week, with the overall subscription rate coming in at 90.9%, higher than the subscription rate of 60.4% recorded the previous week. Investors’ preference for the shorter 91-day paper waned, with the paper receiving bids worth Kshs 2.7 bn against the offered Kshs 4.0 bn, translating to a subscription rate of 67.4%, higher than the subscription rate of 36.2%, recorded the previous week. The subscription rates for the 182-day paper increased to 111.7% from the 12.0% recorded the previous week, while the 364-day paper decreased to 79.6% from the 118.4% recorded the previous week. The government accepted a total of Kshs 21.77 bn worth of bids out of Kshs 21.83 bn bids received, translating to an acceptance rate of 99.7%. The yields on the government papers registered a mixed performance with the yields on the 91-day paper increasing by 0.7 bps to 8.15% from the 8.14% recorded the previous week, while the yields on the 182-day and 364-day papers decreased by 1.1 bps and 0.9 bps to 8.45% and 9.71%, from the 8.46% and 9.72% respectively recorded the previous week
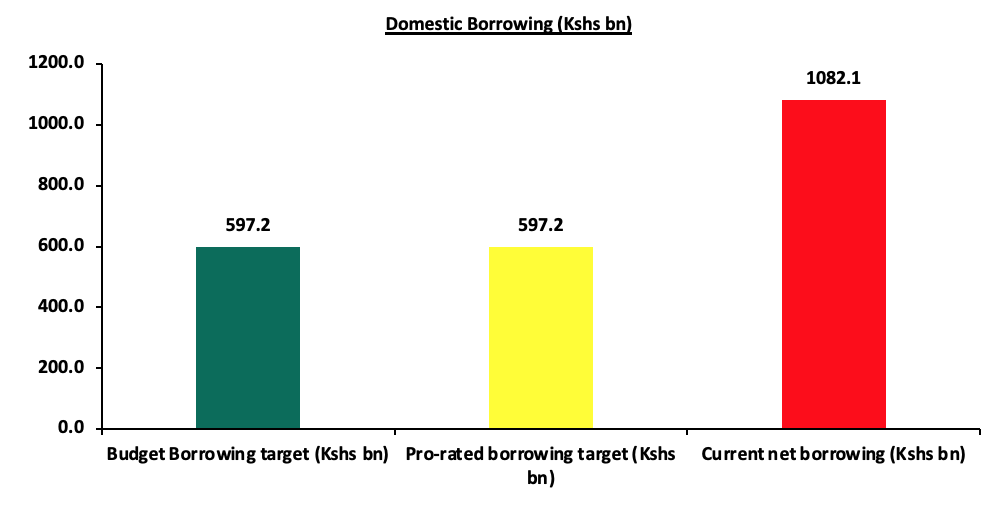
The government closed FY’2024/25, having advertised government securities totalling Kshs 1,887.0 bn. The government accepted bids worth Kshs 2,380.8 bn, of which Kshs 1,567.0 bn treasury bills and Kshs 813.8 bn were bonds. Total redemptions in FY’2024/25 amounted to Kshs 1,298.7 bn, with treasury bills accounting for Kshs 1,249.7 bn and bonds accounting for Kshs 49.0 bn. As a result, the government had a net domestic borrowing of Kshs 1,082.1 bn in FY’2024/25, with the government closing the year 81.2% ahead its net domestic borrowing target of Kshs 597.2 bn. The chart below shows the government’s domestic borrowing as at the end of FY’2023/24:
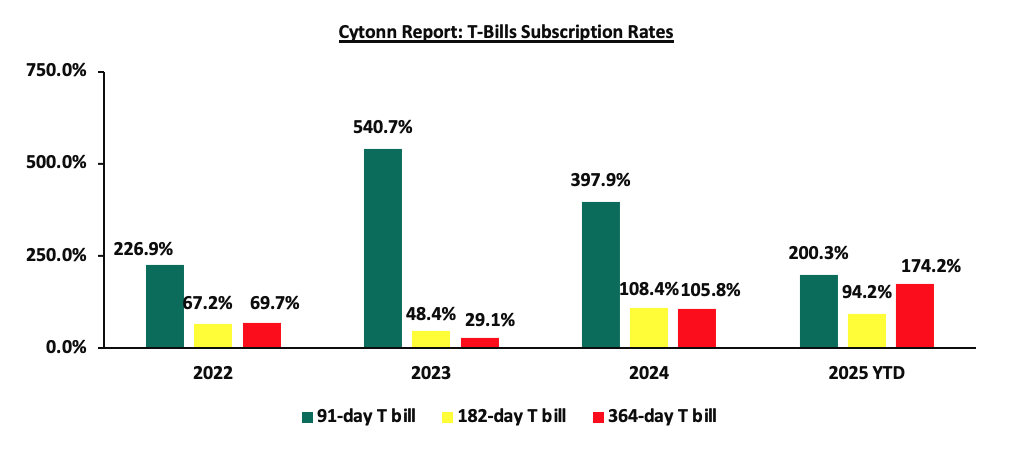
The chart below compares the overall average T-bills subscription rates obtained in 2022, 2023,2024 and 2025 Year to Date (YTD):
Primary T-Bond Auctions in H1’2025
During H1’2025, the Government did not issue any new treasury or infrastructure bonds, it however reopened thirteen, and issued one bond on tap-sale, seeking to raise Kshs 335.0 bn. The bonds were generally oversubscribed, receiving total bids worth Kshs 691.7 bn translating to an overall subscription rate of 206.5%. Importantly, there was a notable shift towards offering longer-dated bonds, aligning with the government’s objective of lengthening the maturity profile of public debt and reducing refinancing risk. The government rejected expensive bids and only accepted bids worth Kshs 464.1 bn, out of the Kshs 691.7 bn of bids received, translating to an acceptance rate of 67.1%. The table below provides more details on the bonds issued during the period:
|
Cytonn Report: H1’2025 Kenya Bond Issuances |
|||||||||
|
Issue Date |
Bond Auctioned |
Effective Tenor to Maturity (Years) |
Coupon |
Amount offered (Kshs bn) |
Actual Amount Raised (Kshs bn) |
Total bids received |
Average Accepted Yield |
Subscription Rate |
Acceptance Rate |
|
23/06/2025 |
FXD1/2020/015-Reopened |
9.7 |
12.8% |
50.0 |
57.9 |
84.7 |
13.5% |
202.7% |
68.3% |
|
SDB1/2011/030-Reopened |
15.7 |
12.0% |
13.8 |
16.6 |
14.0% |
82.8% |
|||
|
12/05/2025
|
FXD1/2012/20- Reopened
|
7.6 |
12.0% |
30.0 |
43.5 |
54.4 |
13.6% |
181.3% |
80.0% |
|
05/05/2025
|
FXD1/2022/025 - Reopened
|
22.5 |
14.2% |
50.0 |
25.1 |
30.7 |
14.5% |
114.2% |
81.8% |
|
FXD1/2022/015 -Reopened |
12.0 |
13.9% |
25.3 |
26.4 |
13.9% |
95.7% |
|||
|
14/04/2025
|
FXD1/2020/015-Tapsale
|
9.9
|
12.8% |
10.0 |
12.6 |
13.2 |
13.7% |
132.4% |
95.1% |
|
07/04/2025
|
FXD1/2022/025 - Reopened |
22.6 |
14.2% |
70.0 |
32.5 |
32.7 |
14.2% |
102.5% |
99.5% |
|
FXD1/2022/015 -Reopened
|
12.1 |
13.9% |
18.0 |
18.1 |
13.8% |
99.1% |
|||
|
FXD1/2020/015-Reopened |
9.9 |
12.8% |
20.9 |
20.9 |
13.7% |
99.9% |
|||
|
10/03/2025
|
FXD1/2018/025 - Reopened
|
18.3 |
13.4% |
25.0 |
35.2 |
47.0 |
13.8% |
188.0% |
75.0% |
|
17/02/2025
|
IFB1/2022/014 - Reopened
|
11.8 |
13.9% |
70.0 |
65.3 |
93.1 |
14.0% |
411.3% |
45.4% |
|
IFB1/2023/017 - Reopened |
15.1 |
14.4% |
65.6 |
100.8 |
14.3% |
||||
|
20/01/2025
|
FXD1/2022/025 -Reopened
|
22.8 |
14.2% |
30.0 |
24.7 |
28.4 |
15.7% |
196.7% |
87.0% |
|
FXD1/2018/015-Reopened |
8.3 |
12.7% |
23.8 |
30.6 |
14.2% |
77.7% |
|||
|
H1'2025 Total |
|
|
335.0 |
464.1 |
691.7 |
|
|
|
|
|
H1’2024 Total |
|
|
385.0 |
518.2 |
657.5 |
|
|
|
|
|
H1'2025 Average |
14.6 |
13.4% |
|
|
|
14.1% |
206.5% |
67.1% |
|
|
H1'2024 Average |
6.2 |
17.1% |
|
|
|
17.6% |
170.8% |
78.8% |
|
Also, during the period, the government announced its first-ever domestic treasury bond buyback in February, aiming to buyback Kshs 50.0 bn of Kshs 185.1 bn for the FXD1/2020/005, FXD1/2022/003 and IFB1/2016/009 with tenors to maturity of 0.4 years, 0.3 years and 0.4 years respectively, and fixed coupon rates of 11.7%, 11.8% and 12.5% respectively. The total outstanding amounts for the FXD1/2020/005, FXD1/2022/003 and IFB1/2016/009 were Kshs 104.5 bn, Kshs 60.6 bn and Kshs 19.9 bn each respectively. The offer was oversubscribed, with the overall subscription rate coming in at 112.2%, receiving bids worth Kshs 56.1 bn against the offered Kshs 50.0 bn. The government accepted bids worth Kshs 50.1 bn, translating to an acceptance rate of 89.3%, and equivalent to 27.1% of the total outstanding amount of Kshs 185.1 bn for the three bonds. The weighted average yield for the accepted bids for the FXD1/2022/003, FXD1/2020/005 and IFB1/2016/009 came in at 9.1%, 8.9% and 9.1% respectively.
Secondary Bond Market Activity:
- Bond Turnover:
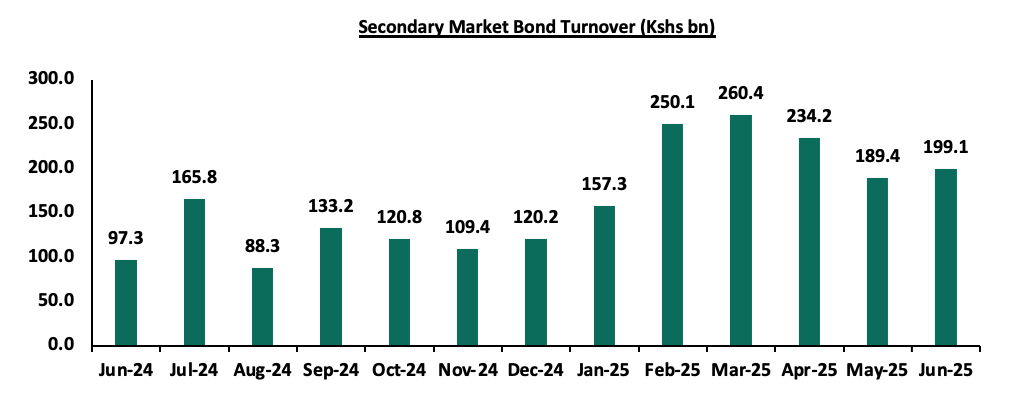
The secondary bond market recorded increased activity, with the total bond turnover increasing by 68.0% to Kshs 1,290.5 bn from Kshs 768.2 bn in H1’2024, pointing towards increased activities by commercial banks in the secondary bond market. Similarly, on a year-on-year basis, the bond turnover increased significantly by 104.7% to Kshs 199.1 in June 2025, from Kshs 97.3 bn worth of treasury bonds transacted over a similar period last year. The chart below shows the bond turnover over the past 12 months;
- Yield Curve:
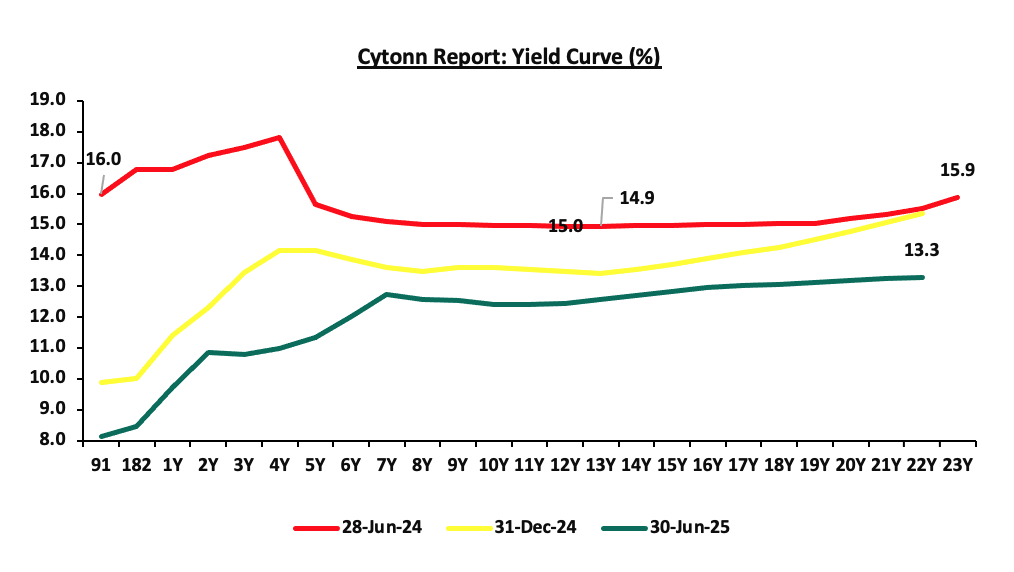
During H1’2025, yields on the government securities were on a downward trajectory compared to the same period in 2024. This was primarily driven by continued effort by the government to reject highly priced bids, local currency stabilization, and eased inflation. These factors reduced the need for investors to demand higher yields as compensation for inflation and currency depreciation risks, resulting in an overall decline across the yield curve. Notably, the yield curve has adjusted from a humped yield curve observed in 2023 and most part of 2024, towards a normal upward sloping curve, with long-term bonds registering highest yields. The shift in sentiment indicates increased confidence in the economic landscape. The chart below shows the yield curve movement during the period:
Money Market Performance
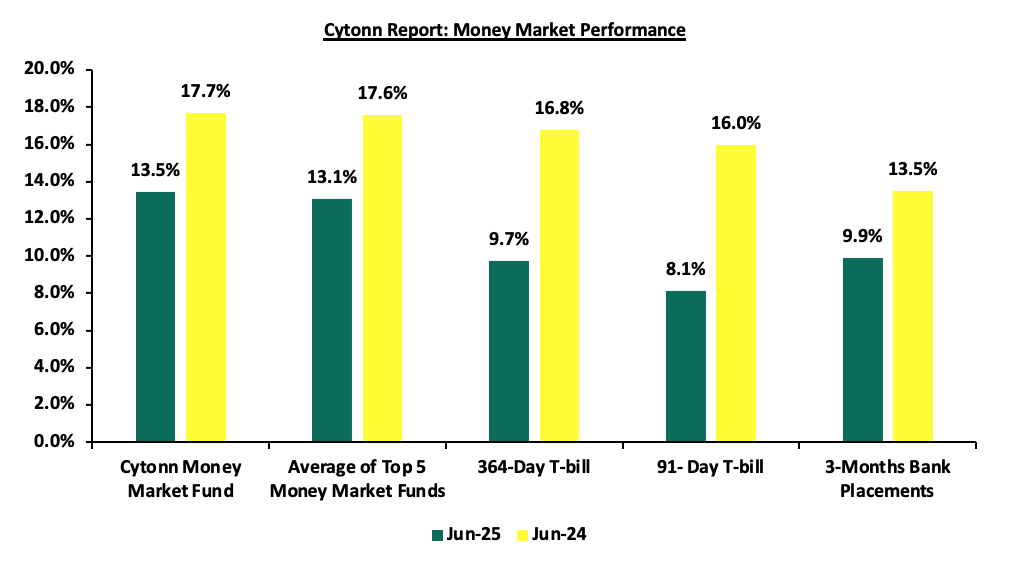
The 3-month bank placements recorded 9.9% at the end of H1’2025, 3.6% points lower than the 13.5% recorded at the end of H1’2024 (based on what we have been offered by various banks). The 91-day T-bill rate decreased by 7.8% points to 8.1% at the end of H1’2025 from 16.0% at the end of H1’2024, and the average Top 5 Money Market Funds decreased by 4.5% points to 13.1%, from 17.6% at the end of H1’2024. The yield on the Cytonn Money Market (CMMF) decreased by 4.2% points to 13.5% at the end of H1’2025, from 17.7% recorded at the end of H1’2024.
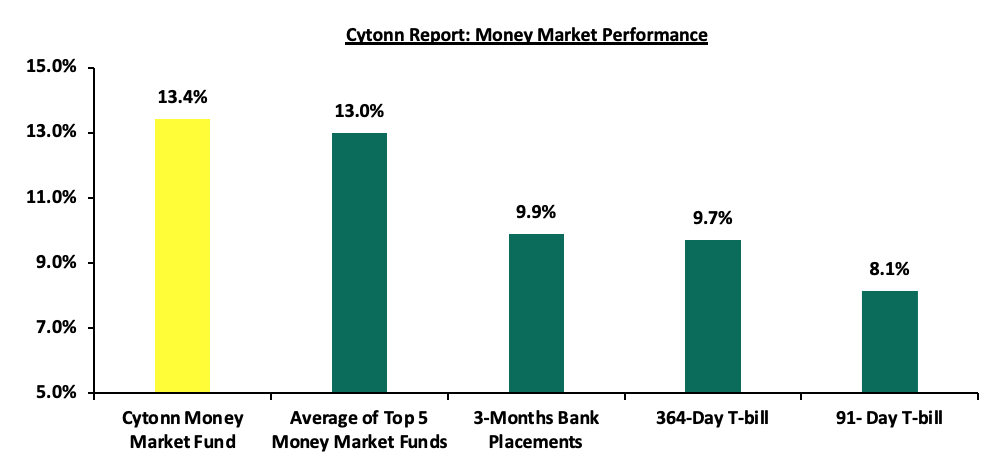
During the week, in the money markets, 3-month bank placements ended the week at 9.9% (based on what we have been offered by various banks), and the yields on the government papers registered a mixed performance with the yields on the 91-day paper increasing by 0.7 bps to 8.15% from the 8.14% recorded the previous week while the yields on the 364-day papers decreased by 0.9 bps to 9.71%, from the 9.72% recorded the previous week. The yields on the Cytonn Money Market Fund decreased by 3.0 bps to 13.4% from the 13.5% recorded the previous week, while the average yields on the Top 5 Money Market Funds decreased by 8.2 bps to 13.0% from the 13.1% recorded the previous week
The table below shows the Money Market Fund Yields for Kenyan Fund Managers as published on 4th July 2025:
|
Cytonn Report: Money Market Fund Yield for Fund Managers as published on 4th Juy 2025 |
||
|
Rank |
Fund Manager |
Effective Annual Rate |
|
1. |
Cytonn Money Market Fund ( Dial *809# or download Cytonn App) |
13.4% |
|
2. |
Gulfcap Money Market Fund |
13.1% |
|
3. |
Ndovu Money Market Fund |
13.1% |
|
4. |
Lofty-Corban Money Market Fund |
12.8% |
|
5. |
Kuza Money Market fund |
12.7% |
|
6. |
Etica Money Market Fund |
12.5% |
|
7. |
GenAfrica Money Market Fund |
12.0% |
|
8. |
Nabo Africa Money Market Fund |
11.9% |
|
9 |
Arvocap Money Market Fund |
11.6% |
|
10. |
Jubilee Money Market Fund |
11.2% |
|
11. |
Enwealth Money Market Fund |
11.1% |
|
12. |
Old Mutual Money Market Fund |
11.1% |
|
13. |
Madison Money Market Fund |
11.1% |
|
14. |
British-American Money Market Fund |
10.9% |
|
15. |
Faulu Money Market Fund |
10.5% |
|
16. |
Apollo Money Market Fund |
10.4% |
|
17. |
Sanlam Money Market Fund |
10.3% |
|
18. |
Orient Kasha Money Market Fund |
10.1% |
|
19. |
KCB Money Market Fund |
10.1% |
|
20. |
Dry Associates Money Market Fund |
10.1% |
|
21. |
Genghis Money Market Fund |
9.9% |
|
22. |
Absa Shilling Money Market Fund |
9.6% |
|
23. |
Mali Money Market Fund |
9.5% |
|
24. |
Co-op Money Market Fund |
9.4% |
|
25. |
ICEA Lion Money Market Fund |
9.4% |
|
26. |
CIC Money Market Fund |
9.4% |
|
27. |
Mayfair Money Market Fund |
9.0% |
|
28. |
AA Kenya Shillings Fund |
8.4% |
|
29. |
Ziidi Money Market Fund |
8.0% |
|
30. |
Stanbic Money Market Fund |
7.2% |
|
31. |
Equity Money Market Fund |
7.1% |
Source: Business Daily
Liquidity:
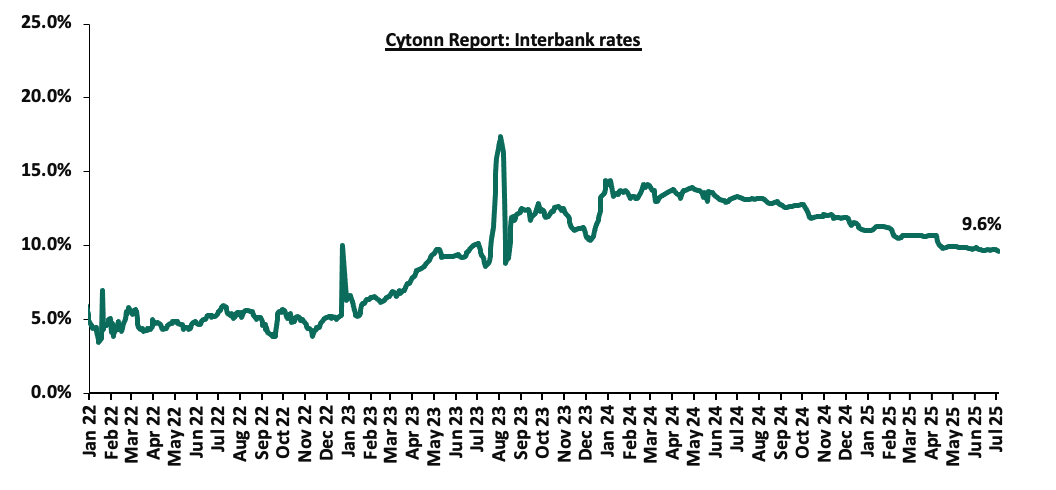
In H1’2025, liquidity in the money markets eased, as evidenced by the decrease in the interbank rate to 10.4%, from 13.5% H1’2024, partly attributable to government payments that offset tax remittances. Additionally, the average volumes traded in the interbank market decreased by 31.9% to Kshs 15.7 bn, from Kshs 23.0 bn recorded in H1’2024.
Similarly, during the week, liquidity in the money markets marginally eased, with the average interbank rate decreasing by 4.2 bps to remain relatively unchanged from the 9.7% recorded the previous week, partly attributable to government payments that offset tax remittances. The average interbank volumes traded decreased by 78.5% to Kshs 5.0 bn from Kshs 23.0 bn recorded the previous week. The chart below shows the interbank rates in the market over the years
Kenya Eurobonds:
During H1’2025, the yields on Eurobonds registered a mixed performance, with the yield on the 10-Year Eurobond issued in 2018 decreasing the most by 0.8% points to 8.3% from 9.1% recorded at the beginning of the year, while the yields on the 30-year Eurobond issued in 2018 gained the most by 0.2% points to 10.5% from 10.3% recorded at the beginning of the year. On a year-on-year basis, the yields on all Eurobonds were on a downward trend, with the yield on the 10-year Eurobond issued in 2018 declining the most by 2.1% points to 8.3% from 10.4% recorded at the end of H1’2024.
During the week, the yields on Eurobonds were on a downward trajectory, with the yield on the 7-Year Eurobond issued in 2024 decreasing the most by 30.5 bps to 9.2% from 9.5% recorded the previous week. The table below shows the summary of the performance of the Kenyan Eurobonds as of 3rd July 2025;
|
Cytonn Report: Kenya Eurobond Performance |
|||||||
|
|
2018 |
2019 |
2021 |
2024 |
2025 |
||
|
Tenor |
10-year issue |
30-year issue |
7-year issue |
12-year issue |
13-year issue |
7-year issue |
11-year issue |
|
Amount Issued (USD) |
1.0 bn |
1.0 bn |
0.9 bn |
1.2 bn |
1.0 bn |
1.5 bn |
1.5 bn |
|
Years to Maturity |
2.7 |
22.7 |
1.9 |
6.9 |
9.0 |
5.6 |
10.7 |
|
Yields at Issue |
7.3% |
8.3% |
7.0% |
7.9% |
6.2% |
10.4% |
9.9% |
|
02-Jan-25 |
9.1% |
10.3% |
8.5% |
10.1% |
10.1% |
10.1% |
9.95% |
|
02-Jun-25 |
8.7% |
10.8% |
- |
10.0% |
10.1% |
9.9% |
|
|
26-Jun-25 |
8.3% |
10.6% |
- |
9.7% |
9.9% |
9.5% |
|
|
27-Jun-25 |
8.3% |
10.6% |
- |
9.7% |
9.9% |
9.5% |
|
|
30-Jun-25 |
8.3% |
10.5% |
- |
9.6% |
9.8% |
9.4% |
|
|
01-Jul-25 |
8.0% |
10.3% |
- |
9.4% |
9.7% |
9.3% |
|
|
02-Jul-25 |
8.2% |
10.4% |
- |
9.5% |
9.7% |
9.3% |
|
|
03-Jul-25 |
8.0% |
10.3% |
- |
9.4% |
9.6% |
9.2% |
|
|
Weekly Change |
(0.3%) |
(0.3%) |
- |
(0.3%) |
(0.3%) |
(0.3%) |
- |
|
Y/Y Change |
(2.1%) |
(0.5%) |
- |
(1.2%) |
(1.0%) |
(1.4%) |
- |
|
YTD Change |
(1.0%) |
0.0% |
- |
(0.6%) |
(0.5%) |
(0.9%) |
- |
Source: Central Bank of Kenya (CBK)
Q2’2025 Highlights:
- The monetary policy committee met on April 8th, 2025, to review the outcome of its previous policy decisions against a backdrop of elevated uncertainties to the global outlook for growth, lower but sticky inflation in advanced economies, heightened trade tensions as well as persistent geopolitical tensions. The MPC decided to lower the CBR rate by 75.0 bps to 10.00%, from 10.75% in February 2025 which was in line with our expectation for the MPC to lower the CBR rate to within a range of 10.00%-10.50%. For more information, please see our Cytonn weekly #15/2025
- The National Treasury gazetted the revenue and net expenditures for the ninth month of FY’2024/2025, ending 31st March 2025, highlighting that the total revenue collected as at the end of March 2025 amounted to Kshs 1,702.9 bn, equivalent to 66.0% of the revised estimates of Kshs 2,580.9 bn for FY’2024/2025 and was 88.0% of the prorated estimates of Kshs 1,935.7 bn. For more information, please see our Cytonn weekly #16/2025
- The Energy and Petroleum Regulatory Authority (EPRA) released their monthly statement on the maximum retail fuel prices in Kenya, effective from 15th April 2025 to 14th May 2025. Notably, the maximum allowed price for Super Petrol, Diesel and Kerosene decreased by Kshs 2.0, Kshs 2.2 and Kshs 2.4 respectively. Consequently, Super Petrol, Diesel and Kerosene will now retail at Kshs 174.6, Kshs 164.9 and Kshs 150.0 per litre respectively, from Kshs 176.6, Kshs. 167.1 and Kshs 151.4 per litre respectively, representing decreases of 1.1%,1.3% and 1.6% for Super Petrol, Diesel and Kerosene respectively. For more information, please see our Cytonn weekly #16/2025
- The Central Bank of Kenya (CBK) initiated a comprehensive review of the Risk-Based Credit Pricing Model (RBCPM), five years after its implementation in 2019. The RBCPM was originally developed as a market-driven solution to address inefficiencies in Kenya’s credit market, including high lending rates and a lack of transparency in credit pricing. The aim is to have a clear pricing module for the banks. For more information, please see our Cytonn weekly #17/2025
- Stanbic Bank released its monthly Purchasing Manager's Index (PMI) highlighting that the index for the month of April 2025 increased slightly, coming in at 52.0, up from 51.7 in March 2025, signaling another improvement in business conditions. This marked the seventh consecutive month that index fell above the 50.0 neutral mark. Increased output, new orders and increased sales supported the improvement. For more information, please see our Cytonn Weekly #19/2025
- The Kenya National Bureau of Statistics (KNBS) released the 2025 Economic Survey Report, highlighting that the Kenyan economy recorded a 4.7% growth in FY’2024, slower than the 5.7% growth recorded in FY’2023. The main contributor to Kenyan GDP remains to be the Agriculture, fishing and forestry sector which grew by 4.6% in FY’2024, lower than the 6.6% expansion recorded in FY’2023. All sectors in FY’2024, except Mining and Quarrying and Construction recorded positive growths, with varying magnitudes across activities. Most sectors recorded declining growth rates compared to FY’2023 with Accommodation and Food Services, Construction and Information and Communication recording the highest declines of 7.9%, 3.7% and 3.3% points, respectively. Other sectors that recorded a contraction in growth rate, from what was recorded in FY’2023 were Professional administration, Mining and Quarrying and Financial and Insurance services of 3.3%, 2.7% and 2.5% points respectively. For more information, please see our Cytonn weekly #19/2025
- The Kenya National Bureau of Statistics released the FY’2024 Economic Survey noting that, Kenya’s balance of payments position improved significantly by 231.0% in FY’2024, with a surplus of Kshs 176.7 bn, from a deficit of Kshs 134.8 bn in FY’2023. For more information, please see our Cytonn weekly #19/2025
- The Energy and Petroleum Regulatory Authority (EPRA) released their monthly statement on the maximum retail fuel prices in Kenya, effective from 15th May 2025 to 14th June 2025. Notably, the maximum allowed price for Super Petrol, Diesel and Kerosene remained unchanged at Kshs 174.6, Kshs 164.9 and Kshs 150.0 per litre respectively. For more information, please see our Cytonn weekly #20/2025
- Stanbic Bank released its monthly Purchasing Manager's Index (PMI) highlighting that the index for the month of May 2025 deteriorated to negative territory, coming in at 49.6, down from 52.0 in March 2025, signaling worsening in business conditions, mainly attributable to decreased output and new orders. This marked the first time in eight months the index fell below the 50.0 neutral mark. For more information, please see our Cytonn weekly #23/2025.
- In Q1’2025, Kenya’s Unit Trust Funds (UTFs) industry recorded strong growth, with Assets Under Management (AUM) increasing by 27.5% quarter-on-quarter to Kshs 496.2 bn, up from Kshs 389.2 bn in Q4’2024, and representing a 120.2% year-on-year growth. This growth was driven by low investment minimums, rising investor awareness, fintech adoption, and competitive returns, particularly from Money Market Funds (MMFs), which comprised 64.4% of the industry’s AUM. Sanlam Money Market Fund surpassed CIC Money Market Fund to become the largest unit trust by AUM in Kenya with an 18.2% market share, signaling a shift in investor preference and competitive positioning within the industry. For more information, please see our Cytonn weekly #23/2025.
- The monetary policy committee met on June 10th, 2025, to review the outcome of its previous policy decisions against a backdrop of elevated uncertainties to the global outlook for growth, lower but sticky inflation in advanced economies, heightened trade tensions as well as persistent geopolitical tensions. The MPC decided to lower the CBR rate by 25.0 bps to 9.75%, from 10.00% in April 2025. For more information, please see our Cytonn weekly #24/2025.
- During the week, The Energy and Petroleum Regulatory Authority (EPRA) released their monthly statement on the maximum retail fuel prices in Kenya, effective from 15th June 2025 to 14th July 2025. Notably, the maximum allowed price for Super Petrol increased by Kshs 2.7, while Diesel and Kerosene decreased by Kshs 2.0 and Kshs 2.1 respectively. Consequently, Super Petrol, Diesel and Kerosene will now retail at Kshs 177.3, Kshs 162.9 and Kshs 146.9 per litre respectively, from Kshs 174.6, Kshs 164.9 and Kshs 149.0 per litre respectively, representing an increase of 1.5% for Super Petrol, and decreases of 1.2% and 1.4% for Diesel and Kerosene respectively. For more information, please see our Cytonn weekly #24/2025.
- The National Treasury gazetted the revenue and net expenditures for the eleventh month of FY’2024/2025, ending 30th May 2025, highlighting that the total revenue collected as at the end of May 2025 amounted to Kshs 2,157.8 bn, equivalent to 83.6% of the revised estimates II of Kshs 2,580.9 bn for FY’2024/2025 and is 91.2% of the prorated estimates of Kshs 2,365.8 bn. For more information, please see our Cytonn weekly #25/2025.
Weekly Highlights.
- Q1’2025 Balance of Payments
Kenya’s balance of payment (BoP) position deteriorated significantly by 313.8% in Q1’2025, to a deficit of Kshs 77.0 bn, from a surplus of Kshs 36.0 bn in Q1’2024. The y/y negative performance in BoP was mainly driven by a significant 575.7% increase in financial account deficit to Kshs 48.6 bn from a deficit of Kshs 7.2 bn in Q1’2024. The performance was however supported by a significant 1,093.8% improvement in the net errors and omissions to a surplus of Kshs 95.0 bn from a deficit of Kshs 9.6 bn in Q1’2024. The table below shows the breakdown of the various balance of payments components, comparing Q1’2025 and Q1’2024:
|
Item |
Q1'2024 |
Q1'2025 |
Y/Y % Change |
|
Current Account Balance |
(42.1) |
(66.6) |
(58.3%) |
|
Capital Account Balance |
8.5 |
- |
- |
|
Financial Account Balance |
(7.2) |
(48.6) |
(575.7%) |
|
Net Errors and Omissions |
(9.6) |
95.0 |
1093.8% |
|
Balance of Payments |
36.0 |
(77.0) |
(313.8%) |
All values in Kshs bns
Key take-outs from the table include;
- The current account deficit (value of goods and services imported exceeds the value of those exported) widened by 58.3% to Kshs 66.6 bn from Kshs 42.1 bn in Q1’2024. The y/y widening of the current account was brought about by the 16.5% decline in the secondary income/transfers to a surplus of Kshs 230.9 bn from a surplus of Kshs 276.4 bn in Q1’2024, coupled with a 1.8% decrease in services trade balance to Kshs 82.3 bn from Kshs 83.8 bn in Q1’2024,
- The capital account balance (shows capital transfers receivable and payable between residents and non-residents, including the acquisition and disposal of non-produced non-financial items), which includes foreign direct investments (FDIs), stood at 0.0 bn in Q1’2025, down from a surplus of Kshs 8.5 bn in Q1’2024,
- The financial account balance (the difference between the foreign assets purchased by domestic buyers and the domestic assets purchased by foreign buyers) recorded a 575.7% increase in net inflow to a deficit Kshs 48.6 billion in Q1’2025, from a deficit of Kshs 7.2 billion in Q1’2024.
- Consequently, the Balance of Payments (BoP) position declined to a deficit of Kshs 77.0 bn in Q1’2025, from a surplus of Kshs 36.0 bn recorded in Q1’2024.
Current Account Balance
Kenya’s current account deficit widened by 58.3% to Kshs 66.6 bn in Q1’2025 from the Kshs 42.1 bn deficit recorded in Q1’2024. The y/y expansion registered was driven by:
- Secondary income/transfers surplus (the transactions recorded in the secondary income account pertain to those current transfers between residents and non-residents that directly affect the level of gross national disposable income and thus influence the economy’s ability to consume goods and services) decreased by 16.5% to Kshs 230.9 bn from Kshs 276.4 bn in Q1’2024 and,
- A 1.8% decline in the services trade balance to a surplus of Kshs 82.3 bn from a surplus of Kshs 83.8 bn in Q1’2024,
The table below shows the breakdown of the various current account components on a year-on-year basis, comparing Q1’2025 and Q1’2024:
|
Item |
Q1'2024 |
Q1’2025 |
Y/Y % Change |
|
Merchandise Trade Balance |
(313.3) |
(306.1) |
2.3% |
|
Services Trade Balance |
83.8 |
82.3 |
(1.8%) |
|
Primary Income Balance |
(89.0) |
(73.8) |
17.1% |
|
Secondary Income (transfer) Balance |
276.4 |
230.9 |
(16.5%) |
|
Current Account Balance |
(42.1) |
(66.6) |
(58.3%) |
All values in Kshs bns
Kenya's balance of payments deteriorated in Q1’2025, mainly on the back of a significant 575.7% increase in financial account deficit to Kshs 48.6 bn from a deficit of Kshs 7.2 bn in Q1’2024. The current account deficit (value of goods and services imported exceeds the value of those exported widened by 58.3% to Kshs 66.6 bn in Q1’2025 from the Kshs 42.1 bn deficit recorded in Q1’2024. The y/y widening of the current account was brought about by the decrease of 16.5% to Kshs 230.9 bn from Kshs 276.4 bn in Q1’2024 in the secondary income/transfers coupled with a 1.8% decline in the services trade balance to a surplus of Kshs 82.3 bn from a surplus of Kshs 83.8 bn in Q1’2024. Looking ahead, the outlook for Kenya's current account is optimistic, as continued growth in key export sectors and sustained diaspora remittances are expected to further improve the current account balance. Efforts to diversify exports and enhance value addition in agricultural products, along with prudent fiscal and monetary policies, will be crucial in sustaining this positive trajectory. Furthermore, the ongoing stability of Kenyan Shilling against most trading currencies is expected to lower the import bill hence narrowing the current account deficit. We expect that the current administration’s focus on fiscal consolidation will improve the balance of payments performance by minimizing the costs of servicing external debts. Additionally, the favorable weather conditions and government intervention through subsidy programs are set to boost agricultural production in the country, thereby increasing the export of agricultural products, and supporting the current account. We anticipate that the balance of payments will continue being stable with the help of multiple trade agreements, such as the one between Kenya and the EU and the one among the EAC, SADC and COMESA, as the agreements will boost the amount and variety of exports that are needed and offer more opportunities to sell them.
For a more detailed analysis read our Q1’2025 Balance of Payments Note
- Kenya Q1’2025 GDP Growth
The Kenya National Bureau of Statistics (KNBS) released the Q1’2025 Quarterly Gross Domestic Product Report, highlighting that the Kenyan economy recorded a 4.9% growth in Q1’2025, at par with the 4.9% growth recorded in Q1’2024. The main contributor to Kenyan GDP remains to be the Agriculture, fishing and forestry sector which grew by 6.0% in Q1’2025, higher than the 5.6% expansion recorded in Q1’2024. All sectors in Q1’2025 recorded positive growths, with varying magnitudes across activities. Most sectors recorded contraction in growth rates compared to Q1’2024 with Accommodation & Food Services, Financial Services Indirectly Measured and Professional Administration recording growth rate declines of 34.0%, 13.4% and 4.8% points to 4.1%, 9.0% and 4.6% from 38.1%, 15.4% and 9.4% respectively. Other sectors recorded an expansion in growth rates, from what was recorded in Q1’2024, with Mining and Quarrying, Taxes on products and Construction recording the highest growths in rates of 26.0%, 2.8% and 2.6% points, to 10.0%, 5.7% and 0.4% from (16.1%), 2.9% and 3.0% respectively.
The key take-outs from the report include;
- Sectoral Contribution to Growth - The biggest gainer in terms of sectoral contribution to GDP was the Agriculture and forestry sector, increasing by 0.2% points to 19.1% in Q1’2025 from 18.9% in Q1’2024, while the Manufacturing was the biggest loser, declining by 0.2% points to 7.7% in Q1’2025, from 7.9% in Q1’2024. Real Estate was the second largest contributor to GDP at 10.2% in Q1’2025, remaining constant from Q1’2024, indicating sustained growth. Mining and quarrying sector recorded the highest growth rate in Q1’2025 growing by 10.0%, a reversal from the 16.1% decline recorded in Q1’2024.
The chart below shows the top contributors to GDP by sector in Q1’2025:
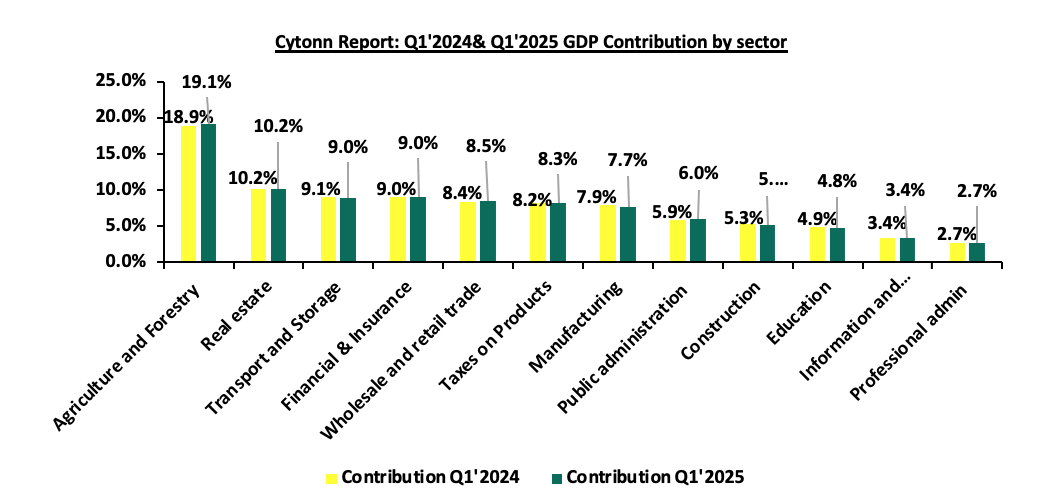
Source: KNBS Q1’2024 and Q1’2025 GDP Report
- Slowed growth in the Agricultural Sector: Agriculture and Forestry recorded a growth of 6.0% in Q1’2025. The performance was an increase of 0.2% points, from the expansion of 5.6% recorded in Q1’2024. Additionally, the sector remains the major contributor to GDP, with the sectoral contribution to GDP marginally increasing by 0.2% to 19.1% in Q1’2025, from 18.9% recorded in Q1’2024.The positive growth recorded during the quarter was mainly attributable to favorable weather conditions. Notably, during the quarter, production of key food crops and cash crops increased with a significant increase in the production of Milk and Sugarcane during the period under review. However, the performance was weighed down by decline in tea production.
- Reduced growth in the Financial and Insurance Services Sector: The Financial and Insurance sector growth rate slowed down by 4.5% points to 5.1% in Q1’2025 compared to the 9.6% in Q1’2024, attributable to the rise in cost of credit during the period. Additionally, the contribution to GDP increased by 0.01% points to remain relatively unchanged from the 9.0% recorded in Q1’2024. Some of the notable improvements include:
- Broad money supply (M3) grew by 6.8% to Kshs 6.2 trillion as at end of March 2025, from Kshs 5.8 trillion recorded as at the end of March 2024.
- The NSE 20 Share Index rose by 27.1% to 2,227.0 points in March 2025 from 1,752.0 points in March 2024, signaling improved performance in the equity market.
- Accelerated growth in the electricity supply sector - The Electricity and Water Supply sector recorded an accelerated growth of 3.6% in Q1’2025 compared to a 2.8% growth in a similar period of review in 2024, with the sectoral contribution to GDP remaining unchanged from the 2.3% recorded in Q1’2024. Notably, total electricity generated decreased by 5.0% to 3,208.8 million-kilowatt hour (KWh) in Q1’2025, from 3,056.0 million KWh in Q1’2024.
- Reduced growth in the Accommodation and Food Service sector Accommodation and Food Services sector recorded double digit decline in growth Q1’2025, having expanded by 4.1%, significantly slower than the 38.1% recorded in Q1’2024. Additionally, the contribution to GDP remained relatively unchanged from the 1.6% recorded in Q1’2024.
- Continued growth in the Information and Communication sector: The Information and Communication sector recorded an expansion rate of 5.8% in Q1’2025 albeit slower than the 9.2% growth recorded in the same period last year. Similarly, the contribution to GDP increased by 0.03% points, to remain unchanged from the 3.4% registered in Q1’2024.
The chart below shows the different sectoral GDP growth rates for Q1’2025:
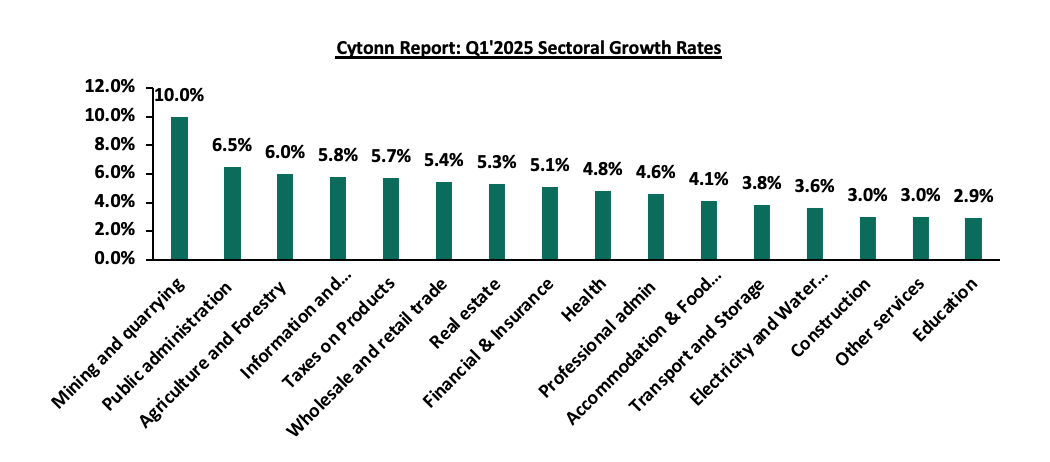
Source: KNBS Q1’2025 GDP Report
In 2025, Kenya's economy is projected to grow at a faster pace, estimated between 5.2%-5.4%. This optimistic outlook is attributed to improved business activity, supported by a stronger and more stable Kenyan Shilling, reduced borrowing costs, and the relatively lower inflation rates. However, the growth trajectory faces challenges from a tough business environment characterized by increasing taxes and a high cost of living. Despite these hurdles, recent economic developments provide a more favorable outlook. The Central Bank of Kenya (CBK) made a significant policy move in June 2025 by lowering the Central Bank Rate (CBR) by 25 basis points to 9.75%, marking the sixth consecutive rate cut. This accommodative monetary policy stance aims to stimulate private sector lending and boost economic activity. Inflation, while still within the CBK's target range of 2.5% to 7.5%, has been on an upward trend. In June 2025, the year-on-year inflation rate remained unchanged at 3.8% which was recorded in May. This rise is primarily driven by higher food prices . Despite the gradual rise, inflation remains well within the CBK's target range, providing some assurance for economic stability. The CBK's accommodative monetary policy is expected to alleviate some pressure on the cost of credit, thereby improving access to affordable borrowing. This environment is conducive to increased investment spending by both individuals and businesses, contributing positively to economic activity. The agricultural sector, Kenya's largest contributor to GDP, is anticipated to continue supporting growth due to favorable rainfall. While risks of rising fuel prices persist due to global geopolitical tensions, the overall inflation outlook is more favorable, bolstering optimism for the economic outlook.
For a more detailed analysis read our Q1’2025 GDP note
- Results of Linzi FinCo 003 Infrastructure Asset-Backed Securities (IABS) Offer
During the week, Linzi FinCo 003 Trust released the results of its Kshs. 44.8 billion Infrastructure Asset-Backed Securities (IABS) issuance, confirming full subscription. The transaction, which closed on 30th June 2025, attracted total bids amounting to Kshs. 44.9 billion, translating to a subscription rate of 100.2%. The amount accepted was in line with the programme’s target, and allotments were conducted on a pro-rata basis. This offering is part of a broader strategy to finance the development of the Talanta Sports Complex through the securitization of future cash flows from the Sports, Arts and Social Development Fund (SASDF).
The notes, issued under a restricted public offer framework, were offered exclusively to qualified institutional investors and structured as fixed-rate, amortizing securities with a 15-year tenor and an annual return of 15.04%. Interest and principal will be paid semi-annually. The securities are secured through a full legal assignment of receivables from SASDF, a fixed charge over the proceeds, and a fully funded Debt Service Reserve Account (DSRA) covering three months’ debt service. This structure helps de-risk the transaction and ensures timely cash flow in case of short-term funding gaps.
The issuance forms part of a growing trend in Kenya's capital markets toward asset-backed structures as a way to fund infrastructure while reducing dependence on direct budgetary allocations. Investors were drawn to the instrument’s strong yield, long duration, and secured nature. It received an AA(KE)(IR) rating from Global Credit Rating (GCR), reflecting strong local creditworthiness. The securities will be listed on the Nairobi Securities Exchange’s Restricted Fixed Income Market Sub-Segment (RFISMS), with trading expected to commence on 8th July 2025.The following table summarizes the key features of the offer and the final results:
|
Cytonn Report: Linzi 003 IABS Offer and Results Summary |
|
|
Parameter |
Details |
|
Issuer |
Linzi FinCo 003 Trust |
|
Instrument |
Infrastructure Asset-Backed Securities |
|
Tranche Number |
01 |
|
Issue Amount (Target) |
Kshs. 44,791,000,000 |
|
Amount Received |
Kshs. 44,875,600,000 |
|
Subscription Rate |
100.19% |
|
Amount Accepted |
Kshs 44,791,000,000 |
|
Return (IRR) |
15.04% per annum |
|
Tenor |
15 years |
|
Maturity Year |
2040 |
|
Minimum Subscription |
Kshs. 1,000,000 |
|
Issue Price |
100% (At par) |
|
Listing Date (NSE RFISMS) |
8 July 2025 |
|
Rating |
AA(KE)(IR) by GCR |
|
Taxation |
Fully tax exempt |
To contextualize the attractiveness of the Linzi 003 IABS, it is useful to compare it with other 15-year fixed-income instruments available in the Kenyan market. The following table contrasts Linzi 003 against comparable government bonds on key attributes:
|
Cytonn report: Linzi FinCo 003 IABS comparative analysis |
||||
|
Instrument |
Tenor |
Taxation |
Yield/Coupon |
Denomination |
|
Linzi FinCo 003 IABS |
15 years |
Tax exempt |
15.0% |
Kenyan Shilling (Kshs) |
|
Kenyan Government Bonds |
15years |
10.0% |
12.7% |
Kenyan Shilling (Kshs) |
|
Kenyan Eurobonds |
10-15 years |
10.0% |
8.8% |
USD (United States Dollar) |
Compared to other instruments in the Kenyan fixed-income market, the Linzi FinCo 003 IABS offers a higher yield, reflecting the unique risk-return profile of the transaction at the moment. The IABS notes deliver a 15.04% yield over a 15-year tenor, but carry high project and revenue risk, largely tied to the performance and consistency of inflows from the Sports, Arts and Social Development Fund. In contrast, Kenyan Government Bonds of similar tenor offer a lower yield of 12.67%, backed by the full faith and credit of the government, and are considered to carry sovereign risk, which is comparatively lower. Kenyan Eurobonds, maturing in 10 to 15 years, yield between 8.5% and 9.0%, and are seen as lower risk instruments given their dollar-denomination, tradability in global markets, and broader investor base.
The yield premium on the Linzi 003 IABS therefore serves to compensate investors for the securitised structure’s limited recourse and project-specific risks. While government securities remain the benchmark for safety and liquidity, the IABS notes offer diversification and enhanced returns for institutional investors willing to engage with more complex, cash flow-backed instruments. The strong subscription performance of the offer suggests growing comfort with asset-backed structures and a maturing investor appetite for long-duration, high-yield alternatives in Kenya’s domestic debt market.
Rates in the Fixed Income market have been on a downward trend due to high liquidity in the money market which allowed the government to front load most of its borrowing. The government closed the year 81.2% ahead of its prorated net domestic borrowing target of Kshs 597.2 bn, and 81.2% ahead of the total FY’2024/25 net domestic borrowing target of Kshs 597.2 bn, having a net borrowing position of Kshs 1,082.1 bn (inclusive of T-bills). However, we expect a stabilization of the yield curve in the short and medium term, with the government looking to increase its external borrowing to maintain the fiscal surplus, hence alleviating pressure in the domestic market. As such, we expect the yield curve to stabilize in the short to medium-term and hence investors are expected to shift towards the long-term papers to lock in the high returns
Market Performance:
During Q2’2025, the equities market was on an upward trajectory, with NASI, NSE 10, NSE 25, and NSE 20 gaining by 17.3%, 13.0%, 11.5%, and 9.6%, respectively, taking the H1’2025 performance to gains of 22.4%, 18.5%, 14.3% and 13.9% for NASI, NSE 20, NSE 10, and NSE 25 respectively. The equities market performance during the quarter was driven by gains recorded by large caps such as Safaricom, NCBA, and Cooperative Bank of 36.6%, 13.3%, and 11.9% respectively. The gains were however weighed down by losses recorded by large cap stocks such as Bamburi and BAT of 4.4%, and 2.8% respectively.
During Q2’2025, in the regional equities market, the East African Exchanges 20 (EAE 20) share index declined by 11.0 bps, attributable to decline recorded by large cap stocks such as Airtel Uganda, MTN Rwandacell and Tanzania Breweries of 13.6%, 9.1% and 2.8% respectively. The performance was however supported by gains recorded by large cap stocks such as Bank of Baroda Uganda, Safaricom and KCB Group of 1,317.9%, 42.1% and 22.1% respectively.
Equities turnover increased by 21.3% in H1’2025 to USD 422.5 mn, from USD 348.2 mn in H1’2024. Foreign investors became net sellers in H1’2025 with a net selling position of USD 26.5 mn, from a net buying position of USD 6.6 mn recorded in H1’2024.
During the week, the equities market was on an upward trajectory, with NASI, NSE 25, NSE 10 and NSE 20 gaining by 5.7%, 5.1%, 4.8%, and 4.5%, respectively, taking the YTD performance to gains of 28.6%, 21.6%, 19.0% and 18.8% for NASI, NSE 20, NSE10, and NSE 25 respectively. The equities market performance was mainly driven by gains recorded by large-cap stocks such as Stanbic Bank, Safaricom, and NCBA of 9.9%, 8.0%, and 6.8%, respectively. The gains were however weighed down by losses recorded by large cap stocks such as Cooperative Bank of 0.3%.
Additionally, in the regional equities market, the East African Exchanges 20 (EAE 20) share index declined by 54.6 bps, attributable to losses recorded by large cap stocks such as Tanga Cement, Cooperative Bank and Tanzania cigarette of 33.4%, 1.6% and 1.4% respectively. The performance was however supported by gains recorded by large cap stocks such as Safaricom, Bank of Baroda Uganda and Absa of 6.1%, 4.4% and 3.5% respectively;
During the week, equities turnover gained significantly by 124.6% to USD 28.9 mn from USD 12.9 mn recorded the previous week, taking the YTD turnover to USD 447.1 mn. Foreign investors remained net buyers, for the fourth consecutive week with a net buying position of USD 0.2 mn, from a net buying position of USD 0.9 mn recorded the previous week, taking the YTD net selling position to USD 26.8 mn.
The market is currently trading at a price to earnings ratio (P/E) of 7.0x, 39.2% below the historical average of 11.5x, and a dividend yield of 6.2%, 1.5% points above the historical average of 4.7%. Key to note, NASI’s PEG ratio currently stands at 0.9x, an indication that the market is undervalued relative to its future growth. A PEG ratio greater than 1.0x indicates the market may be overvalued while a PEG ratio less than 1.0x indicates that the market is undervalued.
The charts below indicate the historical P/E and dividend yield of the market;
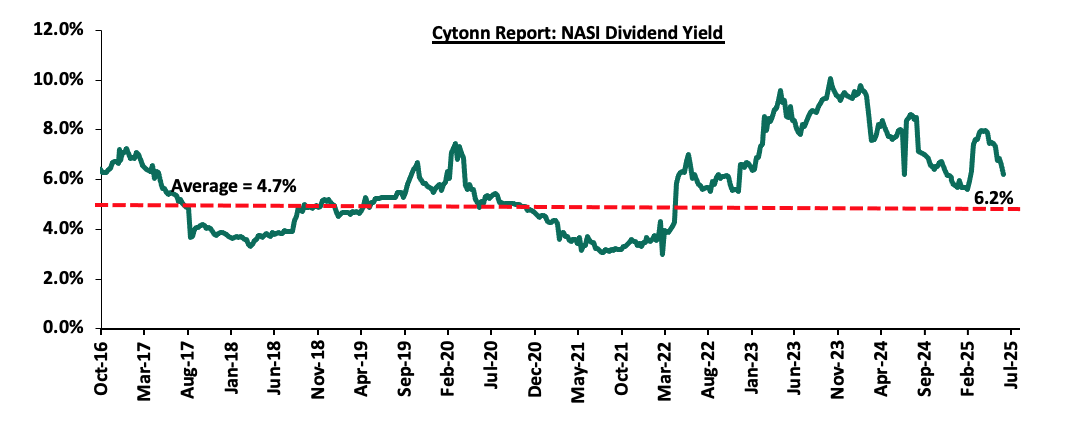
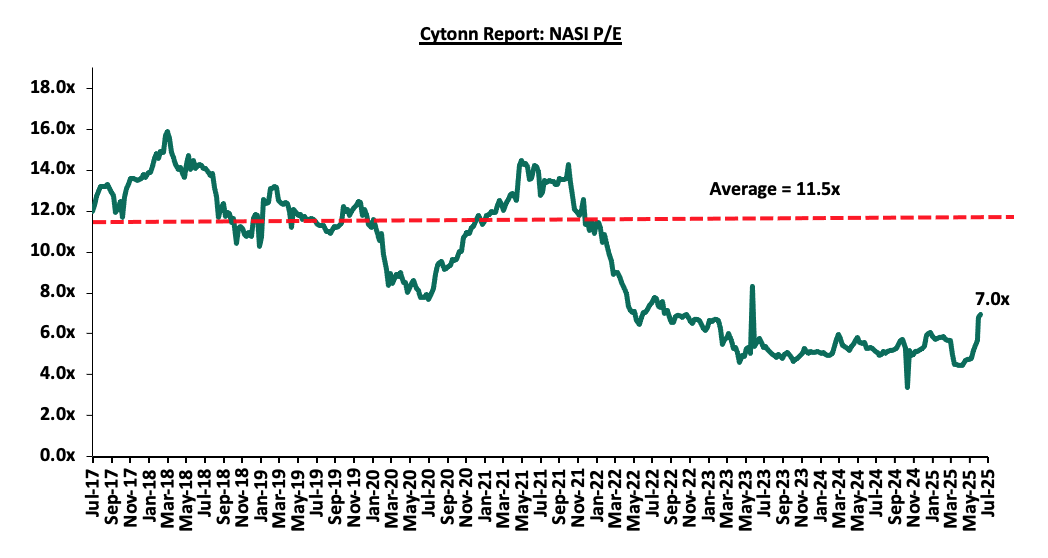
Listed Banks’ FY’2024 and Q1’2025 Performance
During the first half of 2025 the listed banking sector released their FY’2024 and Q1’2025 results, recording y/y earnings growth of 25.7% and a decline of 0.7% in their core EPS in FY’2024 and Q1’2025, respectively. For more information, please see our FY’2024 and Q1’2025 Banking Sector Reports.
Key Q2’2025 Highlights:
During Q2’2025;
- Sanlam Kenya’s Board of Directors announced commencement of Sanlam Kenya PLC’s rights issue following prior clearance by the shareholders, the Capital Markets Authority (CMA), the Nairobi Stock Exchange (NSE) and the Insurance Regulatory Authority (IRA). Sanlam Kenya’s rights issue involved the issuance of up to 500.0 mn new ordinary shares, priced at Kshs 5.0 each, with a par value of Kshs 5.0 per share. Please see our Cytonn Weekly #15/2025 for more info
- The East African Securities Exchanges Association (EASEA) launched the East Africa Exchanges (EAE) 20 Share Index. The EAE 20 Share Index comprises of the top 20 listed companies in Kenya, Tanzania, Uganda and Rwanda securities exchanges. Please see our Cytonn Weekly #15/2025 for more info
- Bamburi Cement Plc released their FY’ 2024 results, reporting a loss for the year of Kshs 0.9 bn, a significant 126.8% increase from the Kshs 0.4 bn loss recorded in FY’2023. Please see our Cytonn Weekly #16/2025 for more info
- Safaricom Plc released its FY’2025 financial results for the period ending 31st March 2025, highlighting that the profit after tax (PAT) for the Group increased by 7.3% to Kshs 45.8 bn, from 42.7 bn recorded in FFY’2024. Please see our Cytonn Weekly #19/2025 for more info
- During the period, Sanlam released the results of its earlier approved rights issue, announcing that the rights were fully subscribed including underwriting with a total subscription rate of 81.5% before underwriting, having received offers worth Ksh 2.0 bn against the offered Ksh 2.5 bn. Please see our Cytonn Monthly May 2025 for more info
- During the period, Equity Bank placed TransCentury Plc and its subsidiary East African Cables under receivership to recover a combined Kshs 4.7 billion debt, after the lapse of a 90-day court injunction. Please see our Cytonn Weekly #26/2025 for more info
- During the period, the Capital Markets Authority (CMA) suspended trading of TransCentury Plc and East African Cables due to insolvency proceedings, raising the number of suspended companies on the Nairobi Securities Exchange (NSE) to six out of 63 listed. Please see our Cytonn Weekly #26/2025 for more info
Universe of Coverage:
|
Cytonn Report: Equities Universe of Coverage |
||||||||||||
|
Company |
Price as at 27/06/2025 |
Price as at 04/07/2029 |
w/w change |
q/q change |
YTD Change |
Year Open 2025 |
Target Price* |
Dividend Yield |
Upside/ Downside** |
P/TBv Multiple |
Recommendation |
|
|
Standard Chartered Bank |
296.5 |
306.0 |
3.2% |
0.2% |
7.3% |
285.3 |
328.8 |
14.7% |
30.9% |
1.7x |
Buy |
|
|
KCB Group |
46.5 |
47.0 |
1.1% |
10.6% |
10.8% |
42.4 |
53.7 |
6.4% |
29.5% |
0.6x |
Buy |
|
|
Stanbic Holdings |
161.5 |
177.5 |
9.9% |
1.7% |
27.0% |
139.8 |
185.8 |
11.7% |
27.6% |
1.1x |
Buy |
|
|
Equity Group |
48.9 |
51.8 |
5.9% |
3.8% |
7.8% |
48.0 |
58.0 |
8.2% |
26.9% |
0.9x |
Buy |
|
|
Diamond Trust Bank |
75.5 |
78.0 |
3.3% |
2.0% |
16.9% |
66.8 |
90.4 |
9.0% |
24.8% |
0.3x |
Buy |
|
|
Co-op Bank |
17.4 |
17.3 |
(0.3%) |
11.9% |
(0.9%) |
17.5 |
18.9 |
8.7% |
22.4% |
0.6x |
Buy |
|
|
I&M Group |
35.6 |
37.4 |
5.2% |
10.5% |
3.9% |
36.0 |
39.0 |
8.0% |
21.7% |
0.7x |
Buy |
|
|
Jubilee Holdings |
225.0 |
233.0 |
3.6% |
17.0% |
33.3% |
174.8 |
260.7 |
5.8% |
21.6% |
0.3x |
Buy |
|
|
ABSA Bank |
19.0 |
20.0 |
5.3% |
1.1% |
5.8% |
18.9 |
21.0 |
8.8% |
21.4% |
1.3x |
Buy |
|
|
NCBA |
58.8 |
62.8 |
6.8% |
13.3% |
23.0% |
51.0 |
60.2 |
8.8% |
16.2% |
1.0x |
Accumulate |
|
|
CIC Group |
2.9 |
3.0 |
5.6% |
4.9% |
42.1% |
2.1 |
3.1 |
4.3% |
14.2% |
0.8x |
Accumulate |
|
|
Britam |
7.8 |
7.8 |
0.5% |
1.0% |
34.0% |
5.8 |
7.5 |
0.0% |
0.5% |
0.7x |
Lighten |
|
|
*Target Price as per Cytonn Analyst estimates **Upside/ (Downside) is adjusted for Dividend Yield ***Dividend Yield is calculated using FY’2024 Dividends |
||||||||||||
Weekly highlights
- Update on the constituents of the NSE 25 Share Index highlight
During the week,the Nairobi Securities Exchange (NSE) announced the inclusion of Sasini Plc as a constituent in the NSE 25 Share Index to replace TransCentury Plc following the court order placing it under receivership and subsequent suspension of trading of TransCentury Plc and its subsidiary East Africa Cables. The update comes just a few weeks after NSE had conducted annual review of its benchmarks in an effort to align its indices with global best practices and to ensure its benchmark indices provide a true representation of the Kenyan equity market’s performance and composition.
The NSE 25 Share Index is a market capitalization weighted index that tracks the performance of 25 select companies listed on the Nairobi Securities Exchange. The constituents are selected based on liquidity, market activity, and free-float market capitalization, ensuring a balanced representation of the Kenyan equity market. Banking sector dominates with 11 companies in NSE 25 followed by insurance, manufacturing, energy and petroleum with 5, 3 and 2 companies respectively and with the agricultural, investment, investments services and telecommunication sector being represented by a company each.
In line with global best practices, NSE remains committed to conducting annual reviews of its benchmark indices the NSE 10, NSE 20, and NSE 25 to ensure they remain robust, transparent, and reflective of prevailing market dynamics. These periodic reviews not only uphold the integrity of the market but also enhance investor confidence by offering reliable performance benchmarks to guide investment decisions and portfolio management.
We are “Bullish” on the Equities markets in the short term due to current cheap valuations, lower yields on short-term government papers and expected global and local economic recovery, and, “Neutral” in the long term due to persistent foreign investor outflows. With the market currently trading at a discount to its future growth (PEG Ratio at 0.9x), we believe that investors should reposition towards value stocks with strong earnings growth and that are trading at discounts to their intrinsic value. We expect the current high foreign investors sell-offs to continue weighing down the economic outlook in the short term.
In H1’2025, the general Real Estate sector continued to witness considerable growth in activity in terms of property transactions and development activities. Consequently, the sector’s activity contribution to Gross Domestic Product (GDP) grew by 5.3 % to Kshs 358.4 bn in Q1’2025, from Kshs 334.1 bn recorded during the same period in 2024. In Q1’2025, the sector contributed 10.2% to the country’s GDP in Q1’2025, remaining unchanged from Q1’2024. Cumulatively, the Real Estate and construction sectors contributed 15.5% to GDP in Q1’2025, 0.1% points decrease from 15.6% in Q1’2024, attributable to decline in construction contribution to GDP by 0.1% points, to 5.2% in Q1’2025, from 5.3% recorded in Q1’2024.
The graph below highlights the Real Estate and Construction sectors’ contribution to GDP from 2020 to Q1’2025;
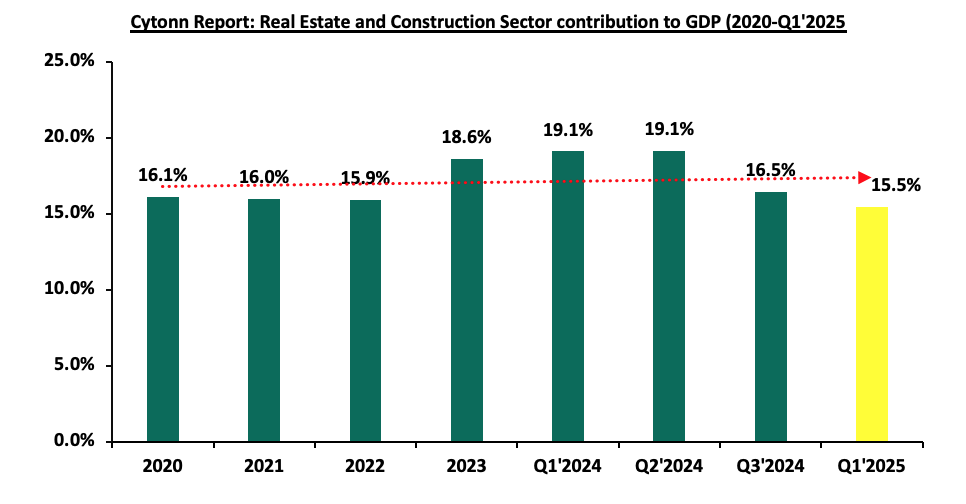
Source: Kenya bureau of statistics (KNBS)
In H1’2025, Real Estate was promoted by key initiatives as follows:
- Government’s continued Focus on Affordable Housing: the Kenyan government has sustained its strong commitment to the Affordable Housing Program (AHP), a key pillar under the Bottom-Up Economic Transformation Agenda (BETA). According to the Architectural Association of Kenya’s (AAK) Status of the Built Environment Report 2024, the AHP pipeline currently comprises an estimated 730,062 housing units under various stages of construction, delivered through government and public-private partnerships. The program continues to gain momentum following the operationalization of the Affordable Housing Act, 2024, which introduced the Affordable Housing Levy, a dedicated funding mechanism now actively supporting project financing. The government has also expanded collaborations with county governments and private developers to unlock land and fast-track approvals, further accelerating housing delivery across the country,
- Infrastructural development: Kenya has sustained momentum in infrastructure upgrades, enhancing access to urban and peri-urban areas and boosting Real Estate activity. Key projects include Phase II of the Dongo Kundu Bypass, featuring major bridges at Mwache and Mteza, aimed at easing Mombasa’s congestion and the completion of drainage works on the Makupa Bridge, improving coastal connectivity. In Nairobi, the Expressway and upgrades to the Eastern and Western Bypasses continue to reduce travel times and support the city’s role as a regional hub. These projects, driven by government investment and public-private partnerships, remain central to national development goals,
- Provision of affordable mortgage financing: Kenya Mortgage Refinance Company (KMRC) has continued to play a critical role in expanding access to affordable housing finance by offering single-digit fixed-rate, long-term refinancing to Primary Mortgage Lenders (PMLs) such as banks, SACCOs and microfinance institutions. In a strategic shift, KMRC widened its eligibility criteria to include non-shareholder SACCOs and microfinance banks, enabling more institutions to offer low-cost mortgages to underserved segments, particularly low and middle-income earners. This move aligns with the government’s affordable housing agenda by strengthening the availability of sustainable mortgage products. KMRC has also sustained its capital-raising efforts through bond issuances to support continued liquidity for mortgage lenders, reinforcing its mandate to deepen Kenya’s mortgage market,
- Aggressive expansion pursued by retailers: the retail landscape has seen a surge in growth, with both domestic and international retailers like Naivas, QuickMart, China Square, Panda Mart, and Carrefour aggressively expanding their market These retailers are capitalizing on the opportunities created by the exit of distressed chains like Choppies, Nakumatt, Tuskys, and Uchumi. Furthermore, the influx of global brands such as Adidas, Puma, Aldo, and Michael Kors is poised to further fuel the sector's growth and development,
- Kenya’s recognition as a regional business hub: Kenya continues to enjoy recognition as a regional business hub. As a result, foreign entities have continued to open business operations in Kenya, boosting the demand for both commercial and residential Real Estate. Increased business activity has driven up demand for office space, apartments, and housing near business hubs, leading to the development of new projects, increased property values, and job creation in the construction sector,
- Positive Demographics: with relatively high urbanization and population growth rates of 7% p.a and 2.0% p.a, respectively, against the global average of 1.7% p.a and 1.0% p.a, respectively, as at 2024, there is a sustained demand for more housing units in the country,
- Increasing Investor Confidence: Increase in investor confidence has greatly influenced hospitality sector and this is evident through mergers, acquisitions and expansions of hotels. Furthermore, the number of international arrivals into the country by the end of April 2025 registered a 63.7% year- to-year (y/y) increase to persons 169,230 from 103,362 in April 2024. Notably, the Hotel Chain Development Pipelines in Africa 2024 Report ranked Nairobi at 7th position by planned number of hotels and rooms with 31 hotels and 4,268 rooms in the pipeline,
- Special Built Developments: There has been an increased popularity of purpose-built properties to host Student housing, medical centers, Diplomatic residentials, data centers which offer potential for growth to the Real Estate sector through alternative markets. Due to these assets classes, the industry remains resilient despite the rapidly changing technological and economic environments, and,
- Easing Construction Costs: construction costs in Kenya showed signs of stabilization, largely supported by subdued inflation and a relatively stable currency. According to the Kenya National Bureau of Statistics (KNBS) Q1’2025 Construction Input Price Indices Report, the Building Cost Index (BCI) declined slightly to 118.60 from 118.77 in Q4’2024, marking a 0.14% quarter-on-quarter decrease. This indicates a moderation in construction cost growth, driven by steadier prices for key inputs such as fuel, steel, and transport. Despite the easing overally, prices for specific materials continued to rise modestly; cement increased by 0.92%, quarry products by 1.15%, and sand by 0.61%, suggesting that while input inflation is cooling, developers are still facing some upward pressure in select areas.
Despite the above drivers, the sector’s optimal performance is expected to be hampered by the following factors in 2025:
- Existing oversupply of physical space in select sectors: With approximately 5.7 mn SQFT in the NMA commercial office market, approximately 3.0 mn SQFT in the Nairobi Metropolitan Area (NMA) retail market, with the rest of the Kenyan retail market having an oversupply of approximately 1.7 mn This has led to prolonged vacancy rates in the respective Real Estate sectoral themes,
- Subdued REITs Market: The REITs market in Kenya continues to be subdued owing to various challenges such as the large capital requirements of Kshs 0 mn for trustees compared to Kshs. 10 mn for pension fund Trustees, which limits the role to banks, prolonged approval process for REITs, only a few legal entities capable of incorporating REITs, high minimum subscription amounts or offer parcels set at Kshs 0.1 mn for D-REITs and 5.0 mn for restricted I-REITs and lack of adequate knowledge of the financial asset class by investors,
- Constrained financing to developers: Constrained financing to developers as cost of borrowing remains elevated and lenders continue to demand more collateral from developers as a result of the high credit risk in the real estate By Q3’2024, however, gross non-performing loans against the gross loans disbursed increased by 0.5% point on a y/y to 13.6% in Q3’2024 from 13.1% in Q3’2023 basis on the back of tough business conditions and increased borrowing costs, which elevated credit risks and loan defaults,
- Underdeveloped capital markets: It is difficult to develop pools of capital focused on projects, particularly in the private markets, to supplement government efforts in providing Banks in Kenya are the primary source of funding for real estate developers, providing nearly 95.0% of funding as opposed to 40.0% in developed countries. This means that capital markets contribute only 5.0% of Real Estate development funding, compared to 60.0% in developed countries as shown below
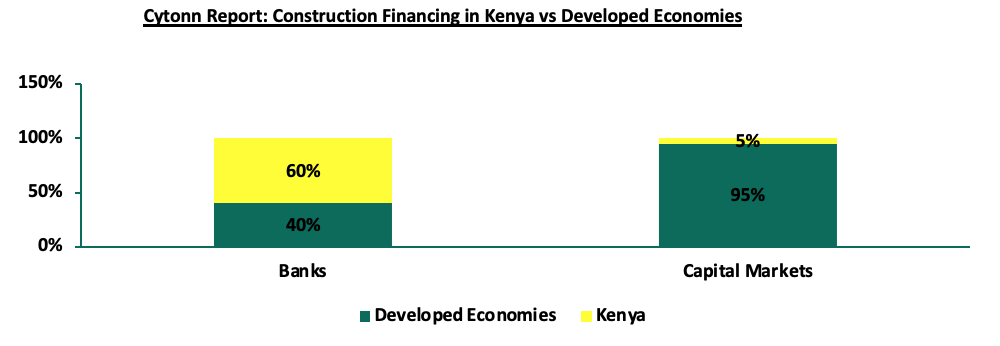
Source: World Bank, Capital Markets Authority
Sectoral Market Performance
- Industry Report
During the quarter, the following industry reports were released and the key take-outs were as follows;
|
Cytonn Report: Notable Industry Reports During the Month of May 2025 |
|||
|
# |
Theme |
Report |
Key Take-outs |
|
1. |
Leading Economic Indicators |
Leading Economic Indicators (LEI) April 2025 Report by the Kenya National Bureau of Statistics |
· In April 2025, the number of international visitor arrivals through Jomo Kenyatta International Airport (JKIA) and Moi International Airport (MIA) was 169,230, reflecting an 0.4% increase from the 168,563 arrivals recorded in March 2025. · On a year-on-year basis, April 2025 arrivals represent a 63.7% increase compared to 103,362 in April 2024, indicating a continued rebound in tourism activity. · The consumption of cement decreased by 2.6% to 790,462 metric tonnes in April 2025, from 811,187 metric tonnes in March 2025. · Building plans approved decreased significantly by 70.5% to 10.2 bn in April 2025, from 34.6 bn in March 2025 · For more information, please see our Cytonn Weekly #26/2025
|
During the week, the Kenya National Bureau of Statistics (KNBS) released the Quarterly Gross Domestic Product Report that outlined the performance of various sectors to the GDP and below are the key take-outs related to the Real Estate sector:
- Steady growth in the Real Estate Sector - The Real Estate sector posted steady growth of 5.3% in Q1’2025, which is 1.6% points slower than the 6.9% growth registered in Q1’2024. The steady growth can be attributable to an increasing demand for housing in the country. However, the slowed growth compared to Q1’2024 can be attributable to the sustained increase in the construction costs which remained a significant challenge to developers and investors during the period under review. For instance, the construction costs of a standard high-rise apartment block have increased by 13.0% to Kshs. 68,290 per square metre in 2025 from Kshs. 60,435 per square metre in 2024. On a quarter-on-quarter basis, this represented a 1.7%-points increase from the 3.6% growth recorded in Q4’2024. The increase in performance can be attributable to; i) Eased interest rates, which has enabled increased access to credit and lower rates which has spurred demand in the property market, ii) Improved strength in the Kenyan Shilling which helps in reducing the expected importation costs for construction costs for materials, iii) Favourable government and policy interventions. Continued rollout of affordable housing projects under the Kenya Kwanza administration has fostered increased demand for residential units and construction related services. The graph below shows the Real Estate sector growth from Q1’2020 to Q1’2025.
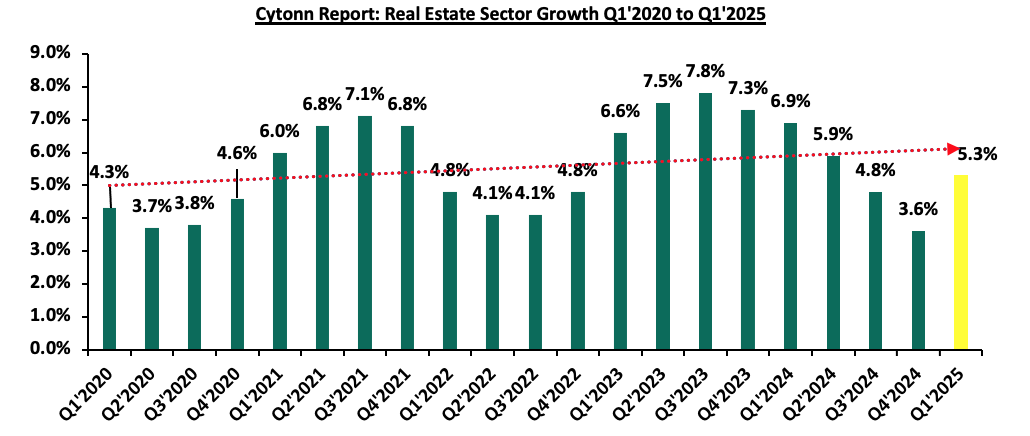
Source: Kenya bureau of statistics (KNBS)
- Subdued growth in the construction sector - The construction sector grew by 3.0% in Q1’2025, which is 2.6% points higher than the 0.4% growth in Q1’2024. On a quarter-on-quarter basis, this performance represented a 0.1%-point increase from the 2.9% increase recorded in Q4’2024. The graph below shows the Construction sector growth rates from Q1’2020 to Q1’2025;
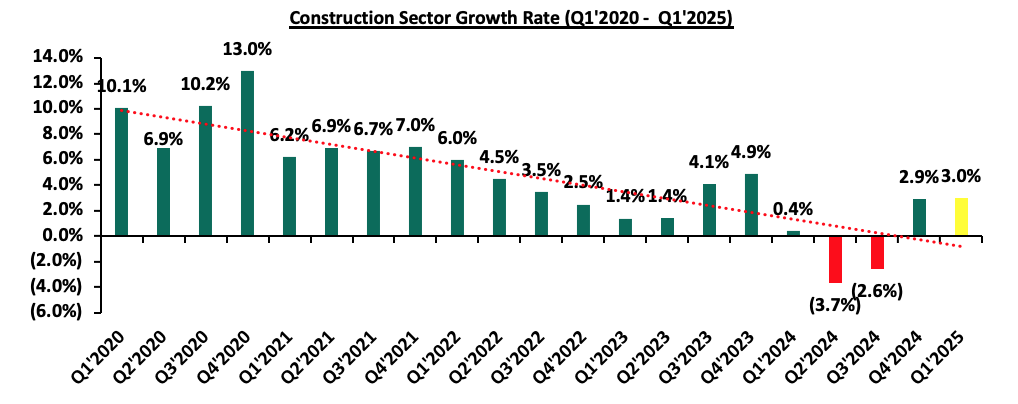
Source: Kenya bureau of statistics (KNBS)
- Sustained Recovery in Accommodation and Restaurant Sector – The accommodation and restaurant services grew by 4.1% during Q1’2025, representing an 34.0% points y/y decline from the 38.1% growth recorded in Q1’2024. On a q/q basis, this performance represented 6.8% points decrease from the 10.9% in Q4’2024. The slowed growth can be attributed to economic deceleration, high operational cost and somewhat constrained consumer spending due to increased taxation and high cost of living. Despite these challenges, the market shows steady recovery from the impacts of COVID-19, with the lifting of travel restrictions playing a major role in boosting activity within the real estate sector. The sector is however expected to continue benefitting from an increased number of international arrivals; for instance, In April 2025, the number of international visitor arrivals through Jomo Kenyatta International Airport (JKIA) and Moi International Airport (MIA) was 169,230, reflecting an 0.4% increase from the 168,563 arrivals recorded in March 2025. The graph below shows the accommodation and restaurant sector contribution to GDP growth rates from Q1’2021 to Q1’2025;
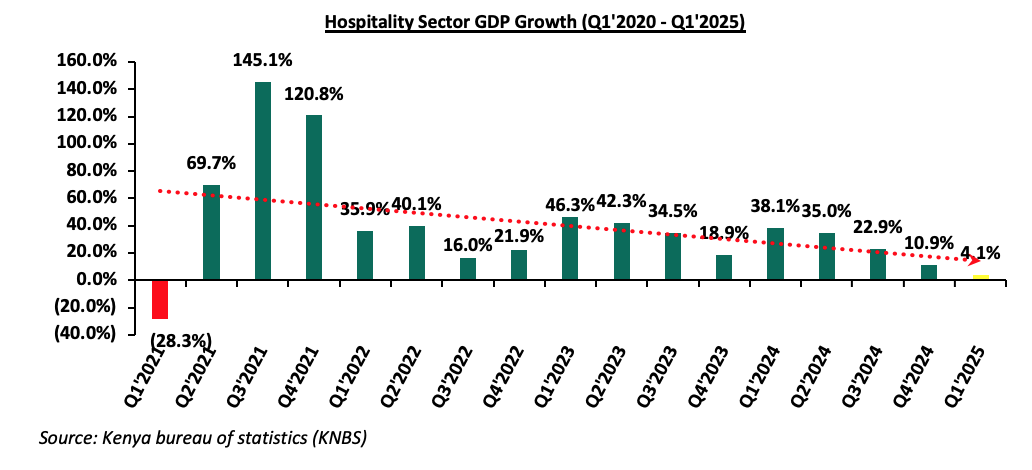
Source: Kenya bureau of statistics (KNBS)
We anticipate growth in Kenya's Real Estate sector, supported by several key factors such as; i) high urbanization and population growth rates of 3.7% p.a and 2.0% p.a, respectively, against the global average of 1.7% p.a and 1.0% p.a, respectively as at 2024, sustaining demand for housing units and other Real estate developments, ii) increased visitor arrivals through the major points of entry such as the Jomo Kenyatta International Airport (JKIA) and Moi International Airport (MIA) by 0.4% increase to 169,230 arrivals recorded in April 2025 from 168,563 arrivals recorded in March 2025. On a year on year basis, April 2025 arrivals represent a 63.7% increase compared to 103,362 in April 2024, indicating a continued rebound in tourism activity, iii) the government continued roll out and support of the affordable housing programme in the country, iv) increased activities by industry players, especially in the residential sector. However, we expect the sectors growth to be weighed down by increasing construction costs and the toughing lending environment for real estate developers.
For more notable developments during H1’2025 please visit our Q1’2025 market review report, Cytonn Monthly_April 2025, and Cytonn Monthly_May 2025
- Residential Sector
During H1’2025, the NMA residential sector recorded a slight increase in performance, with the average total returns to investors coming in at 6.8%, a 0.9%-point increase from 5.9% recorded in H1’2024. The performance was attributed to a decrease in the residential average y/y price appreciation which came in at 1.2% in H1’2025, 0.7%-points higher than the 0.5% appreciation recorded in H1’2024, driven by increased property transactions during the year. On the other hand, the average rental yield came in at 5.6% in H1’2025, recording a 0.4%-points increase from the 5.2% rental yield recorded in H1’2024. This was driven by an increase in the average occupancy by 2.0 % points to 93.4%, from 90.4% recorded in H1’2024. The table below shows the NMA residential sector’s performance during H1’2024 and H1’2025;
|
(All values in Kshs unless stated otherwise) |
|||||||||
|
Cytonn Report: Nairobi Metropolitan Area (NMA) Residential Sector Summary - H1’2025/H1’2024 |
|||||||||
|
Segment |
Average of Price per SQM H1'2025 |
Average of Rent per SQM H1'2025 |
Average of Rental Yield H1'2025 |
Average of Price Appreciation H1'2025 |
Average of Total Returns H1'2025 |
Average of Rental Yield H1'2024 |
Average of Price Appreciation H1'2024 |
Average of Total Returns H1'2024 |
y/y change in Rental Yield (% Points) |
|
Detached Units |
|||||||||
|
High End |
194,474 |
798 |
4.7% |
1.5% |
6.3% |
5.0% |
0.4% |
5.8% |
(0.3%) |
|
Upper Middle |
134,577 |
571 |
5.0% |
0.2% |
5.2% |
4.9% |
0.4% |
5.4% |
0.1% |
|
Lower Middle |
76,153 |
388 |
4.8% |
0.3% |
5.1% |
4.1% |
1.0% |
5.3% |
0.7% |
|
Detached Units Average |
135,068 |
586 |
4.9% |
0.7% |
5.5% |
4.7% |
0.6% |
5.5% |
0.2% |
|
Apartments |
|||||||||
|
Upper Mid-End |
129,182 |
721 |
6.8% |
1.3% |
8.0% |
5.7% |
0.3% |
6.0% |
0.8% |
|
Lower Mid-End Suburbs |
94,512 |
513 |
5.8% |
1.9% |
7.8% |
5.3% |
0.6% |
5.9% |
(0.1%) |
|
Lower Mid-End Satellite Towns |
82,202 |
456 |
6.6% |
2.1% |
8.7% |
6.2% |
0.5% |
6.8% |
(0.2%) |
|
Apartments Average |
101,966 |
564 |
6.4% |
1.8% |
8.2% |
5.7% |
0.5% |
6.2% |
0.2% |
|
Residential Market Average |
118,517 |
575 |
5.6% |
1.2% |
6.8% |
5.2% |
0.5% |
5.9% |
0.2% |
Source: Cytonn Research
- Detached Units Performance
The table below shows the NMA residential sector detached units’ performance during H1’2025;
|
All values are in Kshs unless stated otherwise |
||||||||
|
|
||||||||
|
Cytonn Report: Residential Detached Units Summary H1’2025 |
||||||||
|
Area |
Average of Price per SQM H1'2025 |
Average of Rent per SQM H1'2025 |
Average of Occupancy H1'2025 |
Average of Uptake H1'2025 |
Average of Annual Uptake H1'2025 |
Average of Rental Yield H1'2025 |
Average of Price appreciation H1'2025 |
Total Returns |
|
High End |
||||||||
|
Runda |
250,666 |
1,091 |
96.8% |
96.8% |
8.1% |
5.2% |
10.1% |
15.3% |
|
Kitisuru |
235,850 |
823 |
95.5% |
91.9% |
9.0% |
4.2% |
2.2% |
6.4% |
|
Rosslyn |
195,018 |
903 |
94.1% |
98.4% |
10.0% |
5.3% |
0.0% |
5.3% |
|
Lower Kabete |
126,068 |
502 |
95.0% |
93.2% |
9.3% |
4.9% |
0.0% |
4.9% |
|
Karen |
164,767 |
672 |
91.7% |
93.2% |
9.1% |
4.1% |
(4.6%) |
(0.5%) |
|
Average |
194,474 |
798 |
94.6% |
94.7% |
9.1% |
4.7% |
1.5% |
6.3% |
|
Upper Middle |
||||||||
|
South B/C |
114,683 |
769 |
89.9% |
88.5% |
11.8% |
7.4% |
1.7% |
9.1% |
|
Loresho |
121,626 |
613 |
90.6% |
90.6% |
9.4% |
5.5% |
1.3% |
6.8% |
|
Langata |
114,256 |
440 |
93.1% |
90.2% |
7.6% |
4.5% |
0.3% |
4.7% |
|
Runda Mumwe |
164,013 |
702 |
91.1% |
96.2% |
14.8% |
4.7% |
0.0% |
4.7% |
|
Lavington |
191,594 |
623 |
92.4% |
94.7% |
9.0% |
3.8% |
0.8% |
4.6% |
|
Redhill & Sigona |
84,416 |
468 |
92.0% |
98.4% |
9.8% |
6.3% |
(2.3%) |
4.0% |
|
Ridgeways |
151,454 |
385 |
87.5% |
88.3% |
7.5% |
2.6% |
0.0% |
2.6% |
|
Average |
134,577 |
571 |
90.9% |
92.4% |
10.0% |
5.0% |
0.2% |
5.2% |
|
Lower Middle |
||||||||
|
Rongai |
89,895 |
708 |
96.9% |
94.4% |
10.1% |
9.8% |
0.0% |
9.8% |
|
Ngong |
60,962 |
305 |
88.9% |
91.9% |
11.7% |
5.5% |
1.3% |
6.7% |
|
Juja |
73,491 |
270 |
90.7% |
94.2% |
12.2% |
5.4% |
1.2% |
6.6% |
|
Thika |
63,432 |
352 |
84.9% |
81.6% |
12.3% |
6.2% |
(0.2%) |
6.0% |
|
Kitengela |
66,043 |
302 |
93.6% |
92.5% |
9.8% |
5.2% |
0.5% |
5.7% |
|
Donholm & Komarock |
94,549 |
408 |
83.9% |
91.0% |
9.1% |
4.5% |
1.0% |
5.5% |
|
Athi River |
86,423 |
359 |
91.3% |
96.4% |
9.4% |
4.6% |
0.6% |
5.2% |
|
Syokimau/Mlolongo |
74,429 |
403 |
88.2% |
86.6% |
14.3% |
5.8% |
(2.1%) |
3.7% |
|
Average |
76,153 |
388 |
89.8% |
91.1% |
11.1% |
5.9% |
0.3% |
6.2% |
|
Grand Average |
135,068 |
586 |
91.8% |
92.7% |
10.1% |
5.2% |
0.7% |
5.9% |
Source: Cytonn Research
The key take-outs from the table include;
- Average Total Returns – The average total returns to detached units’ investors came in at 5.9%, 0.3% points higher than the 5.6% recorded in H1’2024. The performance was driven by a 0.4%-points increase in the average rental yield to 5.2% in H1’2025, from 4.9% recorded in H1’2024. The increase in performance was attributable to 0.1% points increase in the average price appreciation to 0.7% in H1’2025, from 0.6 % recorded in H1’2024,
- Segment Performance – The best-performing segment was the high-end segment offering an average total return of 6.3%, attributable to a relatively high average price appreciation of 1.5%, 0.8%-points higher than the detached market average appreciation of 0.7%. The impressive performance of the segment was driven by returns from well-performing nodes such as Runda, Kitusuru and Rosslyn, which have continued to offer relatively high returns to investors, and,
- Nodal Performance – Overall, Runda was the best-performing node, offering the highest returns at 15.3%, 9.4% points higher than the detached market average of 5.9%, driven by a relatively high rental yield of 10.1%. The node has seen increased detached unit property investments owing to an inflow of residents brought about by the enhanced accessibility to the Nairobi CBD through various roads such as Limuru Road and the Western bypass. Also, the area enjoys proximity to various amenities such as the JKIA due to the enhanced road network. Rongai and south B/C followed with an average total return of 9.8% and 9.1% respectively
- Apartments Performance
The table below shows the NMA residential sector apartments’ performance during H1’2025;
|
All values are in Kshs unless stated otherwise |
|
||||||||
|
Area |
Average of Price per SQM H1'2025 |
Average of Rent per SQM H1'2025 |
Average of Occupancy H1'2025 |
Average of Uptake H1'2025 |
Average of Annual Uptake H1'2025 |
Average of Rental Yield H1'2025 |
Average of Price Appreciation |
Total Yields |
|
|
Upper Mid-End |
|||||||||
|
Upperhill |
122,843 |
651 |
89.0% |
90.5% |
9.8% |
7.3% |
4.6% |
11.9% |
|
|
Kilimani |
105,495 |
699 |
95.9% |
93.1% |
14.1% |
7.3% |
0.4% |
7.8% |
|
|
Kileleshwa |
127,397 |
749 |
96.1% |
92.9% |
9.7% |
6.3% |
1.1% |
7.3% |
|
|
Westlands |
164,898 |
811 |
92.0% |
92.3% |
7.0% |
6.5% |
0.6% |
7.1% |
|
|
Parklands |
125,278 |
698 |
94.7% |
94.8% |
9.9% |
6.4% |
(0.4%) |
6.0% |
|
|
Average |
129,182 |
721 |
93.5% |
92.7% |
10.1% |
6.8% |
1.3% |
8.0% |
|
|
Lower Mid-End Suburbs |
|||||||||
|
Dagoretti |
71,349 |
540 |
91.8% |
83.8% |
8.1% |
9.2% |
4.0% |
13.3% |
|
|
Imara Daima |
86,280 |
344 |
95.9% |
89.7% |
7.1% |
4.1% |
8.1% |
12.2% |
|
|
Syokimau |
87,224 |
388 |
90.8% |
89.9% |
9.6% |
5.3% |
2.6% |
7.9% |
|
|
Langata |
114,700 |
924 |
95.4% |
91.5% |
8.6% |
6.8% |
1.1% |
7.8% |
|
|
Race Course/Lenana |
97,000 |
573 |
95.5% |
95.9% |
8.3% |
7.4% |
0.0% |
7.4% |
|
|
Waiyaki Way |
90,613 |
472 |
91.9% |
93.1% |
9.5% |
5.7% |
0.4% |
6.1% |
|
|
Kahawa West |
75,799 |
347 |
96.3% |
94.7% |
6.6% |
4.8% |
0.9% |
5.7% |
|
|
South B |
109,317 |
508 |
93.0% |
98.2% |
11.5% |
4.9% |
0.3% |
5.2% |
|
|
South C |
118,331 |
523 |
84.9% |
96.0% |
11.6% |
4.1% |
0.0% |
4.1% |
|
|
Average |
94,512 |
513 |
92.8% |
92.5% |
9.0% |
5.8% |
1.9% |
7.8% |
|
|
Lower Mid-End Satellite Towns |
|||||||||
|
Athi River |
54,482 |
418 |
97.3% |
96.0% |
9.3% |
9.1% |
5.9% |
14.9% |
|
|
Ngong |
82,585 |
341 |
95.8% |
93.2% |
10.3% |
7.0% |
4.1% |
11.2% |
|
|
Kikuyu |
83,730 |
469 |
95.8% |
96.0% |
13.7% |
6.3% |
3.1% |
9.4% |
|
|
Syokimau |
67,423 |
389 |
89.3% |
92.8% |
10.7% |
6.2% |
1.7% |
8.0% |
|
|
Thindigua |
105,937 |
594 |
92.1% |
89.9% |
10.9% |
6.3% |
0.9% |
7.2% |
|
|
Rongai |
61,354 |
369 |
91.5% |
91.6% |
10.7% |
6.1% |
0.4% |
6.5% |
|
|
Ruiru |
88,872 |
522 |
89.7% |
88.2% |
11.2% |
6.3% |
0.0% |
6.3% |
|
|
Ruaka |
113,234 |
549 |
91.0% |
90.0% |
10.5% |
5.3% |
0.9% |
6.3% |
|
|
Average |
82,202 |
456 |
92.8% |
92.2% |
10.9% |
6.6% |
2.1% |
8.7% |
|
|
Apartments Grand Average |
101,966 |
564 |
93.1% |
92.5% |
10.0% |
6.4% |
1.8% |
8.2% |
|
Source: Cytonn Research
The key take-outs from the table include;
- Average Total Returns – The average total returns to apartments’ investors came in at 8.2%, recording a 2.0%-points increase from the 6.2% recorded during H1’2024. The significant improved performance was driven by a 0.6%-points increase in the average rental yield to 6.4% in H1’2025, from 5.8% recorded in H1’2024. This was driven by slight increase in apartment property transactions during the period, attributable to 2.7% points increase in the average occupancy to 93.1% in H1’2025 from 90.4% in H1’2024,
- Segment Performance – The best-performing segment was the lower mid-end setelite towns with average total returns of 8.7%, attributed to a relatively high average y/y price appreciation of 2.1% and rental yield of 6.6%. The impressive performance of the segment was driven by returns from well-performing nodes such as Athi River, Ngong and Kikuyu that have continued to offer competitive returns to investors in comparison to other segments, and
- Nodal Performance – Overall, the best-performing node was Athi River , offering investors average total returns of 14.9%, 6.7%-points higher than the apartment market average total return of 8.2%. Athi River is attracting apartment investments owing to infrastructural development with the roads such as Mombasa Road, Nairobi expressway, proximity to CBD favouring residents in the area, a high number of middle-class families in the area, proximity to essential amenities such as the SGR and JKIA.
Notable Highlights in the quarter include;
- The Cabinet approved the Affordable Housing Regulations, 2024, reducing the minimum housing deposit under the Affordable Housing Programme from 10.0% to 5.0% in a bid to enhance accessibility for low and middle-income earners. The new regulations also introduce supportive frameworks such as structured home loans, deposit support and tenant purchase schemes to boost uptake. This comes as the government seeks to accelerate housing delivery and bridge the homeownership gap under the Bottom-Up Economic Transformation Agenda (BETA). or more information, please visit our Cytonn Weekly #26.2025,
- The International Finance Corporation ( IFC) , the private-sector arm of the World Bank, has disbursed Kshs 2.6 bn repayable in 7.0 years to Centum Real Estate, a Kenyan real estate firm to build 1940.0 units green, energy-efficient homes within Nairobi’s Two Rivers “Mizizi” project at the two rivers residential with 600.0 units already sold in phase one. For more information, please visit our Cytonn Weekly #25.2025,
- Kenya’s Affordable Housing Program, a flagship initiative under the Affordable Housing Act, 2024, is facing significant financial setbacks due to uncollected rent from government-owned housing units. The state is losing millions in potential revenue, undermining the program’s sustainability and its ability to fund new residential projects, a concern linked to the real estate sector’s reliance on efficient resource management, as discussed in prior conversations about JVs and the housing levy. For more information, please visit our Cytonn Weekly #24.2025,
- Superior Homes Kenya (SHK) and HFC Kenya, a subsidiary of HF Group, signed a transformative Memorandum of Understanding (MOU) to enhance homeownership accessibility in Kenya. This strategic partnership merges Superior Homes’ expertise in developing master-planned communities with HFC’s innovative financing solutions, offering homebuyers concessional mortgage rates of 9.5%, 20-year loan terms, and expedited loan approvals. For more information, please visit our Cytonn Weekly #24.2025,
- Kenya’s commercial banks significantly boosted funding for the building and construction sector by Kshs 19.3 bn in the first quarter of 2025, signaling a robust resurgence in real estate development. This double-digit growth reflects increased financing for new commercial and residential projects, as well as the resumption of stalled developments across the country. For more information, please visit our Cytonn Weekly #24.2025,
- Kenya’s Affordable Housing Levy, introduced to fund low-cost housing and address the country’s housing deficit, is at the center of controversy following revelations that the government plans to redirect these funds to construct schools, markets, police posts, and hospitals. This shift, outlined in proposed regulations, has sparked concerns about transparency and the potential misuse of funds intended for affordable housing, raising questions about the government’s commitment to its original promise to Kenyan workers. For more information, please visit our Cytonn Weekly #23.2025,
For more notable developments during H1’2025 please visit our Q1’2025 market review report, Cytonn Monthly_April 2025, and Cytonn Monthly_May 2025
We have a NEUTRAL outlook for the NMA residential sector, we expect continued vibrant performance in the residential sector within the country sustained by; i)ongoing residential developments under the Affordable Housing Agenda, aiming to reduce the housing deficit in the country currently estimated at 80.0%, ii) increased investment from local and international investors in the housing sector, iii) favorable demographics in the country, shown by high population and urbanization rates of 3.8% p.a and 2.0% p.a, respectively, leading to higher demand for housing units. However, challenges such as rising construction costs, strain on infrastructure development, and limited access to financing will continue to restrict the optimal performance of the residential sector.
- Commercial Office Sector
The table below highlights the performance of the Nairobi Metropolitan Area (NMA) Commercial Office sector over time;
|
Cytonn Report: Nairobi Metropolitan Area (NMA) Commercial Office Returns Over Time |
||||||
|
Year |
H1'2024 |
Q3'2024 |
FY'2024 |
Q1'2025 |
H1’2025 |
∆ H1'2024/H1'2025 |
|
Occupancy % |
80.1% |
79.6% |
80.7% |
80.3% |
80.9% |
0.8% |
|
Asking Rents (Kshs/SQFT) |
103 |
104 |
105 |
105 |
105 |
1.8% |
|
Average Prices (Kshs/SQFT) |
12,677 |
12,677 |
12,614 |
12,614 |
12,673 |
(0.03%) |
|
Average Rental Yields (%) |
7.65% |
7.7% |
7.8% |
7.6% |
7.72% |
0.1% |
Source: Cytonn Research
- Average Asking Rents – In H1’2025, average asking rents per SQFT in the NMA increased by 1.8% to Kshs 105 per SQFT from Kshs 103 in H1’2024. The increase was driven by a rise in the supply of grade one offices in the area such as Purple Tower, The Atrium, Mandrake, Highway Heights, Matrix One, among others ultimately pushing the asking prices higher. On a quarter-on-quarter (q/q) basis, the performance remained quite unchanged. This can be attributed to the performance of the Kenyan Shilling, which has begun gaining ground against the US dollar and remaining moderately constant,
- Average Occupancy Rate – In H1’2025 commercial office occupancy increased by 0.8% points to 80.9% from 80.1% recorded in H1’2024. On q/q basis, occupancy increased by 0.6%. On y/y basis the increase in occupancy can be linked to the decline in supply of office space in the area witnessed in 2024, which constrained available stock and supported higher occupancy rates. Additionally, on q/q basis the increase can be attributed to a growing demand from technology firms and multinational corporations seeking high-quality, Grade A office spaces with modern amenities and sustainable features, and,
- Average Rental Yield – The average rental yield slightly increased on y/y basis by 0.1% to 7.72% from 7.65% in H1’2024, with a similar 0.1% increase q/q. On q/q basis the performance improved slightly by 0.1%. These increases can be attributed to sustained leasing activity in prime submarkets driving the occupancy levels up and a slight decline in average prices in the NMA.
For submarket performance, Westlands stood out with the best performance, boasting an average rental yield of 9.4% in H1’2025, compared to the market average of 7.7%. Gigiri and Karen followed, with rental yields of 8.7% and 8.0%, respectively. We attribute this performance to several factors: i) a high concentration of Grade One offices in the areas, ii) robust infrastructure developments such as roads, iii) close proximity to residential areas, iv) increasing demand for quality offices by embassies, international organizations, and multinational companies in the areas, and v) the presence of after-work amenities such as hotels and quality social venues. On the other hand, Mombasa Road was the least performing node with an average rental yield of 6.4% in H1’2025, 1.3% points lower than the market average of 7.7%. The performance can be attributed to i) relatively low demand for office spaces due to its industrial zoning and lower concentration of premium tenants compared to prime nodes like Westlands, ii) preference for more established commercial zones by corporates and multinational firms, iii) inadequate presence of high-end office developments that attract premium tenants, and, iv) offices of relatively lower quality, which are perceived as less attractive and thus command lower rents. The table below displays the performance of sub-markets in the Nairobi Metropolitan Area (NMA).
|
All values in Kshs unless stated otherwise |
|||||||||||
|
Cytonn Report: NMA Commercial Office Submarket Performance H1'2025 |
|||||||||||
|
Area |
Price/SQFT H1'2025 |
Rent/SQFT H1'2025 |
Occupancy H1'2025 |
Rental Yields H1'2025 |
Price/SQFT H1'2024 |
Rent/SQFT H1'2024 |
Occupancy H1'2024 |
Rental Yields H1'2024 |
∆ in Rent |
∆ in Occupancy (% points) |
∆ in Rental Yields (% points) |
|
Westlands |
12,510 |
120 |
81.7% |
9.4% |
12,495 |
118 |
76.3% |
8.5% |
1.3% |
2.2% |
0.5% |
|
Gigiri |
14,850 |
131 |
82.4% |
8.7% |
15,000 |
128 |
80.2% |
8.2% |
2.3% |
2.2% |
0.5% |
|
Karen |
14,077 |
115 |
80.9% |
8.0% |
14,254 |
118 |
80.5% |
8.0% |
(2.2%) |
0.4% |
0.0% |
|
Kilimani |
12,873 |
101 |
83.0% |
7.9% |
13,051 |
100 |
83.2% |
7.8% |
1.0% |
(0.2%) |
0.1% |
|
Parklands |
11,922 |
94 |
83.1% |
7.9% |
11,875 |
92 |
84.0% |
7.8% |
2.0% |
(0.9%) |
0.1% |
|
Nairobi CBD |
12,294 |
92 |
86.9% |
7.8% |
12,147 |
92 |
85.6% |
7.8% |
(0.3%) |
1.3% |
0.0% |
|
Upperhill |
12,857 |
104 |
73.4% |
6.9% |
13,014 |
100 |
73.2% |
6.3% |
3.9% |
0.2% |
0.6% |
|
Thika Road |
13,057 |
91 |
80.1% |
6.7% |
12,571 |
79 |
80.4% |
6.0% |
15.4% |
(0.3%) |
0.7% |
|
Mombasa Road |
11,575 |
82 |
72.7% |
6.4% |
11,325 |
79 |
72.2% |
6.0% |
4.0% |
0.5% |
0.3% |
|
Average |
12,673 |
105 |
80.9% |
7.7% |
12,677 |
103 |
80.1% |
7.7% |
3.0% |
0.8% |
0.1% |
Source: Cytonn Research
For more notable developments during H1’2025 please visit our Q1’2025 market review report, Cytonn Monthly_April 2025, and Cytonn Monthly_May 2025
Our outlook for the NMA commercial office sector remains NEUTRAL, driven by factors such as: i) a rising presence of multinational corporations in the country, is expected to enhance occupancy rates, ii) the increasing trend of co-working spaces, and, iii) a decrease in developments witnessed in 2024, which we predict will help alleviate the current oversupply issue. However, the sector’s performance will be limited by the persistent oversupply of office space totalling 5.7 mn SQFT in the NMA. Investment opportunity lies in Westlands, Gigiri and Karen offering relatively higher returns compared to the market average
- Retail Sector
The table below shows the performance of the retail sector performance in Nairobi Metropolitan Area from H1’2024 to H1’2025;
|
All values are in Kshs unless stated otherwise |
||||||
|
Cytonn Report: Summary of Retail Sector Performance in Nairobi Metropolitan Area H1’2024 - H1’2025 |
||||||
|
Item |
H1’2024 |
Q3'2024 |
FY'2024 |
Q1’2025 |
H1’2025 |
Y/Y 2025 ∆ |
|
Average Asking Rents (Kshs/SQFT) |
185.0 |
184.7 |
182.5 |
182.5 |
185.5 |
0.2% |
|
Average Occupancy (%) |
79.5% |
81.4% |
82.0% |
81.8% |
83.3% |
3.8% |
|
Average Rental Yields |
8.2% |
8.2% |
8.4% |
8.3% |
8.5% |
0.3% |
Source: Cytonn Research
The key take-outs from the table include;
- Average Occupancy Rate - In H1’2025, the retail sector witnessed a notable uptick in average occupancy rates, increasing by 3.8%-points to reach 83.3%, compared to the 79.5% recorded in the same period of 2024. This surge can be attributed to several key factors: i) vigorous expansion endeavors undertaken by both domestic and international retailers such as Naivas, QuickMart, Carrefour, and Magunas, ii) sustained demand for consumer goods and services, buoyed by favorable demographic trends, iii) adaptation to evolving market dynamics, exemplified by initiatives like Jaza Stores and Carrefour allowing purchases to be made online via platforms like Whatsapp, aligning with shifting consumer preferences, and, iv) ongoing improvements in infrastructure not only bolstering existing retail spaces but also unlocking new regions for retail growth opportunities, thus broadening the scope of the sector's expansion,
- Asking Rents - In H1’2025, there was a slight increase in average rental rates per SQFT, climbing by 0.2% to Kshs 185.5, up from Kshs 185.0 in H1’2024. This increase was driven by several key factors: i) the continued demand for premium retail spaces in strategic areas within the Nairobi Metropolitan Area (NMA), such as Karen, Kilimani, Westlands, and along Kiambu and Limuru roads. These locations, known for their quality offerings, attracted both local and foreign businesses seeking proximity to multinational organizations and embassies, serving an international clientele, ii) a limited supply of new retail space in prime locations, tightening availability and boosting demand for existing space, iii) continued recovery in consumer footfall and retail activity following economic stabilization efforts, and iv) the entry of renowned global brands like Adidas, Puma, Michael Kors, and Aldo into the Kenyan market, competing for prime retail spaces and further driving up rental rates, and,
- Average Rental Yield- The average rental yield for the NMA retail sector improved by 0.3%-points to 8.5% in H1’2025, from 8.2% in H1’2024, as a result of improved asking rents and occupancy rates.
In terms of sub-market performance, Kilimani, Karen, and Mombasa Road demonstrated impressive average rental yields of 10.0%, 9.6%, and 9.1% respectively, outpacing the overall market average of 8.5%. This strong performance was largely driven by the increased demand for retail offerings in the above locations, as well as the presence of top-tier retail spaces commanding higher rents, coupled with the provision of quality infrastructure services enhancing the attractiveness for both tenants and customers. Conversely, retail spaces in Eastlands reported the lowest average rental yield at 7.4%, influenced by several factors: i) rental rates significantly below the market average of Kshs 185 per SQFT, standing at Kshs 161 per SQFT resulting from the presence of lower quality spaces in the region, ii) inadequate infrastructure across most towns within the region, hindering accessibility and sustainability for retail spaces, and, iii) the prevalence of informal retail spaces and service stations, offering competitive rates and diverse amenities, intensifying market competition and impacting demand.
The following table illustrates the submarket performance of nodes within the Nairobi Metropolitan Area (NMA) in H1’2025;
|
(All values in Kshs unless stated otherwise) |
|||||||||
|
Cytonn Report: Nairobi Metropolitan Area Retail Market Performance H1’2025 |
|||||||||
|
Area |
Rent Kshs/SQFT H1’2025 |
Occupancy% H1’2025 |
Rental Yield H1’2025 |
Rent Kshs/SQFT H1’2024 |
Occupancy% H1’2024 |
Rental Yield H1’2024 |
∆ in Rental Rates |
∆ in Occupancy (% points) |
H1’2025 ∆ in Rental Yield (% points) |
|
Kilimani |
198 |
84.2% |
10.0% |
198 |
81.2% |
9.7% |
0.0% |
3.0% |
0.3% |
|
Karen |
218 |
92.3% |
9.6% |
218 |
84.0% |
9.3% |
0.0% |
8.3% |
0.3% |
|
Mombasa road |
178 |
85.5% |
9.1% |
169 |
79.6% |
8.2% |
5.7% |
5.9% |
0.9% |
|
Kiambu road & Limuru Road |
187 |
77.0% |
8.7% |
205 |
75.2% |
9.0% |
(8.9%) |
1.8% |
(0.3%) |
|
Ngong Road |
191 |
86.9% |
8.3% |
175 |
81.5% |
7.5% |
9.1% |
5.4% |
0.8% |
|
Thika Road |
168 |
80.3% |
7.9% |
187 |
79.3% |
7.4% |
(10.2%) |
1.0% |
0.5% |
|
Westlands |
239 |
79.4% |
7.6% |
239 |
79.4% |
7.1% |
0.0% |
0.0% |
0.5% |
|
Satellite towns |
142 |
87.6% |
7.6% |
139 |
79.0% |
6.8% |
2.2% |
8.6% |
0.7% |
|
Eastlands |
161 |
78.9% |
7.4% |
146 |
77.7% |
6.4% |
10.3% |
1.2% |
1.0% |
|
Average |
185 |
83.3% |
8.5% |
185 |
79.5% |
7.9% |
0.9% |
3.9% |
0.6% |
Source: Cytonn Research
For more notable developments during H1’2025 please visit our Q1’2025 market review report, Cytonn Monthly_April 2025, and Cytonn Monthly_May 2025
We maintain a NEUTRAL outlook on the retail sector’s performance, which is anticipated to be influenced by several key drivers: i) continued aggressive expansion efforts by both local and foreign retailers, as they seek to secure new and existing spaces to capitalize on evolving consumer preferences and market dynamics, ii) ongoing advancements in public infrastructure, including road and railway projects, are expected to enhance accessibility to new areas for retail investments, stimulating further growth opportunities, and, iii) positive demographic trends, characterized by a growing population, are anticipated to underpin increasing demand for retail goods and services. However, the sector's growth momentum may face headwinds from certain negative factors, including: i) escalating adoption of e-commerce by retailers, which continues to erode traditional occupier demand for physical retail spaces, necessitating innovative strategies to adapt to changing consumer shopping habits, and, ii) limited access to and expensive financing from financial institutions for retail developments, coupled with the imperative for small and medium-sized enterprises (SMEs) to invest in technological advancements to enhance operational efficiency and competitiveness in the market.
- Hospitality Sector
During H1’2025, the following Industry Reports related to the Hospitality sector was released, namely;
|
Cytonn Report: Released Industry Report related to Hospitality Sector H1’2025 |
||
|
# |
Report |
Key Take-outs |
|
1 |
Leading Economic Indicators (LEI) April 2024 Report by the Kenya National Bureau of Statistics (KNBS) |
· In April 2025, the number of international visitor arrivals through Jomo Kenyatta International Airport (JKIA) and Moi International Airport (MIA) was 169,230, reflecting an 0.4% increase from the 168,563 arrivals recorded in March 2025.
· On a year-on-year basis, April 2025 arrivals represent a 63.7% increase compared to 103,362 in April 2024, indicating a continued rebound in tourism activity. For more information, please visit our Cytonn Weekly #25.2025, |
|
2 |
CEO’s Survey Report by Central Bank of Kenya |
· The Central Bank of Kenya released its monthly CEO’s survey report, where 61.0% of respondents said that they were impacted by the recent US tariffs and other policy changes. Stakeholders in the hospitality sector have expressed the negative impacts that President Trump’s policies and tariffs have had on the sector, with hotels reporting lower conference bookings from donor funded programs and Non-Governmental Organizations. For more information, please visit our Cytonn Weekly #25.2025, |
Source; Cytonn Research
Additionally, during week, we had the following highlights relating to the hospitality sector;
- Kenya Airways has inked a code-sharing pact with Qatar Airways
During the week, the National carrier, Kenya Airways has inked a code-sharing pact with Qatar Airways, allowing the latter to introduce a third daily frequency between Doha and Nairobi while Kenya Airways will launch Qatar Airways-marketed flights between Mombasa and Doha during the coming winter season. This agreement makes Qatar Airways the 15th codeshare partner of the local carrier in a growing list that has seen Kenya Airways widen its global route network.
The MOU signing follows Kenya Airways' receipt of four top honors at the 2025 World Travel Awards Africa. For the fourth consecutive year, Kenya Airways was named Africa’s Leading Airline 2025 as well as Africa's Leading Airline, Business Class 2025 and Africa's Leading Inflight Magazine 2025, Msafiri.
Code-sharing refers to a deal between two or more airlines to sell seats for the same flight, meaning passengers enjoy benefits such as purchase of a single ticket, a single check-in and seamless connections at transit points. This move will have immense benefits on Kenya’s hospitality sector which includes;
- Increased International arrivals where code sharing will allow travellers to access one ticket, multi destination routes that include Kenya, even if they book through a foreign airline. Moreover, this will foster connectivity to secondary markets such as Asia. With increased international arrivals, Kenya’s hospitality sector will experience high hotel occupancy rates, especially in Nairobi, Mombasa and Maasai Mara,
- Increased business travel volumes where corporate travellers will benefit from easier connections to Nairobi and other regional hubs. This will also enable Kenya to become more accessible for conferences, investment summits and other corporate events. This will lead to more bookings in business-class hotels, serviced apartments and conference venues.
- Attracting luxury and wellness tourists: Qatar Airways caters to high-income travellers, who may be drawn to Kenya’s luxury safari lodges, golf resorts or wellness retreats. This will lead to greater profitability for premium hotels and safari properties. Moreover, hospitality companies will be incentivized to upgrade services, sustainability and concierge experiences.
The agreement between Kenya Airways and Qatar Airways has positioned Kenya’s hospitality sector for significant growth by enhancing global connectivity, especially from high-potential markets in Asia, the Middle East, and Europe. By simplifying travel logistics and expanding access to coastal and inland destinations, the partnership is expected to boost international arrivals, increase hotel occupancy rates, and diversify the tourist profile. This presents a strategic opportunity for local hospitality players to innovate, upgrade service quality, and align with global standards to meet evolving traveler expectations.
- Nairobi has been named Africa’s Leading Business Travel Destination 2025 at the 32nd World Travel Awards.
During the week, Kenya’s capital, Nairobi, has been named Africa’s Leading Business Travel Destination 2025 at the 32nd World Travel Awards. This marks Nairobi’s seventh consecutive win in the category, maintaining its dominant position since first clinching the title in 2019. Nairobi has been nominated in the category alongside Accra, Cairo, Cape Town and Lagos.
Nairobi’s success streak in the category can be attributed to MICE excellence where Nairobi has heavily invested in Meetings, Incentives, Conferences and Exhibitions including venues such as Kenyatta International Convention Centre, Safari Park Hotel and International conference centre. Additionally, Nairobi is renowned for its Business hub status since it is home to regional headquarters for the United Nations, Microsoft, World Bank and other major multinationals.
Nairobi’s victory in this award will have a positive impact on the hospitality sector. They include;
- Boost in Business Travel Demand: With hotels such as Sarova Stanley winning awards the World Travel Awards, there will be increased bookings in such hotels due to its increased demand for executive suites and city centre properties. This will eventually lead to increased occupancy rates.
- Increased investor confidence in Hospitality sector: The award raises Nairobi’s profile as a viable investment destination for hotel chains, conference centres and mixed-use developments, that is, business parks with hotels.
- MICE Sector growth: Nairobi is poised to attract more regional and global conferences, trade fairs and expositions. Facilities such as KICC will help Kenya attract high spending international delegates, policy forums and trade expositions.
Nairobi’s recognition as Africa’s Leading Business Travel Destination 2025 is more than just an accolade is a strategic advantage for Kenya’s hospitality sector. The award solidifies Nairobi’s reputation as a premium destination for corporate events, executive travel, and international business dealings. In turn, it opens the door to greater hotel bookings, investment inflows, and international visibility. To fully harness this momentum, stakeholders in the hospitality and tourism space must invest in quality, innovation, and seamless service delivery.
- African Hotel Development inks agreement Aleph Hospitality
During the week, lifestyle hotel group, African Hotel Development, has entered a management agreement with Aleph Hospitality for 26 ONOMO branded hotels across 14 African countries. ONOMO Hotels is a brand managed by the African Hotel Development and it focuses on providing quality accommodation and aims to be a key player in the African lifestyle hotel sector. This strategic move is part of African Hotel Development’s business realignment strategy. Additionally, the move also allows the company to focus on brand development and asset management, while accelerating the expansion of ONOMO’s footprint, with the objective of doubling the brand’s scale within five years. Aleph Hospitality brings a strong track record in managing third-party hotels in Africa, which is expected to boost operational efficiency, revenue management, and global distribution for ONOMO properties.
Its impact on Kenya’s hospitality sector include; (i) Boost to business travel and Meetings, Incentives, Conferences and Exhibitions (MICE) tourism. With Nairobi named Africa’s Leading Business Travel Destination 2025, ONOMO’s presence enhances the city’s appeal for business travelers. The hotels are well-positioned to support Kenya’s growing Meetings, Incentives, Conferences and Exhibitions industry, (ii) Improved Brand and Service Standards. Aleph’s entry into the management of ONOMO hotels will likely improve international service standards, making Kenyan ONOMO properties more attractive to global corporate clients and international travelers, (iii) Job creation and skills transfer. The deal will likely spur employment opportunities, both in direct hotel operations and ancillary services. Moreover, Aleph’s presence promises training and upskilling of Kenyan hospitality professionals to meet global standards, (iv) Increased investor confidence. The entry of Aleph, a globally recognized hotel management firm, signals confidence in Kenya’s hospitality market, possibly encouraging more foreign direct investment in the tourism and real estate sectors.
For Kenya, this development is expected to elevate service standards, expand midscale accommodation offerings, and reinforce Nairobi’s position as a premier business travel and MICE destination. As global and regional business travel continues to recover, such partnerships will play a critical role in shaping a more competitive, professional, and interconnected hospitality landscape across the continent.
For more notable developments during H1’2025 please visit our Q1’2025 market review report, Cytonn Monthly_April 2025, and Cytonn Monthly_May 2025
We maintain a POSITIVE outlook for the hospitality sector in the upcoming quarter, with several factors expected to provide support: i) intensive marketing efforts aimed at promoting Kenya’s tourism market, which are anticipated to result in improved tourist arrivals, bolstering occupancy rates for hospitality establishments, ii) positive accolades accorded to Kenya’s tourism industry on the international stage, enhancing the country's reputation as a preferred tourist destination and attracting more visitors, iii) collaborative partnerships within the tourism sector aimed at fostering growth and innovation, leveraging synergies to capitalize on emerging opportunities, iv) supportive events such as the 2025 World Rally Championship and initiatives within the hospitality sector aimed at boosting tourism activity and enhancing guest experiences, v) direct flights from Dubai to Mombasa by FlyDubai, which is expected to increase accessibility and attract tourists from key markets, and vi) increased promotion of local tourism initiatives by the Ministry of Tourism under its Tourism Strategy 2021-2025, emphasizing domestic tourism as a key priority for stimulating sectoral growth. However, the sector may face challenges stemming from: i) cautionary statements issued by US Embassy to its citizens in Kenya in March 2025, which may impact international tourist arrivals and dampen demand for hospitality services, and ii) difficulty in accessing finance, as lenders may demand more collateral to mitigate elevated credit risk, potentially limiting investment in hospitality infrastructure and expansion projects.
- Land Sector
During the period under review, the land sector in Nairobi Metropolitan Area (NMA) recorded a price appreciation of 2.7% to Kshs 130.9 mn from 128.9 mn. This performance was supported by;
- The growing demand for land in the Nairobi Metropolitan Area (NMA) is driven by a rising population, as individuals from various regions of the country migrate annually in search of employment, education, and other opportunities,
- The fixed supply of land has intensified demand, particularly for residential and commercial purposes, leading to an increase in land prices,
- There is an expanding middle class in the NMA with disposable income, willing to invest in land as a savings and investment option,
- The government's ongoing infrastructural development projects, such as roads, sewers, railways, and water connections, are opening up more satellite towns, subsequently driving land prices upward,
- The widely held belief among the middle class that land represents a secure form of wealth has prompted many families to save specifically for land acquisition, and,
- The government’s Affordable Housing Program, under the Bottom-Up Economic Transformation Agenda (BETA), has initiated construction projects across various parts of Nairobi and the country, further increasing land values due to heightened construction activity.
Overall Performance:
Un-serviced land in Satellite Towns registered the highest capital appreciation during the period under review, with an annual capital appreciation of 4.5%, where the average selling price rose to Kshs 16.1 mn from Kshs 15.4 mn recorded in H1’2024. The performance in this segment can be attributed to several factors: i) relatively lower prices, with the average selling prices at Kshs 16.1 mn compared to the market average of Kshs 130.9 mn in the Nairobi Metropolitan Area (NMA), ii) a growing middle class willing to invest in Satellite Towns as they settle their families, iii) the anticipation of price increases once various services are introduced in these areas, and iv) the desire to settle in areas free from the city's hustle .On the other hand, land in Nairobi Suburbs under the Commercial Areas recorded the least movement with an annual capital appreciation of 1.0%, below the market average of 2.7%. This was mainly due to the high selling prices, which averaged Kshs 396.4 mn, relatively higher than the market average of Kshs 131.1 mn. The table below shows the overall performance of the sector across all land sub-sectors during H1’2025;
|
|
H1’2024 |
H1’2025 |
Annualized Capital Appreciation |
|
Un-serviced land-satellite Towns |
15.4 mn |
16.1 mn |
4.5% |
|
Nairobi Suburbs- High Rise Residential Areas |
82.3 mn |
85.3 mn |
3.5% |
|
Serviced land-Satellite Towns |
18.7 mn |
19.3 mn |
3.2% |
|
Nairobi Suburbs (Low Rise & High Residential Areas) |
135.7 mn |
137.3 mn |
1.2% |
|
Nairobi Suburbs- Commercial Areas |
392.6 mn |
396.4 mn |
1.0% |
|
Average |
128.9 mn |
130.9 mn |
2.7% |
Source: Cytonn Research
Sub-markets Performance – For the unserviced satellite towns, Juja, Limuru, and Utawala emerged as the best-performing nodes with annualized capital appreciation of 6.3%, 5.7% and 4.8%, respectively. This performance can be attributed to: i) good transport network connecting these areas to Nairobi ii) a rising middle class looking to settle in these areas, iv) good proximity to retail centers such as malls, and v) relatively affordable prices compared to the market average. Additionally, land in unserviced towns presents a good opportunity for speculative investors, who invest in anticipation of price appreciation. On the other hand, Commercial Areas in Nairobi’s Suburbs registered the least average price movement, with Kilimani recording a appreciation of 0.4%. The segment had the highest price per acre, with the average selling price coming in at Kshs 396.4 mn, significantly higher than the market average of Kshs 130.9 mn. Notably, some areas in this segment, such as Kilimani, are witnessing an influx of high-rise apartments, which has made them less attractive. The table below shows NMA’s land performance by submarkets in H1’2025;
|
Price in Kshs per Acre |
|||
|
Cytonn Report: Nairobi Metropolitan Area Land Performance by Submarkets – H1’2025 |
|||
|
Location |
Price H1’2024 |
Price H1’2025 |
Capital Appreciation |
|
Satellite Towns - Unserviced Land |
|||
|
Juja |
15.5 mn |
15.9 mn |
6.3% |
|
Limuru |
24.8 mn |
24.8 mn |
5.7% |
|
Utawala |
16.7 mn |
17.5 mn |
4.8% |
|
Rongai |
16.4 mn |
17.1 mn |
4.2% |
|
Athi River |
5.2 mn |
5.3 mn |
1.3% |
|
Average |
15.4 mn |
16.1 mn |
4.5% |
|
Satellite Towns - Serviced Land |
|||
|
Rongai |
17.1 mn |
18.3 mn |
7.1% |
|
Athi River |
15.5 mn |
16.0 mn |
3.3% |
|
Ruai |
12.4 mn |
12.8 mn |
3.2% |
|
Ruiru & Juja |
28.1 mn |
20.8 mn |
1.3% |
|
Syokimau |
20.5 mn |
28.7 mn |
2.2% |
|
Average |
18.7 mn |
19.3 mn |
3.2% |
|
Nairobi Middle End Suburbs – High Rise Residential Areas |
|||
|
Kasarani |
82.2 mn |
86.7 mn |
5.2% |
|
Embakasi |
79.2 mn |
83.1 mn |
4.6% |
|
Dagoretti |
85.6 mn |
86.2 mn |
0.7% |
|
Average |
82.3 mn |
85.3 mn |
3.5% |
|
Nairobi High End Suburbs (Low- and High-Rise Areas) |
|||
|
Kileleshwa |
296.2 mn |
308.7 mn |
4.2% |
|
Ridgeways |
87.0 mn |
90.1 mn |
3.6% |
|
Runda |
87.9 mn |
89.3 mn |
1.7% |
|
Kitisuru |
95.0 mn |
96.4 mn |
1.4% |
|
Spring Valley |
176.5 mn |
175.7 mn |
(0.5%) |
|
Karen |
63.6 mn |
63.9 mn |
(2.8%) |
|
Average |
135.7 mn |
137.3 mn |
1.2% |
|
Nairobi Suburbs - Commercial Zones |
|||
|
Westlands |
413.2 mn |
419.7 mn |
1.6% |
|
Riverside |
323.0 mn |
327.4 mn |
1.4% |
|
Upperhill |
458.1 mn |
461.3 mn |
0.7% |
|
Kilimani |
375.9 mn |
377.3 mn |
0.4% |
|
Average |
392.6 mn |
396.4 mn |
1.0% |
Source: Cytonn Research
We maintain a POSITIVE outlook for the land sector in the Nairobi Metropolitan Area (NMA), considering it a dependable investment opportunity that has shown improving performance year on year. Going forward, we expect the sector's performance to be driven by several factors: i) government efforts to streamline land transactions through innovative solutions such as Ardhi Sasa, ii) continued activities by players on both the demand and supply sides, iii) growing demand for land driven by positive demographics, iv) the launch of infrastructure development projects opening up satellite towns for investment opportunities, and v) the continued rollout of the Affordable Housing Program (AHP) by the government, driving further demand for land.
- Infrastructure Sector
The Kenyan governments continues to demonstrate commitment to improve infrastructure around the country by launching and progressing several key projects across the nation, with a special focus on road networks during the year. These road projects continue to enhance connectivity that supports trading activities, draws investments in various sectors and promotes economic growth.
Key highlights during the month;
- Kenya’s road infrastructure agenda suffered a blow after the National Treasury slashed Kshs 11.7 bn from the road construction budget in the current fiscal year’s third supplementary estimates. The revised allocation, presented by Treasury, reduces funding for capital road development to Kshs 124.6 bn in FY’26/25, from Kshs 136.4 bn in FY’24/25, reflecting an 8.6% budget cut driven by below-target revenue performance as the government tries to navigate the current tight budgetary space. For more information, please visit our Cytonn Weekly #25.2025,
- The treasury highlighted that Kenya is set to initiate KShs 70.0 bn in Public-Private Partnership (PPP) deals starting July 1, 2025, to address its pressing infrastructure financing needs. These ambitious projects, modelled after large-scale, privately initiated proposals akin to those previously pursued, target critical sectors such as energy, transport, and water, which are foundational to the real estate industry. For more information, please visit our Cytonn Weekly #24.2025,
For more notable developments during H1’2025 please visit our Q1’2025 market review report, Cytonn Monthly_April 2025, and Cytonn Monthly_May 2025
We maintain a POSITIVE outlook due to the government continued efforts to improve infrastructure in the country more so in road and transport sector in line with its BETA agenda and economic stimulation goal. However, this may be slowed down by the reduction in allocation to state department of roads by 8.6% in the supplementary budget FY’2026/25,to Kshs 124.6 bn from the Kshs 136.4 bn set in the H1’2024/25 budget. Consequently, we anticipate that going forward, there will be a decline in the number of infrastructure projects completed, while the number of stalled infrastructure projects across the country is expected to continue rising due financial constraints. Although the government acknowledges the importance of Public-Private Partnerships (PPPs) in tackling financing challenges, we believe that prioritizing PPPs is fundamental in addressing funding shortfalls. By leveraging the resources and expertise of the private sector, PPPs can support sustainable infrastructure development and stimulate economic growth.
- Real Estate Investments Trusts (REITs)
On the Unquoted Securities Platform, Acorn D-REIT and I-REIT traded at Kshs 25.4 and Kshs 22.2 per unit, respectively, as per the last updated data on 27th June 2025. The performance represented a 27.0% and 11.0% gain for the D-REIT and I-REIT, respectively, from the Kshs s 20.0 inception price. The volumes traded for the D-REIT and I-REIT came in at Kshs s 12.3 mn and Kshs 31.6 mn shares, respectively, with a turnover of Kshs 311.5 mn and Kshs 702.7 mn, respectively, since inception in February 2021. Additionally, ILAM Fahari I-REIT traded at Kshs 11.0 per share as of 27th June 2025, representing a 45.0% loss from the Kshs 20.0 inception price. The volume traded to date came in at 138,600 shares for the I-REIT, with a turnover of Kshs 1.5 mn since inception in November 2015.
REITs offer various benefits, such as tax exemptions, diversified portfolios, and stable long-term profits. However, the ongoing decline in the performance of Kenyan REITs and the restructuring of their business portfolios are hindering significant previous investments. Additional general challenges include:
- Insufficient understanding of the investment instrument among investors leading to a slower uptake of REIT products,
- Lengthy approval processes for REIT creation,
- High minimum capital requirements of Kshs 100.0 mn for REIT trustees compared to Kshs 10.0 mn for pension funds Trustees, essentially limiting the licensed REIT Trustee to banks only
- The rigidity of choice between either a D-REIT or and I-REIT forces managers to form two REITs, rather than having one Hybrid REIT that can allocate between development and income earning properties
- Limiting the type of legal entity that can form a REIT to only a trust company, as opposed to allowing other entities such as partnerships, and companies,
- We need to give time before REITS are required to list – they would be allowed to stay private for a few years before the requirement to list given that not all companies maybe comfortable with listing on day one, and,
- Minimum subscription amounts or offer parcels set at Kshs 0.1 mn for D-REITs and Kshs 5.0 mn for restricted I-REITs. The significant capital requirements still make REITs relatively inaccessible to smaller retail investors compared to other investment vehicles like unit trusts or government bonds, all of which continue to limit the performance of Kenyan REITs.
We expect Kenya’s Real Estate sector to remain on a growth trend, supported by: i) demand for housing sustained by positive demographics, such as urbanization and population growth rates of 3.8% p.a and 2.0% p.a, respectively, against the global average of 1.7% p.a and 0.9% p.a, respectively, as at 2023,, ii) activities by the government under the Affordable Housing Program (AHP) iii) heightened activities by private players in the residential sector iv) increased investment by local and international investors in the hospitality and industrial sector,v) improved infrastructure throughout the country. However, challenges such as rising construction costs, strain on infrastructure development (including drainage systems), high capital requirements for REITs, and existing oversupply in select Real Estate sectors will continue to hinder the sector’s optimal performance by limiting developments and investments.
Real Estate Performance Summary and Outlook
Below is a summary of the sectorial performance in H1’2025 and investment opportunities:
|
Theme |
Cytonn Report: Thematic Performance and Outlook H1’ 2025 |
Outlook |
|
Residential |
|
Neutral |
|
||
|
Commercial Office |
|
Neutral |
|
||
|
Retail |
· The average rental yield for the NMA retail sector improved by 0.3%-points to 8.5% in H1’2025, from 8.2% in H1’2024, as a result of improved asking rents and occupancy rates.
|
Neutral |
|
||
|
Hospitality |
· In April 2025, the number of international visitor arrivals through Jomo Kenyatta International Airport (JKIA) and Moi International Airport (MIA) was 169,230, reflecting an 0.4% increase from the 168,563 arrivals recorded in March 2025.
· On a year-on-year basis, April 2025 arrivals represent a 63.7% increase compared to 103,362 in April 2024, indicating a continued rebound in tourism activity. For more information, please visit our Cytonn Weekly #25.2025, · The Central Bank of Kenya released its monthly CEO’s survey report, where 61.0% of respondents said that they were impacted by the recent US tariffs and other policy changes. Stakeholders in the hospitality sector have expressed the negative impacts that President Trump’s policies and tariffs have had on the sector, with hotels reporting lower conference bookings from donor funded programs and Non-Governmental Organizations. For more information, please visit our Cytonn Weekly #25.2025, · We maintain a NEUTRAL outlook for the hospitality sector in the upcoming quarter, with several factors expected to provide support: i) intensive marketing efforts aimed at promoting Kenya’s tourism market, which are anticipated to result in improved tourist arrivals, bolstering occupancy rates for hospitality establishments, ii) positive accolades accorded to Kenya’s tourism industry on the international stage, enhancing the country's reputation as a preferred tourist destination and attracting more visitors, iii) collaborative partnerships within the tourism sector aimed at fostering growth and innovation, leveraging synergies to capitalize on emerging opportunities, iv) supportive events such as the 2025 World Rally Championship and initiatives within the hospitality sector aimed at boosting tourism activity and enhancing guest experiences, v) direct flights from Dubai to Mombasa by FlyDubai, which is expected to increase accessibility and attract tourists from key markets, and vi) increased promotion of local tourism initiatives by the Ministry of Tourism under its Tourism Strategy 2021-2025, emphasizing domestic tourism as a key priority for stimulating sectoral growth. However, the sector may face challenges stemming from: i) policy changes by USA as outlined in the CBK CEO’s Report releases within the year, and ii) difficulty in accessing finance, as lenders may demand more collateral to mitigate elevated credit risk, potentially limiting investment in hospitality infrastructure and expansion projects. |
Positive |
|
Infrastructure |
· Kenya’s road infrastructure agenda suffered a blow after the National Treasury slashed Kshs 11.7 bn from the road construction budget in the current fiscal year’s third supplementary estimates. The revised allocation, presented by Treasury, reduces funding for capital road development to Kshs 124.6 bn in FY’26/25, from Kshs 136.4 bn in FY’24/25, reflecting an 8.6% budget cut driven by below-target revenue performance as the government tries to navigate the current tight budgetary space. For more information, please visit our Cytonn Weekly #25.2025 · The treasury highlighted that Kenya is set to initiate KShs 70.0 bn in Public-Private Partnership (PPP) deals starting July 1, 2025, to address its pressing infrastructure financing needs. These ambitious projects, modelled after large-scale, privately initiated proposals akin to those previously pursued, target critical sectors such as energy, transport, and water, which are foundational to the real estate industry. For more information, please visit our Cytonn Weekly #24.2025 · We maintain a POSITIVE outlook due to the government continued efforts to improve infrastructure in the country more so in road and transport sector in line with its BETA agenda and economic stimulation goal. However, this may be slowed down by the reduction in allocation to state department of roads by 8.6% in the supplementary budget FY’2026/25,to ksh 124.6 bn from the ksh136.4 bn set in the H1’2024/25 budget. Consequently, we anticipate that going forward, there will be a decline in the number of infrastructure projects completed, while the number of stalled infrastructure projects across the country is expected to continue rising due financial constraints. Although the government acknowledges the importance of Public-Private Partnerships (PPPs) in tackling financing challenges, we believe that prioritizing PPPs is fundamental in addressing funding shortfalls. By leveraging the resources and expertise of the private sector, PPPs can support sustainable infrastructure development and stimulate economic growth. |
Positive |
|
Land |
|
Positive |
Disclaimer: The views expressed in this publication are those of the writers where particulars are not warranted. This publication, which is in compliance with Section 2 of the Capital Markets Authority Act Cap 485A, is meant for general information only and is not a warranty, representation, advice or solicitation of any nature. Readers are advised in all circumstances to seek the advice of a registered investment advisor.

- Talk to us
- Kenya
- P.O Box 20695 - 00200, Nairobi, Kenya
- Cell +254709101200
- Tel +254709101200
- WhatsApp +254741676635
- United States
- +254709101200
- DOWNLOAD OUR APP
-


- Kenya
- 8th Floor, Pinetree Plaza, Kaburu Drive, Ngong Road, Nairobi, Kenya
- USA
- Suite 1150, 1775 Eye Street NW, USA, Washington DC 20006, USA
- Investments
- High Yield
- Private Equity
- Real Estate
- Real Estate
- RiverRun Estates
- Cytonn Towers
- The Ridge
- Taraji Heights
- The Alma