Development Financing in Real Estate in Kenya 2026, & Cytonn Weekly #18/2026
By Research Team, May 10, 2026
Executive Summary
Fixed Income
During the week, T-bills were oversubscribed for the first time in four weeks, with the overall subscription rate coming in at 122.6%, higher than the subscription rate of 77.0%, recorded the previous week. Investors’ preference for the shorter 91-day paper persisted, with the paper receiving bids worth 9.7 bn against the offered Kshs 4.0 bn, translating to a subscription rate of 243.5%, higher than the subscription rate of 200.6%, recorded the previous week. The subscription rate for the 182-day paper increased significantly to 145.2% from 32.6% recorded the previous week, while that of the 364-day paper decreased to 51.6% from 71.9% recorded the previous week. The government accepted a total of Kshs 29.41 bn worth of bids out of Kshs 29.42 bn bids received, translating to an acceptance rate of 99.98%. The yields on the government papers showed mixed performance with the yields on the 91-day paper increasing the most by 15.0 bps to 8.2% from the 8.0% recorded the previous week. The yields on the 364-day paper also increased by 0.1 bps to remain relatively unchanged from the 8.5% recorded the previous week, while the yields on the 182-day paper decreased by 0.2 bps to remain relatively unchanged from the 8.2% recorded the previous week;
During the week, the Central Bank of Kenya released the auction results for the re-opened treasury bonds FXD1/2012/020, FXD1/2019/020 and FXD1/2021/025 with tenors to maturities of 7.6 years,13.2 years and 20.0 years respectively and fixed coupon rates of 12.0%, 12.9%, and 13.9% respectively. The bonds were oversubscribed, with the overall subscription rate coming in at 132.5%, receiving bids worth Kshs 106.0 bn against the offered Kshs 80.0 bn. The government accepted bids worth Kshs 94.0 bn, translating to an acceptance rate of 88.7%. The weighted average yield for the accepted bids for the FXD1/2012/020, FXD1/2019/020 and FXD1/2021/025 came in at 12.5%, 13.2% and 13.7% respectively. Notably, the 13.2% and 13.7% yield on FXD1/2019/020 and FXD1/2021/025 respectively were higher than the 12.7% and 12.9% recorded at the last reopening in March 2026, while the 12.46% yield on FXD1/2012/020 was lower 12.47% recorded at its last reopening in November 2025. With the Inflation rate at 5.6% as of April 2026, the real returns of the FXD1/2012/020, FXD1/2019/020 and FXD1/2021/025 are 6.9%, 7.6% and 8.1% respectively. Given the 10.0% withholding tax on the bonds, the tax equivalent yields for shorter term bonds with 15.0% withholding tax are 13.2%, 14.0% and 14.5% for the FXD1/2012/020, FXD1/2019/020 and FXD1/2021/025 respectively;
During the week, Stanbic Bank released its monthly Purchasing Manager’s Index (PMI) indicating that Kenya’s Purchasing Managers’ Index (PMI) rose to 49.4 in April 2026 from 47.7 in March 2026, signaling a slower pace of contraction in private sector activity, although remaining below the 50.0 neutral threshold for the second consecutive month;
Equities
During the week, the equities market recorded a mixed performance, with NASI gaining the most by 2.1% followed by NSE 25 and NSE 10 both gaining by 0.6%, while NSE 20 declined by 0.4%, taking the YTD performance to gains of 12.5%, 11.9%, 11.4% and 8.7% for NSE 20, NSE 25, NASI and NSE 10 respectively. The week-on-week equities market performance was driven by gains recorded by large-cap stocks such as Safaricom, Equity and Stanbic of 8.4%, 1.7% and 1.4% respectively. The performance was however weighed down by losses recorded by large cap stocks such as Absa, Co-op bank and Stanchart of 7.9%, 6.1% and 4.6% respectively;
During the week, the banking sector index declined by 0.2% to 232.0 from 236.1 recorded the previous week. This is attributable to losses recorded by large cap stocks such as Absa, Co-op bank and Stanchart of 7.9% ,6.1% and 4.6% respectively. However, the performance was supported by gains recorded by large cap stocks such as Safaricom, Equity and Stanbic of 8.4%, 1.7% and 1.4% respectively;
During the week, Stanbic Bank Kenya released Q1’2026 financial results, Profit after Tax increased by 5.5% to Kshs 3.5 bn from the Kshs 3.3 bn recorded in Q1’ 2025 mainly driven by 4.3% increase in total operating income to Kshs 10.0 bn, from Kshs 9.5 bn in Q1’2025 coupled with the 7.8% decrease in total operating expense to Kshs 5.0 bn, from Kshs 5.5 bn in Q1’ 2025. The decrease in Operating expenses was largely driven by the 59.1% decrease in loan loss provision to Kshs 0.4 bn, from Kshs 0.9 bn in Q1’2025;
Also during the week, Safaricom Plc released its FY’2026 financial results for the period ending 31st March 2026, highlighting that the profit after tax (PAT) for the Group increased by 61.0% to Kshs 73.7 bn, from 45.8 bn recorded in FY’2025, largely attributable to a 10.0% increase in Total Revenue to Kshs 427.6 bn from Kshs 388.7 bn recorded in FY’2025, coupled with a 4.3% decrease in operating costs to Kshs 207.3 bn in FY’2026 from Kshs 216.5 bn in FY’2025;
Real Estate
During the week, Kenya Mortgage Refinancing Company set a fixed coupon rate of 12.2% for its Ksh 3.0 bn green bond, which is part of a larger Kshs 10.5 bn bond programme. The eight-year note opened on April 28, 2026, and will close on May 12, 2026 with trading at the Nairobi Securities Exchange expected to begin on May 25, 2026;
During the week, Centum Real Estate partnered with KCB Bank Kenya to offer discounted fixed-rate mortgages aimed at increasing sales of its housing units. The mortgages will carry an 8.9% fixed interest rate for periods of up to 25 years, which is lower than the 11.0% to 15.0% rates commonly charged by commercial banks as of March 2026;
During the week, a Chinese firm, China Wu Yi Company Limited, secured a Kshs 7.5 bn contract to reconstruct and realign the dangerous Nithi Bridge section along the Kenol–Marua dual carriageway. The project will cover a 2.7 km stretch between Marima and Mitheru shopping centres, with the new bridge expected to span 880 metres;
On the Unquoted Securities Platform Acorn D-REIT and I-REIT traded at Kshs 27.4 and Kshs 23.2per unit, respectively, as per the last updated data on 10th April 2026. The performance represented a 33.4% and 14.5% gain for the D-REIT and I-REIT, respectively, from the Kshs 20.0 inception price. The volumes traded for the D-REIT and I-REIT came in at 13.4 mn and 42.2 mn shares, respectively. Additionally, ILAM Fahari I-REIT traded at Kshs 13.8 per share as of 10th April 2026, representing a 31.0% loss from the Kshs 20.0 inception price.
Stablecoin
In our Cytonn Weekly #10.2026 we covered Stablecoins and Their Potential Applications in Kenya’s Digital Economy and also published a note on the Draft Virtual Asset Service Providers Regulations,2026 & Impact on Stablecoin Market Introduction. To advance on this, this inaugural Weekly Stablecoins Market Report has been prepared to provide a structured and continuous overview of developments within the global stablecoin ecosystem, with a particular focus on regulated and institutionally relevant stablecoins. The report aims to track key market indicators including market capitalization, transaction volumes, peg stability, reserve quality, regulatory developments, institutional adoption trends, and emerging risks across major jurisdictions. As stablecoins continue to evolve from crypto trading instruments into increasingly important components of global payments, treasury management, and digital financial infrastructure, regular monitoring has become essential for assessing their potential impact on investment markets, cross-border transactions, and the broader digital payments landscape. Going forward, this report will serve as a recurring market intelligence brief intended to support informed analysis, strategic discussions, and ongoing monitoring of developments within the stablecoin sector.
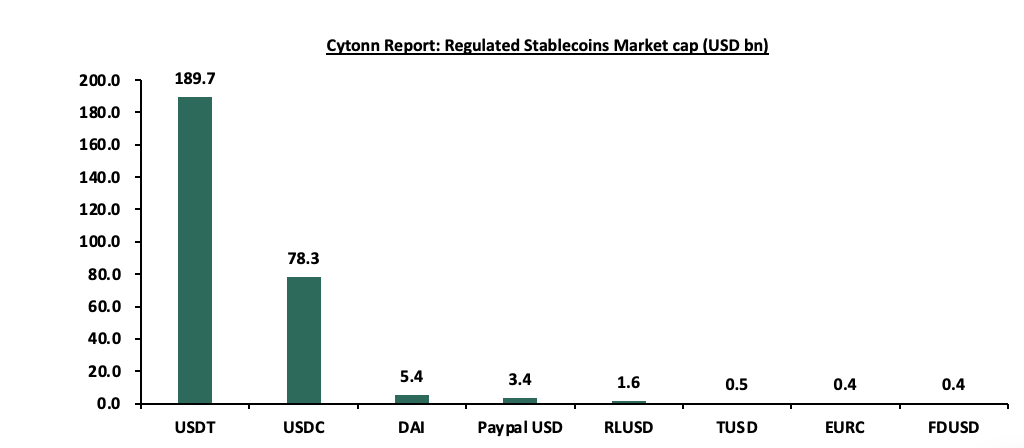
During the week, according to Defilama, the global stablecoin market gained by 0.7% to USD 324.1 bn from the 321.7 bn recorded last week. This was attributable to growth recorded by coins such as USDC, Paypal USD and EURC of 1.4%, 0.9% and 0.8% respectively. The performance was however weighed down by declines recorded by coins such as FDUSD and RLUSD of 0.7% and 0.9% respectively. USDT closed the week with the largest market cap at USD bn 189.7 representing 58.5% of the total market cap followed by USDC at USD 78.3 bn translating to 24.1% of the total market cap;
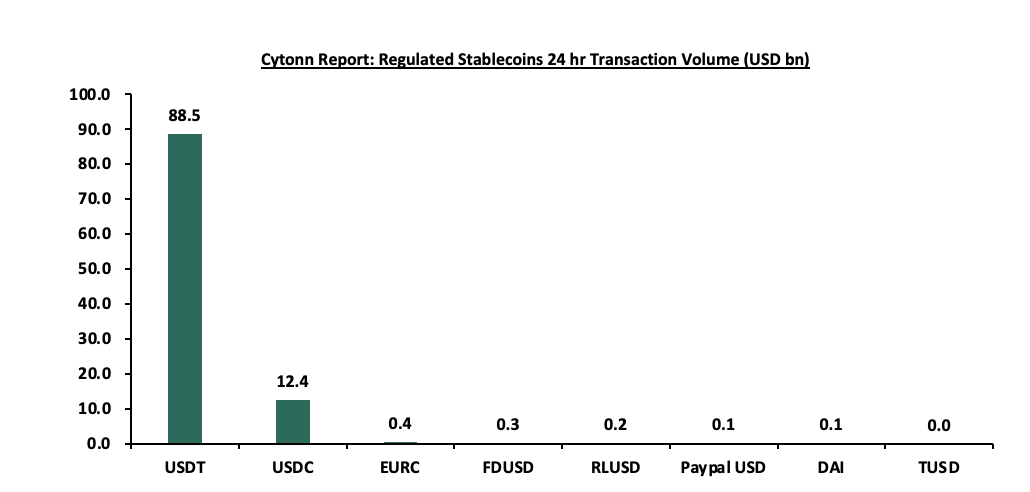
The average 24-hour transaction volume during the week rose by 95.2% to USD 40.6 bn from the USD 20.8 bn recorded the previous week. USDT issued by Tether had the largest transaction volume by 8th May 2026 4.00 pm EAT at USD 88.5 bn a 3.1% increase from USD 85.8 bn recorded at a similar time last week. This can be attributable to increased global stablecoin adoption, heightened trading activity across digital asset markets, growing use of stablecoins in cross-border settlements and remittances, as well as continued preference for Tether due to its deep liquidity, wide exchange integration, and dominant position within the global stablecoin ecosystem;
Focus of the Week
Development financing in Real Estate is a specialized, short-term funding solution (typically 9–36 months) designed to cover the costs of acquiring land, obtaining permits, and constructing or refurbishing property projects. Kenya’s Real Estate sector is one of the economic sectors that has realized remarkable growth and improvement over the past years. However, development of projects has proven to be a challenge as evidenced by various projects stalling, and hence surpassing their stipulated timelines. Key to note, Real Estate developments are capital intensive, and as such require massive funding to complete. However, the over-reliance on traditional sources of financing Real Estate projects such as debt financing continue to be a challenge in sourcing funds for developments mainly due to difficulty in accessing credit loans, coupled with the burden of being in debt. This week we develop on our 2024 topical on Alternative Financing for Real Estate Developments, that focused on alternative financing, their challenges and opportunities. In analyzing the available development financing in Real Estate, we will discuss the following.
Investment Updates:
- Weekly Rates: Cytonn Money Market Fund closed the week at a yield of 12.1% p.a. To invest, dial *809# or download the Cytonn App from Google Play store here or from the Appstore here;
- We continue to offer Wealth Management Training every Tuesday, from 7:00 pm to 8:00 pm. The training aims to grow financial literacy among the general public. To register for any of our Wealth Management Trainings, click here;
- If interested in our Private Wealth Management Training for your employees or investment group, please get in touch with us through wmt@cytonn.com;
- Cytonn Asset Managers Limited (CAML) continues to offer pension products to meet the needs of both individual clients who want to save for their retirement during their working years and Institutional clients that want to contribute on behalf of their employees to help them build their retirement pot. For more about our pension schemes, kindly get in touch with us through pensions@cytonn.com;
Hospitality Updates:
- We currently have promotions for Staycations. Visit cysuites.com/offers for details or email us at sales@cysuites.com;
Money Markets, T-Bills Primary Auction:
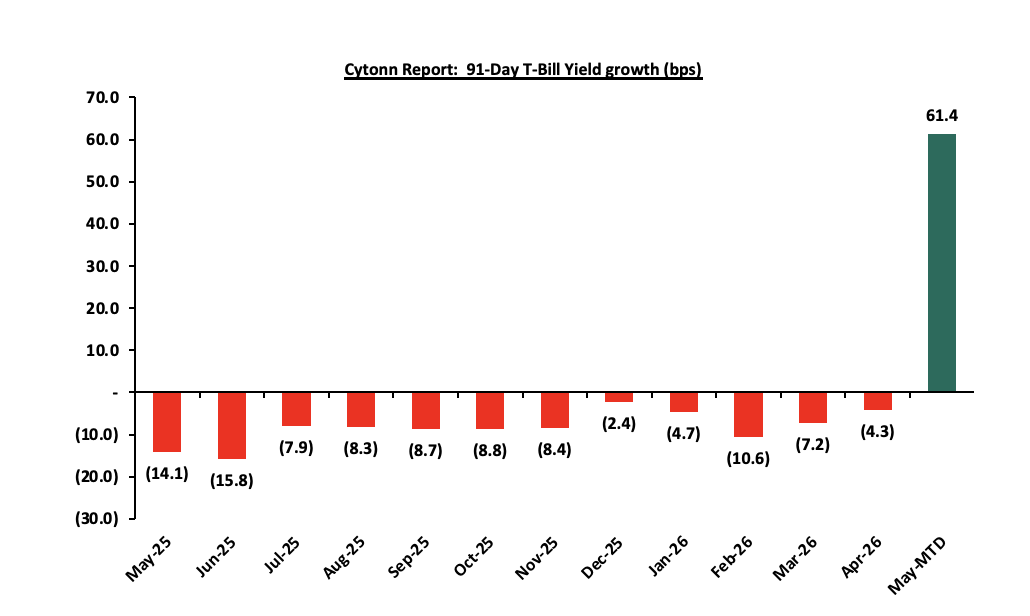
This week, T-bills were oversubscribed for the first time in four weeks, with the overall subscription rate coming in at 122.6%, higher than the subscription rate of 77.0%, recorded the previous week. Investors’ preference for the shorter 91-day paper persisted, with the paper receiving bids worth Kshs 9.7 bn against the offered Kshs 4.0 bn, translating to a subscription rate of 243.5%, higher than the subscription rate of 200.6%, recorded the previous week. The subscription rate for the 182-day paper increased significantly to 145.2% from 32.6% recorded the previous week, while that of the 364-day paper decreased to 51.6% from 71.9% recorded the previous week. The government accepted a total of Kshs 29.41 bn worth of bids out of Kshs 29.42 bn bids received, translating to an acceptance rate of 99.98%. The yields on the government papers showed mixed performance with the yields on the 91-day paper increasing the most by 15.0 bps to 8.2% from the 8.0% recorded the previous week. The yields on the 364-day paper also increased by 0.1 bps to remain relatively unchanged from the 8.5% recorded the previous week, while the yields on the 182-day paper decreased by 0.2 bps to remain relatively unchanged from the 8.2% recorded the previous week. The chart below shows the yield growth rate for the 91-day paper from May 2025 to date:
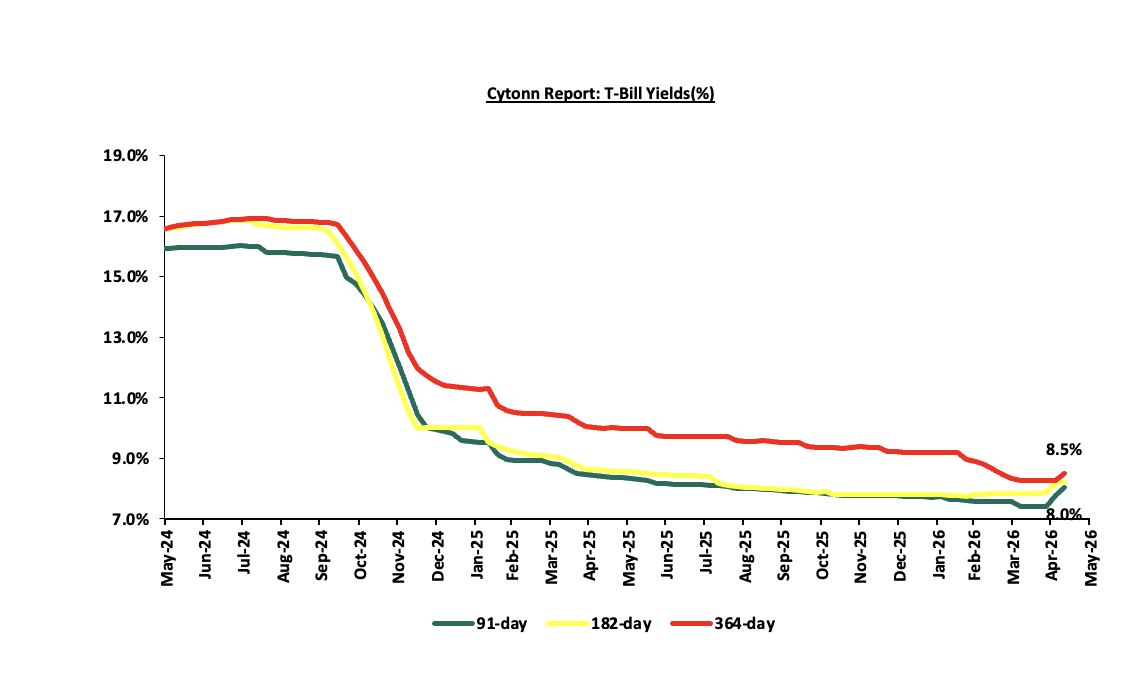
The chart below shows the performance of the 91-day, 182-day and 364-day papers from May 2024 to May 2026:
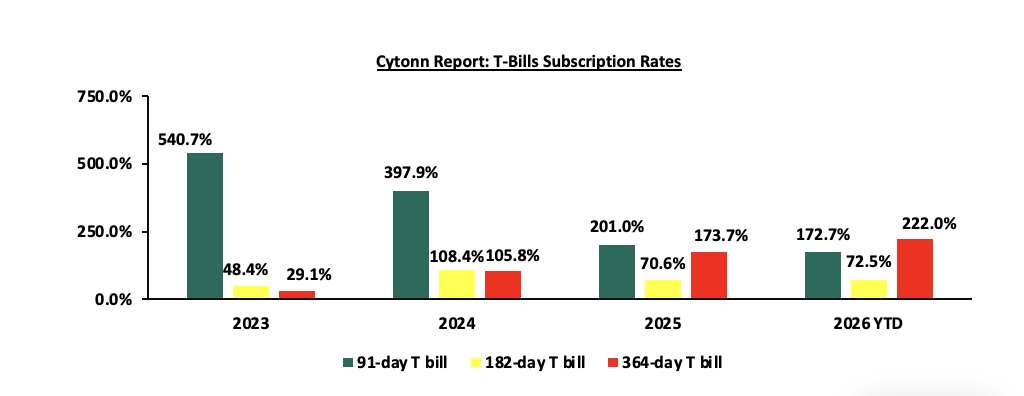
The chart below compares the overall average T-bill subscription rates obtained in 2023, 2024, 2025 and 2026 Year-to-date (YTD):
T-Bonds Primary Auction:
The Central Bank of Kenya released the auction results for the re-opened treasury bonds FXD1/2012/020, FXD1/2019/020 and FXD1/2021/025 with tenors to maturities of 7.6 years, 13.2 years and 20.0 years respectively and fixed coupon rates of 12.0%, 12.9%, and 13.9% respectively. The bonds were oversubscribed, with the overall subscription rate coming in at 132.5%, receiving bids worth Kshs 106.0 bn against the offered Kshs 80.0 bn. The government accepted bids worth Kshs 94.0 bn, translating to an acceptance rate of 88.7%. The weighted average yield for the accepted bids for the FXD1/2012/020, FXD1/2019/020 and FXD1/2021/025 came in at 12.5%, 13.2% and 13.7% respectively. Notably, the 13.2% and 13.7% yield on FXD1/2019/020 and FXD1/2021/025 respectively were higher than the 12.7% and 12.9% recorded at the last reopening in March 2026, while the 12.46% yield on FXD1/2012/020 was lower 12.47% recorded at its last reopening in November 2025. With the Inflation rate at 5.6% as of April 2026, the real returns of the FXD1/2012/020, FXD1/2019/020 and FXD1/2021/025 are 6.9%, 7.6% and 8.1% respectively. Given the 10.0% withholding tax on the bonds, the tax equivalent yields for shorter term bonds with 15.0% withholding tax are 13.2%, 14.0% and 14.5% for the FXD1/2012/020, FXD1/2019/020 and FXD1/2021/025 respectively.
Money Market Performance:
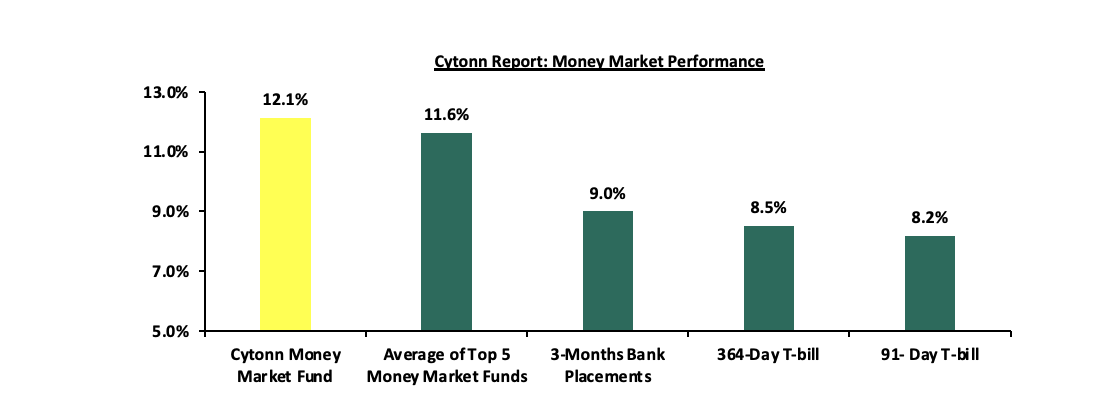
In the money markets, 3-month bank placements ended the week at 9.0% (based on rates offered by various banks. The yields on the government papers showed mixed performance with the yields on the 91-day paper increasing by 15.0 bps to 8.2% from the 8.0% recorded the previous week. The yields on the 364-day paper also increased by 0.1 bps to remain relatively unchanged from the 8.5% recorded the previous week. The yield on the Cytonn Money Market Fund increased marginally by 3.0 bps to remain unchanged from the 12.1% recorded the previous week, while the average yields on the Top 5 Money Market Funds increased by 7.6 bps to remain unchanged from 11.6% recorded the previous week.
The table below shows the Money Market Fund Yields for Kenyan Fund Managers as published on 8th May 2026:
|
Money Market Fund Yield for Fund Managers as published on 8th May 2026 |
||
|
Rank |
Fund Manager |
Effective Annual Rate |
|
1 |
Cytonn Money Market Fund ( Dial *809# or download Cytonn App) |
12.1% |
|
2 |
Nabo Africa Money Market Fund |
12.1% |
|
3 |
Etica Money Market Fund |
12.1% |
|
4 |
Arvocap Money Market Fund |
11.0% |
|
5 |
Gulfcap Money Market Fund |
10.8% |
|
6 |
Lofty-Corban Money Market Fund |
10.7% |
|
7 |
Enwealth Money Market Fund |
10.6% |
|
8 |
Jubilee Money Market Fund |
10.5% |
|
9 |
Ndovu Money Market Fund |
10.5% |
|
10 |
Kuza Money Market fund |
10.3% |
|
11 |
Orient Kasha Money Market Fund |
10.3% |
|
12 |
Faulu Money Market Fund |
10.3% |
|
13 |
Madison Money Market Fund |
10.2% |
|
14 |
Old Mutual Money Market Fund |
10.2% |
|
15 |
GenAfrica Money Market Fund |
9.9% |
|
16 |
British-American Money Market Fund |
9.7% |
|
17 |
Dry Associates Money Market Fund |
9.4% |
|
18 |
SanlamAllianz Money Market Fund |
9.3% |
|
20 |
Apollo Money Market Fund |
9.2% |
|
21 |
KCB Money Market Fund |
9.0% |
|
22 |
Genghis Money Market Fund |
8.6% |
|
23 |
Mayfair Money Market Fund |
8.5% |
|
24 |
CIC Money Market Fund |
8.4% |
|
25 |
CPF Money Market Fund |
8.3% |
|
26 |
Co-op Money Market Fund |
8.2% |
|
27 |
ICEA Lion Money Market Fund |
8.1% |
|
28 |
Mali Money Market Fund |
8.0% |
|
29 |
Absa Shilling Money Market Fund |
7.4% |
|
30 |
Ziidi Money Market Fund |
5.9% |
|
31 |
Stanbic Money Market Fund |
5.3% |
|
32 |
AA Kenya Shillings Fund |
4.3% |
|
33 |
Equity Money Market Fund |
4.3% |
Source: Business Daily
Liquidity:
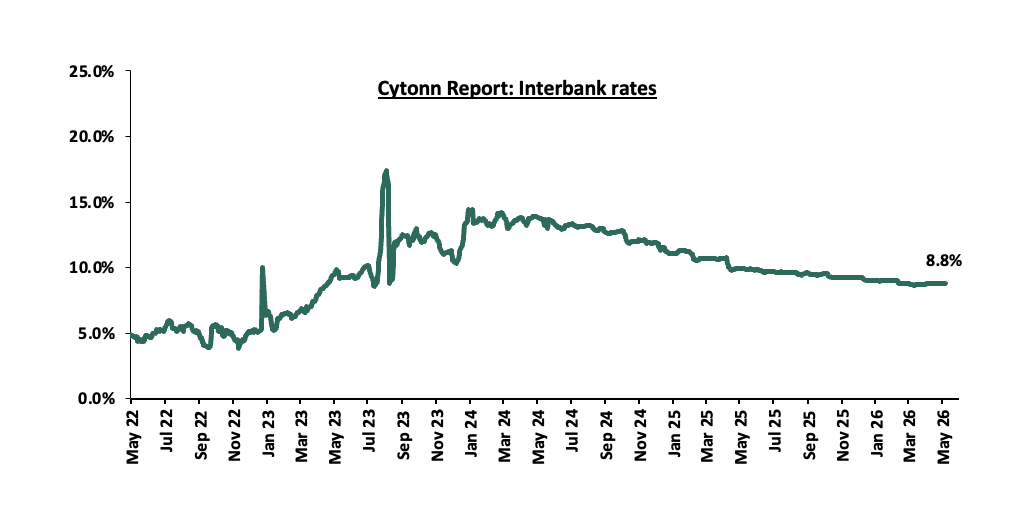
During the week, liquidity in the money markets tightened with the average interbank rate decreasing by 0.1 bps to remain relatively unchanged at 8.8% recorded last week, partly attributable to government payments that offset tax remittances. The average interbank volumes traded increased by 16.1% to Kshs 10.1 bn from Kshs 8.7 bn recorded the previous week. The chart below shows the interbank rates in the market over the years:
Kenya Eurobonds:
During the week, the yields on the Eurobonds were on a downward trajectory with the yield on the 12-year Eurobond issued in 2019, decreasing the most by 68.0 bps to 7.9% from 8.5% recorded the previous week. The table below shows the summary performance of the Kenyan Eurobonds as of 7th May 2026;
|
Cytonn Report: Kenya Eurobonds Performance |
||||||
|
|
2018 |
2019 |
2021 |
2024 |
||
|
Tenor |
10-year issue |
30-year issue |
12-year issue |
13-year issue |
7-year issue |
|
|
Amount Issued (USD) |
1.0 bn |
1.0 bn |
1.0 bn |
1.5 bn |
1.5 bn |
|
|
Years to Maturity |
2.5 |
22.5 |
8.8 |
5.5 |
10.5 |
|
|
Yields at Issue |
7.3% |
8.3% |
6.2% |
10.4% |
9.9% |
|
|
2-Jan-26 |
6.1% |
8.8% |
7.2% |
7.8% |
7.1% |
|
|
30-Apr-26 |
7.5% |
9.4% |
8.5% |
8.9% |
8.2% |
|
|
1-May-26 |
7.4% |
9.3% |
8.3% |
8.7% |
8.0% |
|
|
4-May-26 |
7.4% |
9.3% |
8.3% |
8.7% |
8.1% |
|
|
5-May-26 |
7.4% |
9.3% |
8.3% |
8.7% |
8.0% |
|
|
6-May-26 |
7.2% |
9.0% |
7.9% |
8.3% |
7.6% |
|
|
7-May-26 |
7.2% |
8.9% |
7.9% |
8.3% |
7.5% |
|
|
Weekly Change |
(0.3%) |
(0.4%) |
(0.7%) |
(0.6%) |
(0.6%) |
|
|
MTD Change |
(0.1%) |
(0.3%) |
(0.5%) |
(0.4%) |
(0.5%) |
|
|
YTD Change |
1.2% |
0.1% |
1.2% |
0.9% |
0.9% |
|
Source: Central Bank of Kenya (CBK) and National Treasury
Kenya Shilling:
During the week, the Kenya Shilling remained stable against the US Dollar at Kshs 129.1, unchanged from the rate recorded the previous week. On a year-to-date basis, the shilling has depreciated by 10.8 bps against the dollar, as compared to the 22.9 bps appreciation recorded in 2025.
We expect the shilling to be supported by:
-
Diaspora remittances standing at a cumulative USD 5,039.6 mn in the twelve months to March 2026, 1.4% higher than the USD 4,971.6 mn recorded over the same period in 2025. These have continued to cushion the shilling against further depreciation. In the March 2026 diaspora remittances figures, North America remained the largest source of remittances to Kenya accounting for 51.3% in the period, and,
-
Tourism inflows, which strengthened significantly. Tourism receipts reached Kshs 560.0 bn in 2025, up from Kshs 452.2 bn in 2024, representing a 23.9% increase, supported by improved international arrivals through the country’s major airports, and,
-
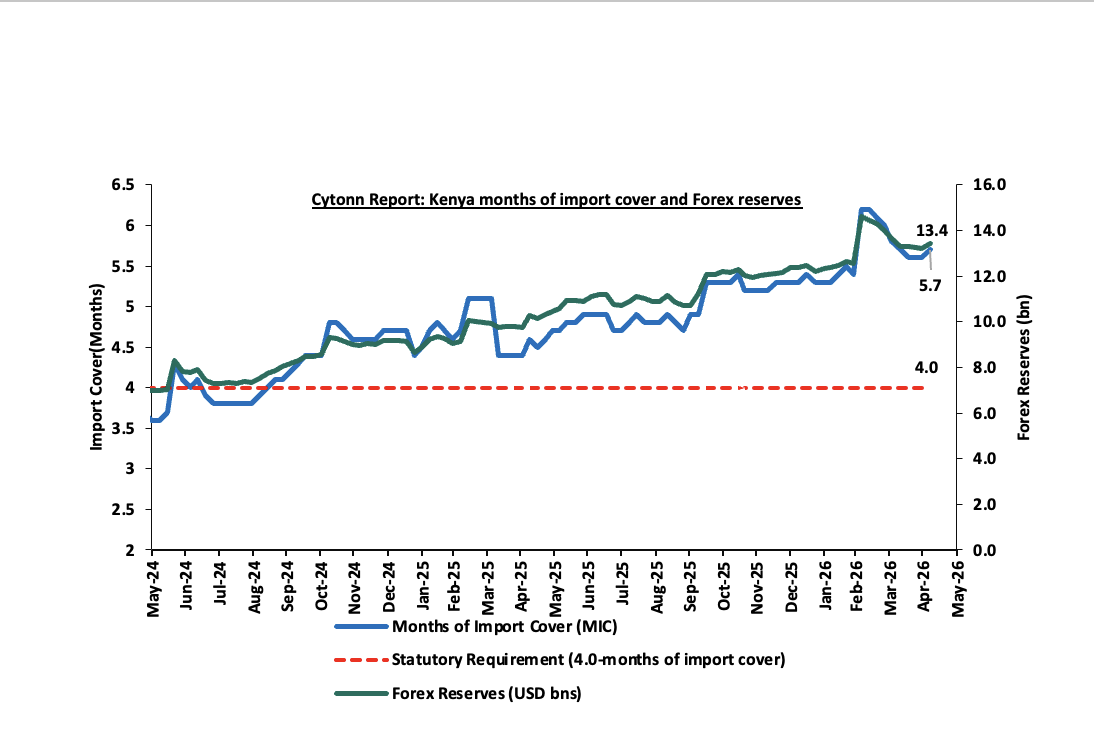
Improved forex reserves currently at USD 13.4 bn (equivalent to 5.7-months of import cover), which is above the statutory requirement of maintaining at least 4.0-months of import cover and above the EAC region’s convergence criteria of 4.5-months of import cover.
The shilling is however expected to remain under pressure in 2026 as a result of:
-
An ever-present current account deficit which came at 2.4% of GDP in the twelve months to February 2026, and,
-
The need for government debt servicing, continues to put pressure on forex reserves given that 52.0% of Kenya’s external debt is US Dollar-denominated as of September 2025.
-
Rising geopolitical tensions in the Middle East, which could exert pressure on the shilling through higher global oil prices and increased uncertainty in international markets. Given that Kenya is a net importer of petroleum products, any sustained increase in oil prices would widen the import bill, increase demand for US Dollars, and consequently put depreciation pressure on the shilling.
Kenya’s forex reserves increased by 1.4% during the week to USD 13.4 bn from USD 13.2 bn recorded the previous week, equivalent to 5.7 months of import cover, and above the statutory requirement of maintaining at least 4.0-months of import cover.
The chart below summarizes the evolution of Kenya's months of import cover over the years:
Weekly Highlights
-
Stanbic Bank’s April 2026 Purchasing Manager’s Index (PMI)
During the week, Stanbic Bank released its monthly Purchasing Manager’s Index (PMI) indicating that Kenya’s Purchasing Managers’ Index (PMI) rose to 49.4 in April 2026 from 47.7 in March 2026, signaling a slower pace of contraction in private sector activity, although remaining below the 50.0 neutral threshold for the second consecutive month. The reading was also lower than 50.4 recorded in February 2026 and the recent peak of 55.0 in November 2025, indicating continued deterioration in business conditions. The subdued performance was largely attributed to firms’ concerns over the potential impact of the ongoing Middle East war on domestic economic activity. However, the contraction eased compared to March, supported by stronger client demand driven by product innovation, marketing initiatives, and improved customer interest, which helped cushion broader demand weakness. Additionally, the decline in both output and new business moderated, suggesting some easing in the pace of deterioration. Key to note, a PMI reading of above 50.0 indicates an improvement in the business conditions, while readings below 50.0 indicate a deterioration. The chart shows Kenya's Purchasing Manager's Index for the last 24 Months:
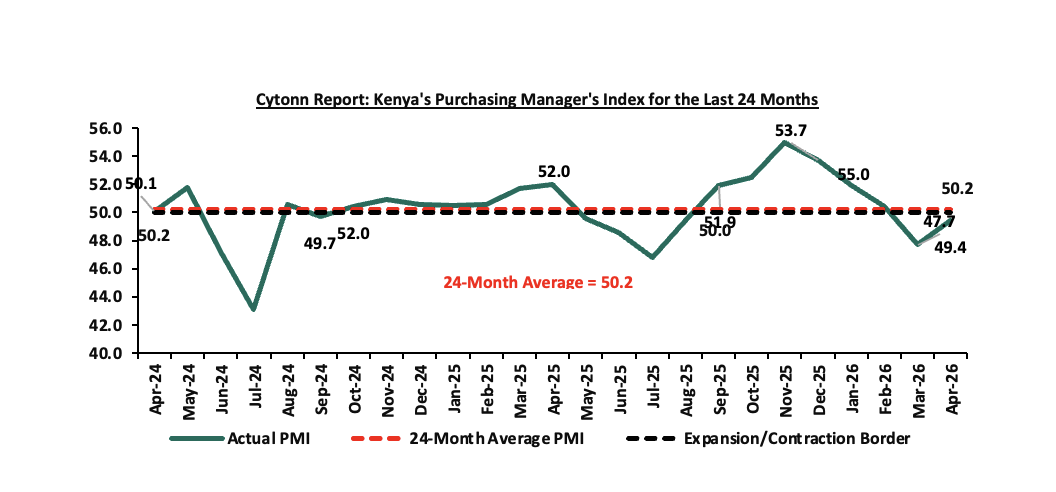
Going forward, the outlook for Kenya’s private sector remains cautious but with signs of gradual stabilization. While business conditions are still contracting, the pace of deterioration is easing, pointing to a private sector that is under pressure but showing resilience amid external shocks. The key expectation is that economic activity is likely to remain subdued in the near term, mainly due to uncertainty surrounding the ongoing Middle East conflict. Businesses appear concerned that prolonged geopolitical tensions could sustain high global oil prices, increase import costs, weaken consumer purchasing power through inflationary pressures, and weigh on investor confidence. For Kenya, this would translate into elevated operating costs for firms, especially in transport, manufacturing, and energy-intensive sectors. Consequently, although private sector recovery is expected to continue, emerging cost pressures and weaker household spending may moderate the pace of growth in the months ahead.
Rates in the Fixed Income market have been on a downward trend due to high liquidity in the money market which allowed the government to front load most of its borrowing. The government is 18.6% ahead of its prorated net domestic borrowing target of Kshs 861.4 bn, having a net borrowing position of Kshs 1021.8 bn (inclusive of T-bills). However, we expect a stabilization of the yield curve in the short and medium term, with the government looking to increase its external borrowing to maintain the fiscal surplus, hence alleviating pressure in the domestic market. As such, we expect the yield curve to stabilize in the short to medium-term and hence investors are expected to shift towards the long-term papers to lock in the high returns
Market Performance:
During the week, the equities market recorded a mixed performance, with NASI gaining the most by 2.1% followed by NSE 25 and NSE 10 both gaining by 0.6%, while NSE 20 declined by 0.4%, taking the YTD performance to gains of 12.5%, 11.9%, 11.4% and 8.7% for NSE 20, NSE 25, NASI and NSE 10 respectively. The week-on-week equities market performance was driven by gains recorded by large-cap stocks such as Safaricom, Equity and Stanbic of 8.4%, 1.7% and 1.4% respectively. The performance was however weighed down by losses recorded by large cap stocks such as Absa, Co-op bank and SCB-K of 7.9%, 6.1% and 4.6% respectively.
During the week, the banking sector index declined by 0.2% to 232.0 from 236.1 recorded the previous week. This is attributable to losses recorded by large cap stocks such as Absa, Co-op bank and Stanchart of 7.9%, 6.1% and 4.6% respectively. However, the performance was supported by gains recorded by large cap stocks such as Safaricom, Equity and Stanbic of 8.4%, 1.7% and 1.4% respectively;
During the week, equities turnover increased by 91.2% to USD 33.8 mn from USD 17.7 mn recorded the previous week, taking the YTD total turnover to USD 591.7 mn. Foreign investors remained net sellers for the third consecutive week with a net selling position of USD 5.8 mn, from a net selling position of USD 2.4 mn recorded the previous week, taking the YTD foreign net selling position to USD 89.0 mn, compared to a net selling position of USD 92.9 mn recorded in 2025.
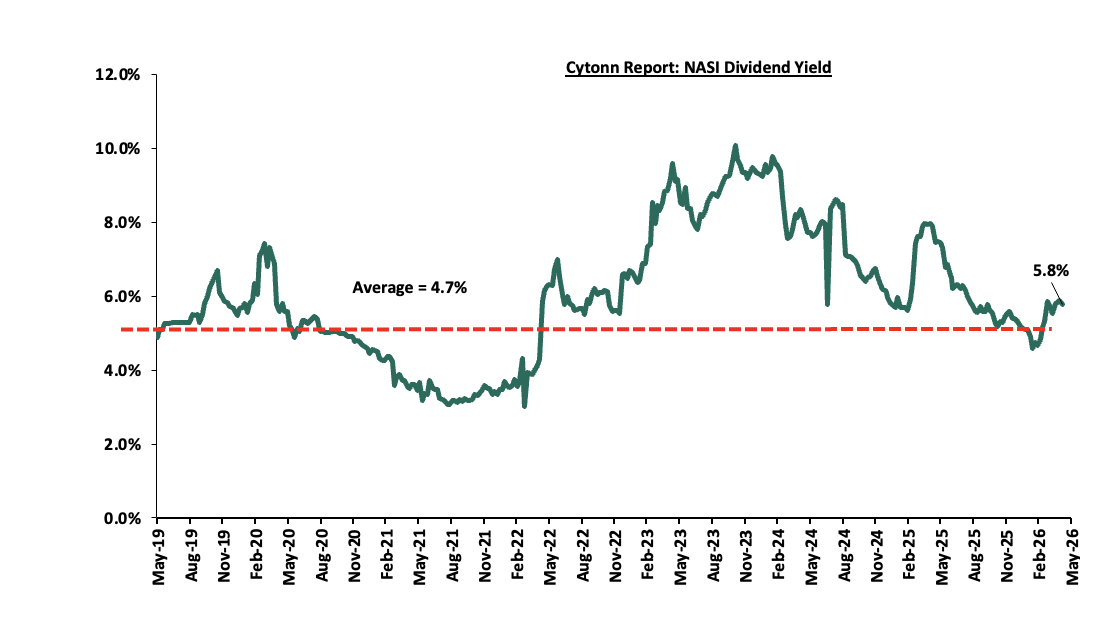
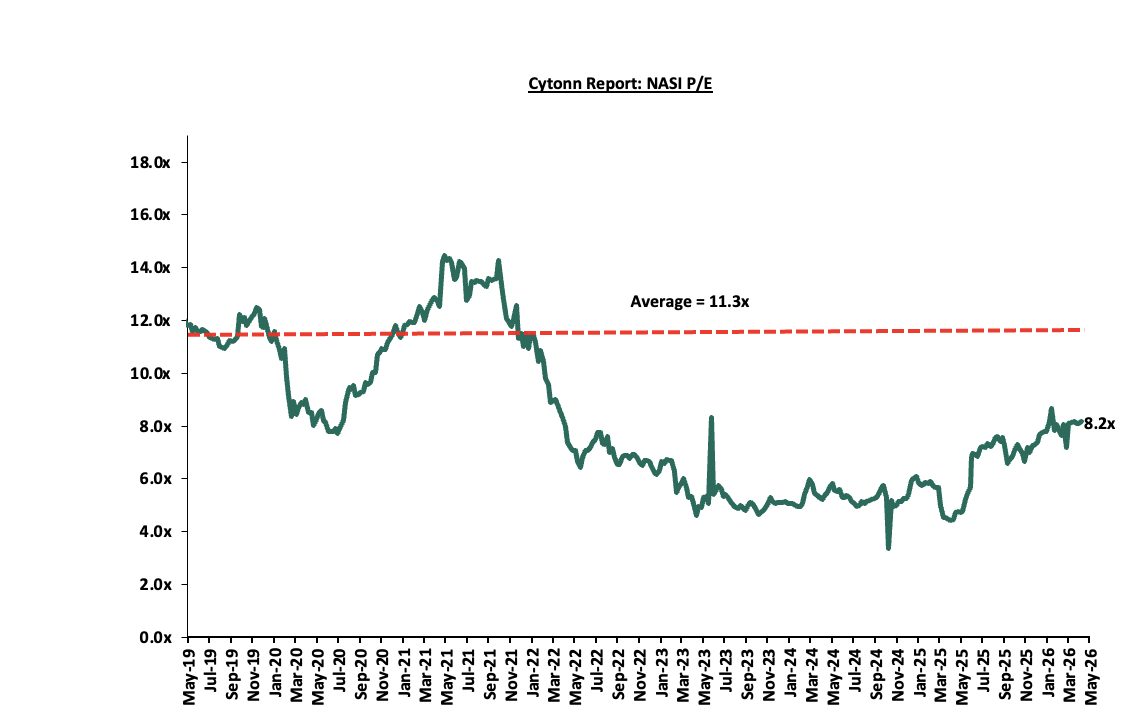
The market is currently trading at a price to earnings ratio (P/E) of 8.2x, 27.3% below the historical average of 11.3x, and a dividend yield of 5.9%, 1.2% points above the historical average of 4.7%. Key to note, NASI’s PEG ratio currently stands at 1.0x, suggesting that the market is fairly valued relative to its expected earnings growth. A PEG ratio greater than 1.0x indicates the market may be overvalued while a PEG ratio less than 1.0x indicates that the market is undervalued.
The charts below indicate the historical P/E and dividend yields of the market;
Universe of Coverage:
|
Cytonn Report: Equities Universe of Coverage |
|||||||||||
|
Company |
Price as at 30/04/2026 |
Price as at 08/05/2026 |
w/w change |
m/m change |
YTD Change |
Year Open 2026 |
Target Price* |
Dividend Yield |
Upside/ Downside** |
P/TBv Multiple |
Recommendation |
|
Co-op Bank |
31.3 |
29.4 |
(6.1%) |
2.4% |
23.0% |
23.9 |
37.2 |
8.5% |
34.9% |
1.1x |
Buy |
|
KCB Group |
67.0 |
66.8 |
(0.4%) |
(2.2%) |
1.5% |
65.8 |
81.1 |
10.5% |
32.0% |
0.7x |
Buy |
|
CIC Group |
4.3 |
4.3 |
1.6% |
(3.6%) |
(4.6%) |
4.5 |
5.5 |
3.0% |
30.0% |
1.1x |
Buy |
|
Equity Group |
73.5 |
74.8 |
1.7% |
7.9% |
11.6% |
67.0 |
87.8 |
7.7% |
25.2% |
1.0x |
Buy |
|
NCBA |
89.0 |
88.3 |
(0.8%) |
(2.2%) |
3.8% |
85.0 |
103.3 |
8.0% |
25.1% |
1.2x |
Buy |
|
Diamond Trust Bank |
147.5 |
149.0 |
1.0% |
2.4% |
29.8% |
114.8 |
175.1 |
6.0% |
23.5% |
0.4x |
Buy |
|
I&M Group |
49.5 |
50.0 |
0.9% |
1.6% |
16.7% |
42.8 |
56.7 |
7.5% |
20.9% |
0.8x |
Buy |
|
ABSA Bank |
30.5 |
28.1 |
(7.9%) |
(5.1%) |
13.1% |
24.9 |
31.7 |
7.3% |
20.2% |
1.5x |
Buy |
|
Standard Chartered Bank |
351.0 |
334.8 |
(4.6%) |
(0.1%) |
11.7% |
299.8 |
346.8 |
9.3% |
12.9% |
2.1x |
Accumulate |
|
Britam |
12.3 |
12.3 |
(0.4%) |
2.9% |
35.2% |
9.1 |
13.5 |
0.0% |
10.2% |
0.9x |
Accumulate |
|
Jubilee Holdings |
380.3 |
385.8 |
1.4% |
4.0% |
19.6% |
322.5 |
407.5 |
3.9% |
9.5% |
0.5x |
Hold |
|
Stanbic Holdings |
286.0 |
290.0 |
1.4% |
5.6% |
46.6% |
197.8 |
295.0 |
7.7% |
9.4% |
1.6x |
Hold |
|
*Target Price as per Cytonn Analyst estimates **Upside/ (Downside) is adjusted for Dividend Yield ***Dividend Yield is calculated using FY’2025 Dividends |
|||||||||||
Weekly Highlights
-
Stanbic Bank Q1’2026 Financial Results
During the week, Stanbic Bank Kenya released Q1’2026 financial results. Below is a summary of Stanbic Bank’s Q1’2026 performance:
|
Balance Sheet |
Q1'2025 (Kshs bn) |
Q1'2026 (Kshs bn) |
y/y change |
|
Net Loans and Advances to Customers |
244.0 |
258.2 |
5.8% |
|
Kenya Government Securities |
79.2 |
137.4 |
73.5% |
|
Total Assets |
450.1 |
551.7 |
22.6% |
|
Customer Deposits |
337.6 |
411.0 |
21.7% |
|
Deposits Per Branch |
11.3 |
13.7 |
21.7% |
|
Total Liabilities |
381.5 |
478.3 |
25.4% |
|
Shareholders' Funds |
68.7 |
73.4 |
6.9% |
|
Balance sheet Ratios |
Q1'2025 |
Q1'2026 |
% point change |
|
Loan to Deposit ratio |
72.3% |
62.8% |
(6.5%) |
|
Government securities to deposits ratio |
23.5% |
33.4% |
10.0% |
|
Return on average equity |
20.0% |
19.6% |
(0.4%) |
|
Return on average assets |
2.8% |
2.8% |
0.0% |
|
Income Statement |
Q1'2025 (Kshs bn) |
Q1'2026 (Kshs bn) |
y/y change |
|
Net interest Income |
6.8 |
7.6 |
11.7% |
|
Non-interest income |
2.8 |
2.4 |
(13.7%) |
|
Total Operating income |
9.5 |
10.0 |
4.3% |
|
Loan loss provision |
(0.9) |
(0.4) |
(59.1%) |
|
Total Operating expenses |
(5.5) |
(5.0) |
(7.8%) |
|
Profit before tax |
4.1 |
4.9 |
20.5% |
|
Profit after tax |
3.3 |
3.5 |
5.50% |
|
Core EPS |
8.4 |
8.9 |
5.5% |
|
Income Statement Ratios |
Q1'2025 |
Q1'2026 |
% point change |
|
Yield from interest-earning assets |
12.3% |
10.0% |
(2.3%) |
|
Cost of funding |
6.3% |
3.6% |
(2.8%) |
|
Net Interest Margin |
5.9% |
5.7% |
(0.3%) |
|
Net Interest Income as % of operating income |
71.1% |
76.1% |
5.0% |
|
Non-Funded Income as a % of operating income |
28.9% |
23.9% |
(5.0%) |
|
Cost to Income Ratio |
57.2% |
50.5% |
(6.6%) |
|
CIR without LLP |
48.2% |
47.0% |
(1.2%) |
|
Cost to Assets |
1.0% |
0.8% |
(0.2%) |
|
Capital Adequacy Ratios |
Q1'2025 |
Q1'2026 |
% points change |
|
Core Capital/Total Liabilities |
17.1% |
15.4% |
(1.7%) |
|
Minimum Statutory ratio |
8.0% |
8.0% |
0.0% |
|
Excess |
9.1% |
7.4% |
(1.7%) |
|
Core Capital/Total Risk Weighted Assets |
14.9% |
14.6% |
(0.3%) |
|
Minimum Statutory ratio |
10.5% |
10.5% |
0.0% |
|
Excess |
4.4% |
4.1% |
(0.3%) |
|
Total Capital/Total Risk Weighted Assets |
18.4% |
18.1% |
(0.3%) |
|
Minimum Statutory ratio |
14.5% |
14.5% |
0.0% |
|
Excess |
3.9% |
3.6% |
(0.3%) |
|
Liquidity Ratio |
50.5% |
61.0% |
10.5% |
|
Minimum Statutory ratio |
20.0% |
20.0% |
0.0% |
|
Excess |
30.5% |
41.0% |
10.5% |
Key Take-Outs:
-
Increased earnings - Core earnings per share increased by 5.5% to Kshs 8.9 from Kshs 8.4 recorded in Q1’2025, mainly driven by 7.8% decrease in total operating expense to Kshs 5.0 bn, from Kshs 5.5 bn in Q1’2025, coupled with the 4.3% increase in total operating income to Kshs 10.0 bn, from Kshs 9.5 bn in Q1’2025,
-
Improved asset quality – The bank’s Asset Quality improved, with Gross NPL ratio decreasing by 4.1% points to 8.4% in Q1’2026, from 8.7% in Q1’2025, attributable to an 1.6% increase in Gross non-performing loans to Kshs 23.3 bn, from Kshs 22.9 bn in Q1’2025, relative to the 5.9% increase in gross loans to Kshs 278.1 bn, from Kshs 262.6 bn recorded in Q1’2025,
-
Expanded Balanced sheet - The balance sheet recorded an expansion as total assets increased by 22.6% to Kshs 551.7 bn, from Kshs 450.1 bn in Q1’2025, mainly driven by a 5.8% increase in net loans and advances to customers to Kshs 258.2 bn, from 244.0 bn in Q1’2025. Government securities increased by 73.5% to Kshs 137.4 bn, from Kshs 79.2 bn in Q1’2025, and,
-
Increased lending- Customer loans increased by 5.8% to Kshs 258.2 bn, from Kshs 244.0 bn in Q1’2026 as the lender increased lending.
Going forward, the factors that would drive the bank’s growth would be:
-
Digital transformation. The lender has capitalized on digital innovation for service delivery to improve its operational efficiency, which has been a key factor in its financial performance. The lender upgraded their T24 core banking system to improve client’s experiences. Additionally, the lender is adopting use of Artificial Intelligence in its operations and it rolled out Intelligence Automation framework with 17 bots successfully deployed across multiple business function
For a more detailed analysis, please see our Stanbic Bank Kenya Q1’2026 Earnings Note
-
Safaricom FY’2026 Financial Results
During the week, Safaricom Plc released its FY’2026 financial results for the period ending 31st March 2026, highlighting that the profit after tax (PAT) for the Group increased by 61.0% to Kshs 73.7 bn, from 45.8 bn recorded in FY’2025, largely attributable to a 10.0% increase in Total Revenue to Kshs 427.6 bn from Kshs 388.7 bn recorded in FY’2025, coupled with a 4.3% decrease in operating costs to Kshs 207.3 bn in FY’2026 from Kshs 216.5 bn in FY’2025
The tables below show the breakdown of the group’s financial statements from the report;
|
Cytonn Report: Safaricom PLC Income Statement |
|||
|
Item (All figures in Bns) |
FY'2025 |
FY'2026 |
y/y change |
|
Total Revenue |
388.7 |
427.6 |
10.0% |
|
Operating costs |
(216.5) |
(207.3) |
(4.3%) |
|
EBITDA |
172.2 |
220.3 |
27.9% |
|
EBITDA Margin |
44.3% |
51.5% |
7.2% |
|
Depreciation & Amortization |
(68.1) |
(73.9) |
8.6% |
|
Operating Profit |
104.1 |
146.3 |
40.6% |
|
Net Finance Costs |
(20.9) |
(19.7) |
(5.9%) |
|
Profit Before Tax |
93.2 |
126.8 |
36.1% |
|
Profit After Tax |
45.8 |
73.7 |
61.0% |
|
Earnings Per Share |
1.74 |
2.40 |
37.9% |
|
Payout Ratio |
69.0% |
83.3% |
14.4% |
|
Dividend Yield |
6.5% |
6.2% |
(0.3%) |
|
Cytonn Report: Safaricom PLC Balance Sheet |
|||
|
Item (All figures in Bns) |
FY'2025 |
FY'2026 |
y/y change |
|
Current Assets |
84.0 |
79.9 |
(4.9%) |
|
Non-Current Assets |
431.2 |
438.1 |
1.6% |
|
Total Assets |
515.3 |
518.0 |
0.5% |
|
Current Liabililities |
155.0 |
135.4 |
(12.6%) |
|
Non-Current Liabilities |
136.2 |
151.7 |
11.3% |
|
Total liabilities |
291.3 |
287.1 |
(1.4%) |
|
Shareholder funds |
177.7 |
201.1 |
13.2% |
|
Minority Interest |
46.3 |
29.8 |
(35.7%) |
|
Total Equity |
224.0 |
230.9 |
3.1% |
Key take outs from the report include;
-
Total revenue increased by 10.0% to Kshs 427.6 bn in FY’2026, from Kshs 388.7 bn in FY’2025, mainly attributable to the 11.5% increase in service revenue to Kshs 414.1 bn in FY’2026, from Kshs 371.4 bn in FY’2025. Notably, MPESA revenue increased by 13.4% to Kshs 182.7 bn, from Kshs 161.1 bn in FY’2025,
-
Voice revenue for the group increased by 3.5% to Kshs 84.8 bn, from Kshs 82.0 in FY’2025, while mobile data revenue increased by 18.3% to Kshs 92.9 bn, from Kshs 78.5 in FY’2025.
-
Earnings before interest, taxes, depreciation and amortization (EBITDA) increased by 27.9% to 220.3 bn in FY’2026 from 172.2 bn in FY’2025, owing to a 10.0% increase in total revenue to Kshs 427.6 bn in FY’2026, from Kshs 388.7 bn in FY’2025, coupled with a 4.3% decrease in Operating costs to Kshs 207.3 bn in FY’ 2026 from Kshs 216.5 bn in FY’ 2025. As such, EBITDA margin recorded an 7.2% point increase to 51.5% in FY’2026 from 44.3% in FY’2025,
-
Ethiopian subsidiary recorded a 5.3% decrease in net losses after tax to Kshs 47.1 bn from a net loss of Kshs 49.8 bn in FY’2025, while the Kenyan business recorded a 24.7% increase in net profits to Kshs 119.1 bn, from 95.5 bn in FY’2025. As such, the Group recorded a 61.0% increase in net profit to Kshs 73.7 bn in FY’2026, from Kshs 45.8 bn in FY’2025,
-
The balance sheet recorded a marginal expansion as total assets increased by 0.5% to Kshs 518.0 bn, from Kshs 515.3 bn in FY’2025, mainly driven by a 1.6% increase in Non-Current assets to Kshs 438.1 bn, from Kshs 431.2 bn in FY’2025. However, this was weighed down by a 4.9% decrease in current assets to Kshs 79.9 bn in FY’ 2026 from Kshs 84.0 bn in FY’ 2025,
-
The Group’s customers grew by 25.4% to 71.6 mn from 57.1 mn in FY’2025, while Safaricom’s market share in Kenya increased to 66.8% as of December 2025, from 65.2% recorded same period last year.
-
The Board of Directors recommended an interim and final dividend per share of Kshs 0.85 and Kshs 1.15 which brought the total dividend per share for the year to Kshs 2.0 which was a 66.7% increase from the total dividend per share of Kshs 1.2 in FY’ 2025 which constitutes of an interim dividend per share of Kshs 0.55 and a final dividend per share of Kshs 0.65. This translates to a dividend yield of 6.2%, a 0.3% decrease from 6.5% in FY’ 2025 and a payout ratio of 83.3%, a 14.4% increase from 69.0% recorded in FY’ 2025.
Additionally, its Ethiopian subsidiary recorded a total revenue of Kshs 17.4 bn, with service revenue coming at Kshs 14.1 bn and operating cost at Kshs 25.4 bn leading to a loss after tax of Kshs 47.1 bn which weighed down on the group’s overall performance.
The 37.9% increase in the firm’s core earnings to Kshs 2.4 in FY’2026, from Kshs 1.7 in FY’2025 shows that Safaricom continues to have a strong long-term proposition, owing to its 66.8% of market share in Kenya and over 97.0% market share in mobile money subscribers through M-Pesa, with M-Pesa recording a 18.0% year on year growth in one-month active customers to 43.7 mn in FY’2026 from 37.3 mn in FY’ 2025. Additionally, the Ethiopian subsidiary is expected to gain further traction with the firm expecting to tap into Ethiopian market with a population of more than 133.2 mn people. However, the adverse macroeconomic situation, coupled with the ongoing depreciation of the Ethiopian Birr against the US dollar is likely to weigh on the group’s overall performance during this period when it is aggressively expanding its network in Ethiopia.
We maintain a “cautiously optimistic” short-term outlook supported primarily by earnings-led attractive valuations, lower yields on short-term government papers and expected global and local economic recovery, and, “neutral” in the long term as persistent foreign investor outflows continue to constrain market liquidity and limit broad-based market re-rating. With the market currently trading at par to its future growth (PEG Ratio at 1.0x), where performance will be driven by company-specific fundamentals rather than general market direction, we believe that investors should reposition towards value stocks exhibiting strong earnings growth, attractive dividend yields, solid balance sheets, sustainable competitive advantages and trading at compelling discounts to their intrinsic value. While foreign investor sell-offs are expected to continue exerting pressure in the near term, we believe this will create selective entry opportunities for long-term investors.
-
Residential Sector
-
KMRC sets 12.2% rate for the Kshs 3.0 bn bond issue
During the week, Kenya Mortgage Refinancing Company set a fixed coupon rate of 12.2% for its Ksh 3.0 bn green bond, which is part of a larger Kshs 10.5 bn bond programme. Green bonds are debt instruments used to raise funds for environmentally sustainable projects, such as affordable green housing and energy-efficient developments. The eight-year note opened on April 28, 2026, and will close on May 12, 2026 with trading at the Nairobi Securities Exchange expected to begin on May 25, 2026. The company is also waiting for confirmation from the Kenya Revenue Authority on whether investors will qualify for a tax exemption on interest income from the bond.
KMRC said the bond proceeds will mainly support refinancing for green and social housing projects under its Sustainable Finance Framework. This is the lender’s second bond after its 2022 issue, investors will receive staggered principal repayments instead of a lump-sum payment at maturity. The minimum investment has been set at Kshs 100,000.0 and the issue comes as firms return to the debt market following lower interest rates.
The bond is expected to support the Real Estate sector by increasing funding for affordable, green, and social housing developments. KMRC plans to channel the funds into refinancing eligible housing loans, which may help developers and mortgage lenders access longer-term financing. The move also comes at a time when high borrowing costs had slowed activity in 2024 and threatened affordable housing delivery.
-
Centum attracts buyers with discounted mortgages
During the week, Centum Real Estate partnered with KCB Bank Kenya to offer discounted fixed-rate mortgages aimed at increasing sales of its housing units. The mortgages will carry an 8.9% fixed interest rate for periods of up to 25 years, which is lower than the 11.0% to 15.0% rates commonly charged by commercial banks as of March 2026. The company says the arrangement is intended to make home ownership more affordable for salaried and self-employed buyers.
Centum Real Estate Managing Director Kenneth Mbae said the partnership is designed to help buyers access quality homes through more predictable financing path. The fixed-rate structure protects customers from rising servicing costs associated with variable-rate loans. According to Central Bank of Kenya, 85.9% of mortgages in 2024 were on variable interest rates, exposing borrowers to fluctuations in borrowing costs. KCB Bank also noted that many potential homeowners are discouraged by the high upfront cost of houses and need repayment plans they can manage confidently.
Kenya mortgage to GDP stands at 1.6% as of 2024, signifying low penetration in the market. The initiative is expected to support activity in the Real Estate sector by improving affordability and giving buyers more certainty over long-term housing costs. Lower and predictable mortgage rates may encourage more people to purchase homes, potentially boosting demand for residential units and supporting property sales growth.
-
Infrastructure Sector
-
Chinese Firm Secures Kshs 7.5 bn deal to rebuild Nithi bridge
During the week, a Chinese firm, China Wu Yi Company Limited, secured a Kshs 7.5 bn contract to reconstruct and realign the dangerous Nithi Bridge section along the Kenol–Marua dual carriageway. The project will cover a 2.7 km stretch between Marima and Mitheru shopping centres, with the new bridge expected to span 880 metres. Construction is projected to take three years and is scheduled for completion by August 2029.
The redevelopment is aimed at improving safety on one of Kenya’s most accident-prone roads. The steep descent and sharp bends around Nithi Bridge have caused numerous crashes and fatalities over the years despite warning signs and rumble strips. The upgraded design will include dual carriageways, walkways or two-metre shoulders on either side, and elevated bridge supports across the Nithi Valley to help reduce accidents and improve traffic flow.
The project is expected to positively influence the Real Estate sector in the surrounding areas. Better road infrastructure and safer transport links may attract more businesses, investors, and residents to centres such as Marima and Mitheru, increasing demand for commercial spaces, housing, and other developments along the improved corridor.
-
Real Estate Investments Trusts
-
REITs Weekly Performance
On the Unquoted Securities Platform Acorn D-REIT and I-REIT traded at Kshs 27.4 and Kshs 23.2per unit, respectively, as per the last updated data on 10th April 2026. The performance represented a 33.4% and 14.5% gain for the D-REIT and I-REIT, respectively, from the Kshs 20.0 inception price. The volumes traded for the D-REIT and I-REIT came in at 13.4 mn and 42.2 mn shares, respectively. Additionally, ILAM Fahari I-REIT traded at Kshs 13.8 per share as of 10th April 2026, representing a 31.0% loss from the Kshs 20.0 inception price. The volume traded to date came in at 1.2 mn shares for the I-REIT, REITs offer various benefits, such as tax exemptions, diversified portfolios, and stable long-term profits. However, the ongoing decline in the performance of Kenyan REITs and the restructuring of their business portfolios are hindering significant previous investments. Additional general challenges include:
-
Insufficient understanding of the investment instrument among investors leading to a slower uptake of REIT products,
-
Lengthy approval processes for REIT creation,
-
High minimum capital requirements of Kshs 100.0 mn for REIT trustees compared to Kshs 10.0 mn for pension funds Trustees, essentially limiting the licensed REIT Trustee to banks only
-
The rigidity of choice between either a D-REIT or and I-REIT forces managers to form two REITs, rather than having one Hybrid REIT that can allocate between development and income earning properties
-
Limiting the type of legal entity that can form a REIT to only a trust company, as opposed to allowing other entities such as partnerships, and companies,
-
We need to give time before REITS are required to list – they would be allowed to stay private for a few years before the requirement to list given that not all companies maybe comfortable with listing on day one, and,
-
Minimum subscription amounts or offer parcels set at Kshs 0.1 mn for D-REITs and Kshs 5.0 mn for restricted I-REITs. The significant capital requirements still make REITs relatively inaccessible to smaller retail investors compared to other investment vehicles like unit trusts or government bonds, all of which continue to limit the performance of Kenyan REITs.
We expect the performance of Kenya’s Real Estate sector to remain resilient, supported by several factors: i) KMRC 12.2% rate for the Kshs 3.0 bn bond issue signaling increased liquidity particularly for sustainable housing projects ii) Centum attracting buyers with discounted mortgages signaling stronger housing demand iii) Chinese Firm securing Kshs 7.5bn deal to rebuild Nithi bridge enhancing investment attractiveness along the improved corridor . However, challenges such as the weak investor appetite in listed REITs like ILAM Fahari I-REIT and high capital requirements will continue to constrain the sector’s optimal performance.
Weekly:
In our Cytonn Weekly #10.2026 we covered Stablecoins and Their Potential Applications in Kenya’s Digital Economy and also published a note on the Draft Virtual Asset Service Providers Regulations,2026 & Impact on Stablecoin Market Introduction. To advance on this, this inaugural Weekly Stablecoins Market Report has been prepared to provide a structured and continuous overview of developments within the global stablecoin ecosystem, with a particular focus on regulated and institutionally relevant stablecoins. The report aims to track key market indicators including market capitalization, transaction volumes, peg stability, reserve quality, regulatory developments, institutional adoption trends, and emerging risks across major jurisdictions. As stablecoins continue to evolve from crypto trading instruments into increasingly important components of global payments, treasury management, and digital financial infrastructure, regular monitoring has become essential for assessing their potential impact on investment markets, cross-border transactions, and the broader digital payments landscape. Going forward, this report will serve as a recurring market intelligence brief intended to support informed analysis, strategic discussions, and ongoing monitoring of developments within the stablecoin sector.
During the week, according to Defilama, the global stablecoin market gained by 0.7% to USD 324.1 bn from the 321.7 bn recorded last week. This was attributable to growth recorded by coins such as USDC, Paypal USD and EURC of 1.4%, 0.9% and 0.8% respectively. The performance was however weighed down by declines recorded by coins such as FDUSD and RLUSD of 0.7% and 0.9% respectively. USDT closed the week with the largest market cap at USD bn 189.7 representing 58.5% of the total market cap followed by USDC at USD 78.3 bn translating to 24.1% of the total market cap;
Source: Coinmarketcap
*Data as at 8th May 4.00 pm EAT
The average 24-hour transaction volume during the week rose by 95.2% to USD 40.6 bn from the USD 20.8 bn recorded the previous week. USDT issued by Tether had the largest transaction volume by 8th May 2026 4.00 pm EAT at USD 88.5 bn a 3.1% increase from USD 85.8 bn recorded at a similar time last week. This can be attributable to increased global stablecoin adoption, heightened trading activity across digital asset markets, growing use of stablecoins in cross-border settlements and remittances, as well as continued preference for Tether due to its deep liquidity, wide exchange integration, and dominant position within the global stablecoin ecosystem.
Source: Coinmarketcap
*Data as at 8th May 4.00 pm EAT
Out of the eight coins tracked in our report, the USDC and EURC issued by Circle remain the most regulated coins in the market today with as they operate under the US money transmission and compliance frameworks and have the most transparent regular reserve attestations
Overall, the continued growth in global stablecoin adoption and transaction activity holds increasing relevance for the broader Kenyan virtual assets market, particularly as the country moves towards establishing a formal regulatory framework for digital assets and stablecoins as the national treasury completed the collection of public feedback for the The Draft Virtual Assets Regulations 2026 on 10th April 2026. The growing use of stablecoins in cross-border payments, remittances, treasury management, and digital commerce presents significant opportunities for improving transaction efficiency, lowering settlement costs, and enhancing access to dollar-denominated liquidity within Kenya’s rapidly evolving digital economy. Additionally, the increasing institutionalization and regulation of stablecoins globally could support greater investor confidence and potentially accelerate integration between stablecoin infrastructure, fintech platforms, and traditional financial services within the Kenyan market. As such, continued monitoring of global stablecoin trends remains important in assessing emerging investment opportunities, regulatory developments, financial stability considerations, and the future direction of Kenya’s digital payments and virtual assets ecosystem.
Development financing in Real Estate is a specialized, short-term funding solution (typically 9–36 months) designed to cover the costs of acquiring land, obtaining permits, and constructing or refurbishing property projects. Kenya’s Real Estate sector is one of the economic sectors that that has realized remarkable growth and improvement over the past years. However, development of projects has proven to be a challenge as evidenced by various projects stalling, and hence surpassing their stipulated timelines. Key to note, Real Estate developments are capital intensive, and as such require massive funding to complete. However, the over-reliance on traditional sources of financing Real Estate projects such as debt financing continue to be a challenge in sourcing funds for developments mainly due to difficulty in accessing credit loans, coupled with the burden of being in debt. This week we develop on our 2024 topical on Alternative Financing for Real Estate Developments, that focused on alternative financing, their challenges and opportunities. In analyzing the available development financing in Real Estate, we will discuss the following;
-
Introduction and Overview of the Real Estate Sector in Kenya,
-
Financing Structures and Investment Models,
-
Sources of Finance for Real Estate,
-
Key Challenges and Emerging Opportunities, and,
-
Conclusion
-
Introduction and Overview of the Real Estate Sector in Kenya
Development financing in Real Estate is a specialized, short-term funding solution (typically 9–36 months) designed to fund the acquisition, development, and delivery of property assets. In Kenya, this function is particularly critical due to the rapid urbanization, demographic expansion, and a persistent housing deficit estimated at over 2.0 mn units, growing annually.
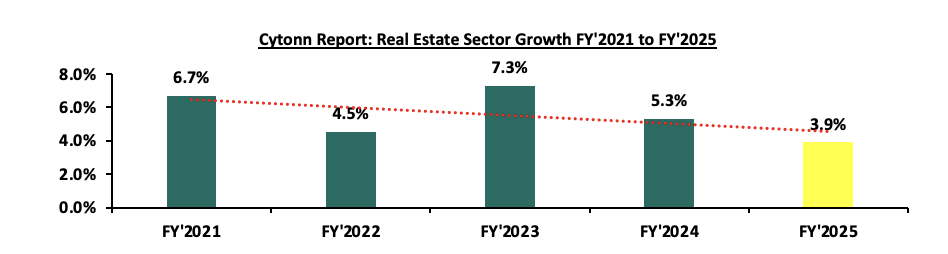
The Real Estate sector has continued to grow despite the slowdown. For the year 2025, Real Estate posted growth of 3.9%, which is 1.4% points slower than the 5.3% growth registered in FY’2024; indicating a slowdown in expansion despite increasing demand for housing in the country. The relatively moderate growth was attributable to;
-
The eased interest rates following CBK’S decision to lower the Central Bank Rate (CBR) by cumulative of 225.0 bps to 9.00% in December 2025 from 11.25% in December 2024. This enabled increased access to credit and lower rates which spurred demand in the property market,
-
The Kenya Shilling was relatively stable in 2025, appreciated by 0.2% against the US Dollar to close the year at Kshs 129.0 in 2025, compared to Kshs 129.3 at the end of 2024. This helped in reducing the expected importation costs and construction costs for materials such as furniture, fixtures and fittings with Construction Input Price Index growth slowing to 0.5% in Q4’2025 as compared to 2.8% in Q4’2024, and,
-
Favorable government and policy interventions. Continued rollout of affordable housing projects under the current government (BETA) has fostered increased demand for residential units and construction related services.
The growth however was suppressed by factors such as :
-
Reduced purchasing power- Taxation, and rising living costs weakened effective housing demand despite strong population growth.
-
Weak mortgage market and affordability constraints- Low mortgage penetration and strict qualification requirements limited end-user purchasing capacity and slowed property absorption.
The graph below shows the Real Estate sector contribution to GDP from FY’2021 to FY’2025.
Source: Kenya National Bureau of Statistics (KNBS)
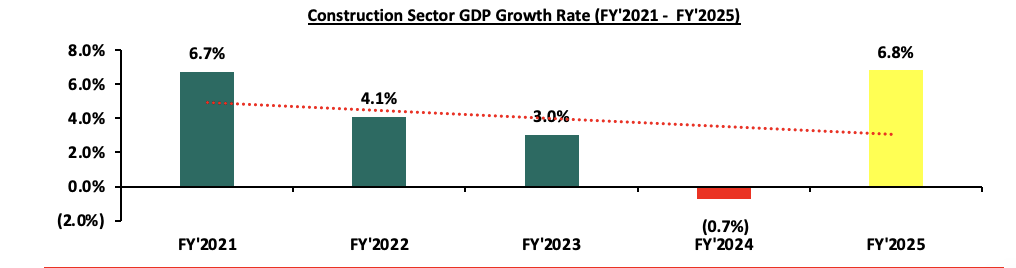
On the other hand, the construction sector grew by 6.8% in FY’2025, which is 7.5% points higher than the 0.7% decline in FY’2024. The performance was largely driven by:
-
The Government’s continued focus on Affordable Housing: The Kenyan government has sustained its strong commitment to the Affordable Housing Program (AHP), a key pillar under the Bottom-Up Economic Transformation Agenda (BETA),
-
Infrastructural development: Kenya maintained strong momentum in infrastructure development, with emphasis shifting toward ongoing Government and Public-Private Partnership (PPP) initiatives aimed at enhancing connectivity and stimulating construction activity. Key government-led investments focused on road construction and rehabilitation, affordable housing, water and sewerage systems, energy projects, and major transport connectivity developments such as bypasses and urban road networks. These projects continued to drive demand for construction services and materials, supporting overall sector expansion despite the slower growth observed in the broader real estate market, and,
-
Provision of affordable mortgage financing: Kenya Mortgage Refinance Company (KMRC) has continued to play a critical role in expanding access to affordable housing finance by offering single-digit fixed-rate, long-term refinancing to Primary Mortgage Lenders (PMLs) such as banks, SACCOs, and microfinance institutions. By 2025, KMRC had cumulatively refinanced 5,148 mortgages and total disbursements to participating financial institutions increased significantly, reaching Kshs 25.4 bn, supporting the expansion of long-term, fixed-rate mortgage products in the market.
The graph below shows the Construction sector growth rates from FY’2021 to FY’2025;
Source: Kenya National Bureau of Statistics (KNBS)
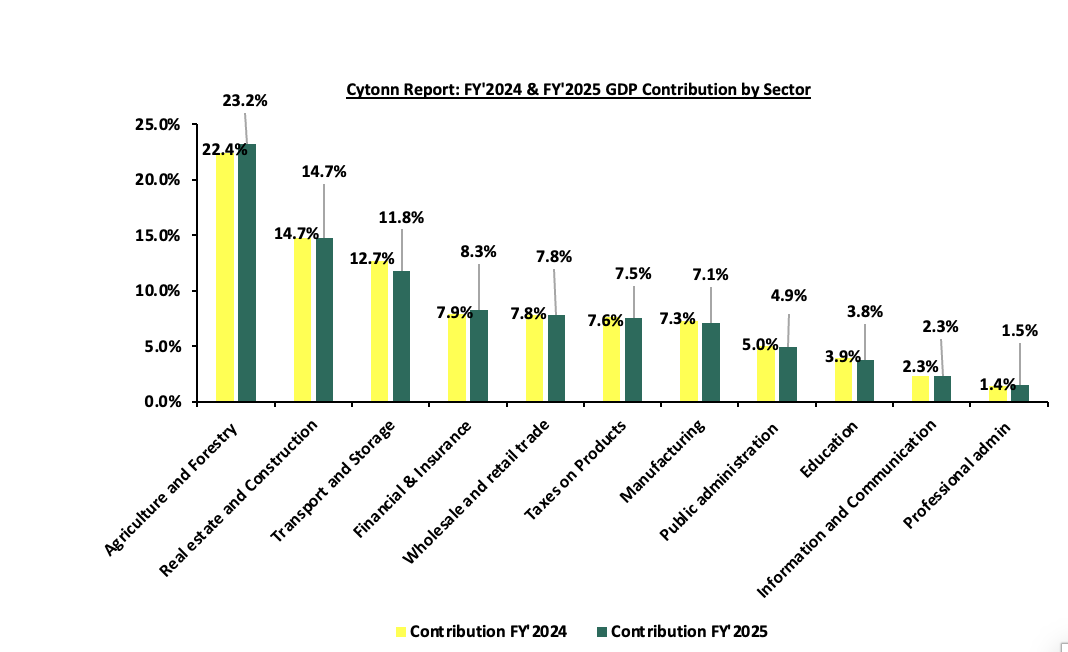
In FY’2025 the Real Estate and Construction sector contribution to GDP remained unchanged at 14.7% from FY’2024, the second after Agriculture and Forestry. The sector has shown resilience despite hard conditions driven by tough macroeconomic conditions, including increased taxation and high living costs that has weakened the purchasing power of potential buyers, leading to slowed property transactions. The graph below shows the sectorial contribution to GDP in FY’2024 and FY2025
Source: Kenya National Bureau of Statistics (KNBS)
The Real Estate sector in Kenya has grown over the years to become one of the largest contributors to the country’s Gross Domestic Product (GDP), supported by factors such as; i) positive demographics including higher urbanization and population growth rates of 2.8% p.a and 2.0% p.a, respectively, against the global average of 1.4% p.a and 1.0% p.a, respectively, as of 2024, ii) government’s sustained efforts to promote infrastructural development, opening up new areas for investments, iii) emphasis to provide affordable housing by the government through programs such as the Affordable Housing Program (AHP), iv) increased investment by both local and foreign investors, and, v) increased accessibility to low-interest loans provided by entities such as Kenya Mortgage Refinance Company (KMRC) among others.
Despite the aforementioned growth and positive performance, several challenges hinder the optimal performance of the Real Estate sector. These challenges include:
-
Construction costs primarily due to higher prices for key materials, which could hinder sector development.
-
Oversupply of physical space exists in various sectors, leading to prolonged vacancy rates.
-
The REITs market in Kenya faces challenges like large capital requirements, prolonged approval processes, and limited investor knowledge.
-
Rising interest rates have made borrowing more expensive, reducing demand for mortgages and developer financing. Lenders are tightening their requirements, leading to constrained financing for developers and an increase in Non-Performing Loans (NPLs) which stood at Kshs 181.5 bn as of Q3’2025.
-
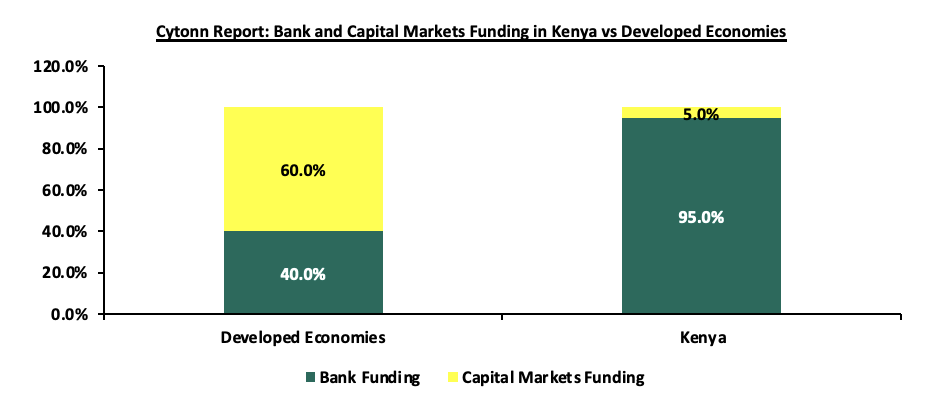
Underdeveloped capital markets limit funding for Real Estate projects, with banks providing nearly 95.0% of funding for developers in Kenya. To address the funding gap, players in the Real Estate sector have increasingly turned to alternative financing methods like Real Estate Investment Trusts (REITs). In 2013, the Capital Markets Authority (CMA) introduced a detailed framework and regulations for REITs, enabling developers to secure capital through this investment avenue.
Kenya's Real Estate sector has been expanding due to ongoing construction activities driven by strong demand for Real Estate developments. The residential market is significantly under-supplied, with an 80.0% housing deficit; only 50,000 units are delivered annually against an estimated need for 250,000 units per year. Despite the high demand, developers in Kenya encounter limited financing options, with local banks providing nearly 95.0% of construction financing, in stark contrast to the 40.0% typically seen in developed countries. To bridge the funding gap, developers are increasingly turning to alternative financing methods. The graph below illustrates the comparison of construction financing in Kenya versus developed economies;
Source: World Bank, Capital Markets Authority (CMA)
-
Sources of Finance for Real Estate
In Kenya, Urban centers (especially the Nairobi Metropolitan Area), are experiencing sustained demand driven by population growth through the high urbanization rate, rising middle-income households and expansion of satellite towns (e.g., Ruiru, Athi River, Kitengela). Despite this demand, Real Estate development is constrained by limited access to affordable and patient capital, resulting in a structural imbalance between supply and effective demand. Government policy frameworks such as Kenya Vision 2030 and the Affordable Housing Programme emphasize private sector participation. However, the state’s role is largely facilitative rather than dominant, meaning that the burden of financing, execution, and risk absorption rests heavily on private developers.
A defining feature of Kenya’s market is that it operates in a quasi-informal financial environment, where: Capital markets are underdeveloped, Mortgage penetration is at 2.0% of GDP and developers rely heavily on short-term bank debt. This creates a system where development finance is expensive, fragmented, and often misaligned with long-term project horizons. The financing ecosystem for Real Estate in Kenya is multi-layered but shallow, with a heavy skew toward traditional lending mechanisms.
-
Commercial Bank Financing
Commercial bank financing remains the backbone of Real Estate development in Kenya, where alternative sources of long-term capital are still evolving. In essence, commercial banks provide debt capital to developers in the form of construction loans, term loans, and bridging facilities, enabling them to undertake projects that would otherwise be beyond their equity capacity. By practice, majority of the banks finance up to 70% of the project’s construction cost and the developer has to raise the remaining 30%. This form of financing plays a central role in mobilizing resources for land acquisition, project execution, and completion, thereby facilitating urban development and economic growth. However, while commercial bank financing offers clear advantages in terms of accessibility and leverage, it also introduces structural inefficiencies and risks that significantly shape the dynamics of Real Estate development.
In the past five years, the Loans advanced to Real Estate and the non-performing loans have been on a rising trajectory signifying increased reliance in the commercial banks. Tough macro-economic conditions have led developers to default on their loans. The graphs below show the Loans advanced to Real Estate, construction and building sectors since 2021.
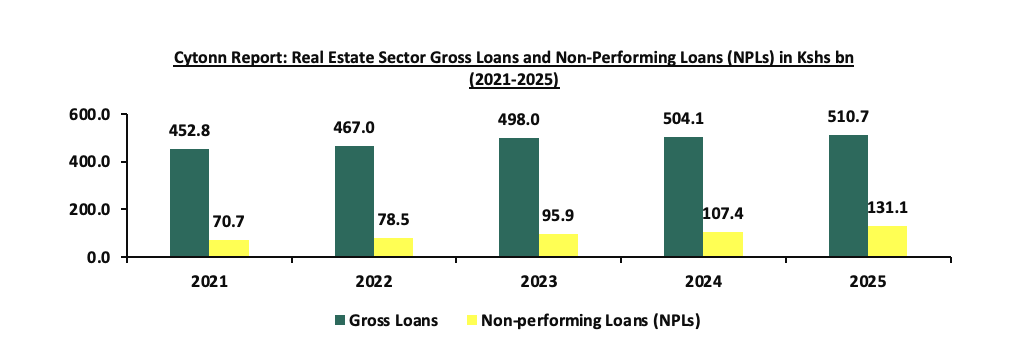
Gross loans advanced 5-year CAGR=2.4%, Gross NPLs 5-year CAGR=13.2%
Source: Central Bank of Kenya
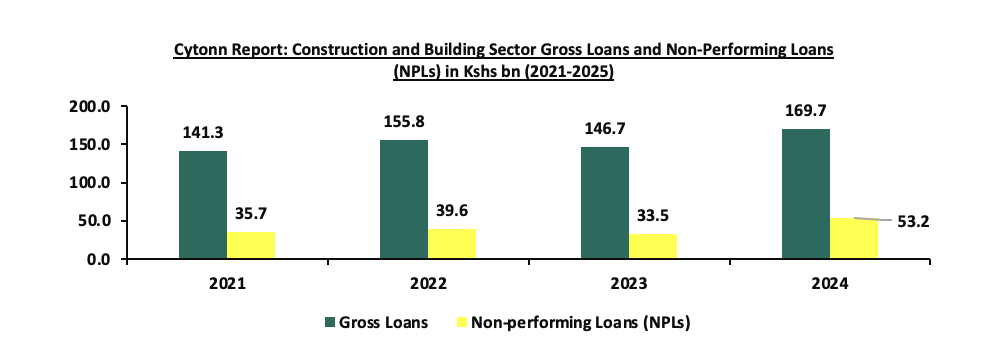
Gross loans advanced 5-year CAGR=6.3%, Gross NPLs 5-year CAGR=12.1%
Source: Central Bank of Kenya
Significant advantages of commercial bank financing lie in its accessibility and institutional maturity, the relative speed and efficiency with which commercial bank loans can be processed and disbursed. Commercial bank financing allows developers to retain full ownership and control over their projects. Despite these advantages, commercial bank financing is characterized by several critical limitations that undermine its effectiveness as a sustainable financing solution for Real Estate development.
-
Foremost among these is the high cost of capital associated with bank loans. Interest rates in emerging markets are often elevated due to macroeconomic factors such as inflation, monetary policy, and perceived credit risk, commercial bank financing suffers from a fundamental mismatch between the tenure of loans and the lifecycle of Real Estate projects.
-
There are stringent collateral requirements imposed by commercial banks. Lending decisions are heavily based on the availability of tangible security, such as land titles or other fixed assets, which can be used to recover funds in the event of default.
-
Commercial bank financing is often accompanied by restrictive agreements and conditions that limit developer flexibility. These may include requirements related to pre-sales, cash flow management, and restrictions on additional borrowing.
-
Interest rate volatility further compounds the risks associated with bank financing. Many loans are structured with variable interest rates, exposing developers to fluctuations in borrowing costs over the life of the project.
-
Commercial banks do not share in the underlying risk of Real Estate projects, as their returns are fixed and contractual.
These loans provide access to substantial funding for large-scale projects and offer predictable repayment schedules that assist in long-term financial planning. Additionally, the legal frameworks governing such loans protect both parties, ensuring transparency and reliability. This option however, can be challenging since the approval process can be lengthy, involving strict assessments of creditworthiness and project feasibility. On the other hand, the interest rate charge average was 14.8 % in Q1’2026 which was a 1.5% points decrease from 16.3% recorded in Q1’2025, according to the Central Bank of Kenya, which remains high despite the decrease which increases total project costs.
-
Developer Equity and Internal Capital
Developer equity and internal capital represent one of the most fundamental sources of financing in Real Estate development, particularly in Kenyan market where access to long-term, affordable external funding remains constrained. In essence, developer equity refers to the capital invested directly by project sponsors, whether in the form of cash, land, or retained earnings, while internal capital encompasses funds generated from previous projects and reinvested into new developments. Equity contributions are fundamental, often ranging between 20% and 40% of total project cost. In Kenya, equity is frequently structured in non-cash forms such as: i) Land contributions by owners in joint ventures, ii) retained earnings from previous developments, iii) Informal investor pools (friends, family, High Net Worth Individuals) Advantages of developer equity and internal capital include;
-
The degree of control and autonomy it affords project sponsors,
-
Closely related to control is the alignment of incentives that developer equity creates, and,
-
The flexibility in structuring and deploying internal capital. Developer equity can be introduced in various forms, including cash injections, land contributions, or reinvested profits from previous developments.
Despite these advantages, reliance on developer equity and internal capital presents several significant limitations that constrain the growth and scalability of Real Estate development in Kenya.
-
Foremost among these is the inherently limited nature of internal capital. Unlike debt financing, which can be scaled based on collateral and creditworthiness, internal capital is constrained by the developer’s own financial capacity and the success of previous projects.
-
The high capital intensity of Real Estate development further exacerbates this constraint. Projects often require substantial upfront investment in land acquisition, infrastructure, and construction, making it difficult for developers to rely solely on internal resources.
-
There is a high concentration of risk inherent in equity financing. Unlike debt, where risk is partially transferred to lenders, developer equity is fully exposed to project performance. In the event of cost overruns, delays, or market downturns, the developer’s capital is the first to absorb losses. This high level of risk exposure can discourage investment in innovative or large-scale projects, leading developers to favor smaller, lower-risk developments that may not fully exploit market opportunities.
-
Liquidity constraints also pose a significant limitation to the use of internal capital.
Developer equity and internal capital form the cornerstone of Real Estate financing in Kenya, providing essential funding, ensuring alignment of incentives, and enabling project control. However, their limitations in terms of scalability, risk concentration, and liquidity highlight the need for a more diversified financing ecosystem. While internal capital will continue to play a critical role, particularly in early-stage project development and risk absorption, the long-term growth of the sector will depend on the integration of additional financing sources that can complement equity and provide the scale, flexibility, and risk-sharing required for sustainable development.
-
Capital Markets and Alternative Financing
Capital markets and alternative financing mechanisms represent an increasingly important, though still underdeveloped, component of Real Estate financing in Kenya. These channels, including Real Estate Investment Trusts (REITs), private equity funds, corporate bonds, and structured finance vehicles, are designed to mobilize large-scale, long-term capital from a broad base of investors. In contrast to traditional bank lending or developer equity, capital markets provide a platform for pooling resources, distributing risk, and enhancing liquidity in what is otherwise an illiquid asset class. In theory, they offer the most scalable and efficient pathway for financing Real Estate development; in practice, however, their adoption in Kenya has been gradual and uneven.
The most visible segment of capital market financing in Kenyan Real Estate is the REIT market, which has shown measurable growth in recent years. As of FY’2025, the total market capitalization of REITs in Kenya stands at approximately Kshs 24.6 bn, representing a near tripling from Kshs 9.8 bn in 2021. This growth signals a rising investor appetite for indirect Real Estate exposure and reflects increasing awareness of REITs as a viable investment vehicle. The market includes several licensed trusts such as Acorn D-REIT, Acorn I-REIT, ILAM Fahari I-REIT, and Imara I-REIT, each targeting different segments including student housing, commercial offices, and industrial logistics.
Despite this growth, the absolute size of the REIT market remains relatively small when compared to the overall scale of Kenya’s Real Estate sector, highlighting a significant gap between potential and actual utilization. Even at Kshs 24.6 bn, the REIT market represents only a fraction of the capital required to address the country’s housing deficit and ongoing urban development needs. This underscores a key structural issue: while the framework for capital market financing exists, depth and liquidity remain limited.
Capital Markets and Alternative Financing in Real Estate have various advantages as compared to the traditional financing which include:
-
Provides long-term and patient capital suitable for Real Estate development timelines,
-
Mobilizes large amounts of funding from both institutional and retail investors,
-
Supports financing of large-scale developments such as mixed-use projects, commercial Real Estate, and infrastructure-linked housing,
-
REITs allow fractional ownership, enabling investors to participate in Real Estate without large upfront capital,
-
Broadens and democratizes the investor base, increasing capital mobilization,
-
Enhances liquidity and exit flexibility through tradable instruments listed on exchanges such as the Nairobi Securities Exchange,
-
Allows investors to buy and sell units more easily compared to traditional property ownership,
-
Reduces investment risk by improving liquidity and making Real Estate more attractive to investors,
-
Enables developers to recycle capital efficiently and continuously fund new developments,
-
Facilitates risk diversification through pooled investment across multiple properties,
-
Improves governance, transparency, and accountability through regulatory oversight by institutions such as the Capital Markets Authority, and,
-
Encourages professional management and formalization of the Real Estate sector.
Despite their numerous advantages, Capital Markets and Alternative markets face various Limitations of Capital Markets and Alternative Financing in Real Estate
-
REIT returns in Kenya have remained relatively low compared to other asset classes. Average REIT returns of 7.0% in 2025 lagged behind equities and some government securities. Limited returns reduce attractiveness to investors seeking higher yields.
-
The REIT market faces low liquidity and limited trading activity, leading to price inefficiencies.
-
Limited investor participation restricts market depth and expansion.
-
Low public awareness and understanding of REITs hinder broader retail investor involvement.
-
Alternative financing instruments such as private equity funds, corporate bonds, and asset-backed securities are still underdeveloped in Kenya
-
Private equity participation is concentrated in a small number of large transactions rather than broad market financing.
-
Regulatory and structural barriers continue to limit market growth and adoption.
-
Challenges such as high minimum investment thresholds, tax considerations, and complex structuring requirements discourage participation.
-
Capital markets remain vulnerable to macroeconomic volatility, including currency fluctuations and changing investor sentiment. Many developers still rely on traditional bank financing despite potential advantages of capital markets.
-
Market performance can be influenced by factors unrelated to underlying property fundamentals.
-
The overall market remains relatively small and immature compared to the financing needs of Kenya’s Real Estate sector.
-
Structural inefficiencies and limited diversity of financial instruments continue to constrain scalability.
Other financing options include
-
Mortgage Loans
-
Construction Loans
-
Bridge Loans and Savings and Credit Co-operatives (SACCOs)
-
Government-backed Loans and Initiatives
-
Equity Financing
-
Pre-Sales
For more information on the available financing options in Real Estate please visit our 2024 topical on Alternative Financing for Real Estate Developments
-
Financing Structures and Investment Models
Financing structures and investment models form the foundation upon which Real Estate developments are executed, determining how capital is raised, how risk is distributed, and how returns are ultimately realized. In Kenya, the structure of Real Estate financing reflects both innovation and constraint, shaped by limited access to long-term capital, high cost of debt, and an evolving institutional environment. Developers rarely rely on a single source of funding; instead, they adopt hybrid financing structures, combining multiple instruments to achieve project viability. This results in layered capital stacks and diverse investment models, each with distinct implications for control, risk, and scalability.
At the core of most developments lies the capital stack, which organizes financing into tiers based on seniority and risk exposure. Senior debt, typically provided by commercial banks, occupies the lowest-risk position and is secured against project assets. Equity, contributed by developers or investors, sits at the highest-risk level and captures residual profits. In more advanced markets, mezzanine financing bridges the gap between these layers, but in Kenya, this segment remains underdeveloped, leading to a heavier reliance on either debt or equity. This structural limitation often increases the cost of capital and reduces flexibility in project financing.
Within this broader framework, several key investment models are commonly used in Kenya’s Real Estate sector:
-
Joint Venture (JV) Model: The joint venture model is one of the most prevalent structures, particularly in urban developments where land is scarce and expensive. In this arrangement, a landowner contributes land as equity, while the developer provides capital, technical expertise, and project execution capabilities. Profits are shared based on agreed ratios, often determined by the relative value of land and financial input. This model reduces the need for large upfront capital outlays and enables developers to access prime locations without outright purchase. However, it introduces governance complexities, particularly around valuation, profit-sharing, and decision-making authority, which can lead to disputes if not carefully managed.
-
Off-Plan Sales Model: The off-plan model involves selling units before or during construction, with buyers making staged payments that are used to finance the development. This model is widely used in residential projects across Kenya, as it provides a relatively low-cost source of funding and reduces reliance on external debt. By effectively transferring part of the financing burden to end-users, developers can improve cash flow and accelerate project timelines. However, the model is highly sensitive to market confidence and demand conditions. A slowdown in sales can create liquidity challenges, while project delays can erode buyer trust and damage the developer’s reputation.
-
Blended Finance Model: Blended finance combines concessional capital from development partners with commercial funding from banks or private investors. This layered approach reduces overall financing costs and improves project feasibility, particularly in segments like affordable housing where purely commercial models may not be viable. By incorporating guarantees, grants, or low-interest loans, blended finance structures help to de-risk projects and attract additional private capital. However, these models are complex to structure and often come with stringent eligibility criteria and reporting requirements, limiting their accessibility to larger or more sophisticated developers.
-
Private Equity Real Estate Model: Private equity financing involves pooling capital from institutional and high-net-worth investors to invest directly in Real Estate projects in exchange for equity stakes. This model provides substantial funding and allows for the execution of large-scale developments that would be difficult to finance through debt alone. Private equity investors typically target high returns, often in the range of 18% to 25% in emerging markets, reflecting the higher risk profile. While this model enhances capital availability and strategic oversight, it also results in dilution of developer ownership and increased pressure to meet performance targets within defined investment timelines.
-
REIT-Based Financing Model: Real Estate Investment Trusts (REITs) offer a capital market-based approach to Real Estate financing, allowing developers to raise funds from a broad base of investors. Development REITs (D-REITs) are specifically designed to finance projects during the construction phase, while Income REITs (I-REITs) focus on stabilized, income-generating assets. In Kenya, the REIT market is still developing but shows potential as a scalable financing solution. REITs provide liquidity, transparency, and access to institutional capital, but their growth has been constrained by low market participation, regulatory complexities, and limited investor awareness.
-
Debt-Led Development Model: This model relies heavily on commercial bank financing, with developers contributing minimal equity and leveraging debt to fund the majority of project costs. While this approach can significantly enhance returns on equity during favorable market conditions, it also exposes developers to high financial risk, particularly in environments characterized by high interest rates and short loan tenors. The model is common in Kenya due to the dominance of bank financing but is often unsustainable in the long term due to refinancing risks and cash flow pressures.
Despite the availability of these diverse models, the Kenyan Real Estate sector continues to face structural inefficiencies in financing. One of the most prominent challenges is the fragmentation of funding sources, where developers must piece together capital from multiple channels without a unified framework. This increases transaction costs and complicates project execution. Additionally, the limited development of intermediate financing instruments, such as mezzanine debt, restricts the ability to optimize capital structures and balance risk effectively.
Risk allocation remains uneven across most models, with developers often bearing a disproportionate share of downside risk, particularly in debt-heavy or off-plan structures. At the same time, investors may face challenges related to governance, transparency, and market volatility, highlighting the need for stronger institutional frameworks and regulatory oversight. Furthermore, many of these models are highly sensitive to macroeconomic conditions, including interest rate fluctuations, currency movements, and shifts in demand, which can significantly impact project outcomes.
-
Key Challenges and Emerging Opportunities in Real Estate development Financing
Real Estate development finance in Kenya operates within a dynamic but constrained environment, shaped by structural inefficiencies, macroeconomic pressures, and evolving market demand. While significant progress has been made in diversifying funding sources and introducing new financing models, the sector continues to face deep-rooted challenges that limit scalability and efficiency. At the same time, these constraints have created space for innovation, giving rise to emerging opportunities that could redefine how Real Estate is financed and delivered in the future. The key challenges and opportunities can be understood as follows:
-
High cost of capital - The cost of financing remains one of the most significant barriers to Real Estate development in Kenya. The commercial bank interest rate charge average was 14.8 % in Q1’2026 which was a 1.5% points decrease from 16.3% recorded in Q1’2025, according to the central Bank of Kenya, which remains high despite the decrease and which increases total project costs and forces developers to price units at levels that are often unaffordable for the majority of the population. This not only affects project viability but also perpetuates the housing affordability gap.
-
Short-term nature of financing - A fundamental structural issue is the mismatch between short-term funding sources and the long-term nature of Real Estate assets. Most bank loans have relatively short tenors, creating refinancing risks and cash flow pressure for developers, particularly in projects with extended timelines or slow uptake.
-
Limited access to financing for small and mid-sized developers - Access to funding is heavily skewed toward established developers with strong balance sheets and collateral. Smaller developers, despite having viable projects, often struggle to secure financing due to stringent lending requirements and lack of track record. This limits competition and slows the overall pace of development.
-
Underdeveloped capital markets-Although instruments such as REITs exist, capital markets in Kenya remain relatively shallow and illiquid. Limited investor participation, low awareness, and regulatory complexities have constrained the growth of market-based financing solutions, reducing their ability to support large-scale development.
-
Weak end-user financing systems-Low mortgage penetration and stringent lending conditions for homebuyers limit the ability of end-users to purchase property. This creates a disconnect between supply and demand, where completed units remain unsold or under-occupied despite a clear housing deficit.
-
Land and regulatory challenges-Issues related to land ownership, titling, zoning, and lengthy approval processes continue to pose significant risks to developers. Delays and uncertainties in these areas increase project costs and timelines, reducing the efficiency of capital deployment.
-
Currency and macroeconomic risks-Exposure to foreign-denominated funding introduces currency risk, particularly when project revenues are in local currency. Additionally, inflation, interest rate volatility, and broader economic fluctuations can significantly impact both financing costs and market demand.
-
Fragmented financing structures-Developers often rely on multiple, uncoordinated funding sources, leading to complex capital structures and higher transaction costs. The absence of well-developed intermediate instruments such as mezzanine financing further limits flexibility in structuring deals.
Emerging Opportunities
-
Growth of Institutional Capital Participation-There is increasing interest from pension funds, insurance companies, and asset managers in Real Estate as an asset class. As these institutions seek long-term, stable returns, their participation could significantly expand the pool of available capital and support larger, more structured developments.
-
Expansion of REITs and Capital Market Instruments-The gradual growth of REITs and other Real Estate-linked securities presents an opportunity to mobilize capital from a broader investor base. With improved regulatory frameworks and increased investor awareness, capital markets could become a major financing channel for the sector.
-
Rise of Blended Finance and Public-Private Partnerships (PPPs)-Blended finance models that combine concessional and commercial capital are gaining traction, particularly in affordable housing and infrastructure-linked developments. Similarly, PPP frameworks offer opportunities for collaboration between government and private developers, enabling the execution of large-scale projects.
-
Technological Innovation and PropTech-Advances in property technology (PropTech), including digital platforms for property sales, crowdfunding, and data analytics, are creating new avenues for financing and investment. These innovations can improve transparency, reduce transaction costs, and expand access to capital.
-
Affordable Housing and Government Initiatives-Government-led programs aimed at increasing housing supply, particularly in the affordable segment, are creating new investment opportunities. These initiatives often include incentives such as tax breaks, infrastructure support, and access to concessional financing, making them attractive to developers and investors.
-
Green and Sustainable Financing-There is growing demand for environmentally sustainable buildings, supported by global trends and development finance institutions. Green financing instruments, including climate funds and sustainability-linked loans, provide opportunities for developers to access capital at favorable terms while meeting ESG standards.
-
Development of Secondary Cities and Satellite Towns-Urban expansion beyond major cities is creating new Real Estate markets with lower land costs and high growth potential. These emerging locations offer opportunities for large-scale, planned developments that can be financed more efficiently and delivered at lower cost.
-
Increasing Demand for Alternative Asset Classes-Segments such as student housing, logistics parks, data centers, and mixed-use developments are gaining traction. These alternative asset classes attract institutional investors and provide diversification opportunities within the Real Estate sector.
-
Conclusion and Recommendations
The Kenyan Real Estate financing landscape is defined by a clear tension: strong demand and opportunity on one side, and structural financial constraints on the other. The future of the sector will depend on how effectively these challenges are addressed while leveraging emerging opportunities to build a more efficient, inclusive, and scalable financing ecosystem. While development finance has enabled significant sector growth, it remains- Expensive, Short-term oriented and Structurally inefficient. The key issue is not merely access to capital, but the structure, pricing, and allocation of that capital. Sustainable growth in the sector will require i) deepening of capital markets, ii) Expansion of long-term financing instruments and iii) Integration of end-user financing solutions Ultimately, the future of development finance in Kenya’s Real Estate sector lies in aligning capital with affordability, risk with return, and supply with actual demand.
Disclaimer: The views expressed in this publication are those of the writers where particulars are not warranted. This publication, which is in compliance with Section 2 of the Capital Markets Authority Act Cap 485A, is meant for general information only and is not a warranty, representation, advice, or solicitation of any nature. Readers are advised in all circumstances to seek the advice of a registered investment advisor.

- Talk to us
- Kenya
- P.O Box 20695 - 00200, Nairobi, Kenya
- Cell +254709101200
- Tel +254709101200
- WhatsApp +254741676635
- United States
- +254709101200
- DOWNLOAD OUR APP
-


- Kenya
- 8th Floor, Pinetree Plaza, Kaburu Drive, Ngong Road, Nairobi, Kenya
- USA
- Suite 1150, 1775 Eye Street NW, USA, Washington DC 20006, USA
- Investments
- High Yield
- Private Equity
- Real Estate
- Real Estate
- RiverRun Estates
- Cytonn Towers
- The Ridge
- Taraji Heights
- The Alma