End of Interest Rate Caps?, & Cytonn Weekly #42/2019
By Research Team, Oct 20, 2019
Executive Summary
Fixed Income
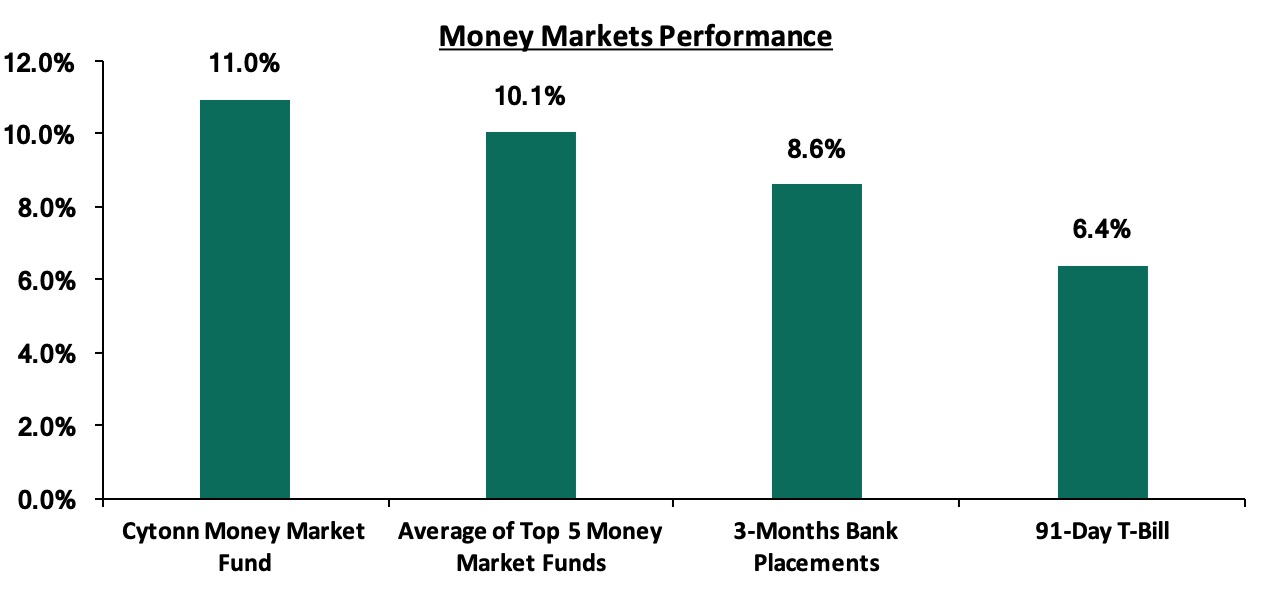
During the week, T-bills remained undersubscribed, with the subscription rate declining to 80.6%, from 98.3% recorded the previous week. The decline in the subscription rate is partly attributable to relatively tight liquidity conditions in the money market during the week; the relatively tight liquidity is attributable to the cyclical liquidity tightness due to the start of the new CRR cycle. The yield on the 91-day and 364-day papers remained unchanged at 6.4% and 9.8%, respectively, while the yield on the 182-day paper fell by 0.1% points to 7.2%, from 7.3% recorded the previous week. In the money markets, 3-month bank placements ended the week at 8.6% (based on what we have been offered by various banks), the 91-day T-bill came in at 6.4%, while the average of Top 5 Money Market Funds came in at 10.1%, higher than the 10.0% recorded the previous week, with the Cytonn Money Market Fund closing the week at 11.0%, from 10.9% recorded the previous week;
Equities
During the week, the equities market was on an upward trend with NASI, NSE 20 and NSE 25 gaining by 0.5%, 0.2% and 1.5%, respectively, taking their YTD performance to gains/losses of 5.6%, (13.2%) and (0.1%), for NASI, NSE 20 and NSE 25, respectively. During the week, President Uhuru Kenyatta submitted a memorandum to the Speaker of the National Assembly detailing his refusal to assent to the Finance Bill, 2019. HF Group announced that it retired its medium term bond issued in 2012, paying the final instalment of Kshs 3.2 bn to bondholders on Monday;
Private Equity
The UK Government, through its foreign aid department, Department for International Development (DFID), announced GBP 10.0 mn (Kshs 1.3 bn) of funding to Catalyst Fund, a fund managed by US-based consulting firm, Bankable Frontier Associates (BFA). This investment is aimed at boosting the FinTech sector in the East Africa region, by providing access to growth capital. In the West African market, Verod Capital Management Limited, a Nigeria-based investment management firm, through its private equity subsidiary, Verod Capital Partners announced its exit from UTL Trust Management, a Nigerian firm that offers trustee, fund management, estate administration and portfolio management services to corporate and individual clients, with the terms of the exit being undisclosed;
Real Estate
During the week, local retailer Naivas Supermarket announced plans to open four additional branches in the next few months, bringing the total number of outlets to fifty-nine. President Uhuru Kenyatta launched the Phase 2 of the Standard Gauge Railway (SGR) project, bringing to operationalization the rail between Nairobi and Suswa, in addition to the construction of the Jomo Kenyatta International Airport (JKIA)-Westlands Expressway, which will start at JKIA and terminate at James Gichuru, along Waiyaki Way Road, in Westlands.
Focus of the Week
This week we revisit the interest rate cap topic following the recommendation by President Uhuru Kenyatta to repeal the Interest Rate Cap, in a memorandum to Parliament in which he declined to assent the Finance Bill, 2019 into law. In this topical, we review the effects the interest rate cap has had so far in the economy and banking industry, and discuss the options available for lawmakers following the President’s recommendation. Lastly, we give our views and expectations regarding the interest rates controls in Kenya and the way forward.
- Caleb Mugendi, Assistant Manager – Public Markets was on Metropol TV to discuss the President's move to repeal the interest rate cap by failing to assent the Finance Bill, 2019. Watch Caleb here.
- David King’oo, Senior Procurement Associate, was on KBC Channel 1 to discuss the current high rate of the deficit in the Kenyan market. Watch David here.
- David Gitau, Investments Analyst, was on Metropol TV to discuss the markets and economic situation. Watch David here.
- Phase 1 of The Alma is now 100% sold with early buyers having achieved up to 55% capital appreciation. We are now running a promotion in Phase 2: Buy a unit in Phase 2 with a 15-year payment plan and 0% deposit. For inquiries, please email us on clientservices@cytonn.com. The site is open between 8 am - 5 pm, 7-days a week for site visits;
- Cytonn Money Market Fund closed the week at an average yield of 11.0% p.a. To subscribe, just dial *809#;
- For an exclusive tour of Cytonn’s real estate developments, visit: Sharp Investor’s Tour and for more information, email us at sales@cytonn.com;
- Following the completion and handover of Amara Ridge in Karen, we have now launched our next Karen project, dubbed Applewood, a Kshs 2.5 bn residential development located in Miotoni, Karen. This signature development shall comprise luxury homes, each sitting on 1/2 acre. We invite you to the exhibition of Applewood which is ongoing at the Amara Ridge Clubhouse (Location pin: https://goo.gl/maps/B3GVnu8pHyn) or at the Applewood Sales Centre on Miotoni Road (Location pin: https://goo.gl/maps/ZfABuGjFo1z) from 9:00 am to 5:00 pm daily. Call 0709 101 000 or email resales@cytonn.com to reserve a villa! See Video here;
- We continue to hold weekly workshops and site visits on how to build wealth through real estate investments. The weekly workshops and site visits target both investors looking to invest in real estate directly and those interested in high yield investment products to familiarize themselves with how we support our high yields. Watch progress videos and pictures of The Alma, Amara Ridge, and The Ridge;
- We continue to see very strong interest in our weekly Private Wealth Management Training (largely covering financial planning and structured products). The training is at no cost and is open only to pre-screened participants. We also continue to see institutions and investment groups interested in the training for their teams. Cytonn Foundation, under its financial literacy pillar, runs the Wealth Management Training. If interested in our Private Wealth Management Training for your employees or investment group, please get in touch with us through wmt@cytonn.com. To view the Wealth Management Training topics, click here;
- For recent news about the company, see our news section here;
- We have 10 investment-ready projects, offering attractive development and buyer targeted returns. See further details here: Summary of Investment-Ready Projects.
Money Markets, T-Bills & T-Bonds Primary Auction:
During the week, T-bills remained undersubscribed, with the subscription rate declining to 80.6%, from 98.3% recorded the previous week. The decline in the subscription rate is partly attributable to relatively tight liquidity conditions in the money market during the week; the relatively tight liquidity is attributable to the cyclical liquidity tightness due to the start of the new CRR cycle. The yield on the 91-day and 364-day papers remained unchanged at 6.4% and 9.8%, respectively, while the yield on the 182-day paper fell by 0.1% points to 7.2%, from 7.3% recorded the previous week. The acceptance rates decreased to 67.8%, from 71.7% recorded the previous week, with the government accepting Kshs 13.1 bn out of the Kshs 19.3 bn worth of bids received.
In the money markets, 3-month bank placements ended the week at 8.6% (based on what we have been offered by various banks), the 91-day T-bill came in at 6.4%, while the average of Top 5 Money Market Funds came in at 10.1%, higher than the 10.0% recorded the previous week, with the Cytonn Money Market Fund closing the week at 11.0%, from 10.9% recorded the previous week.
 Liquidity:
During the week, the average interbank rate increased by 0.2% points to 7.2% from 7.0% recorded the previous week, on the back of relatively tight liquidity conditions in the money market during the week, attributable to the cyclical liquidity tightness due to the start of the new CRR cycle. This saw the commercial banks’ excess reserves come in at Kshs 16.4 bn, compared to 11.5 bn recorded last week, in relation to the monthly 5.25% cash reserve requirement. The average volumes traded in the interbank market increased by 13.0% to Kshs 6.0 bn, from Kshs 5.3 bn the previous week.
Kenya Eurobonds:
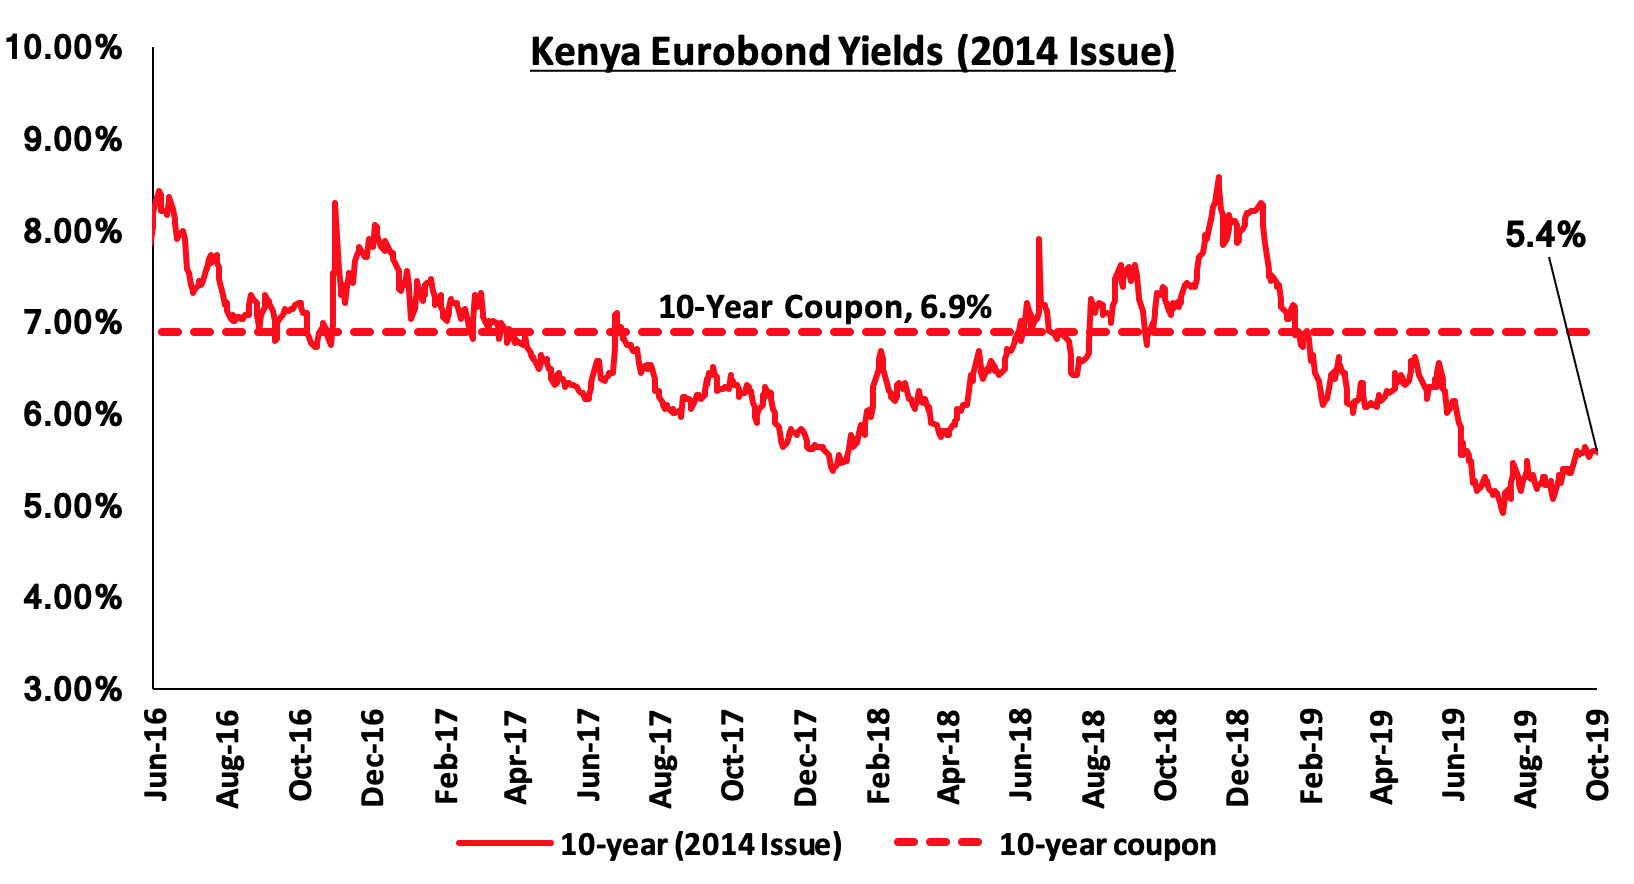
According to Reuters, the yield on the 10-year Eurobond issued in 2014 declined by 0.2% points to 5.4%, from 5.6% recorded the previous week. We attribute the decline across all the Kenya Eurobonds to easing risk concerns over the economy by investors following the news of a likelihood of the interest rate cap repeal, which is seen as likely to stimulate credit growth and the economy.
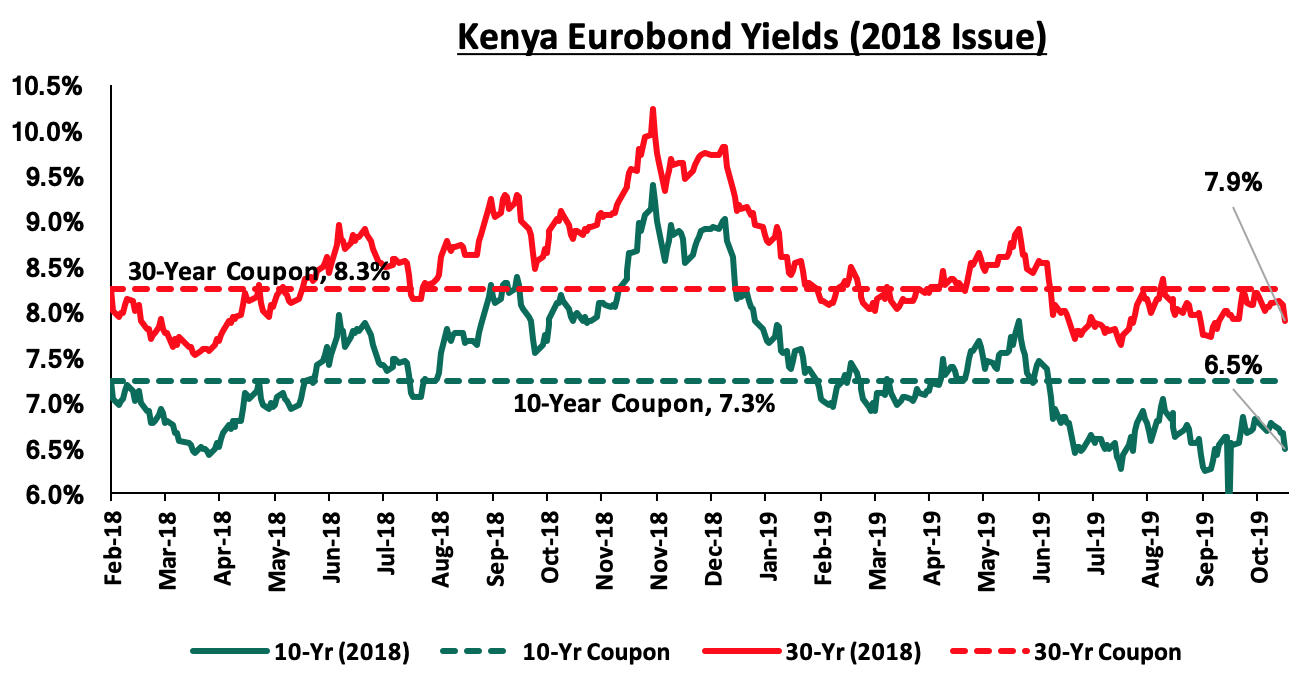
For the 2018 issues, the yields on the 10-year and 30-year Eurobonds both declined by 0.3% points and 0.2% points to 6.5% and 7.9%, from 6.8% and 8.1% recorded the previous week, respectively.
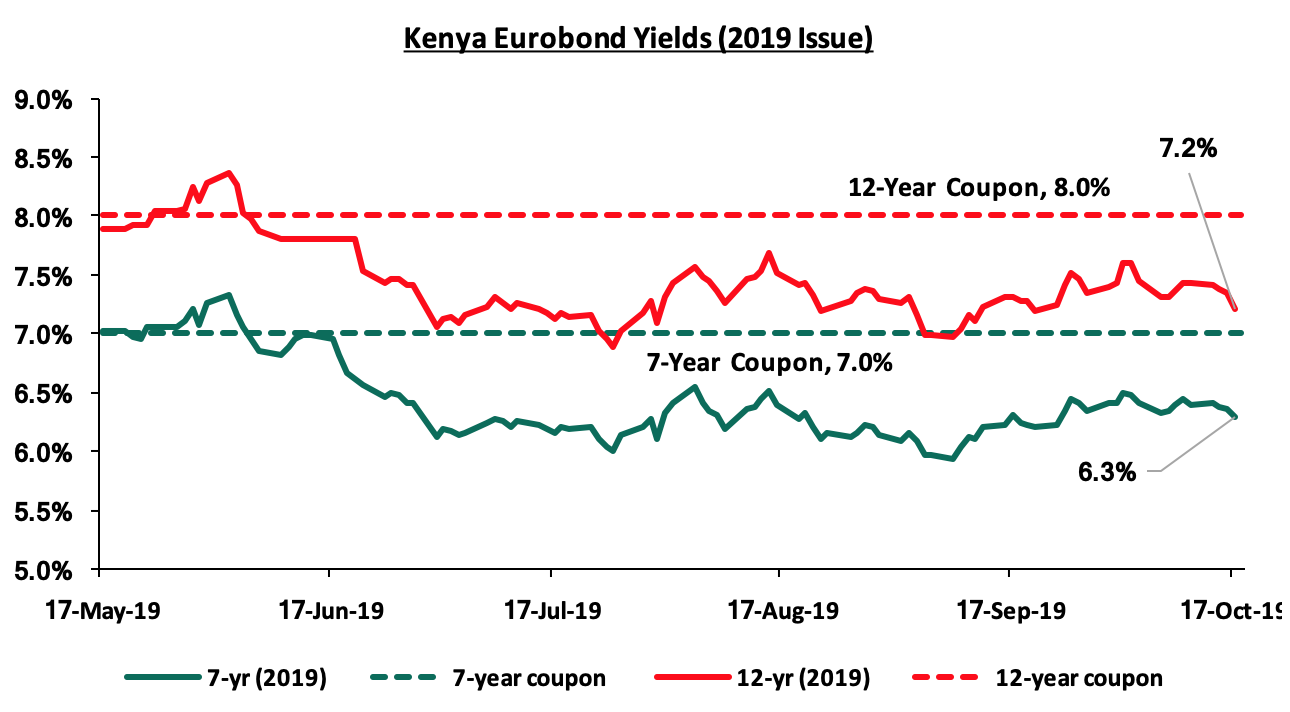
During the week, the yields on both the 7-year Eurobond and the 12-year Eurobond both declined by 0.1% points and 0.2% points to come in at 6.3% and 7.2% from 6.4% and 7.4% recorded the previous week, respectively.
Kenya Shilling:
During the week, the Kenya Shilling appreciated marginally by 0.1% against the US Dollar to close at Kshs 103.7, from 103.8 recorded the previous week, supported by inflows from diaspora remittances, easing dollar demand from merchandise importers. On a YTD basis, the shilling has depreciated by 1.9% against the dollar, in comparison to the 1.3% appreciation in 2018. In our view, the shilling should remain relatively stable against the dollar in the short term, supported by:
- The narrowing of the current account deficit, with preliminary data indicating that Kenya’s current account deficit improved by 11.8% during Q2’2019, coming in at a deficit of Kshs 107.6 bn, from Kshs 122.0 bn in Q2’2018, equivalent to (6.2%) of GDP, from (7.6%) recorded in Q2’2018. This was mainly driven by the narrowing of the country’s merchandise trade deficit by 1.7% and a rise in secondary income (transfers) balance by 5.1%,
- Improving diaspora remittances, which have increased cumulatively by 8.9% in the 12-months to August 2019 to USD 2.8 bn, from USD 2.6 bn recorded in a similar period of review in 2018. The rise is due to :
- Increased uptake of financial products by the diaspora due to financial services firms, particularly banks, targeting the diaspora, and,
- New partnerships between international money remittance providers and local commercial banks making the process more convenient,
- CBK’s supportive activities in the money market, such as repurchase agreements and selling of dollars, and,
- High levels of forex reserves, currently at USD 8.9 bn (equivalent to 5.6-months of import cover), above the statutory requirement of maintaining at least 4.0-months of import cover, and the EAC region’s convergence criteria of 4.5-months of import cover.
Weekly Highlight:
During the week, the IMF released its World Economic Outlook, October 2019, dubbed “Global Manufacturing Downturn, Rising Trade Barriers”. According to the report, global growth is expected to be slower in 2019, with the IMF downgrading the growth rate to 3.0% from 3.3% projected as at the start of the year, with the 3.0% being the slowest pace since the global financial crisis. The decline in growth is attributable to trade tensions, which have resulted in significant tariff increases between the United States and China; this has hurt business sentiment and confidence globally. Kenya’s economic growth for the year was also revised downwards to 5.6%, from their previous projection of 5.8%, released in April 2019.
In the second quarter of 2019, Kenya’s economy grew by 5.6%, lower than the 6.4% growth seen during a similar period in 2018. Some of the highlights are;
- Growth was driven by; (i) a recovery in the Financial and Insurance Sector, which recorded a growth of 6.7% compared to the growth of 3.9% seen in Q2’2018, (ii) increased output in the Education, Transport and Storage and Construction sectors, which grew by 6.0%, 7.2% and 7.2%, compared to 4.5%, 6.0% and 5.2% seen last year, respectively, and (iii) Information and Communication sector, which recorded the highest growth of 11.6%, compared to 11.7% recorded in Q2’2018,
- However, growth was weighed down by; (i) the Agricultural sector, which recorded a slower growth of 4.1%, compared to 6.5% seen in Q2’2018, and (ii) the Professional, Admin and Support Services sector, which recorded a growth of 7.6%, compared to 15.2% seen in Q2’2018.
- Below is a table highlighting the contribution to growth by sector:
|
Sector |
Contribution Q2'2018 |
Contribution Q2'2019 |
Q2'2018 Growth |
Q2'2019 Growth |
Weighted Growth Rate Q2'2018 |
Weighted Growth Rate Q2'2019 |
Variance |
|
Agriculture and Forestry |
23.4% |
23.1% |
6.5% |
4.1% |
1.5% |
0.9% |
(0.6%) |
|
Taxes on Products |
10.9% |
10.8% |
5.5% |
4.5% |
0.6% |
0.5% |
(0.1%) |
|
Manufacturing |
9.8% |
9.7% |
4.7% |
4.2% |
0.5% |
0.4% |
(0.1%) |
|
Real estate |
8.3% |
8.2% |
4.9% |
5.4% |
0.4% |
0.4% |
0.0% |
|
Wholesale and retail trade |
7.1% |
7.1% |
5.8% |
5.8% |
0.4% |
0.4% |
0.0% |
|
Education |
6.8% |
6.8% |
4.5% |
6.0% |
0.3% |
0.4% |
0.1% |
|
Transport and Storage |
6.8% |
6.9% |
6.0% |
7.2% |
0.4% |
0.5% |
0.1% |
|
Financial & Insurance |
5.9% |
5.9% |
3.9% |
6.7% |
0.2% |
0.4% |
0.2% |
|
Construction |
5.4% |
5.5% |
5.2% |
7.2% |
0.3% |
0.4% |
0.1% |
|
Information and Communication |
3.5% |
3.6% |
11.7% |
11.6% |
0.4% |
0.4% |
0.0% |
|
Public administration |
4.3% |
4.3% |
6.4% |
6.0% |
0.3% |
0.3% |
(0.0%) |
|
Electricity and Water Supply |
2.8% |
2.8% |
10.5% |
5.6% |
0.3% |
0.2% |
(0.1%) |
|
Professional admin |
2.4% |
2.4% |
15.2% |
7.6% |
0.4% |
0.2% |
(0.2%) |
|
Health |
1.8% |
1.8% |
2.5% |
5.2% |
0.0% |
0.1% |
0.0% |
|
Accommodation & Food Services |
1.0% |
1.0% |
15.4% |
10.6% |
0.1% |
0.1% |
(0.0%) |
|
Other services |
1.2% |
1.2% |
5.0% |
2.3% |
0.1% |
0.0% |
(0.0%) |
|
Mining and quarrying |
0.9% |
0.9% |
1.4% |
5.7% |
0.0% |
0.1% |
0.0% |
|
Financial Services Indirectly Measured |
(2.2%) |
(2.1%) |
(0.4%) |
4.0% |
0.0% |
(0.1%) |
(0.1%) |
|
GDP at Market Prices |
100.0% |
100.0% |
6.4% |
5.6% |
6.4% |
5.6% |
(0.7%) |
- For a more detailed analysis, kindly see our analysis on Kenya’s Q2’2019 GDP Growth and 2019 Outlook.
Below is a table showing average projected GDP growth for Kenya in 2019 with a downward readjustment of the IMF and the National Treasury; noteworthy being that the highest projection is by the Central Bank of Kenya at 6.3%. We shall be updating this table should projections change and shall highlight who had the most accurate projection at the end of the year.
|
Kenya 2019 Annual GDP Growth Outlook |
||||
|
No. |
Organization |
Q1'2019 |
Q2'2019 |
Q3’2019 |
|
1. |
Central Bank of Kenya |
6.3% |
6.3% |
6.3% |
|
2. |
The National Treasury* |
6.2% |
6.2% |
6.0% |
|
3. |
Citigroup Global Markets |
6.1% |
6.1% |
6.1% |
|
4. |
African Development Bank (AfDB) |
6.0% |
6.0% |
6.0% |
|
5. |
PNB Paribas |
6.0% |
6.0% |
6.1% |
|
6. |
UK HSBC |
6.0% |
6.0% |
6.0% |
|
7. |
Euromonitor International |
5.9% |
5.9% |
6.3% |
|
8. |
International Monetary Fund (IMF)* |
6.1% |
5.8% |
5.6% |
|
9. |
Cytonn Investments Management Plc |
5.8% |
5.8% |
5.8% |
|
10. |
Focus Economics |
5.8% |
5.8% |
5.6% |
|
11. |
World Bank |
5.8% |
5.7% |
5.7% |
|
12. |
JPMorgan |
5.7% |
5.7% |
5.6% |
|
13. |
Euler Hermes |
5.7% |
5.7% |
5.7% |
|
14. |
Oxford Economics |
5.6% |
5.6% |
5.6% |
|
|
Average |
5.9% |
5.9% |
5.9% |
|
*Revised Growth rates for Q3’2019 |
||||
From the above table, the changes are:
- International Monetary Fund revised its projection from 5.8% as at Q2’2019, to 5.6% in Q3’2019, and,
- The National Treasury revised its projection from 6.2% as at Q2’2019, to 6.0% in Q3’2019
In our view, we expect the country’s GDP growth to slow down to a range of 5.7% - 5.9% from 6.3% recorded in 2018, due to the delayed onset of the long rains in most parts of the country. This is expected to affect agricultural production and will consequently have an effect on the manufacturing sector, which is highly dependent on Agroprocessing.
During the week, the Energy and Petroleum Regulatory Authority released their monthly statement on the maximum retail fuel prices in Kenya effective from 15th October 2019 to 14th November 2019. Below are the key take-outs from the statement:
- Petrol prices have declined by 4.2% to Kshs 108.1 from Kshs 112.8 per litre previously, while diesel prices have declined by 1.1% to Kshs 102.0 from Kshs 103.0, previously, and,
- Kerosene prices however increased by 0.4% to Kshs 101.1 from Kshs 100.6 per litre.
The changes in prices are attributable to:
- A decrease in the average landing cost of imported super petrol by 7.7% to USD 459.3 per cubic meter in September 2019, from USD 497.4 per cubic meter in August 2019,
- A decrease in the average landing costs of imported diesel by 2.3% to USD 491.9 per cubic meter in September 2019, from USD 503.6 per cubic meter in August 2019, and Kerosene increasing by 0.5% to USD 486.6 per cubic meter in September 2019, from USD 484.3 per cubic meter in August 2019, and,
- The Free on Board (FOB) price of Murban crude oil lifted in September 2019 posted an increase by 3.4% to USD 64.4 from USD 62.3, per barrel in August 2019.
We expect a decline in the transport index, which carries a weighting of 8.7% in the total consumer price index (CPI), due to the decreased petrol and diesel pump prices. Consequently, the decline in the transport index will ease inflationary pressures since transport is a critical component in other sectors. It will thus result to lower input costs.
Rates in the fixed income market have remained relatively stable as the government rejects expensive bids. A budget deficit is likely to result from depressed revenue collection with the revenue target for FY’2019/2020 at Kshs 2.1 tn, creating uncertainty in the interest rate environment as additional borrowing from the domestic market goes to plug the deficit. Putting into consideration the possible repeal of the interest rate cap, we expect improved private sector credit growth in the country, especially access to credit by MSMEs. This will lead to increased competition for bank funds from both the private and public sectors, thereby reducing liquidity in the money market, resulting in upward pressure on interest rates. Owing to this, we will be updating our Fixed Income House View.
Market Performance
During the week, the equities market was on an upward trend with NASI, NSE 20 and NSE 25 gaining by 0.5%, 0.2% and 1.5%, respectively, taking their YTD performance to gains/losses of 5.6%, (13.2%) and (0.1%), for NASI, NSE 20 and NSE 25, respectively. The performance in NASI was driven by gains recorded by stocks in the Banking sector with NIC Group, I&M Holdings, Equity Group and KCB Group recording gains of 10.2%, 6.3%, 5.3% and 3.5%, respectively, as the market reacted to the news of the President’s refusal to assent to the Finance Bill 2019 in an attempt to repeal the interest rate cap.
Equities turnover increased by 157.1% during the week to USD 34.4 mn, from USD 13.4 mn the previous week, taking the YTD turnover to USD 1,132.0 mn. Foreign investors remained net sellers for the week, with a net selling position of USD 8.5 mn, from a net selling position of USD 0.4 mn the previous week.
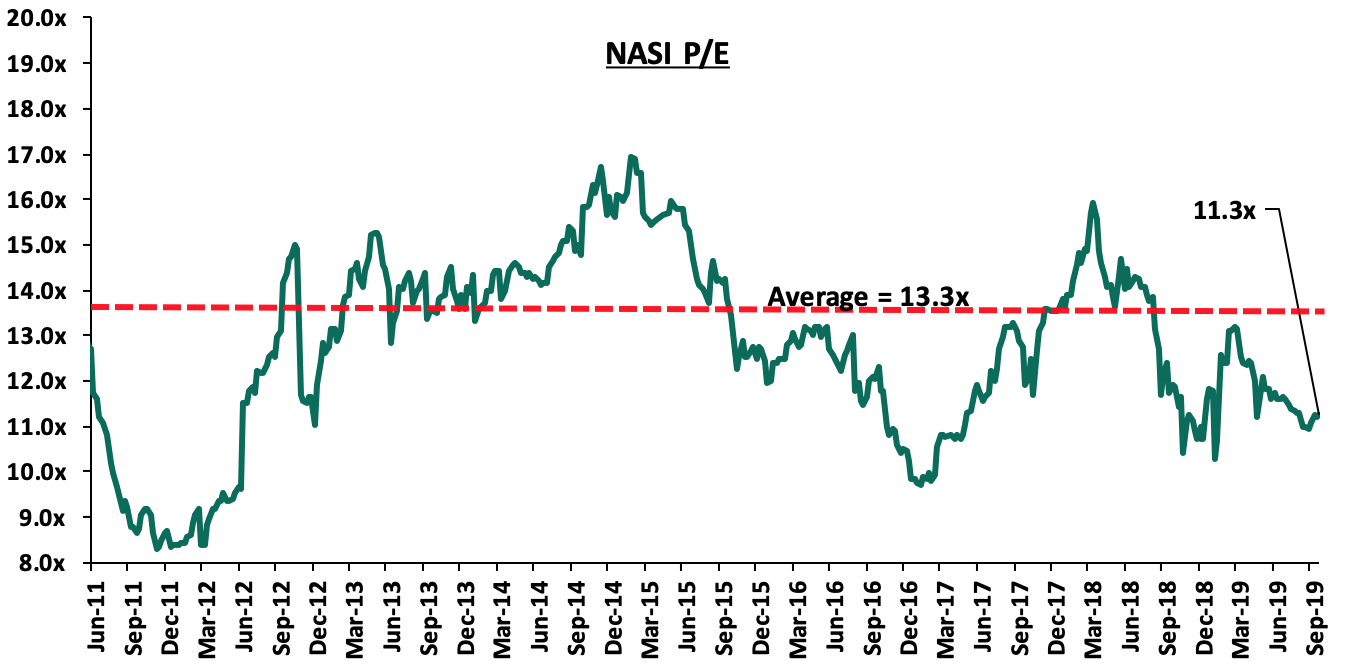
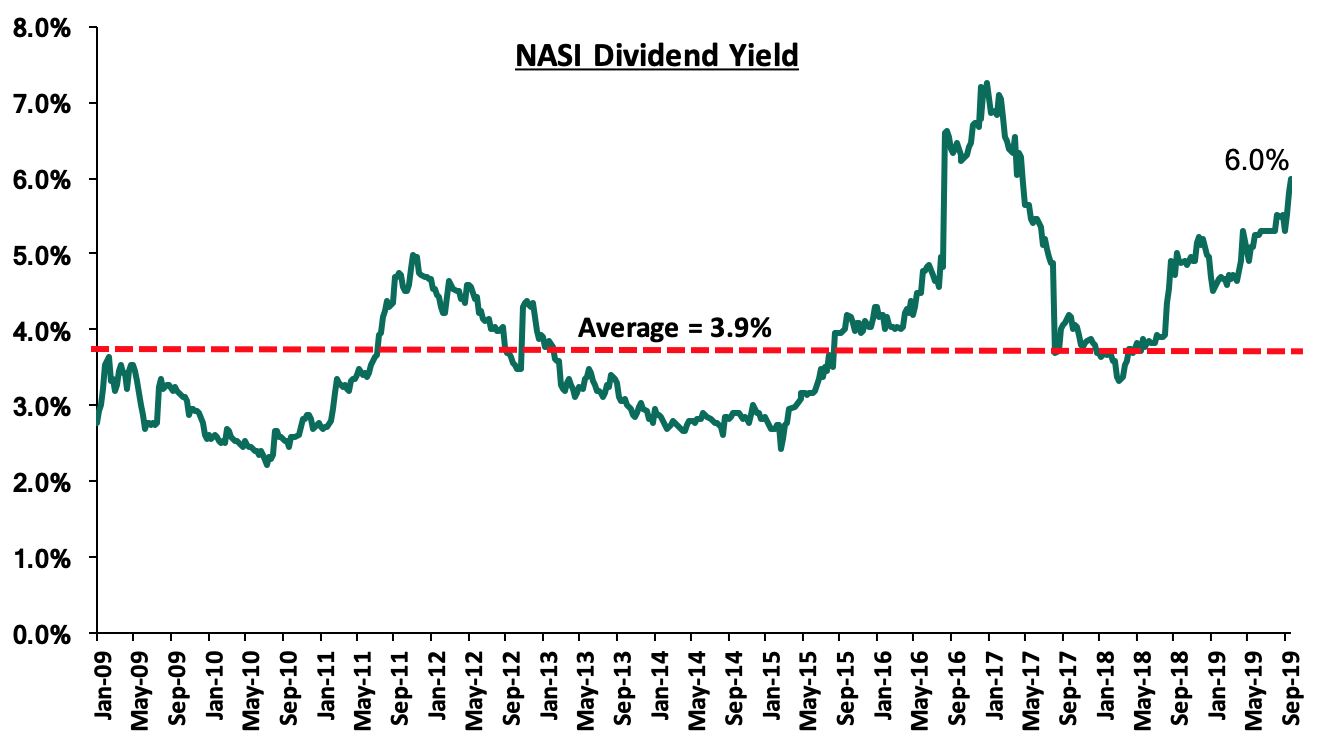
The market is currently trading at a price to earnings ratio (P/E) of 11.3x, 15.3% below the historical average of 13.3x, and a dividend yield of 6.0% above the historical average of 3.9%. With the market trading at valuations below the historical average, we believe there is value in the market. The current P/E valuation of 11.3x is 16.0% above the most recent trough valuation of 9.7x experienced in the first week of February 2017, and 35.5% above the previous trough valuation of 8.3x experienced in December 2011. The charts below indicate the historical P/E and dividend yields of the market.
Weekly Highlight
During the week, President Uhuru Kenyatta submitted a memorandum to the Speaker of the National Assembly detailing his refusal to assent to the Finance Bill 2019. The President, instead, endorsed the amendment of the Bill, by deleting clause 45 and substituting it to read, “The Banking Act is amended by repealing Section 33B”. In the memorandum, the President cited that while the purpose of the capping was to address the wide concerns about affordability and availability of credit to Kenyans, the capping of interest rates instead caused unintended consequences that are significant and damaging to the economy and Micro, Small and Medium Enterprises (MSMEs). In the memo, the president highlighted that the re-introduction of Clause 45 of the Bill by the National Assembly would worsen the unintended effects brought about by the cap such as;
- The reduction of credit to the private sector, particularly MSMEs,
- A decline in economic growth,
- The weakening of the effectiveness of a monetary policy,
- The reduction of loan advances by banks,
- The growing number of shylocks and other unregulated lenders in the financial sector, and
- Problems such as the withdrawal of banks’ lending to specific segments of the market,
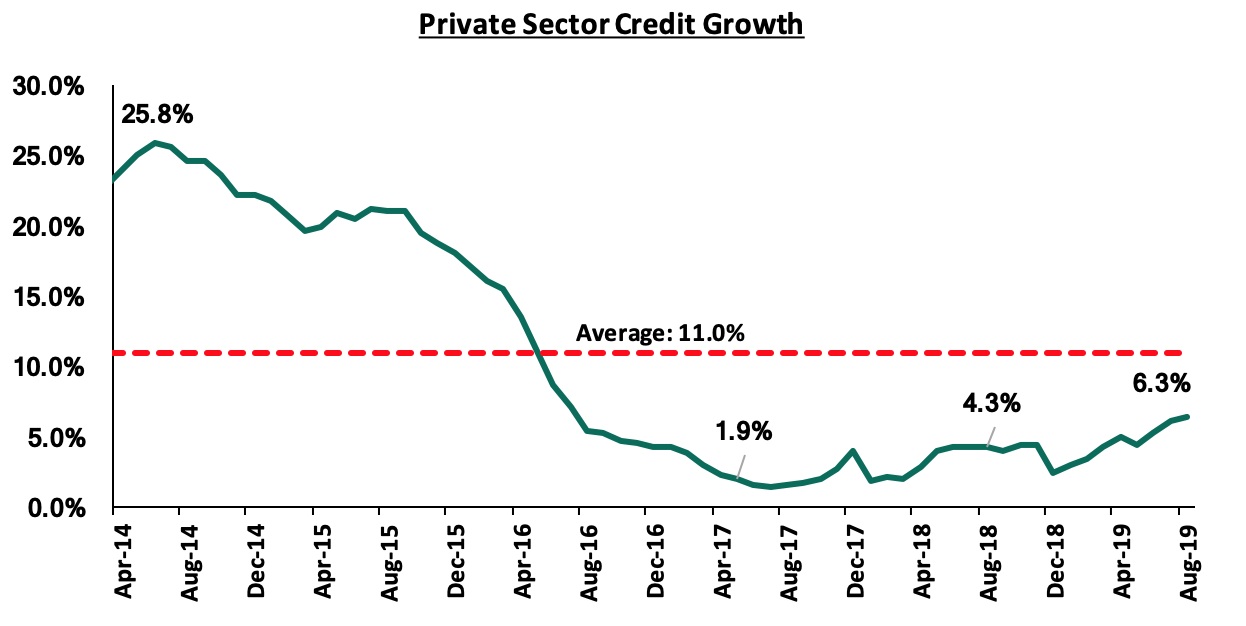
The concerns of the President echoes calls by various organizations such as the IMF, the Kenya National Chamber of Commerce and Industry, the Central Bank of Kenya and the National Treasury to repeal the rate cap law. We continue to reiterate the need to urgently repeal the Banking (Amendment) Act, 2015, as it has hampered credit growth, evidenced by the continued decline of private sector credit growth, which grew by 6.3% in the 12 months to August 2019, below the 5-year average of 11.0%. A more detailed analysis is can be found in this week’s focus.
During the week, HF Group announced that it retired the medium term bond issued in 2012, paying the final instalment of Kshs 3.2 bn to bondholders on Monday. HF Group received approval for listing and issuing their corporate bond of Kshs 10.0 bn with a fixed coupon rate of 13.0% in 2010. They managed to raise the bond in two tranches where in 2010 they raised Kshs 7.0 bn, and in 2012, they listed and raised the remaining Kshs 3.0 bn. This being a medium-term note of a period of 7 years, they paid off the first Kshs 7.0 bn in 2017 which was financed from a Kshs 3.0 bn in foreign currency debt and monthly cash collections from its lending and property development operations. This last instalment was paid from its internally generated cash-reserves. According to the Chairman Mr. Steve Mainda, the bond’s purpose was to provide the bank with long term funding which they could use to explore financing towards the housing shortage in the middle and lower-income segments. This would be through providing mortgage financing for existing and aspiring homeowners, and the development of affordable residential housing for the middle and lower-income population in Nairobi. Additionally, this bond allowed them to offer fixed mortgages, which would cushion customers from fluctuating interest rates. Both issues recorded an oversubscription rate of 40.0%, with the initial target in 2010 being to raise Kshs 5.0 bn. Similarly, the second tranche issued in 2012 was oversubscribed by 67.0%, with HF Group raising Kshs 5.0 bn from an initial target of Kshs 3.0 bn, implying a positive interest in corporate bonds among investors. Currently, the interest in issuing new corporate bonds among firms has decreased, which is proven by HF Group’s lack of intention to issue another bond, following in the steps of I&M Holdings, UAP OldMutual and CIC Group, who have also retired maturing bonds this year, and have not indicated need to come back to the market for additional funds. This is partly attributed to sour investor sentiment, on account of the corporate loan defaulters such as Nakumatt, Imperial Bank, Chase Bank, and ARM Cement, and firms such as Real People and Consolidated Bank deferring repayment on the borrowings.
Universe of Coverage
Below is a summary of our universe of coverage:
|
Banks |
Price at 11/10/2019 |
Price at 18/10/2019 |
w/w change |
YTD Change |
Target Price* |
Dividend Yield |
Upside/ Downside** |
P/TBv Multiple |
Recommendation |
|
I&M Holdings*** |
46.1 |
49.0 |
6.3% |
5.9% |
79.8 |
7.2% |
70.1% |
0.8x |
Buy |
|
Sanlam |
17.4 |
17.1 |
(2.0%) |
(14.8%) |
29.0 |
0.0% |
70.1% |
0.8x |
Buy |
|
Diamond Trust Bank |
114.8 |
117.5 |
2.4% |
(27.2%) |
175.6 |
2.2% |
51.7% |
0.6x |
Buy |
|
KCB Group*** |
41.8 |
43.3 |
3.5% |
12.1% |
61.4 |
8.1% |
50.0% |
1.1x |
Buy |
|
Equity Group*** |
36.1 |
38.0 |
5.3% |
7.5% |
53.0 |
5.3% |
44.7% |
1.6x |
Buy |
|
CIC Group |
3.0 |
3.0 |
0.0% |
(20.5%) |
3.8 |
4.3% |
31.0% |
1.2x |
Buy |
|
Kenya Reinsurance |
3.0 |
3.0 |
(1.0%) |
(17.2%) |
3.8 |
5.0% |
30.0% |
0.1x |
Buy |
|
Britam |
6.9 |
7.1 |
2.0% |
(30.2%) |
8.8 |
4.9% |
29.2% |
0.7x |
Buy |
|
Co-operative Bank |
12.1 |
12.5 |
2.9% |
(16.8%) |
15.0 |
8.0% |
28.5% |
1.0x |
Buy |
|
Jubilee holdings |
350.0 |
343.3 |
(1.9%) |
(13.5%) |
418.5 |
2.6% |
24.5% |
1.0x |
Buy |
|
NIC Group |
29.0 |
32.0 |
10.2% |
7.7% |
37.9 |
3.1% |
21.7% |
0.6x |
Buy |
|
Liberty Holdings |
9.8 |
9.7 |
(0.2%) |
(24.7%) |
11.3 |
5.1% |
21.1% |
0.7x |
Buy |
|
Barclays Bank*** |
11.1 |
11.4 |
2.7% |
0.0% |
12.6 |
9.7% |
20.5% |
1.4x |
Buy |
|
Standard Chartered |
195.5 |
195.8 |
0.1% |
2.7% |
208.0 |
6.4% |
12.6% |
1.5x |
Accumulate |
|
Stanbic Holdings |
96.0 |
99.5 |
3.6% |
5.8% |
100.5 |
5.9% |
6.9% |
1.1x |
Hold |
|
HF Group |
6.9 |
6.8 |
(1.7%) |
27.1% |
2.8 |
0.0% |
(59.5%) |
0.2x |
Sell |
|
*Target Price as per Cytonn Analyst estimates **Upside / (Downside) is adjusted for Dividend Yield ***Banks in which Cytonn and/or its affiliates are invested in |
|||||||||
We are “Positive” on equities for investors as the sustained price declines have seen the market P/E decline to below its historical average. We expect increased market activity, and possibly increased inflows from foreign investors, as they take advantage of the attractive valuations, to support the positive performance.
During the week, the UK Government, through its Department for International Development, which is responsible for administering overseas aid, announced GBP 10.0 mn (Kshs 1.3 bn) of funding to Catalyst Fund, a fund managed by US-based consulting firm, Bankable Frontier Associates (BFA). This investment is aimed at boosting the FinTech sector in the East Africa region, particularly Kenya, by providing access to growth capital.
Catalyst Fund specializes in early-stage venture building targeting low-income customers in emerging markets, with an aim of spurring innovation that is targeted at financial inclusion for the unbanked population in emerging markets. Since its launch in 2016, Catalyst Fund has deployed USD 2.0 mn (Kshs 207.6 mn) in grant capital and USD 1.0 mn (Kshs 103.8 mn) in bespoke advisory services to over 20 global startup enterprises, of which 60% are located in Africa. Its most recent investment was in June 2019, where they announced that they had on-boarded four finance startups into its incubator program, with three having an Africa focus, these being (i) Chipper Cash, a mobile money transfer platform with operations in Kenya, Ghana and Nigeria, (ii) Salutat, a Singapore-based startup that helps financial institutions to reach out to more underserved entrepreneurs, especially women, by offering lower-interest loans and financial literacy training, with operations in Thailand, Myanmar, Kenya, and Zimbabwe, and (iii) Turaco, a Kenyan low-cost insurance provider targeting low-income customers. The fund has garnered the support of firms such as the Bill & Melinda Gates Foundation and JPMorgan Chase & Co.
This investment is an indicator of the positive outlook for the FinTech sector. We expect the FinTech sector to continue to witness more investments, given the untapped potential in credit and credit-related industries in Africa, highlighted by the significant difference in credit extension activity in Africa compared to other world regions, which results in slow growth of enterprises, especially MSMEs, both through a lack of access to growth capital as well as lack of access to consumption capital, thus limiting the spending power of consumers to the populations served by these enterprises. FinTech lending addresses this by providing access to credit via convenient and already established channels.
Verod Capital Management Limited, a Nigeria-based investment management firm, through its private equity subsidiary, Verod Capital Partners, announced its exit from UTL Trust Management, a Nigerian firm that offers trustee, fund management, estate administration and portfolio management services to corporate and individual clients. The terms of the exit were not disclosed.
Verod Capital Partners has historically invested in SME companies in West Africa including Nigeria, Ghana, Liberia, Sierra Leone and Gambia. The firm invested in Union Trustees Limited in 2015, where it acquired 100% stake in Union Trustees Limited, from Union Bank of Nigeria, for an undisclosed amount, as part of the USD 115.0 mn (Kshs 11.9 bn) Verod Fund II, which closed in 2015, supported by global and local institutional investors. The investment was aimed at allowing for services to be delivered through the development of highly skilled personnel and application of world-class technology. The funding and support provided by Verod Capital assisted in expanding Union Trustees Limited and according to Verod Capital, has generated acceptable private equity return.
Private equity investments in Africa remain robust as evidenced by the increasing investor interest, which is attributed to; (i) rapid urbanization, a resilient and adapting middle class and increased consumerism, (ii) the attractive valuations in Sub Saharan Africa’s private markets compared to its public markets, (iii) the attractive valuations in Sub Saharan Africa’s markets compared to global markets, and (iv) better economic projections in Sub Sahara Africa compared to global markets. We remain bullish on PE as an asset class in Sub-Sahara Africa. Going forward, the increasing investor interest and a stable macro-economic environment will continue to boost deal flow into African markets.
- Residential Sector
Ndemi Gardens Estate, a 14-floor residential estate located along Ngong Road, is set to open in December this year. The project, which is near completion has 4 blocks of 3-bed units of 133 SQM and 152 SQM, and priced at Kshs 12.0 mn and Kshs 14.0 mn, respectively. This translates to Kshs 92,105 per SQM, which is 7.7% lower than the Ngong road market average of Kshs 99,800 per SQM, according to the Cytonn (NMA) Residential Report 2018/2019.
The table below summarizes apartment’s performance in 2018/2019 in the lower mid-end suburbs:
(All Values in Kshs Unless Stated Otherwise)
|
Apartments Performance 2018/2019 (Lower Mid-End Suburbs) |
|||||||
|
Area |
Average Price per SQM |
Average Rent per SQM |
Average Annual Uptake |
Average Occupancy |
Average Rental Yield |
Average Price Appreciation |
Total returns |
|
Lang’ata |
97,012 |
544 |
15.0% |
85.4% |
5.5% |
1.3% |
6.8% |
|
South B/C |
99,059 |
497 |
20.6% |
88.8% |
4.8% |
0.8% |
5.6% |
|
Imara Daima |
63,203 |
354 |
22.3% |
98.9% |
5.6% |
(0.2%) |
5.4% |
|
Dagoretti |
89,807 |
627 |
16.5% |
88.7% |
5.1% |
0.0% |
5.1% |
|
Ngong Road |
99,800 |
508 |
20.7% |
84.7% |
4.5% |
0.9% |
5.4% |
|
Upper Kabete |
97,719 |
380 |
25.8% |
82.3% |
4.3% |
1.0% |
5.3% |
|
Kahawa West |
74,521 |
396 |
19.0% |
72.8% |
3.9% |
(0.7%) |
3.1% |
|
Lower Mid-End Suburbs Average |
88,731 |
472 |
20.0% |
85.9% |
4.8% |
0.4% |
5.3% |
Source: Cytonn Research
Despite the tough financial environment in Kenya, we continue to see increased activities in the lower mid-end residential sector with developers adopting prudent ways of increasing uptake by charging relatively lower prices than the market rates and offering additional amenities such as gyms and spacious gardens. We expect this to enhance uptake in the lower mid-end segment given the existing demand for affordable housing units, in the wake of unmatched demand in the high and upper mid-end segments.
- Retail Sector
During the week, local retailer Naivas Supermarket announced plans to open four additional branches in the next few months, bringing the total number of outlets to fifty-nine. The additional branches will be situated in Mombasa, Embu, near Yaya Centre and along the Eastern Bypass. The move is in line with the retailer’s expansion strategy aimed at tapping into the Nairobi outskirts and urban cities in the wake of increased competition from international retailers such as Carrefour and Shoprite, and local players such as Quickmart.
Expansion strategies by local retailers such as Naivas and Tuskys aimed at increasing market share in the Kenyan retail market are supported by:
- Positive demographics as Kenya’s urban population continues to expand at an annual rate of 4.3%, compared to a global average of 2.0%,
- Continued change in tastes and preferences by a growing middle class towards international products, thus creating a niche for international retailers,
- Improving infrastructure, which has encouraged a growth in mall space as this encourages tenancy and footfall,
- Growth of Small and Medium-Sized Enterprises (SMEs), and,
- The availability of relatively low-priced retail spaces especially in the satellite towns. According to Cytonn’s Kenya Real Estate Retail Report 2019, the average rent prices for urban cities such as Mombasa, Kisumu and Nakuru in Kenya came in at Kshs 118.0 per SQFT, with Nairobi recording the highest at Kshs 168.6 per SQFT.
Despite the increased activity, the performance of key urban cities in Kenya softened during the year with rental yields declining by 1.6% points to 7.0% in 2019, from 8.6% in 2018, driven by a drop in occupancy rates by 8.7% points to 77.3% in 2019, from 86.0% in 2018. The decline in performance is mainly attributed to the adoption of informal retail spaces and mixed-use developments by retailers and the increase in supply of retail space by 0.8 mn SQFT in 2019 with malls such as Lake Basin Mall in Kisumu and the Signature Mall in Kitengela. Mt. Kenya was the best performing region, with average yields of 8.6% and rental rates of Kshs 129.8 per SQFT. The Mt. Kenya region has a relatively low mall space supply accounting for 7.7% market share in Kenya, which means high occupancy rates.
The performance of the key urban centres in Kenya is as summarized below:
(All Values in Kshs Unless Stated Otherwise)
|
Summary of 2019 Retail Performance in Key Urban Cities in Kenya |
||||||||
|
Region |
Rent Per SQFT 2019 |
Occupancy Rate 2019 |
Rental Yield 2019 |
Rent Per SQFT 2018 |
Occupancy Rate 2018 |
Rental Yield 2018 |
Change in Occupancy Y/Y |
Change in Yield Y/Y |
|
Mt. Kenya |
129.8 |
80.0% |
8.6% |
130.1 |
84.5% |
9.9% |
(4.5%) |
(1.3%) |
|
Nairobi |
168.6 |
75.1% |
8.0% |
178.9 |
83.7% |
9.4% |
(8.6%) |
(1.4%) |
|
Eldoret |
131.0 |
82.3% |
7.9% |
134.1 |
78.5% |
7.6% |
3.8% |
0.3% |
|
Mombasa |
122.8 |
73.3% |
7.3% |
135.8 |
96.3% |
8.3% |
(22.9%) |
(0.9%) |
|
Kisumu |
96.9 |
75.8% |
5.6% |
106.3 |
88.0% |
9.7% |
(12.2%) |
(4.1%) |
|
Nakuru |
59.2 |
77.5% |
4.5% |
63.0 |
85.0% |
6.9% |
(7.5%) |
(2.4%) |
|
Average |
118.0 |
77.3% |
7.0% |
124.7 |
86.0% |
8.6% |
(8.7%) |
(1.6%) |
|
||||||||
Source: Cytonn Research
We expect to witness the continued expansion of retailers into the outskirts of Nairobi, as they seek to not only grow their market share but also leverage from the growing demand for retail products by the growing middle class, with a corresponding high purchasing power in urban cities around the country.
- Infrastructure Sector
During the week, the President of the Republic of Kenya, His Excellency Uhuru Kenyatta, launched Phase 2 of the Standard Gauge Railway (SGR) project, bringing to operationalization the rail between Nairobi and Suswa. This is after a five-month delay, due to a delay in compensation of the affected persons. The 120.5 km (Phase 2A) project, which commenced in 2017, cuts across Nairobi, Kajiado, Nakuru and Narok with four passenger stations - Ongata Rongai, Ngong, Mai Mahiu and Suswa, and has seen the Madaraka Express passenger and freight services commence operation.
In addition, The President also launched the construction of the Jomo Kenyatta International Airport (JKIA) -Westlands Expressway, an 18.6-kilometer road project, which will start at JKIA and terminate at James Gichuru, along Waiyaki Way Road, in Westlands. The two-year project will be implemented through a Public-Private Partnership with China Roads and Bridges Corporation (CRBC), and motorists will have the option of using the expressway at a fee or toll charges to help the private firm building the road recover its investments.
Infrastructural development plays a key role in the development of the economy as a whole by enhancing connectivity and the creation of a better operating environment for individuals and businesses alike. Given the ease of movement as a result of operationalization of the railway line, we expect areas such as Ngong and Suswa to significantly gain popularity as Nairobi’s dormitories for the working population, thus resulting in increased demand for real estate properties and a subsequent increase in land and property value. For instance, according to Cytonn Research, Ongata Rongai recorded a 7-year CAGR of 36.1% with an acre of land currently valued at Kshs 18.3 mn per acre on average, and we expect this to grow significantly with the improved accessibility enhanced by the operationalization of the railway line. Likewise, we expect the Nairobi Expressway to enhance increased accessibility and reduce traffic congestion, resulting in increased demand for property in satellite towns such as Ruaka.
The table below shows the change in land prices in satellite towns:
(All Values in Kshs Unless Stated Otherwise)
|
Land Prices- Satellite Towns in Nairobi Metropolitan Area 2018/19 |
||||||
|
Location |
*Price in 2011 |
*Price in 2015 |
*Price in 2016/17 |
*Price in 2017/18 |
*Price 2018/19 |
7-year CAGR |
|
Ruiru |
7m |
15m |
19.3m |
19.7m |
21m |
18.2% |
|
Utawala |
6m |
9m |
10.9m |
11.0m |
12m |
10.5% |
|
Limuru |
5m |
13m |
16.6m |
19.5m |
20m |
20.8% |
|
Ruaka |
40m |
58m |
74m |
77m |
80m |
10.5% |
|
Athi River |
2m |
3m |
3.8m |
4.1m |
4.2m |
11.1% |
|
Ongata Rongai |
2m |
10m |
18.4m |
17.9m |
18m |
36.1% |
|
Juja |
3m |
7m |
8.8m |
9.6m |
9.7m |
17.1% |
|
Average |
9m |
17m |
22m |
23m |
24m |
17.8% |
|
*Asking land price per acre
|
||||||
Source: Cytonn Research
In addition, improving infrastructure also boosts the real estate sector by reducing development costs. According to a Centre for Affordable Housing Finance in Africa report, infrastructural costs in Kenya account for approximately 25.6% of construction costs. By providing infrastructure, the government thus provides an impetus for real estate developers to develop, as the cost of construction reduces considerably. For more information on the effects of infrastructure on real estate, please see Nairobi Metropolitan Area Infrastructure Report 2018.
We expect the real estate sector to continue recording increased activities supported by the continued expansion of retailers, and the improving infrastructure which continues to open up areas for development.
This week, we revisit the interest rate cap topic following the recommendation by President Uhuru Kenyatta to repeal the Interest Rate Cap, in a memorandum to Parliament in which he declined to assent the Finance Bill, 2019 into law. This is the strongest directive thus far by the government on the repeal of the interest rate cap and could mark the abolishment of the current regulated loan-pricing framework.
We, therefore, revisit the issue of the interest rate cap, focusing on:
- Background of the Interest Rate Cap Legislation - What Led to Its Enactment?
- A Recap on Our Analysis on the Subject
- A Review of the Effects It Has Had So Far in Kenya
- Recent Developments
- Next Steps, Options for the Legislature on the Finance Bill, 2019, and
- Our Views, Expectations, and Conclusion
Section I: Introduction
- Background of the Interest Rate Cap Legislation - What Led to Its Enactment?
The enactment of the Banking (Amendment) Act 2015 in September 2016, that capped lending rates at 4.0% above the Central Bank Rate (CBR), and deposit rates at 70.0% of the CBR, came against a backdrop of low trust in the Kenyan banking sector due to various reasons:
- The total cost of credit was high at approximately 21.0% per annum, yet on the other hand, the interest earned on deposits placed in banks was low, at approximately 5.0% per annum,
- Calls for capping interest rates were based on the high profitability in the banking sector because of high spreads between lending rates and deposits rates, which in 2016 was at a high of 9.5%. As a result, in 2016, the Return on Equity of Kenyan banks stood at 24.5% above the 5-year SSA average of 15.4%. The Return on Assets, on the other hand, stood at 3.1% above the 5-year SSA average of 1.5%, and,
- The period was marred with several failures of banks such as Chase Bank Limited, Imperial Bank Limited and Dubai Bank, due to failures in corporate governance. The failure of these banks rendered depositors helpless and unable to access their deposits in these banks, leading to public sentiment that something had to be done to the banking sector.
Section II. A Recap on Our Analysis on the Subject
Our view has always been that the interest rate cap regime would have an adverse effect on the economy and by extension to Kenyans, and as popular as they are, they needed to be repealed. We have previously written about this in eight focus notes, namely:
- Interest Rate Cap is Kenya's Brexit- Popular But Unwise, dated 21st August 2016, highlighted our view that the interest rate cap would have a clear negative impact on the economy. We noted that free markets tend to be strongly correlated with stronger economic growth, emphasized by the lack of compelling evidence of an economy where interest rate capping was successful, as evidenced by the World Bank report on the capping of interest rates in 76 countries around the world. In Zambia, for example, interest rate caps were introduced in December 2012 and repealed 3-years later, in November 2015, after the impact was found to be detrimental to the economy. We called for the implementation of a strong consumer protection agency and framework, coupled with the promotion of initiatives for competing for alternative products and channels. Below is a schedule of examples in Africa and what became of the rate caps:
|
Status of Interest Rate Caps in Sub Saharan Africa |
||
|
Country |
Year Implemented |
Status |
|
1. West Africa Economic & Monetary Union (WEAMU) |
1997 |
Still in effect with maximum interest rates chargeable by banks & MFIs |
|
2. Ethiopia |
1998 |
Still in effect for minimum deposit rates |
|
3. South Africa |
2007 |
Still in effect for different loan sub-categories with their own interest rates |
|
4. Zambia |
2012 |
Abolished capping in 2015 |
|
5. Monetary Community of Central Africa (CEMAC) |
2012 |
Still in effect with maximum interest rates chargeable by MFIs |
|
6. Kenya |
2016 |
Still in effect with maximum interest rates chargeable by banks |
|
7. Nigeria |
2017 |
Maximum cap on bank mortgages removed in September 2019 |
- Our second topical, Impact of the Interest Rate Cap, dated 28th August 2016, four days after the interest rate cap bill was signed into law, highlighted the immediate effects of the interest rate cap, as banking stocks lost 15.6% in 2-days. Here, we re-iterated our stance on the negative effects of the interest rate cap, while identifying the winners and losers of the Banking (Amendment) Act, 2015. Indeed, we had predicted wrongly, that the President would never sign the rate cap Act into law, we were surprised that he did and we are glad that he is now reversing it.
- The State of Interest Rate Cap, dated 14th May 2017, 9-months after the interest rate cap was signed into law. We assessed the interest rate cap and its effects on private sector credit growth, the banking sector, and the economy in general, following concerns raised by the IMF. We noted that the law had the effect of (i) inhibiting access to credit by SMEs and other “small borrowers” whom banks cited as being “risky”, and were unable to be fitted within the 4.0% margin imposed by the Law, and (ii) contributed to subduing of private sector credit growth, which was recorded at 4.0% in March 2017. We suggested that policymakers review the legislation, highlighting that there existed, and continues to exist, opportunities for structured financial products and private equity players to come in and provide capital for SMEs and other businesses to grow, and consequently improve private sector credit growth.
- In the Update of Effect on Interest Rate Caps on Credit Growth and Cost of Credit, dated 23rd July 2017, approximately 1-year after the Banking (Amendment) Act 2015 was signed into law, we analyzed, on the back of the rate cap, the decline in private sector credit growth and lending by commercial banks, coupled with the elevated total cost of credit, which was higher than the legislated 14.0%, as banks loaded excessive additional charges, while noting that the large banks, which control a substantial amount of the banking sector loan portfolio, were the most expensive. We suggested (i) a repeal or modification of the interest rate cap, (ii) increased transparency on credit pricing, (iii) improved and more accommodating regulation, (iv) consumer education, (v) diversification of funding sources into alternatives, and (vi) enhanced consumer protection agencies. More still needs to be done in terms of addressing consumer protection and diversifying sources of funding.
- In our note titled The Total Cost of Credit Post Rate Cap, dated 14th January 2018, we analyzed the true cost of credit, the initiatives put in place to make credit cheaper and more accessible, the impact of the interest rate cap on private sector credit growth, and we gave our view on what more can be done to remedy the effects of the interest rate cap, which included to implement strong consumer protection agencies and frameworks, and to diversify funding sources to include alternative products and channels.
- In Rate Cap Review Should Focus More on Stimulating Capital Markets, dated 13th May 2018, we revisited the interest rate cap following an announcement by the Treasury that they were in the process of completing a draft proposal that will address credit management in the economy, where we gave our views on how promoting competing sources of financing would lead to a self-pricing regulatory structure, which would effectively reduce credit prices, as opposed to relying on bank funding.
- In our note on the Status of the Rate Cap Review in Finance Bill 2018, 26th August 2018, we revisited the interest rate cap topic following the proposed amendments to the Finance Bill, 2018, tabled by the Parliamentary Committee on Finance and Planning in the National Assembly during its second reading. In this focus, we highlighted that legislation and policies to promote competing sources of financing should be the centerpiece of the repeal legislation.
In our focus note Review of the Interest Rate Cap, dated 23rd June 2019, we revisited the interest rate cap topic following the proposal by the National Treasury Cabinet Secretary, Mr. Henry Rotich, in the Budget reading for the 2019/20 fiscal year, to repeal Section 33B of the Banking Act, which was included in the Finance Bill, 2019. In this focus, we discussed policy measures that can protect borrowers from excessive interest rates, including consumer education and protection measures, as well as promoting capital markets infrastructure to spur competition in the credit market through non-bank funding.
Section III: A Review of the Effects It Has Had So Far in Kenya
The interest rate cap has had the following five key effects to Kenya’s Economy since its enactment, most of them clearly negative, save for spurring alternative financial services channels, which we believe will have long-term positive effects:
- Private Sector Credit Crunch
Private sector credit growth in Kenya has been declining, and the enactment of the Banking (Amendment) Act 2015, had the adverse effect of further subduing credit growth. In the first year following the introduction of the interest rate capping, the stock of credit to MSMEs declined sharply by 10% y/y on account of difficulty for banks to price the SMEs within the set margins, as they were perceived “risky borrowers”. Banks thus invested in asset classes with higher returns on a risk-adjusted basis, such as government securities. Lending to the public sector increased sharply with a growth of over 25% y/y over the same period. Private sector credit growth touched a high of 25.8% in June 2014, and averaged 11.0% over the last five-years, but dropped to below 5.0% after the implementation of interest rates controls, rising slightly to 6.3% in August 2019. The chart below highlights the trend in private sector credit growth.
- Loan Accessibility Reduced
Following the enactment of the Banking (Amendment) Act, 2015, banks recorded a rise in demand for loans, as did the number of loan applications, which increased by 20.0% in Q4’2016, according to the CBK Credit Officer Survey of October-December 2016. This was on account of borrowers attempting to access cheaper credit. However, the supply of loans by banks did not meet this rise in demand as evidenced by:
- Reduced Loan Growth: According to the Bank Supervision Annual Report 2017, the Net Loan growth declined since the implementation of the interest rate cap law, having come from a growth of 11.2% in 2015 to a decline of 7.7% as at December 2017.
- The Decline in the Number of Loan Accounts: The number of loan accounts in large banks (Tier I) declined by 27.8%, the largest among the three tiers, followed by Tier II banks with a decline of 11.1% between October 2016 and June 2017,
- Increase in Average Loan Size: Despite a 26.1% decline in the industry’s number of loan accounts between October 2016 and June 2017, the average loan size increased by 36.0% to Kshs 548,000, from Kshs 402,000 between October 2016 and June 2017. This points to lower credit access by smaller borrowers, while also demonstrating that credit was extended to larger and more “secure” borrowers, and,
- Decrease in Average Loan Tenures: The average loan tenure declined by 50.0% to 18-24 months compared to 36-48 months prior to the introduction of the interest rate cap. This is due to bank’s increasing their sensitivity to risk, thereby opting to extend only short-term and secured lending facilities to borrowers, rather than longer-term loans to be used for investments, according to the latest survey by the Kenya Bankers Association (KBA) on the effects of the Banking (Amendment) Act, 2015.
- Banks’ Changed their Operating Models to Mitigate the Effects of the Rate Cap Legislation
The enactment of the Banking (Amendment) Act, 2015, saw banks changing their business and operating models to compensate for reduced interest income (their major source of income) as a result of the capped interest rates. Thus, banks adapted to this tough operating environment by adopting new operating models through:
- Increased Focus on Non-Funded Income (NFI): This is evidenced by the fact that the proportion of non-interest income to total income stood at 28.4% in September 2016, and has risen to the current average of 37.2%, for listed commercial banks in H1’2019,
- Increased Lending to the Government Rather than Individuals and the Private Sector: This is evidenced by the growth in allocations to government securities by 15.1% in the year after implementing the interest rate cap, compared to the 7.7% decline in loans, as government securities rose to 24.9% of total banking sector assets in FY’2017, from 23.4% prior to the caps. This trend has persisted, with allocation to government securities rising by 12.1% as at H1’2019, faster than the 9.8% growth in loan allocations, given the higher risk-adjusted returns offered by government debt.
- Cost Rationalization: Banks also stepped up their cost rationalization efforts by increasing the use of alternative channels by mainly leveraging on technology such as mobile money and digital banking to improve efficiency and consequently reduce costs associated with the traditional brick and mortar approach. This led to the closure of branches and staff layoffs in a bid to retain the profit margins in the tough operating environment, due to depressed interest income, and,
- Focus on Niche Segments: The implementation of the law saw the larger banks venture into the small banks’ niche markets such as Small and Medium Enterprises (SMEs) banking, and consequently, most of the Tier II and Tier III banks have struggled to operate. The smaller banks have witnessed declining top-line revenue, leading to increased operational inefficiency, and operating losses; this has led to depleted capital, spurring an increase in the consolidation activity in the banking sector, which has seen smaller banks struggling to operate being acquired, merging or forming strategic relationships with larger banks in order to leverage on the synergies created.
- The Proliferation of Alternative Credit Markets
As a result of the private sector credit crunch, there was a rapid rise in the alternative credit markets as evidenced by the Mobile Financial Services (MFS) rising to become the preferred method to access financial services in 2019, with 79.4% of the adult population using the channels, up from 71.4% in 2016. According to Global Digital, in 2018 there were about 6.1 mn digital borrowers in the country coupled with 28.3 mn unique mobile users. Players in this segment charge exorbitant interest rates, e.g. M-Shwari charges a facilitation fee of 7.5% on amounts borrowed, and an interest rate of 90% when annualized, while Tala and Branch offer varying rates depending on the repayment period with a month’s loans offered at a rate of 15.0%, and the annualized rates vary between 132% and 152%. While the immediate effects of these alternative channels have been predatory, we believe that the investments and progress made in developing the alternative channels will have positive long-term impact as an alternative financial services channel once the sector becomes regulated.
- Reduced Effectiveness of the Monetary Policy
The introduction of interest rate controls has made it difficult for the CBK to adjust the monetary policy rates in response to economic developments. Before the interest rates were capped, the CBK was able to adjust the Central Bank Rate (CBR) in relation to changes in inflation and growth. This is mainly because any alteration to the CBR would directly affect credit conditions. Expansionary monetary policy is difficult to implement since lowering the CBR has the effect of lowering the lending rates and as a consequence, banks find it even more difficult to price for risk at the lower interest rates, leading to pricing out of even more risky borrowers, and hence further reducing access to credit. On the other hand, if the CBK was to employ a contractionary monetary policy, so as to reduce inflation and credit growth for example, then raising the CBR would have the reverse effect of increasing the supply of credit in the economy since banks would be able to admit riskier borrowers.
Section IV: Recent Developments
- President declines to assent to the Finance Bill, 2019
The Finance Bill, 2019 was passed by the National Assembly on 26th September 2019, retaining the interest rate caps, and was presented to the President for assent, upon which it was to become law. The President has however declined to assent the Bill into Law, and instead sent the Bill back to Parliament with a recommendation to repeal the interest rate cap, citing the following reasons:
- Reduction of Credit to the Private Sector, Particularly the Micro, Small and Medium Enterprises (MSMEs). In the first year following the introduction of the interest rate cap, the stock of credit to MSMEs declined sharply by 10% y/y on account of difficulty for banks to price the SMEs within the set margins, as they were perceived “risky borrowers”. Most commercial banks adjusted their lending towards large corporates and the public sector.
- A Decline in Economic Growth. The crowding out of the private sector, especially the MSMEs is estimated to have lowered Kenya’s economic growth by 0.4% points in 2017, and 0.2% points in 2018, as Kenya’s GDP growth came in at 4.9% and 6.3% in 2017 and 2018, respectively.
- Weakening Effectiveness of Monetary Policy Transmission. A recent analysis by the CBK on the impact of interest rate capping showed a slowdown in the monetary policy transmission to growth and inflation. Monetary policy transmission takes 3-12 months to impact growth and 12-20 months to affect inflation, which is 3-5 months longer compared to the period before the introduction of interest rate capping. In addition, the analysis showed evidence of perverse outcomes following a monetary policy action, particularly a reduction in loan advances by some banks after a lowering of the Central Bank Rate (CBR), which is contrary to the expected outcome of an increase in credit extension after the adoption of expansionary monetary policy.
- Reduction in Loan Accessibility. Loan accessibility reduced following the introduction of the interest rate cap. According to the CBK’s Annual Banking Sector Supervision Report for 2017, loans and advances stood at Kshs 2.0 tn in FY’2017, a 7.7% decline from the Kshs 2.2 tn in loans at end of 2016. In addition, banks moved to increase the average loan size and decrease the average loan tenure, thus further lowering credit access to small borrowers. Furthermore, banks decreased the diversity of their loan products and withdrew lending to specific segments of the market.
- The Emergence of Shylocks and Other Unregulated Lenders. There was a rapid rise in the alternative credit markets as evidenced by the Mobile Financial Services (MFS) rising to become the preferred method to access financial services in 2019, with 79.4% of the adult population using the channels up from 71.4% in 2016. These unregulated lenders have taken advantage of the situation under the capped interest rates to lend to borrowers at exorbitant interest rates e.g. M-Shwari charges a facilitation fee of 7.5%, while Tala and Branch offer varying rates depending on the repayment period with a month’s loans offered at a rate of 15.0%, which are very expensive when annualized.
The President noted that the capping of interest rates had not met its intended objective particularly in expanding credit access. In the memorandum to Parliament, the President also noted that the negative effects from the capping of interest rates had curtailed the government’s efforts at addressing the concerns of affordability and availability of credit from banks especially to the vulnerable sectors including MSMEs, Women and Youth. The specific measures that the government and commercial banks have initiated aimed at supporting greater access to credit at affordable terms by the vulnerable sectors include:
- Targeted programs to the vulnerable sectors in the economy, particularly the Women and Youth Funds. This is in collaboration with various development partners,
- A review of banks’ business models to become more customer-centric, adhering to the Banking Sector Charter issued by the CBK in February 2019, which is anchored on the pillars of customer-centricity, risk-based pricing, transparency and ethics, and,
- Introduction of new innovative products targeting MSMEs that leverage on innovative technology, e.g. the Stawi product by four commercial banks, namely NCBA Group, KCB Group, Diamond Trust Bank, and Co-operative Bank of Kenya.
- Calls by Various Organizations to Repeal the Interest Rate Cap Law
- IMF
The International Monetary Fund backed the National Treasury and CBK’s call for the repeal of the interest rates cap law. The IMF working paper, Do Interest Rate Controls Work? Evidence from Kenya, termed the interest rate controls Kenya introduced in September 2016 as the most drastic measures ever imposed. According to the paper, the reduction of the interest rate spreads, which initially was intended to increase access to bank credit and boost the return on savings, seems to have the opposite effect, evidenced by:
- A sharp decline in bank credit to SMEs, particularly in trade and agriculture,
- A disproportional hit on lending activity and the profitability of small banks, and,
- Reduced financial intermediation, with commercial bank credit shifting away from the private sector and towards the public sector.
The paper also points out the reduced signaling effect of the policy rate as an indicator of the monetary policy stance due to the increased divergence of interbank rates from policy rates following the implementation of the interest rates cap. The paper proposed that consideration should be given to using other policy instruments, instead of interest rate controls, to increase financial access and address equity concerns related to the high profits of the banking sector.
- Kenya National Chamber of Commerce and Industry
The Kenya National Chamber of Commerce and Industry (KNCCI) has backed the proposal to repeal the commercial lending rate caps law with the view that that the removal of the cap will provide an added incentive to banks to loosen risk considerations before extending credit to SMEs, thus improving credit access by small businesses.
Section V: Next Steps, Options for the Legislature on the Finance Bill, 2019
President Uhuru Kenyatta declined to assent the Finance Bill, 2019 into Law, and recommended a repeal of Section 33 B, which pertains to the interest rate cap. Given that the President has referred the Finance Bill, 2019 back for reconsideration by Parliament, the next possible steps are referenced in Article 115 of the Constitution on Procedures for Enacting Legislation, Presidential Assent and Referral, as outlined below:
- Amend the Finance Bill, 2019 to Repeal Section 33 B.
If Parliament amends the Finance Bill, 2019 fully accommodating the President’s recommendation, Clause 45 of Section 33 B shall be repealed and deleted. This will do away with the interest rate capping, and the Speaker shall re-submit it to the President for assent.
- Pass the Bill a Second Time Without Amendment.
Parliament, after considering the President’s reservations, may pass the Finance Bill, 2019 a second time without amendments, or with amendments that do not fully incorporate the President’s changes. This has to be supported by two-thirds of members of the National Assembly, amounting to support from 233 Members of Parliament (MPs), out of the 349 MPs. As a result, if 233 MPs do not support the motion, the interest rate caps shall be repealed.
If Parliament passes the Finance Bill, 2019 without amendment, the Speaker shall within 7 days re-submit it to the President, who shall within 7 days assent to the Bill. In case of expiry of this period, the Bill shall be taken to have been assented.
Given the Finance Bill, 2019 is a critical legislation to be passed to ensure government revenues through the incorporation of additional tax measures, we do expect Parliament to move with haste to debate and vote on the recommendations.
Section VI: Our Views, Expectations, and Conclusion
The decision on whether to repeal the interest rate cap is now again in the hands of the lawmakers. Historically, the President’s reservations on Bills have been passed with minimal to no alteration. For instance, when the Finance Bill, 2018, was referred back to Parliament with the President recommending the introduction of a VAT charge on fuel, the general preference by MPs was to delay the tax to September 2020. MPs eventually passed the Bill with an amended lower rate of 8% as opposed to the intended 16%, and the Bill became law. However, given the high public interest around the interest rate capping and the vocal proponents supporting the interest rate cap, we expect heated discussions. MPs during the initial discussions and reading of the Finance Bill, 2019 expressed strong opinions towards why the cap should remain in place, among them being:
- Banks continue to record high profits, which is evidenced by the 9.0% increase in core earnings per share growth in H1’2019 for the listed banking sector, and,
- The high borrowing appetite by the government needs to reduce as it is crowding out funds to the private sector. In context, the government recently raised the debt ceiling to Kshs 9 tn, from a debt to GDP ratio target of 50.0%, indicating the growing appetite of the government for taking on additional debt. For more information on Kenya’s debt sustainability, please see our Debt Sustainability Note.
We do expect the executive to wield some political capital in order to convince MPs that repealing the interest rate cap is better overall for the economy. If the proposal to repeal the rate cap law is successful, we expect to see the following benefits accrue to the economy:
- Growth in Private Sector Credit: As of August 2019, the private sector credit growth rate stood at 6.3% according to the MPC market perception survey. With the repeal of the rate cap law, we expect that access to credit by Micro, Small and Medium Enterprises (MSMEs) will increase as banks will have sufficient margin to compensate for risks,
- Higher GDP Growth: Credit and economic growth are positively correlated and we expect that with increased access to credit by MSMEs, the economy is bound to expand as MSMEs make a significant contribution to the economy. According to data from the KNBS, Micro, Small and Medium Enterprises (MSMEs) 2016 survey, MSMEs account for approximately 28.4% of Kenya’s GDP, and,
- Increased Monetary Policy Effectiveness: With the repeal of the rate cap law, the Central Bank of Kenya will be free to adjust the monetary policy rate in response to economic developments such as inflation and growth.
In conclusion, the rate cap legislation should be repealed because a free market, where interest rates are set by the forces of demand and supply coupled with increased competition from non-bank financial institutions for funding, will see a competitive environment where the cost of credit reduces, as well as increase access to credit by borrowers that have been shunned under the current regulated loan-pricing framework.
However, after the repeal, we still recommend that we deal with two key outstanding issues of (i) Consumer Protection Against Abuse by Banks, and (ii) Promoting Competing Alternative Funding Channels.
Disclaimer: The views expressed in this publication are those of the writers where particulars are not warranted. This publication is meant for general information only and is not a warranty, representation, advice or solicitation of any nature. Readers are advised in all circumstances to seek the advice of a registered investment advisor.

- Talk to us
- Kenya
- P.O Box 20695 - 00200, Nairobi, Kenya
- Cell +254709101200
- Tel +254709101200
- WhatsApp +254741676635
- United States
- +254709101200
- DOWNLOAD OUR APP
-


- Kenya
- 8th Floor, Pinetree Plaza, Kaburu Drive, Ngong Road, Nairobi, Kenya
- USA
- Suite 1150, 1775 Eye Street NW, USA, Washington DC 20006, USA
- Investments
- High Yield
- Private Equity
- Real Estate
- Real Estate
- RiverRun Estates
- Cytonn Towers
- The Ridge
- Taraji Heights
- The Alma