Eurobonds in Sub-Saharan Africa, & Cytonn Weekly #25/2018
By Cytonn Research, Jun 24, 2018
Executive Summary
Fixed Income
T-bills were oversubscribed during the week, with the subscription rate coming in at 214.7% down from 259.5%, the previous week. Yields on the 91 and 182- day papers declined by 10 bps to 7.7% and 9.7% from 7.8% and 9.8% in the previous week, respectively, while yields on the 364-day paper declined by 20 bps to 10.5%, from 10.7% the previous week. We are projecting the inflation rate for the month of June to range between 6.1% - 6.4%, up from 4.0% in May, partly due to the base effect and a rise in the transport index driven by a rise in petrol and diesel prices by 1.6% and 5.0% to Kshs 108.1 and Kshs 103.6 per litre, respectively, during the month;
Equities
During the week, the equities market was on a downward trend, with NASI, NSE 20 and NSE 25 declining 3.1%, 1.5% and 3.1%, respectively. For the last twelve months (LTM), NASI and NSE 25 have gained 11.9% and 9.2%, respectively, while NSE 20 has declined by 8.7%; StanChart has unveiled a new channel for distributing wealth management products in Kenya
Private Equity
In the Financial Services sector, Old Mutual is set to increase its stake in UAP Holdings in a deal to convert a Kshs 2.7 bn loan into equity through its subsidiary Old Mutual Holdings Kenya. The conversion is set to see Old Mutual increase its current stake of 60.7% in UAP Holdings, by 7.3%. The conversion will however dilute existing shareholders and Old Mutual is set to have a combined stake of 63.5% after the dilution;
Real Estate
During the week, the Cabinet Secretary for National Treasury and Planning, Mr Henry Rotich announced a proposed amendment to the revised Employment Act (2012) that will see employees contribute to the National Housing Development Fund 0.5% of their monthly gross remuneration up to a maximum of Kshs 5,000 and employers will match that up, and in the hospitality sector, Nairobi Institute of Business Studies, NIBS, announced plans to open a 72-bed capacity 5 star hotel in Kileleshwa along Kandara Road named The Emory Hotel,
Focus of the Week
This week, we focus on the Eurobonds issued by Sub-Saharan Africa (SSA) countries, with most economies opting for Eurobonds as a preferred form of raising external debt, as opposed to pursuing commercial and syndicated debt from international financial institutions. The first quarter of 2018 was characterized by increased Eurobond issuance, with a total of USD 10.7 bn being raised in Africa in the period, compared to a pro-rated USD 4.5 bn raised in Q1’2017. We therefore touch on SSA as an attractive investment destination, while also raising awareness towards growing concerns over the rising debt burden in the region, with the World Bank Pulse report revealing that public debt levels in SSA averaged 56.0% of GDP in 2016 up from 37.0% in 2013;
- Caleb Mugendi, Senior Investments Analyst was on KBC to discuss the 2018 post national budget analysis. Watch him here
- Samuel Ng’ang’a, Finance Manager was on Citizen TV to discuss tax measures introduced in the budget by Treasury CS Henry Rotich. Watch him here
- Caleb Mugendi, Senior Investments Analyst, was on CNBC to discuss Treasury's projections to reduce deficit to 5.7 percent from 7.2 percent. Watch him here
- We continue to hold weekly workshops and site visits on how to build wealth through real estate investments. The weekly workshops and site visits target both investors looking to invest in real estate directly and those interested in high yield investment products to familiarize themselves with how we support our high yields. Watch progress videos and pictures of The Alma, Amara Ridge, The Ridge, and Taraji Heights. Key to note is that our cost of capital is priced off the loan markets, where all-in pricing ranges from 16.0% to 20.0%, and our yield on real estate developments ranges from 23.0% to 25.0%, hence our top-line gross spread is about 6.0%. If interested in attending the site visits, kindly register here
- We continue to see very strong interest in our weekly Private Wealth Management Training (largely covering financial planning and structured products). The training is at no cost and is open only to pre-screened participants. We also continue to see institutions and investment groups interested in the trainings for their teams. The Wealth Management Trainings are run by the Cytonn Foundation under its financial literacy pillar. If interested in our Private Wealth Management Training for your employees or investment group please get in touch with us through wmt@cytonn.com. To view the Wealth Management Training topics, click here
- For recent news about the company, see our news section here
- We have 10 investment-ready projects, offering attractive development and buyer targeted returns of around 23.0% to 25.0% p.a. See further details here: Summary of Investment-Ready Projects
- We continue to beef up the team with ongoing hires for: Chief Executive Officer Cytonn Education Services (CES), Full Stack Software Engineer, Unit Manager-Nairobi. Visit the Careers section on our website to apply
T-Bills & T-Bonds Primary Auction:
T-bills were oversubscribed during the week, with the subscription rate coming in at 214.7% down from 259.5%, the previous week. The subscription rates for the 91, 182 and 364-day papers came in at 136.6%, 171.5%, and 289.2% compared to 137.9%, 221.6%, and 345.9%, respectively, the previous week. Yields on the 91 and 182- day papers declined by 10 bps to 7.7% and 9.7% from 7.8% and 9.8% in the previous week, respectively while yields on the 364-day paper declined by 20 bps to 10.5%, from 10.7% the previous week. The acceptance rate for T-bills increased to 98.8% from 29.5%, the previous week, with the government accepting a total of Kshs 50.9 bn of the Kshs 51.5 bn worth of bids received, against the Kshs 24.0 bn on offer. The acceptance rate this week increased to 98.8%, which may be as a result of the government taking advantage of the declined yields despite being 33.7% ahead of its pro-rated domestic borrowing target for the current fiscal year, having borrowed Kshs 390.2 bn, against a target of Kshs 291.9 bn (assuming a pro-rated borrowing target throughout the financial year of Kshs 297.6 bn).
The Kenyan Government issued a new 15-year Treasury bond (FXD 1/2018/25) for the month of June with the coupon set at 13.4%, in a bid to raise Kshs 40.0 bn for budgetary support. The overall subscription rate for the issue came in at 25.3%, with the market weighted average bid rate coming in at 13.7%, 20 bps above the average accepted rate of 13.5%, and in line with our expectations of 13.4% - 13.7%. The government accepted Kshs 5.9 bn out of the Kshs 10.1 bn worth of bids received, translating to an acceptance rate of 51.1%. The government is set to embark on a new borrowing cycle soon with the domestic target set at Kshs 271.9 bn (equivalent to 2.8% of GDP). The draft Financial Markets Conduct Bill prepared by the National Treasury did not point to a repeal or revision of the cap. This, in our view, will mean continued borrowing appetite by the government into the next fiscal year, and the retained ability to keep rates at low levels by rejecting bids deemed expensive in primary auctions with the interest rate cap still in place. The National Treasury however has proposed a repeal of the interest rate cap, which if repealed can result in upward pressure on interest rates; banks would resume pricing of loans to the private sector based on their risk profiles, direct more funding into loans versus government paper, and consequently reducing the amount of liquidity available for government paper hence putting upward pressure on rates.
Liquidity:
The average interbank rate increased to 4.1% from 3.6%, the previous week, while the average volumes traded in the interbank market declined by 2.4% to Kshs 14.1 bn from Kshs 14.4 bn, the previous week. The decline in the average interbank rate points to declined liquidity, which the Central Bank attributed to banks seeking funds to remit Value Added Taxes during the week.
Kenya Eurobonds:
According to Bloomberg, the yield on the 5-year Eurobond issued in 2014 remained unchanged at 5.3%, while the 10-year Eurobond increased by 10 bps to 6.9% from 6.8%, the previous week. Since the mid-January 2016 peak, yields on the Kenya Eurobonds have declined by 3.5% points and 2.8% points for the 5-year and 10-year Eurobonds, respectively, an indication of relatively stable macroeconomic conditions in the country.
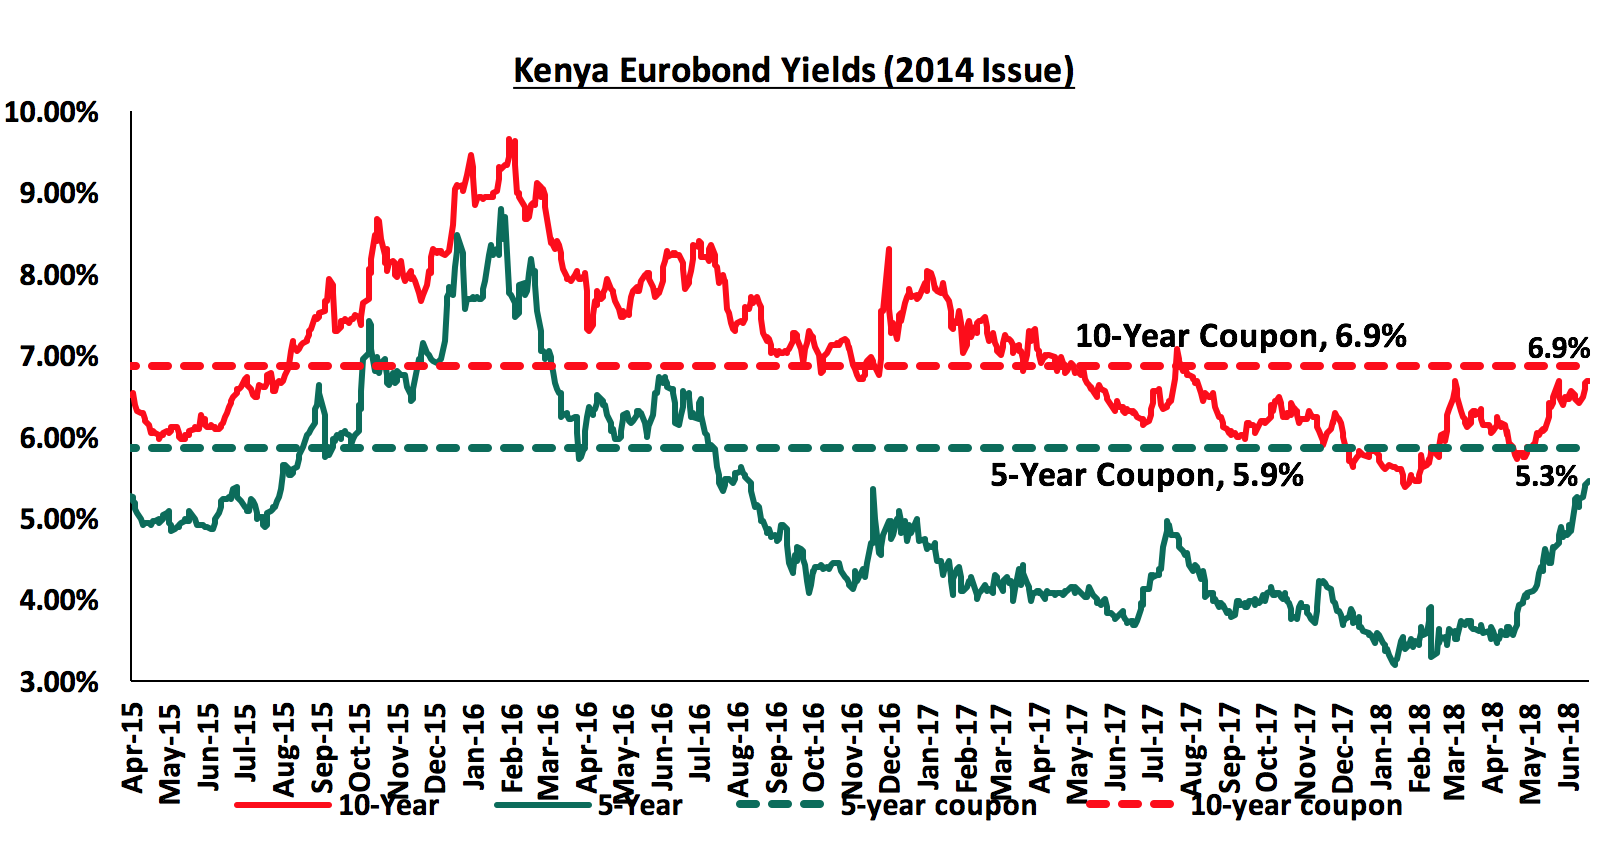
For the February 2018 Eurobond issue, during the week, the yields on the 10-year Eurobond increased by 20 bps to 7.6% from 7.4% the previous week while the 30-year Eurobonds increased by 30 bps to 8.7% from 8.4% the previous week. Since the issue date, yields on the 10-year and 30-year Eurobonds have increased by 0.4% and 0.5% points, respectively.
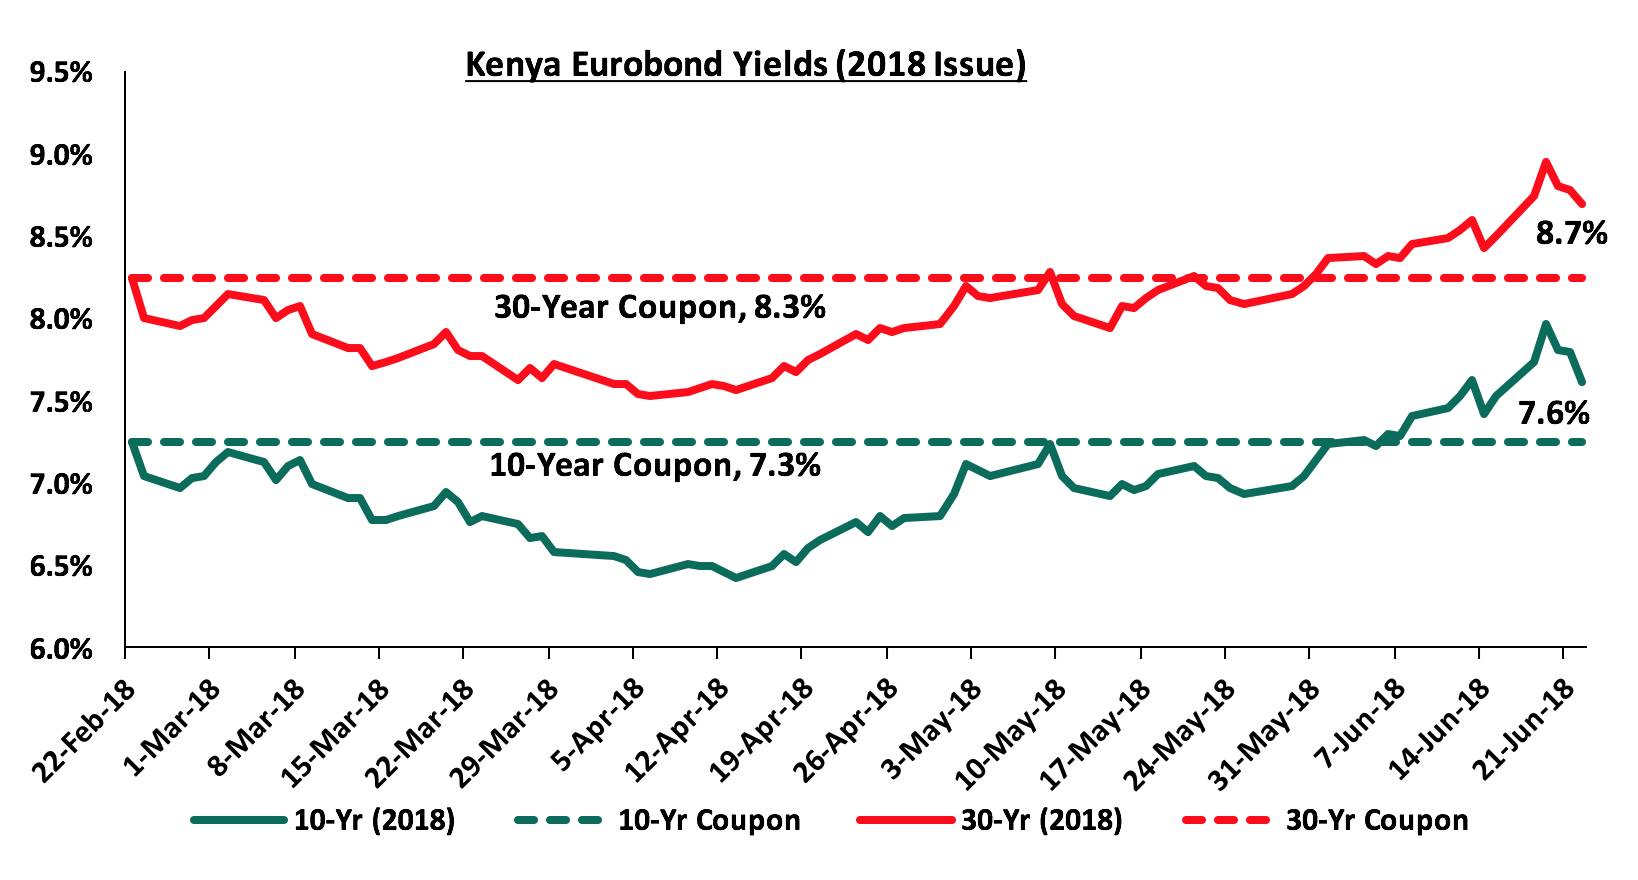
We have noted the recent rise in Kenya Eurobond yields and this may be attributed to high risk pricing by investors due to the fast pace of public debt accumulation coupled with current corruption scandals erupting in the country that seem to have led to worsening investor sentiment across the market.
The Kenya Shilling:
During the week, the Kenya Shilling appreciated by 0.3% to close at Kshs 100.8 from Kshs 101.1, the previous week, attributed to tightened liquidity in the money markets that led to increased demand for the local currency. On a YTD basis, the Shilling has gained 2.3% against the USD. In our view, the shilling should remain relatively stable against the dollar in the short term, supported by:
- The narrowing of the current account deficit which stood at 6.1% of GDP as at March 2018 from 6.4% in December 2017,
- Stronger inflows from principal exports which include coffee, tea and horticulture which increased by 9.3% during the month of April to Kshs 21.9 bn from Kshs 20.0 bn in a similar period the previous year, with the exports from coffee, and horticulture increasing by 6.7%, and 25.0% y/y respectively, while tea exports have declined marginally by 1.6% y/y,
- Improving diaspora remittances, which increased by 56.6% to USD 217.1 mn in April 2018 from USD 138.6 mn in April 2017 with the bulk contribution coming from North America at USD 114.0 attributed to (a) recovery of the global economy, (b) increased uptake of financial products by the diaspora due to financial services firms, particularly banks, targeting the diaspora, and (c) new partnerships between international money remittance providers and local commercial banks making the process more convenient, and,
- High forex reserves, currently at USD 9.0 bn (equivalent to 5.9 months of import cover) and the USD 1.5 bn stand-by credit and precautionary facility by the IMF, still available until September 2018.
We are projecting the inflation rate for the month of June to range between 6.1% - 6.4%, up from 4.0% in May. The y/y inflation rate is expected to rise partly due to the base effect, owing to the drop in CPI experienced in June 2017, and a rise in the transport index driven by a rise in petrol and diesel prices by 1.6% and 5.0% to Kshs 108.1 and Kshs 103.6 per litre, respectively, during the month. The housing, water, electricity, gas & fuel index is also expected to rise due to a rise in the price of cooking fuels, with prices of kerosene rising by 7.5% to Kshs 84.1, and the price of charcoal rising as well due to the extension of the anti-logging ban. Food inflation is expected to rise but at a slower pace than last month attributed to the end of heavy flooding experienced last month, which had made roads impassable making accessibility to markets by farmers and traders difficult. As we approach the second half of the year, we expect inflation to start rising gradually, mainly due to:
- Amendments to tax laws that will see fuel and select food item prices increase, despite optimism expressed by the Ministry of Agriculture regarding an increase in maize production driven by the healthy rains we have experienced this far, and,
- A lower base effect, given declining inflation in the second half of 2017.
Going forward, we expect inflation to average 7.0% over the course of the year down from 8.0% in 2017, which is within the government target range of 2.5% - 7.5%.
Weekly Highlights:
According to the Moody’s investors service, the Government of Kenya is unlikely to achieve the fiscal target of 5.7% of GDP down from 7.2% as outlined in the budget read the previous week due to their expectations that revenue collections will only improve modestly as compared to the National treasury projection of a 17.5% rise in revenues to Kshs 1.9 tn, (equivalent to 20.0% of GDP) in the FY 2018/19 from the estimated Kshs 1.7tn target in the FY 2017/18. The agency projects that the fiscal deficit for the 2018/2019 financial year will come in at around 7.0% citing that the implementation of some of the measures aimed at improving tax collections from tax administration reforms and revised tax rates as well as regulating spending will not enable the government achieve the desired fiscal consolidation. Earlier during the year, the Agency downgraded the issuer rating of the Government of Kenya to B2 from B1 and assigned it a stable outlook amidst criticism from the National Treasury, citing erosion in the country’s fiscal metrics caused by the country’s rising debts. Key to note, the agency expects that government debt will stabilise at just below 60.0% of GDP, which is estimated to have hit 55.6% of GDP as at the end of 2017 and projected to soar to above 60.0% after the 2018 Eurobond issues.
The Institute of Chartered Accountants in England and Wales (ICAEW) during the week released a report dubbed, Macro dynamics and debt in Africa in 2018’Q2. According to the report, the East African region is expected to experience the fastest growth in Africa with the GDP forecasted to come in at 6.1% mainly boosted by Ethiopia whose GDP is forecasted to grow at 8.1% driven by the continued public investments. Key to note, the ICAEW noted that the levels of over-indebtedness in Africa has largely been overblown and the continued growth recovery in the region that commenced in 2017 is set to support a decline in the real debt burden over the medium term as well as improvement in debt sustainability over time. As per the report, Kenya’s GDP growth is projected to rise to 5.6% up from 4.9% in 2017 driven by the agricultural, services and industrial sectors due to improved weather conditions, improvement in business sentiment as evidenced by the improved PMI readings as well as stronger public investments. Debt sustainability remains a key concern due to the pace of public debt accumulation and lack of a clear strategy of how the government is set to address the deficits with total debt amounting to around Kshs 4.6 tn by the end of last year nearly 60.0% of GDP. The report however noted the commitment by Kenyan authorities to policies aimed at enabling the country achieve its fiscal objectives in line with recommendations by the IMF following the extension of the precautionary credit facility to September 2018 when the reviews are expected to be completed.
Below is a table showing that the Kenyan economy is expected to grow at an average of 5.5% in 2018 according to updated projections by the organizations that we track as at Q2’2018, updated with our own projection. We shall continue to update this table as these organizations release their updated 2018 projections:
|
Kenya 2018 Annual GDP Growth Outlook |
|||
|
No. |
Organization |
Q1'2018 |
Q2'2018 |
|
1 |
Central Bank of Kenya |
6.2% |
|
|
2 |
Kenya National Treasury |
5.8% |
|
|
3 |
Oxford Economics |
5.7% |
|
|
4 |
African Development Bank (AfDB) |
5.6% |
|
|
5 |
Stanbic Bank |
5.6% |
5.6% |
|
6 |
Citibank |
5.6% |
|
|
7 |
International Monetary Fund (IMF) |
5.5% |
5.5% |
|
8 |
World Bank |
5.5% |
5.5% |
|
9 |
Fitch Ratings |
5.5% |
|
|
10 |
Barclays Africa Group Limited |
5.5% |
|
|
11 |
Cytonn Investments Management Plc |
5.4% |
5.5% |
|
12 |
Focus Economics |
5.3% |
|
|
13 |
BMI Research |
5.3% |
5.2% |
|
14 |
The Institute of Chartered Accountants in England and Wales |
5.6% |
|
|
15 |
Standard Chartered |
4.6% |
|
|
|
Average |
5.5% |
5.5% |
Rates in the fixed income market have remained stable, and even begun on a declining trend as the government rejects expensive bids with the government being under no pressure to borrow for the remaining part of the current fiscal year as: (i) they are currently ahead of their domestic borrowing target by 32.9%, (ii) they have met 79.1% of their total foreign borrowing target and 33.7% of their pro-rated target for the current fiscal year, and (iii) the KRA is not significantly behind target in revenue collection. Come the next fiscal year, the government is likely to remain behind target for the better part of the first half as per historical data. As per the newly released 2018/19 budget, the domestic borrowing target is at Kshs 271.9 bn, 8.6% lower than the current fiscal year’s target, which may result in reduced pressure on domestic borrowing. The National Treasury has also proposed to repeal the interest rate cap, which if repealed can result in upward pressure on interest rates, as banks would resume pricing of loans to the private sector based on their risk profiles. However, with the cap still in place and the proposal subject to National Assembly passing, we maintain our expectation of stability in the interest rate environment. With the expectation of a relatively stable interest rate environment, our view is that investors should be biased towards medium to long-term fixed income instruments
Market Performance:
During the week, the equities market was on a downward trend, with NASI, NSE 20 and NSE 25 declining 3.1%, 1.5% and 3.1%, respectively. This takes the YTD performance of the NASI, NSE 20 and NSE 25 to 0.9%, (11.1%) and 4.2%, respectively. This week’s performance was driven by declines in large-cap stocks such as Safaricom, BAT, KCB Group, EABL and Equity, which declined by 4.2%, 3.0%, 1.5%, 1.4% and 1.0%, respectively. For the last twelve months (LTM), NASI and NSE 25 have gained 11.9% and 9.2%, respectively, while NSE 20 has declined by 8.7%.
Equities turnover increased by 9.4% this week to USD 35.3 mn from USD 32.3 mn the previous week, with foreign investors making up the bulk of market activity during the week. We expect the market to remain resilient this year supported by positive investor sentiment, as investors take advantage of the attractive stock valuations in select counters.
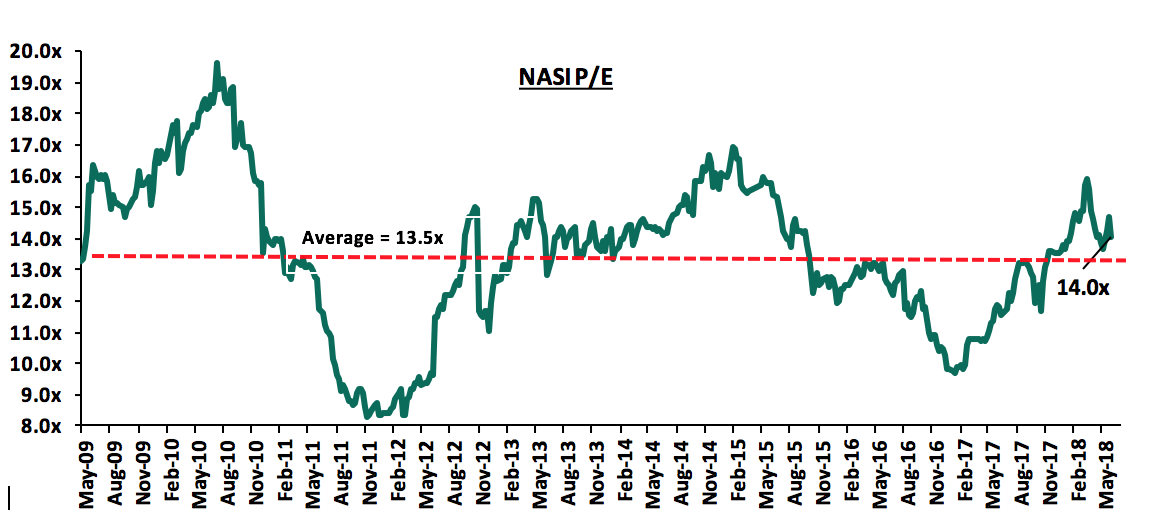
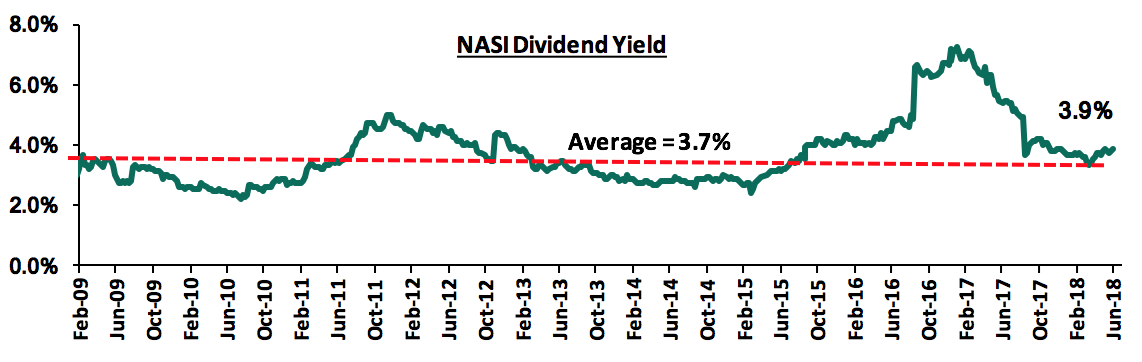
The market is currently trading at a price to earnings ratio (P/E) of 14.0x, which is above the historical average of 13.5x, and a dividend yield of 3.9%, which exceeds the historical average of 3.7%. The current P/E valuation of 14.0x is 42.9% above the most recent trough valuation of 9.8x experienced in the first week of February 2017, and 68.7% above the previous trough valuation of 8.3x experienced in December 2011. The charts below indicate the historical P/E and dividend yields of the market.
Weekly Highlights:
Standard Chartered Bank has opened a new channel for distributing wealth management products in Kenya. The services will enable the bank’s customers to contact investment advisors through video conferencing. The wealth management distribution initiative is targeted for the bank’s high net-worth clientele and will offer services such as bancassurance, investment lending and forex transactions. The platform is enabled by Stanchart’s video banking capabilities, which allow customers to connect to the bank through a secure video connection, audio channel or chat portal. The bank aims to invest more in the use of digital channels to drive uptake of wealth products by clients, as it is keen to grow its asset and private wealth management business by tapping the emerging affluent population estimated to be under 40 years of age, highly educated and digitally savvy. The investment offers potential for the bank to increase its non-interest revenue going forward from the current 32.0% of total operating income, lower than the sector average of 33.6%. The bank’s NFI increased by 6.5% to Kshs 2.3 bn in Q1’2018 from Kshs 2.1 bn in Q1’2017, indicating the viability of the bank’s digitization strategies after it introduced video banking locally in May 2017.
Metropol Corporation has developed a digital platform that will enable borrowers with a favourable credit history to obtain credit scores and use them as leverage in negotiating better loan terms with banks, in the event that the legislation placing a cap on interest rates is repealed. The platform will encourage banks to scout for customers with minimal probability of default, who will benefit from the credit information-sharing mechanism that has been in place since February 2014. Metropol, the largest of the three credit reference bureaus in the country, has segmented the credit market based on geographical clusters to create ‘credit communities’, meaning traders in a particular locality can, for instance, transact with one another and with local banks using information from the credit community. According to Metropol’s Managing Director, Sam Omukoko, the credit communities have been created in Mombasa, Kisumu, Nakuru, Eldoret, Kakamega, Machakos, Meru and Nyeri, with comprehensive information on both borrowers and lenders. Loan repayment data and customer profiles can be shared among the lenders, making it easier to identify and deal with loan defaulters in a particular credit community. In the past one and half years that the rate-capping law has been in force, SMEs and individuals have mainly relied on costly mobile-based lenders and shylocks, causing a slowdown of credit growth to the private sector to 2.8% in April 2018 from 21.2% in July 2015. Treasury cabinet secretary Henry Rotich proposed to repeal the rates capping law in the budget statement to the National Assembly last week. The Treasury is relying on the controversial Financial Markets Conduct Bill 2018, which proposes to keep credit costs in check, in order to convince legislators to repeal the law.
Equities Universe of Coverage:
Below is our Equities Universe of Coverage:
|
Banks |
Country Currency |
Price as at 14/06/2018 |
Price as at 22/06/2019 |
w/w change |
YTD Change |
LTM Change |
Target Price* |
Dividend Yield |
Upside/ Downside** |
P/TBv Multiple |
||
|
Ghana Commercial Bank |
Ghanaian Cedi |
5.2 |
5.2 |
(0.4%) |
2.0% |
(1.0%) |
7.7 |
7.4% |
56.7% |
1.3x |
||
|
NIC Bank*** |
Kenya Shilling |
35.3 |
36.5 |
3.5% |
8.1% |
17.2% |
54.1 |
2.8% |
56.3% |
0.8x |
||
|
Diamond Trust Bank |
Kenya Shilling |
195.0 |
196.0 |
0.5% |
2.1% |
27.3% |
280.1 |
1.3% |
45.0% |
1.1x |
||
|
I&M Holdings |
Kenya Shilling |
120.0 |
116.0 |
(3.3%) |
(8.7%) |
14.9% |
169.5 |
2.9% |
44.2% |
1.2x |
||
|
Zenith Bank |
Nigerian Naira |
26.4 |
25.9 |
(1.9%) |
1.0% |
26.8% |
33.3 |
10.2% |
36.4% |
1.1x |
||
|
Union Bank Plc |
Nigerian Naira |
6.2 |
5.9 |
(4.8%) |
(24.4%) |
18.0% |
8.2 |
0.0% |
31.5% |
0.6x |
||
|
CRDB |
Tanzania Shilling |
160.0 |
160.0 |
0.0% |
0.0% |
(8.6%) |
207.7 |
0.0% |
29.8% |
0.5x |
||
|
KCB Group |
Kenya Shilling |
48.5 |
47.8 |
(1.5%) |
11.7% |
27.3% |
60.9 |
4.1% |
29.7% |
1.5x |
||
|
Barclays |
Kenya Shilling |
11.9 |
11.9 |
0.4% |
24.0% |
19.0% |
14.0 |
8.4% |
26.6% |
1.5x |
||
|
HF Group*** |
Kenya Shilling |
8.5 |
8.5 |
(0.6%) |
(18.8%) |
(7.0%) |
10.2 |
3.8% |
23.8% |
0.3x |
||
|
Co-operative Bank |
Kenya Shilling |
17.0 |
17.5 |
2.9% |
9.4% |
23.5% |
19.7 |
4.7% |
20.6% |
1.5x |
||
|
Stanbic Bank Uganda |
Uganda Shilling |
31.5 |
32.0 |
1.6% |
17.4% |
18.5% |
36.3 |
3.7% |
18.9% |
2.0x |
||
|
Equity Group |
Kenya Shilling |
49.0 |
48.5 |
(1.0%) |
22.0% |
29.3% |
55.5 |
4.1% |
17.3% |
2.5x |
||
|
CAL Bank |
Ghanaian Cedi |
1.3 |
1.2 |
(2.4%) |
13.0% |
68.0% |
1.4 |
0.0% |
12.0% |
1.0x |
||
|
UBA Bank |
Nigerian Naira |
11.0 |
10.6 |
(3.6%) |
2.9% |
15.2% |
10.7 |
13.6% |
10.9% |
0.7x |
||
|
Bank of Kigali |
Rwandan Franc |
290.0 |
290.0 |
0.0% |
(3.3%) |
18.4% |
299.9 |
4.8% |
8.2% |
1.6x |
||
|
Ecobank |
Ghanaian Cedi |
10.2 |
8.5 |
(16.7%) |
11.8% |
33.6% |
10.7 |
0.0% |
5.2% |
2.9x |
||
|
Stanbic Holdings |
Kenya Shilling |
91.5 |
92.0 |
0.5% |
13.6% |
27.8% |
85.9 |
5.7% |
(0.4%) |
1.1x |
||
|
Standard Chartered |
Kenya Shilling |
200.0 |
201.0 |
0.5% |
(3.4%) |
(3.8%) |
184.3 |
6.3% |
(1.6%) |
1.6x |
||
|
Guaranty Trust Bank |
Nigerian Naira |
41.5 |
40.7 |
(1.9%) |
(0.1%) |
18.5% |
37.2 |
5.8% |
(4.5%) |
2.3x |
||
|
Access Bank |
Nigerian Naira |
10.6 |
10.4 |
(1.9%) |
(0.5%) |
12.8% |
9.5 |
3.8% |
(6.6%) |
0.7x |
||
|
SBM Holdings |
Mauritian Rupee |
7.4 |
7.2 |
(3.0%) |
(4.3%) |
0.6% |
6.6 |
4.1% |
(7.3%) |
1.1x |
||
|
Bank of Baroda |
Uganda Shilling |
160.0 |
155.0 |
(3.1%) |
37.2% |
40.9% |
130.6 |
1.6% |
(16.8%) |
1.4x |
||
|
Stanbic IBTC Holdings |
Nigerian Naira |
49.0 |
48.8 |
(0.5%) |
17.5% |
59.3% |
37.0 |
1.2% |
(23.3%) |
2.5x |
||
|
Standard Chartered |
Ghanaian Cedi |
27.0 |
27.0 |
0.0% |
6.9% |
60.9% |
19.5 |
0.0% |
(27.9%) |
3.4x |
||
|
FBN Holdings |
Nigerian Naira |
10.9 |
10.7 |
(1.8%) |
21.0% |
75.2% |
6.6 |
2.3% |
(36.6%) |
0.6x |
||
|
Ecobank Transnational |
Nigerian Naira |
20.0 |
20.2 |
1.0% |
18.8% |
51.9% |
9.3 |
0.0% |
(53.6%) |
0.7x |
||
|
National Bank |
Kenya Shilling |
6.9 |
6.6 |
(4.3%) |
(29.4%) |
(38.9%) |
2.8 |
0.0% |
(59.4%) |
0.4x |
||
|
|
*Target Price as per Cytonn Analyst estimates |
|
||||||||||
|
|
**Upside / (Downside) is adjusted for Dividend Yield |
|
||||||||||
|
|
***Banks in which Cytonn and/or its affiliates holds a stake. For full disclosure, Cytonn and/or its affiliates holds a significant stake in NIC Bank, ranking as the 5th largest shareholder |
|
||||||||||
We are “NEUTRAL” on equities for investors with a short-term investment horizon since the market has rallied and brought the market P/E slightly above its’ historical average. However, pockets of value exist, with a number of undervalued sectors like Financial Services, which provide an attractive entry point for long-term investors, and with expectations of higher corporate earnings this year, we are “POSITIVE” for investors with a long-term investment horizon.
Old Mutual, a UK based international financial services group providing investment and savings, insurance, asset management and retirement solutions, is set to increase its stake in UAP Holdings in a deal to covert a Kshs 2.7 bn loan into equity through its subsidiary Old Mutual Holdings Kenya. Old Mutual first invested in UAP in January 2015 when the company first bought a combined 23.3% stake from investment firm Centum and businessman Chris Kirubi, and later in the same month announced that it had entered into an agreement with AfricInvest, Abraaj and Swedfund to buy their combined stake of 37.3%. This transaction made Old Mutual the largest shareholder of UAP Holdings with a 60.7% stake in the company at a cost of Kshs 20.8 bn. The transaction was carried out at a P/B multiple of 3.6x. However, in 2017 Old Mutual wrote off Kshs 9.7 bn as goodwill impairment. Following the adjustment of the goodwill impairment, the post write-off acquisition transaction value dropped to Kshs 11.1 bn representing a P/B transaction multiple of 1.9x. UAP did not disclose the conversion price for the proposed debt-to-equity transaction. At the current market price of Kshs 160 for the UAP Holding shares that are traded over the counter, the debt-to-equity transaction will see Old Mutual increasing its current stake by 7.3%. The conversion will however dilute existing shareholders and Old Mutual will have a combined stake of 63.5% after the dilution. The transaction will imply a P/B multiple of 1.8x which is a 15% discount from the average insurance sector transaction P/B multiple of 2.1x over the last seven years, hence a relatively cheaper transaction valuation. The table below highlights the transaction multiples in Kenya’s insurance sector over the last seven years;
|
Insurance Sector Transaction Multiples over the Last Seven Years |
|||||||
|
No. |
Acquirer |
Insurance Acquired |
Book Value (bn Kshs) |
Transaction Stake |
Transaction Value (bn Kshs) |
P/B |
Date |
|
1. |
Africa Development Corporation |
Resolution Health East Africa |
N/A |
25.1% |
0.2 |
N/A |
Dec-10 |
|
2. |
Leapfrog Investments |
Apollo Investments |
0.3 |
26.9% |
1.1 |
15.6x |
Dec-11 |
|
3. |
Saham Finances |
Mercantile Insurance |
0.5 |
66.0% |
Undisclosed |
N/A |
Jan-13 |
|
4. |
Swedfund |
AAR |
0.4 |
20.0% |
0.4 |
5.4x |
May-13 |
|
5. |
BAAM |
Continental Re Kenya |
0.7 |
30.0% |
0.3 |
1.4x |
Apr-14 |
|
6. |
Union Insurance of Mauritius |
Phoenix of East Africa |
1.8 |
66.0% |
2.0 |
1.6x |
May-14 |
|
7. |
UK Prudential |
Shield Assurance |
0.1 |
100.0% |
1.5 |
10.2x |
Sep-14 |
|
8. |
Swiss Re |
Apollo Investments |
0.6 |
26.9% |
Undisclosed |
N/A |
Oct-14 |
|
9. |
Britam |
Real Insurance Company |
0.7 |
99.0% |
1.4 |
2.1x |
Nov-14 |
|
10. |
Leap Frog Investments |
Resolution Insurance |
0.2 |
61.2% |
1.6 |
11.7x |
Nov-14 |
|
11. |
Old Mutual Plc |
UAP Holdings |
9.6 |
60.7% |
20.8 |
3.6x** |
Jan-15 |
|
12. |
Old Mutual Plc |
UAP Holdings |
9.6 |
60.7% |
11.1 |
1.9x* |
Jan-15 |
|
13. |
MMI Holdings |
Cannon Assurance |
1.7 |
75.0% |
2.4 |
1.9x |
Jan-15 |
|
14. |
Pan Africa Insurance Holdings |
Gateway Insurance Company Ltd |
1.0 |
51.0% |
0.6 |
1.1x |
Mar-15 |
|
15. |
Barclays Africa |
First Assurance |
2.0 |
63.3% |
2.9 |
2.2x |
Jun-15 |
|
16. |
IFC |
Britam |
22.5 |
10.4% |
3.6 |
1.5x |
Mar-17 |
|
17. |
AfricInvest III |
Britam |
28.5 |
14.3% |
5.7 |
1.4x |
Sep-17 |
|
18. |
Swiss Re Asset Management |
Britam |
22.6 |
13.8% |
4.8 |
1.3x |
Jun-18 |
|
19 |
Old Mutual Plc |
UAP Holdings |
19.0 |
7.30% |
2.7 |
1.8x** |
Jun-18 |
|
|
Harmonic Mean |
|
|
29.9% |
|
2.1x |
|
|
|
Median |
|
|
55.9% |
|
1.9x |
|
|
*-Proforma transaction multiple after goodwill impairment write-off **-Excluded in the harmonic mean and median |
|||||||
The proposed transaction is part of UAP’s efforts to ease its heavy debt burden that has seen it explore multiple options, including renegotiating loan terms with financiers such as the International Finance Corporation (IFC). In the company’s 2017 annual report the company indicated that it is set to covert its short term borrowings, the first being the above debt from Old Mutual Holdings Kenya of Kshs 2.7 bn, and the second a Nedbank loan of USD 31.0 mn subject to the approval of the board.
Private equity investments in Africa remains robust as evidenced by the increasing investor interest, which is attributed to; (i) rapid urbanization, a resilient and adapting middle class and increased consumerism, (ii) the attractive valuations in Sub Saharan Africa’s private markets compared to its public markets, (iii) the attractive valuations in Sub Saharan Africa’s markets compared to global markets, and (iv) better economic projections in Sub Sahara Africa compared to global markets. We remain bullish on PE as an asset class in Sub-Sahara Africa. Going forward, the increasing investor interest and stable macro-economic environment will continue to boost deal flow into African markets.
Following the release of the 2018/19 budget, the Cabinet Secretary for National Treasury and Planning announced plans to amend the revised Employment Act of 2012 to allow for the creation of a National Housing Development Fund (NHDF). The fund will be tasked with offering alternative financing solutions for low cost housing, as well as the required social infrastructure to Kenyans contributing towards the fund. It is still not clear whether the fund will be under the National Housing Corporation (NHC) or the State Department of Housing. The fund will be structured similar to a pension scheme such that, employees will contribute a percentage of their income-0.5% of their gross earnings each month, to a maximum of Kshs 5,000, and employers will match the amounts contributed. The permanent secretary in the Ministry of Housing, Mr Charles Mwaura, informed a local daily that the fund will be structured and operated as follows:
- The funds contributed by both the employer and the employee will go to a common pool at the NHDF,
- There will be two categories of access and use for the funds, a) individuals in the affordable housing bracket will use the funds to purchase houses through tenant purchase schemes, while b) individuals with a stronger financial muscle, will use the funds as deposits for mortgages or other forms of securitization,
- In July 2018, the ministry will create a website where contributors, will enter personal and financial details including M Pesa transaction records, bank records and Kenya Revenue Authority Pin,
- The contributors will then be pre-qualified and given an automated score as to whether they fall under the low cost housing category, social housing category, or the financially stronger-mortgage category,
- The private sector will then start building houses in line with the PPP agreements signed, it is expected that 2000 houses will be delivered each year in each county,
- The registered contributors, will then book the houses, and as the 1.0% contributed is not sufficient to cater for the cost of the houses, they will start paying for the houses off plan,
- Each year, the state will then run a lottery to allocate the houses available among the contributors paying for the houses. This is to allow for equal distribution and prevent the contributors with a stronger financial muscle from acquiring all the houses available and subsequently renting them out.
While the initiative is a step in the right direction, it will not be sufficient to provide the off take needed to boost demand, and hence the supply of affordable housing. This, as according to the Kenya National Bureau of Statistics (KNBS) Economic Survey 2018, the average wage earnings per person in Kenya is Kshs 57,008. 1.0% of this is Kshs 570, and over a period of one year this amounts to Kshs 6,840, taking the lowest valued house under the government’s affordable housing scheme of Kshs 800,000, assuming a deposit of 10.0%, which is Kshs 80,000. The average wage earner in Kenya with an income of Kshs 57,008 and an annual contribution of Kshs 6,870, will require approximately 12 years to raise the deposit alone. In addition, with a working population of 17.8 mn in Kenya, as per KNBS Economic Survey 2018; using the average income of Kshs 57,008 and a 1.0% contribution to the fund, the government will collect Kshs 122.8 bn in one year, and Kshs 525.7 bn by 2022. The average cost of the social and affordable houses is Kshs 1.8 mn and thus the funds raised, that is Kshs 525.7 bn, can only fully provide off take for 289,566 houses, which is 29.0% of the targeted 1.0 mn homes to be delivered. Therefore, the fund as is structured, will not be sufficient to provide off take financing for buyers.
In addition to the insufficiency of the funds to be raised, the fund is likely to face other challenges including opposition due to possibility of primary contributors not benefiting as it is structured in a lottery form, and from employers and employees, given that both parties are already being subjected to a number of statutory deductions such as NHIF and NSSF for employees and private pension plans - defined contribution schemes for both employers and employees. The fund is the latest initiative by the government aimed at achieving the governments Big Four Agenda of affordable housing. The others being:
- The 15.0% corporate tax relief to developers who put up at least 100 low-cost residential houses annually,
- Digitization of the lands ministry,
- Scrapping off, of the NEMA and NCA levies,
- Partnerships with developers through availing of public land for development,
- Land swaps that entail the exchange of public and private land between the government and developers, enabling the developers to access development class land that would have been tied down,
- Public Private Partnerships (PPPs) agreements between the government and the private sector, to facilitate development,
- The announcement of plans to create the Kenyan Mortgage Refinancing Company (KMRC) an initiative by the World Bank and the Kenyan Government, which is aimed at enhancing mortgage affordability and facilitate long term loans at attractive rates.
The table below highlights the main initiatives being adopted by the Kenyan government and their status;
|
Some of the Initiatives Being Adopted by the Kenyan Government to Meet its Target of Delivering 1 mn Affordable Housing in the Next 5 years |
|||
|
Initiative |
Person to be affected |
Year of announcement |
Status |
|
15.0% corporate tax relief to developers who put up at least 100 low-cost residential houses annually |
Developers |
2016 |
Adopted |
|
Digitization of the Lands Ministry |
Land Owners/Buyers |
2016 |
In Progress |
|
Scrapping off, of the NEMA and NCA levies |
Developers |
2016 |
Adopted |
|
Partnerships with developers through availing of public land for development |
Developers |
2017 |
In Progress |
|
Land Swaps and Land Banking |
Developers |
2017 |
In Progress |
|
Review of the PPP framework to enable fast-tracking of approval processes and accommodate new approaches such as Joint Ventures and Land Swaps |
Developers |
2018 |
In Progress |
|
Kenyan Mortgage Refinancing Company (KMRC) |
Developers/Buyers |
2018 |
In Progress |
|
Setting up of the National Housing Development Fund |
Buyers |
2018 |
In Progress |
|
The government has embarked on a number of initiatives aimed at increasing the supply of affordable housing units in the country. While the initiatives are a step in the right direction, a lot more needs to be done with regards to policy, integration and diversification of the sources of funds to facilitate the delivery of 1 mn affordable housing units in the next four years. |
|||
As covered in our Cytonn Weekly #16/2018, these initiatives are likely to have moderate levels of success and the government needs to do a lot more to achieve its target of developing 1 million social and affordable housing over the next 4 years including;
- Having a better integrated framework encompassing the government, The Capital Market Authority, The NSSF, The Retirements Benefits Authority, Kenya Revenue Authority and private sector finance and development,
- Increasing the sources of funding through deepening the capital markets and increasing access to non-bank funding,
- Increasing government support through various initiatives such as favorable legislation, guaranteeing off take, strict housing policy and more efficient urban planning,
- Developing a coherent end to end plan and communication around the initiative. Specifically,
- We need to see how the various pricing of affordable housing has been arrived at, for example, to deliver a house at Kshs 800,000, what is the assumption around inputs and subsidies?,
- What is the assumed paying capacity of the users of affordable housing and does this dovetail into the pricing of the units? There has to be a meeting point between the price of the house and the earnings power of the users,
- As per the Big Four Agenda Blue Print, the Kenyan Government intends to offer affordable housing at prices of between Kshs 0.8 mn and Kshs 3.0 mn per unit, at lower interest rates of up to 5.0% and longer mortgage tenors of up to 30 years. It is not clear which entity would provide the mortgage at interest rates of 5.0% per annum,
- Regarding the Public Private Partnerships (PPPs) there is still uncertainty on revenue-sharing and the returns to private investors, as well as policies that will curtail corruption and bureaucracy associated with government projects.
In the hospitality sector, Nairobi Institute of Business Studies (NIBs) announced that it will open a 5-star Hotel-Emory Hotel in Kileleshwa, along Kandara Road, Nairobi. The hotel will have 72 beds and conferencing facilities. The chain joins other brands that have opened shop in Nairobi this year such as the 171-key Hilton Garden Inn, a 4-star hotel along Mombasa Road, 170 key City Lodge, a 3-star hotel in Two Rivers, along Limuru Road, and the 223-key Movenpick, a 5-star hotel by Movenpick Hotels and Resorts in Westlands, Nairobi. According to Knight Frank Hotels Report 2018, Kenya was ranked as one of the hotel development hotspots in East Africa alongside Ethiopia and Tanzania, with the development activities being driven primarily by the expansion plans of the larger multinational hotel groups into the continent. The increased activities in the sector are driven by its high returns evidenced by the increased average ADR, which, according to Cytonn Hospitality Report 2016 came in at USD 154 between 2011 and 2015, 21.2% higher than the Sub Saharan Africa average of USD 127 over the same period. Other factors driving the sector include: (i) the stabilizing political situation, (ii) sustained international business and travel tourism, (iii) growth of Meetings, Incentives, Conferences and Events (MICE) tourism, where the number of conferences held in the country increased by 1.3% in 2017 from 3,982 in 2016, to 4,035 in 2017 despite the protracted electioneering period, iv) An increase in international arrivals, whereby the number of international arrivals into the country increased by 8.1% to 1.5 mn in 2017 from 1.3mn in 2016, v) government incentives to boost the sector such as removal of Value Added Tax (VAT) charges on National Park fees, capping of Kenya Wildlife Services (KWS) Park fees at USD 60 down from USD 90 and scrapping of visa fees for children under the age of 16-years, and (vi) continued marketing to reach new markets such as Asia and America, all factors that have led to an increase in demand for hospitality services. Key to note is that majority (63.8%) of the top rated (3,4 and 5 star) hotel rooms that that have come to the market over the last 2 years are internationally branded, and are thus, not only well known, but also offer high quality services and amenities. Local chains such as Emory Hotel, will therefore have to adhere to international best practices in both service delivery and amenity provision to be competitive in the market. We expect the sector to continue recording increased activities given the positive statistics where according to Cytonn Annual Market Outlook 2018, in Nairobi alone, we expect the ADR to increase by 11.0% y/y to average at USD 139.3, the RevPAR is expected to increase by 19.3% y/y to average at USD 73.0, and the average room occupancy is expected to increase by 3.4% points to average at 52.4%, thus increased returns on investment in the sector.
In the industrial sector, the Chief Executive Officer of Tilisi, a 400-acre master planned development comprising residential, education, logistics, medical, hospitality, recreational, commercial and retail centre in Limuru, Mr Kavit Shah, announced plans to reduce its minimum land quantum offered for sale in the industrial precinct by 80.0% to 1 acre from 5 acres. The move aims at increasing uptake for its 90-acre parcel of land reserved for industrial parks, which has recorded an uptake of 41.7%, the highest among all the uses available in the master plan. This is an indicator of the high demand for serviced industrial plots, especially in Satellite Towns where, for land under industrial use, land prices are on average 78.6% cheaper than land under industrial use in Nairobi’s suburbs. There is also plenty of supply of development class land in Satellite Towns. In Ruiru, in Tatu City, the industrial precinct has recorded uptake levels of 65.6%, higher than the 58.8% recorded in the residential precinct, and the industrial zone, initially 495 acres, has since been increased by 87.8% to 892 acres. Industrial parks and warehouses are an attractive investment opportunity with average rental yields of 6.0% and an average occupancy rate of 85.0% in 2017. We expect to witness an increase in demand, and hence development of warehouses and industrial parks as a result of i) increased focus on the manufacturing sector, with the sector being included among the big four pillars of focus by the government ii) increased investment by multinationals such as Volkswagen, Nissan and Isuzu who have set up plants in Kenya, and iii) improved infrastructural developments such as roads and railway system facilitating faster movement of goods. The opportunity in the sector is in industrial parks and serviced plots in satellite towns and grade A warehouses with high floor to ceiling ratio which are in short supply in the market attracting high rents of above Kshs 40.0 per SQFT, 22.9% higher than the market average of Kshs 35.0.
Infrastructure
In the infrastructure sector:
- A 162-commuter train has been launched between Kajiado Town and the Konza Technocity. The train is expected to boost transportation between the two towns. The train will operate 2 trips daily for 5 days a week and within a 42km radius. In our view, the improvement in infrastructure will anchor the 5,000-acre master planned development and encourage uptake due to ease of access,
- Kenya Railways has commenced construction of the disputed phase 2A of the Standard Gauge Railway (SGR) traversing through the Nairobi National Park. The 120 km railway line will connect Nairobi to Naivasha and will pass through towns such as Nairobi, Kajiado, Nakuru, Kiambu, Naivasha and Narok. This is expected to open up towns along the railways course and termini to real estate development.
The other Highlights in the real estate sector this week include:
- French based retailer Carrefour is in July, set to take the space previously occupied by Nakumatt at the Galleria Mall along Langata Road. This will be the retailers 6th store in the country after stores in malls such as Two Rivers Mall along Limuru Road, TRM along Thika Road, The Junction along Ngong Road, Sarit Centre in Westlands and the Hub in Karen. The retailer is also set to open its 7th store in the Village Market along Limuru Road in December 2018. The retailer ventured into Kenyan market in May 2016 and recorded revenues of up to Kshs 1.5 bn in the first seven-months of operations in its first outlet in The Hub Karen, hence supporting the aggressive expansion in the Kenyan market. The retailer’s stores are concentrated in, Westlands, Karen and Limuru Road, which are the 3 best performing retail nodes in Nairobi and recorded average rental yields of 13.5%, 11.2% and 10.6%, in 2017, respectively, against a market average of 9.6% and average occupancy rates of 91.0%, 96.3% and 78.2% for Westlands, Karen and Limuru Road, respectively against a market average of 80.3%. The attractive performance of these nodes is as a result of high quality retail space, mostly destination and community malls, and their locations in upper middle and high end markets and thus higher footfall, as there is less competition from small scale retailers, and higher basket size from the affluent population, enabling the developers to charge prime rents. International retailers continue to increase foothold in the country supported by: i) an enabling environment characterized by stable GDP growth rate of on average 5.0% for the last 5-years, ii) closure of retail store such as Nakumatt and Uchumi that created a market niche for other retail stores to expand, iii) positive demographics as seen through the high population growth rate of 2.6%, 1.4% points higher than global averages of 1.2% that has led to sustained demand, iv) high urbanization rates of 4.4%, higher than global rates of 2.1% that has resulted in the need for more retail stores, and v) rapid growth of infrastructure making more areas accessible to investors.
- The Nyandarua County Government has commenced its plan to upgrade major towns through a Kshs 14 mn project, though details about the towns is yet to be disclosed, the move will see an improvement in infrastructure and seeks to promote growth of business entities as well as the status of the towns.
Listed Real Estate
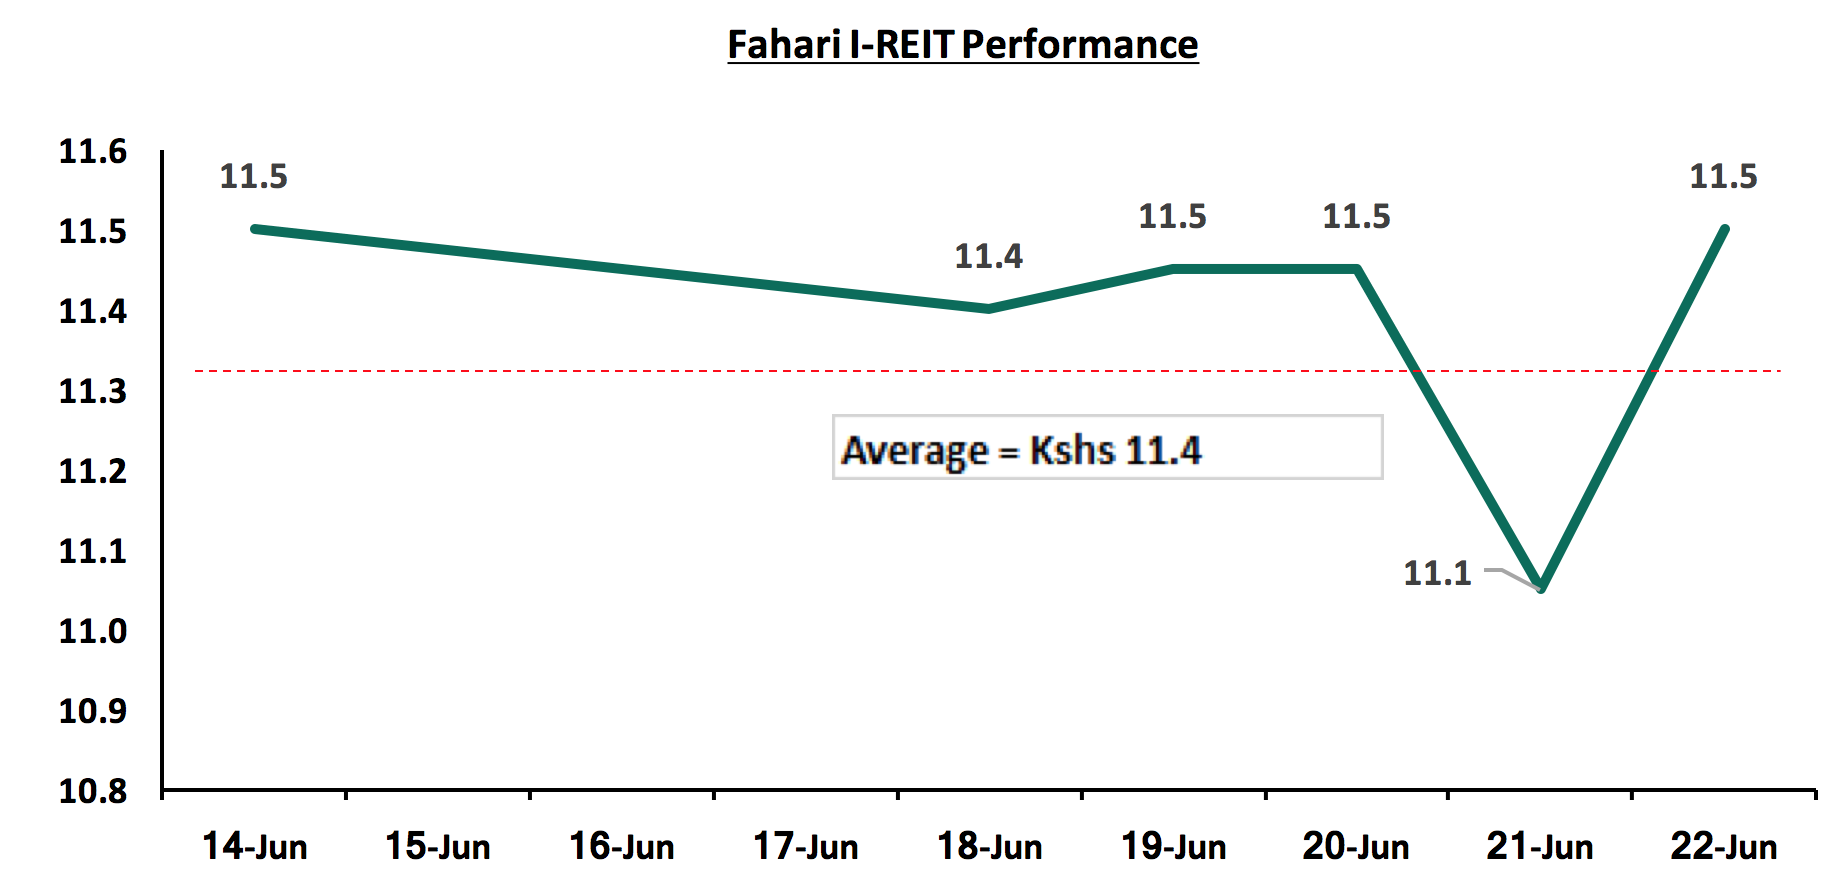
During the week, the share prices for the Fahari I- REIT remained relatively stable, with the instrument closing the week at Kshs 11.5, 0.9% lower than the average price of Kshs 11.6 the previous week. Year to date the instrument has gained 9.5% from the 10.5 Kshs at the start of the year. The instrument is however trading at a 42.5% discount from its listing price of Kshs 20 per share, the poor performance is attributable to inadequate investor knowledge and preference for better performing equities and government securities.
Our outlook for the real estate sector is positive given the initiatives being undertaken by the government to boost the sectors performance such as the plans to set up a National Housing Development Fund (NHDF) that seeks to raise funds to facilitate off take of the affordable housing units to be developed, and increased foreign investment in the retail sector with international retailers such as Carrefour expanding locally.
The first 5 months of 2018 have been characterized by 5 Eurobond issuances by Sub-Saharan Africa (SSA) economies (Kenya, Nigeria, Senegal, Ghana and South Africa), jointly raising USD 10.7 bn, with two more countries (Tanzania and Angola) having announced plans to raise foreign public debt through the same avenue this year. Last year, USD 18.0 bn was raised in foreign public debt by economies in Africa, and in the last 5 years, Kenya has had two separate issuances, in 2014 and 2018. Other SSA countries like Ghana and Nigeria have also had two issuances in the last 5 years, with countries like Tanzania looking to make their debut in this space this year.
With the seemingly rising preference for SSA economies to raise long-term foreign public debt through the issue of Eurobonds, this week, we cover SSA as an attractive investment destination and the SSA Eurobonds issued in the last 5 years. For the 2018 Eurobonds, we look at their performance, amounts collected, use of the proceeds and the issuer country’s public debt levels. We also highlight the expected SSA Eurobond issues for the remaining part of the year and the effects on development and debt sustainability for the SSA Region as a result.
Section I: Sub-Saharan African (SSA) as an attractive investment destination
Sub-Saharan African (SSA) has positioned itself as an attractive investment destination as seen by the improving macroeconomic conditions, according to the recently released Regional Economic Outlook report by the International Monetary Fund (IMF) dated April 2018, that stated:
- GDP growth in SSA is projected to come in at 3.4% in 2018, up from 2.8% in 2017, supported by (a) higher commodity prices, and (b) improved capital markets access,
- The average current account deficit in SSA is estimated to have narrowed to 2.6% of GDP in 2017 from 4.1% in 2016 driven by better terms of trade and improved policy frameworks during the period. The current account deficit is however, projected to widen slightly to 2.9% in 2018, and,
- Regional annual inflation in SSA fell to just over 10.0% in 2017 from 12.5% in 2016, and is expected to fall further in 2018, driven by declining food prices due to improved weather conditions.
With better macroeconomic conditions, improving political stability, and attractively priced fixed income instruments relative to developed countries - for instance, the 10-year US Treasury bond is currently yielding 2.9%, while the Kenya 2018 10-year Eurobond is currently trading at a yield of 7.0% - the attractive risk adjusted return on SSA fixed income instruments have made SSA securities to become quite popular among global fixed income fund managers.
Having said this, we now look at how SSA has leveraged on its attractiveness through the issuance of Eurobonds to raise foreign public debt.
Section II: Eurobonds as a source of foreign public debt for SSA economies
A Eurobond is a special type of bond that is issued in a currency other than the issuer-country’s home currency. Since it is issued in a foreign currency and its target investors are foreigners, it is considered one way that a country can raise foreign pubic debt.
The first 5 months of 2018 were characterized by Eurobond issuance by 5 Sub Saharan African countries (Kenya: USD 2.0 bn, Nigeria: USD 2.5 bn, Senegal: USD 2.2 bn, Ghana: USD 2.0 bn and South Africa: USD 2.0 bn) and 6 in Africa as a whole (Kenya: USD 2.0 bn, Nigeria: USD 2.5 bn, Senegal: USD 2.2 bn, Ghana: USD 2.0 bn, South Africa: USD 2.0 bn and Egypt: USD 4.0 bn), raising a total USD 14.7 bn, compared to USD 18.0 bn raised in the whole of 2017. From this, it seems that most African economies are opting for Eurobonds as a preferred form of raising external debt, as opposed to pursuing commercial and syndicated debt from international financial institutions, with Eurobonds share of total public debt rising to 19.0% in 2016 from 9.0% in 2007 according to the World Bank African Pulse April 2018 issue. Some of the reasons why this has become a popular source of borrowing of late are as follows:
- Eurobonds appear to be cheaper than commercial loans, with Kenya having borrowed an 8-year USD 750 mn commercial loan at a floating rate of 6.7% above the 6-month London Interbank Offer Rate (Libor) (at 0.6% at the time), hence 7.3% p.a. at the time in Dec 2017, while the longer dated 10-year Eurobond issued just 2 months later was issued at the same rate, and,
- Eurobonds have gained importance as the rates eventually offered are used as benchmarks for pricing of foreign denominated debt instruments by corporates in the issuer country.
SSA countries foreign borrowing appetite has been on the rise, as debt increasingly becomes a critical source of finance for development expenditure. Since the beginning of 2018, 6 countries in Africa have issued Eurobonds, namely: Senegal, Egypt, Nigeria, Ghana, South Africa and Kenya. Out of these, 5 are part of SSA, with the total value raised coming to USD 10.7 bn. Egypt raised USD 4.0 bn through the issue of 5, 10 and 30-year Eurobonds. Of concern however, is that most of the funds raised from the Eurobond issuances are to be used to redeem nearly maturing foreign-denominated debt that was not necessarily more expensive in all cases, and finance national budgets with no clear indication as to whether the funds are to be channelled towards recurrent or development expenditure in all cases, with the latter being the preferred scenario.
While Eurobonds may appear cheaper relative to commercial external debt and good for development expenditure, they still add to a country’s foreign debt burden, and foreign debt exposes economies to the following risks:
- Exchange rate risk: Eurobonds are issued in currencies other than the home currency of the issuer yet a large share of their revenues are in local currency, and hence carry exchange rate risk at the point of interest and principal payments. In the event of depreciation of the local currency with respect to the currency the debt is denominated in, the cost of repaying and servicing the bond would become higher,
- Credit risk: Debt sustainability has been a major concern of late, with concerns around whether some SSA governments will be able to pay the interest payments as well as the principal amounts as and when they fall due, as the public debt levels continue burgeoning over the years to average 56.0% of GDP in 2016 from 37.0% in 2013. Data from the World Bank indicates that SSA countries’ debt sustainability risk has increased significantly, with 18 countries at high risk of debt distress as at March 2018 as compared to 8 in 2013. Data from the recently released IMF regional economic outlook report for Sub-Saharan Africa also indicate that public debt continued to rise in 2017, with about 40.0% of low-income developing countries in the region being in debt distress or at a high risk of debt distress, with the median level of public debt exceeding 50.0% of GDP. Repayment concerns have also been driven by:
- The low levels of economic diversification in SSA, as most countries are commodity driven, which makes them volatile to global price changes and acts of God such as droughts. Notably, growth recovery projections in SSA countries has mainly been tied to increasing international prices of commodities such as oil, and improving weather conditions. Governments need to come up with diversification agendas to make the countries less vulnerable to global economy shocks,
- The fact that most of the proceeds from the issues are diverted to refinancing other debt facilities, as well as investments in non- income generating social infrastructure, and,
- Corruption, which continues to be a major issue as some of the funds raised don’t get to accomplish their intended purpose, with Africa having been ranked the worst in corruption with an average score of 32 out of 100 in the Transparency Corruption Perception Index 2017 report by Transparency International.
- Interest risk: with the recent hike in the Federal Funds rate to a band of 1.75% - 2.00% and the expectation of another 2 hikes in the course of the year, it is expected that yields of SSA Eurobonds will have to also increase to remain more attractive to investors. If this does not happen, it is likely that we will see capital outflows from the region as investors turn their attention to the US, which is considered a less risky investment destination as compared to SSA. This may be detrimental to the region as foreign direct investments have been a key driver of economic growth in the region.
- Susceptibility to shocks from external market conditions: with many countries becoming more reliant to external financing, they also become susceptible from all kinds of shocks coming from external market conditions which can include anything from freezing of markets, new legislations and sudden change of market sentiments.
In the last 5 years:
The last 5 years Eurobonds have become increasingly popular as a form of foreign public debt by SSA countries as evidenced by:
- The value of foreign debt raised by SSA countries through the issuance of Eurobonds has increased by 3.5x to USD 18.0 bn in 2017 from about USD 4.0 bn in 2013, with the increasing need for these economies to fund their development efforts. Seychelles was the first SSA country after South Africa to issue a Eurobond in 2006, after which countries like Ghana, Gabon, Senegal, Nigeria, Namibia, Côte d’Ivoire, Zambia, Rwanda, Kenya, Ethiopia, Angola and Cameroon have proceeded to raise debt through foreign capital markets in a similar manner,
- Amounts raised in single issues have gotten bolder over the years, increasing by 300.0% to USD 2.0 bn on average from USD 500.0 mn on average 10 years back, and,
- SSA countries have also returned to the foreign capital markets for more than one Eurobond issuances with countries having had 2 issuances on average in the last 5 years.
Recently:
Moving on to recent times, 2018 has been quite an eventful year so far in terms of Eurobonds in SSA. The following SSA economies have issued Eurobonds in the last 5 months, with the exception of South Africa (we shall not discuss South Africa in detail as it is not part of our macroeconomic universe of coverage)
- Kenya
In mid-February 2018, officials from the Treasury carried out a road show in the UK and USA to market the country’s second Eurobond issue. On 23rd February 2018, the Government of Kenya issued its second set of Eurobonds, a 10-year and 30-year Eurobond at coupons of 7.3% and 8.3%, both 30 bps below 7.6% and 8.6%, respectively, which had been advised by the banks working on the deal. The Eurobonds are listed on the London and Irish Stock Exchanges. The proceeds were to be disbursed towards development expenditure and debt liability management. The issue was 7.0x oversubscribed with bids received at USD 14.0 bn as compared to the USD 2.0 bn target, despite (i) Moody’s downgrade of the government’s issuer rating to “B2” from “B1” previously, which the government refuted, claiming that their research was not well informed, and (ii) the International Monetary Fund’s (IMF’s) decision to withdraw their stand-by credit facility effective March 2018 at the time, citing the government’s failure to lower its budget deficit to 3.7% of GDP by 2018/19. These two events took place just before the issue date. Key to note is that the IMF has since agreed to extend the facility by 6 months to allow for completion of reviews.
Kenya’s public debt to GDP is estimated to have hit 55.6% by the end of 2017, 5.6% above the East African Community (EAC) Monetary Union Protocol, the World Bank Country Policy and Institutional Assessment Index, and the IMF threshold of 50.0%. This is a rise from 43.9% 5-years ago, and 38.4% 10-years ago. It is estimated that Kenya will use approximately 40.3% of our revenue raised from tax collection to finance debt payments in the fiscal year 2017/18. After the 2018 Eurobond issue, the country’s public debt to GDP ratio could soar above 60.0%, according to Moody’s, unless proper policies are put in place to control this by the government. As detailed in our topical on Kenya’s Public Debt, Should We Be Concerned?, the government has already embarked on measures to improve debt management, also detailed in the 2018 Budget Policy Statement (BPS). Now with Kenya in the limelight with regards to public debt levels, we expect that implementation of these debt management strategies will be better than it has been in previous years.
The chart below shows Kenya’s debt-to-GDP ratio over the last 7 years: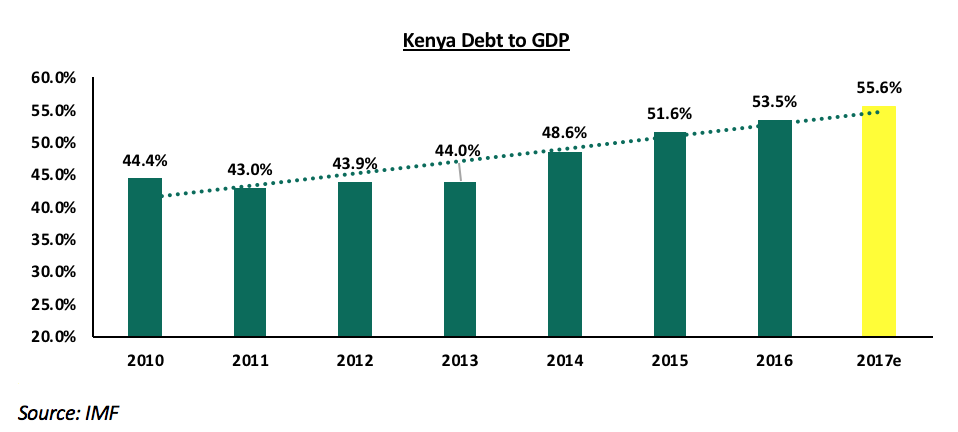
- Nigeria
On 23rd February 2018, Nigeria managed to raise USD 2.5 bn through the issue of a 12 and 20-year Eurobond at yields of 7.1% and 7.7%, respectively. The issue was 4.6x oversubscribed with the bids received at USD 11.5 bn against the target of USD 2.5 bn. This was despite a downgrade, by the Moody's Investors Service, of Nigeria's long-term issuer and senior unsecured debt rating to “B2” from “B1”, with the rating outlook remaining “stable”. However, with prospects of a recovering economy following the improvement in oil prices and production, as well as continued strengthening of its agricultural sector, investors seem to have a positive outlook for Nigeria’s economy going forward. The proceeds from the Eurobond will go towards redeeming expensive Naira debt, and in funding infrastructure development so as to spur economic growth.
As at December 2017, Nigeria's public debt stock stood at USD 71.0 bn, an increase of 23.7% from USD 57.4 bn in December 2016. The public gross debt to GDP ratio in 2017 stood at an estimated 23.4%, an increase from 19.6% in 2016, well below the IMF recommended threshold of 50.0%. The move to use part of the proceeds to refinance the more expensive local debt will reduce debt-financing costs as well as reduce the roll-over risks from the short-tenured domestic debt. Nigeria’s government funds its budget mostly through proceeds from oil exports, and hence, we believe the increase in debt in 2017 was to plug in lower oil sector proceeds given the reduction in production and global oil prices in previous years. Now with recovery in both and efforts to diversify the economy, we expect debt levels to once again reduce going forward.
The chart below shows Nigeria’s debt-to-GDP ratio over the last 7 years: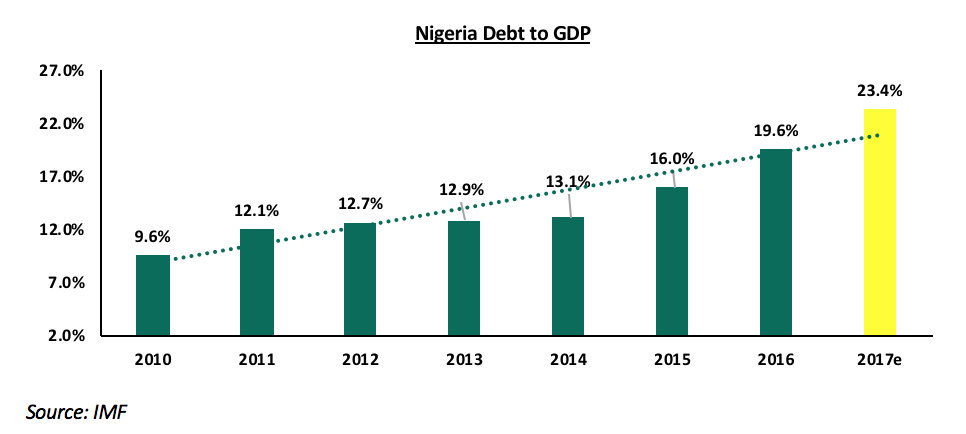
- Senegal
In March 2018, Senegal issued two Eurobonds, a 10-year and 30-year, at coupons of 4.8% and 6.8%, 2.5% points and 1.5% points lower than Kenya’s February 2018 issue with similar tenures, respectively. The issue was 4.5x subscribed with bids received worth USD 10.0 bn, against a target of USD 2.2 bn. The lower than recommended yields, the oversubscription, and Moody’s upgrade of the country’s long-term issuer and senior unsecured debt ratings to “Ba3” from “B1”, and changing of the outlook to “stable” from “positive” are indications of the growing foreign demand for higher yielding emerging and frontier market bonds. We believe that Senegal managed to issue its Eurobonds at lower yields than similar tenure issues in the continent owing to:
- Recent offshore oil & gas discoveries have enabled the country to attract increased foreign direct investment,
- Senegal enjoys strong political stability with no sign of any upheaval in the future as well, unlike other issuer countries like Kenya, Nigeria, Egypt and South Africa, and
- Robust economic growth, with Senegal’s 2017 GDP growth estimated at 6.8% and the economy being projected to grow by 7.0% in 2018, one of the fastest growing economies in SSA.
The government aims to use USD 200.0 mn from the net proceeds to buy back some of its dollar-denominated debt with a maturity date of 2021. The remainder is to be channelled to infrastructure projects, and repay in full the outstanding amounts of the 2018 Bridge, African export-import bank (Afreximbank) and Credit Suisse loans worth EUR 250.0 mn, EUR 137.5 mn and EUR 112.5 mn, respectively.
According to the IMF’s Senegal Debt Sustainability Analysis, public debt for Senegal was estimated at 61.2% of GDP at the end of 2017, an increase from 60.4% in 2016, and above the 50.0% IMF threshold. Despite this, the move to refinance some of their debt with cheaper funds is a commendable debt management strategy. In addition, some of the proceeds are going to be channelled towards infrastructure projects that will further boost GDP growth and reduce the debt to GDP ratio below the recommended thresholds, going forward.
The chart below shows Senegal’s debt-to-GDP ratio over the last 7 years: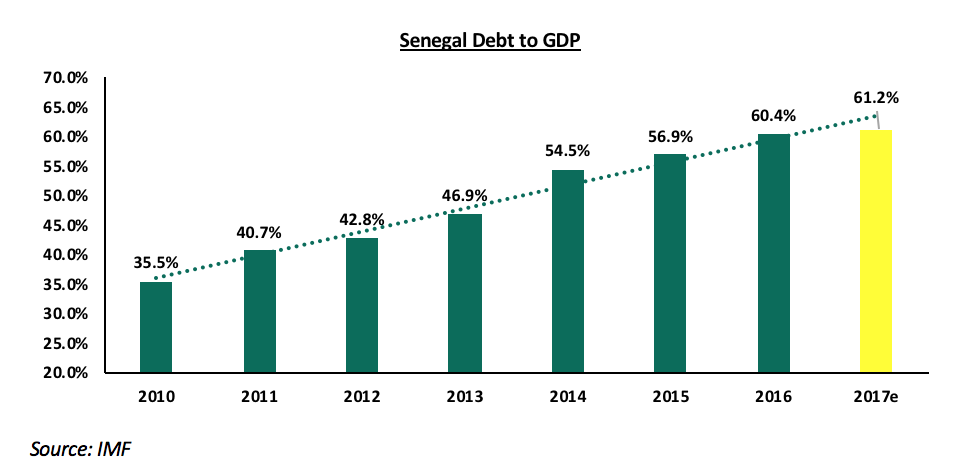
- Ghana
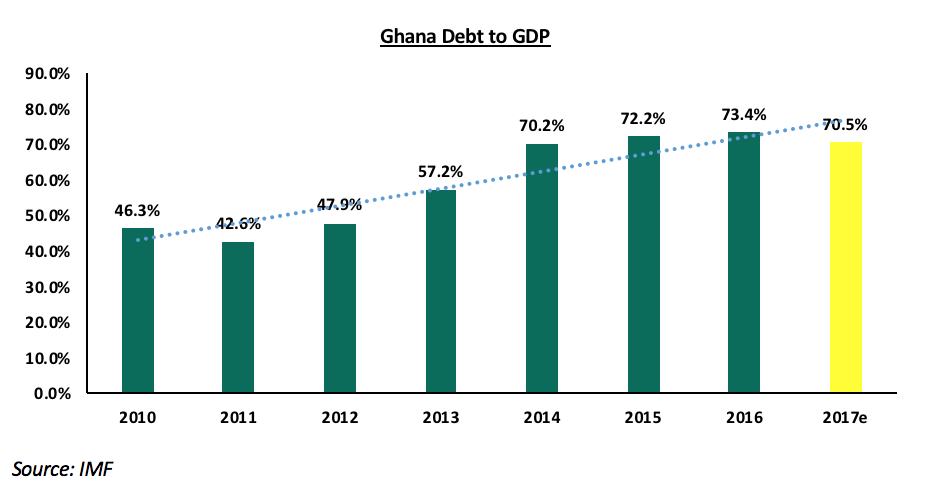
Ghana raised USD 2.0 bn through the issue of a 10-year and 30-year Eurobond in May 2018, at rates of 7.6% and 8.6%, respectively, both 30 bps below what Kenya managed to issue at. The issue was 4.0x oversubscribed with bids received coming in at USD 8.0 bn, against USD 2.0 bn on offer. This came after Moody’s Investor Service affirmed Ghana’s long-term issuer and senior unsecured bond rating at “B3” with a “stable” outlook. The rating was affirmed due to Ghana’s efforts towards debt restructuring, despite their debt levels still being high; while the stable outlook reflected the country’s strong GDP growth and positive outlook for 2018, with economic growth prospects at 8.5%. This is the first time the West-Africa state is issuing a 30-year Eurobond as it seeks to lengthen its foreign debt tenure. The government plans to use the proceeds for debt management and budgetary support.
Data from the IMF estimates that Ghana’s debt-to-GDP ratio hit 70.5%, 20.5% points above the IMF threshold of 50.0%, though this was a slight reduction from 73.4% in 2016. As mentioned in our focus note titled Kenya’s Public Debt, Should We Be Concerned?, the IMF stepped in to bail out Ghana’s lenders in April 2015 through concessional loans, and by introducing reforms that had to be adopted by the government such as reduction of government expenditure and increases in tax rates to boost revenue collected and reduce the budget deficit. This was after Ghana’s risk of debt crisis was at its peak, stemming from a gradual but steady rise in public borrowing on the back of oil discovery and rising global commodity prices, as Ghana is commodity-dependent, big on cocoa and gold exports; which started going sour in 2013 when commodity prices plummeted. With these measures in place, the budget deficit is expected to reduce to about 4.5% of GDP by 2018, from 6.5% as per their 2018 Budget Statement, effectively reducing annual borrowing and the government debt-to-GDP ratio below the 50.0% threshold. The IMF is however still ongoing. With the new government working towards these measures in place and the IMF programme still ongoing, we expect that Ghana will use the proceeds to retire expensive debt and support development expenditure, to enhance increased tax collection, which will in future support the budget and reduce their borrowing requirements.
The chart below shows Ghana’s debt-to-GDP ratio over the last 7 years:
 Section III: Summary and Conclusion
Below is a table showing a summary of currently outstanding SSA Eurobonds:
|
Country |
Issue Tenor (yrs) |
Issue Date |
Maturity Date |
Effective Tenor (yrs) |
Coupon |
Current Market Yield |
Coupon to Current Yield |
|
Ghana |
31 |
5/16/2018 |
6/16/2049 |
31.0 |
8.6% |
8.8% |
0.1% |
|
S.Africa |
30 |
5/22/2018 |
6/22/2048 |
30.0 |
6.3% |
6.4% |
0.1% |
|
Egypt |
30 |
4/29/2010 |
4/30/2040 |
21.9 |
6.9% |
7.0% |
0.1% |
|
Senegal |
30 |
3/13/2018 |
3/13/2048 |
29.7 |
6.8% |
7.8% |
1.1% |
|
Morocco |
30 |
12/11/2012 |
12/11/2042 |
24.5 |
5.5% |
4.9% |
(0.6%) |
|
South Africa |
30 |
9/27/2017 |
9/27/2047 |
29.3 |
5.7% |
5.7% |
0.1% |
|
Nigeria |
30 |
11/28/2017 |
11/28/2047 |
29.5 |
7.6% |
8.2% |
0.6% |
|
Kenya |
30 |
2/28/2018 |
2/28/2048 |
29.7 |
8.3% |
8.7% |
0.4% |
|
Nigeria |
20 |
2/23/2018 |
2/23/2038 |
19.7 |
7.7% |
8.1% |
0.4% |
|
Senegal |
16 |
5/23/2017 |
5/23/2033 |
14.9 |
6.3% |
7.3% |
1.1% |
|
Ghana |
15 |
10/14/2015 |
10/14/2030 |
12.3 |
10.8% |
7.9% |
(2.8%) |
|
Zambia |
12 |
7/30/2015 |
7/30/2027 |
9.1 |
9.0% |
10.6% |
1.6% |
|
Nigeria |
12 |
2/23/2018 |
2/23/2030 |
11.7 |
7.1% |
7.6% |
0.5% |
|
Ghana |
11 |
9/18/2014 |
1/18/2026 |
7.6 |
8.1% |
7.6% |
(0.6%) |
|
Ghana |
11 |
5/16/2018 |
5/16/2029 |
10.9 |
7.6% |
7.9% |
0.3% |
|
Senegal |
10 |
3/13/2018 |
3/13/2028 |
9.7 |
4.8% |
5.4% |
0.7% |
|
Senegal |
10 |
7/30/2014 |
7/30/2024 |
6.1 |
6.3% |
6.5% |
0.3% |
|
Kenya |
10 |
6/24/2014 |
6/24/2024 |
6.0 |
6.9% |
6.8% |
(0.0%) |
|
Zambia |
10 |
4/14/2014 |
4/14/2024 |
5.8 |
8.5% |
10.7% |
2.2% |
|
Senegal |
10 |
5/13/2011 |
5/13/2021 |
2.9 |
8.8% |
5.6% |
(3.1%) |
|
Zambia |
10 |
9/20/2012 |
9/20/2022 |
4.2 |
5.4% |
9.6% |
4.2% |
|
Kenya |
10 |
2/28/2018 |
2/28/2028 |
9.7 |
7.3% |
7.6% |
0.3% |
|
Ghana |
10 |
7/8/2013 |
7/8/2023 |
5.0 |
7.9% |
7.2% |
(0.7%) |
|
Ghana |
6 |
9/15/2016 |
9/15/2022 |
4.2 |
9.3% |
5.5% |
(3.8%) |
|
Nigeria |
5 |
7/12/2013 |
7/12/2018 |
0.1 |
5.1% |
5.7% |
0.6% |
|
Kenya |
5 |
6/24/2014 |
6/24/2019 |
1.0 |
5.9% |
6.8% |
1.0% |
Key to note from the table:
- Senegal managed to issue its Eurobond at lower rates compared to other issues at 4.8% for the 10-year and 6.8% for the 30-year bond. This is due to the country’s stable political outlook and also the fast economic growth driven by the discovery of the 15.0 tn cubic feet of natural gas and 1.5 bn barrels of crude oil in 2016, which add to the positive growth prospects of the country, and
- The yields on most of the Eurobonds have been on the rise since issue, due to a higher risk pricing by investors that has seen flight of capital back to the US markets, attributed to the rising interest rates from the 2 Fed rate hikes experienced during the year, which has seen investors demanding a premium on debt from emerging and frontier market due to the risk associated with them.
In conclusion, SSA Eurobonds have proven to be an attractive investment offering with relatively higher yields than in the developed markets. With a positive outlook on economic growth - SSA growth is projected to rise to 3.4% in 2018 from 2.8% in 2017 - as well as improved political stability in the region, the SSA region is expected to remain an attractive investment destination for investors looking for emerging & frontier market exposure. This being said, exchange rate risk and debt sustainability remain key points of concern, as most of the proceeds are being used to refinance other debt facilities and to finance non-income generating social investments such as healthcare and education. The low levels of diversification of the economies and over reliance on commodities and agriculture make the region volatile to global price changes and weather conditions. Nonetheless, the issue of Eurobonds in the SSA region has become an important source of government funding and has enhanced economic growth.
More countries in SSA are planning to issue Eurobonds this year, though the conditions are expected to be tougher, with the Fed being expected to further hike the federal funds rate two more times this year, with 2 hikes already having taken place with the recent one in June 2018, when rates were increased to a band of 1.50% - 1.75% from 1.25%- 1.50%, previously. These countries include:
- Angola is expected to issue a Eurobond to raise USD 2.0 bn, to finance public investment projects while
- Tanzania is also expected to debut its first Eurobond worth USD 700.0 mn to finance infrastructure projects after receiving its first-time local and foreign currency issuer rating of “B1” from Moody’s, with a “negative” outlook due to an increasingly unpredictable policy environment weighing on the business climate.
If all these take place, this should bring the total external borrowing through Eurobonds in SSA during the year to an estimated USD 13.4 bn. Increased concerns around debt sustainability in SSA may arise from this, but taking on the debt might be beneficial should the borrowed funds be channelled towards (i) refinancing more expensive foreign currency denominated debt and to lengthen tenures, and not simply to repay maturing debt obligations, and (ii) development expenditure on projects that will in turn boost economic growth in these countries.
Disclaimer: The views expressed in this publication are those of the writers where particulars are not warranted. This publication, which is in compliance with Section 2 of the Capital Markets Authority Act Cap 485A, is meant for general information only and is not a warranty, representation, advice or solicitation of any nature. Readers are advised in all circumstances to seek the advice of a registered investment advisor.

- Talk to us
- Kenya
- P.O Box 20695 - 00200, Nairobi, Kenya
- Cell +254709101200
- Tel +254709101200
- WhatsApp +254741676635
- United States
- +254709101200
- DOWNLOAD OUR APP
-


- Kenya
- 8th Floor, Pinetree Plaza, Kaburu Drive, Ngong Road, Nairobi, Kenya
- USA
- Suite 1150, 1775 Eye Street NW, USA, Washington DC 20006, USA
- Investments
- High Yield
- Private Equity
- Real Estate
- Real Estate
- RiverRun Estates
- Cytonn Towers
- The Ridge
- Taraji Heights
- The Alma