Fintech and Capital Markets Integration in Kenya, & Cytonn Weekly #01/2026
By Research team, Jan 11, 2026
Executive Summary
Fixed Income
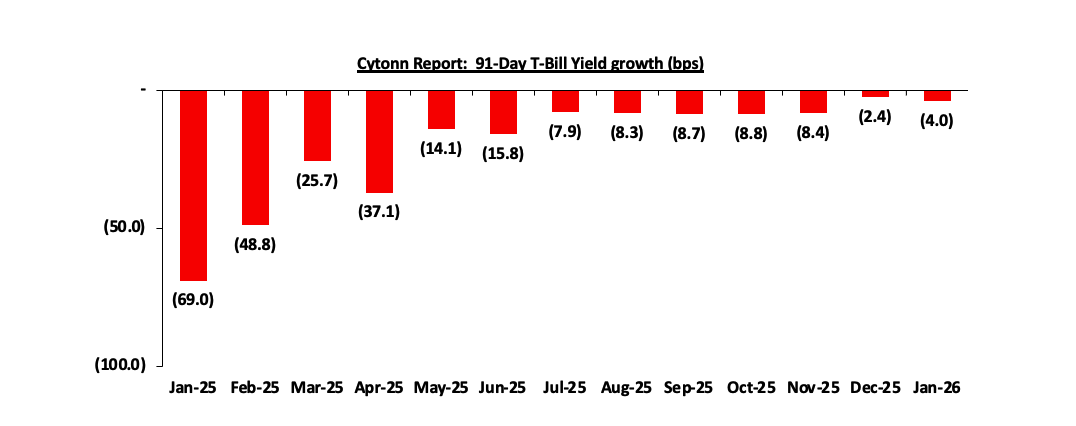
During the week, T-bills were oversubscribed for the second consecutive week, with the overall subscription rate coming in at 130.3%, higher than the subscription rate of 108.0% recorded the previous week. Investors’ preference for the shorter 91-day paper waned, with the paper receiving bids worth Kshs 4.3 bn against the offered Kshs 4.0 bn, translating to a subscription rate of 108.5%, lower than the subscription rate of 158.2%, recorded the previous week. The subscription rate for the 182-day paper decreased to 96.1% from the 112.9% recorded the previous week, while that of the 364-day papers increased to 173.2% from 83.0% recorded the previous week. The government accepted a total of Kshs 26.2 bn worth of bids out of Kshs 31.3 bn bids received, translating to an acceptance rate of 83.7%. The yields on the government papers showed mixed performance with the yield on the 182-day paper remaining unchanged at 7.8%, while the yields on the 364-day and 91-day paper decreased marginally by 0.5 bps and 0.1 bps to remain unchanged at 9.2% and 7.7% respectively compared to the previous week;
During the week, the Central Bank of Kenya released the auction results for the re-opened treasury bonds FXD1/2019/020 and FXD1/2022/025 with tenors to maturities of 13.2 years and 21.8 years respectively and fixed coupon rates of 12.9% and 14.2% respectively. The bonds were oversubscribed, with the overall subscription rate coming in at 119.2%, receiving bids worth Kshs 71.5 bn against the offered Kshs 60.0 bn. The government accepted bids worth Kshs 60.6 bn, translating to an acceptance rate of 84.7%. The weighted average yield for the accepted bids for the FXD1/2019/020 and FXD1/2022/025 came in at 13.3% and 13.8% respectively. Notably, the 13.3% on the FXD1/2019/020 was lower than the 13.4% recorded the last time the bond was reopened in November 2021 while the 13.8% on the FXD1/2022/025 was higher than the 13.7% recorded the last time the bond was reopened in November 2025. With the Inflation rate at 4.5% as of December 2025, the real returns of the FXD1/2019/020 and FXD1/2022/025 are 8.8% and 9.3%. Given the 10.0% withholding tax on the bonds, the tax equivalent yields for shorter term bonds with 15.0% withholding tax are 14.1% and 14.6% for the FXD1/2019/020 and FXD1/2022/025 respectively;
The Kenya National Bureau of Statistics (KNBS) released the Q3’2025 Quarterly Gross Domestic Product Report, indicating that the Kenyan economy expanded by 4.9% in Q3’2025, higher than the 4.2% growth recorded in Q3’2024;
According to the Q3’2025 Kenya Quarterly Balance of Payment Report released by the Kenya National Bureau of Statistics (KNBS), Kenya’s balance of payments position improved significantly by 458.9% in Q3’2025, to a surplus of Kshs 63.7 bn, from a deficit of Kshs 17.8 bn in Q3’2024;
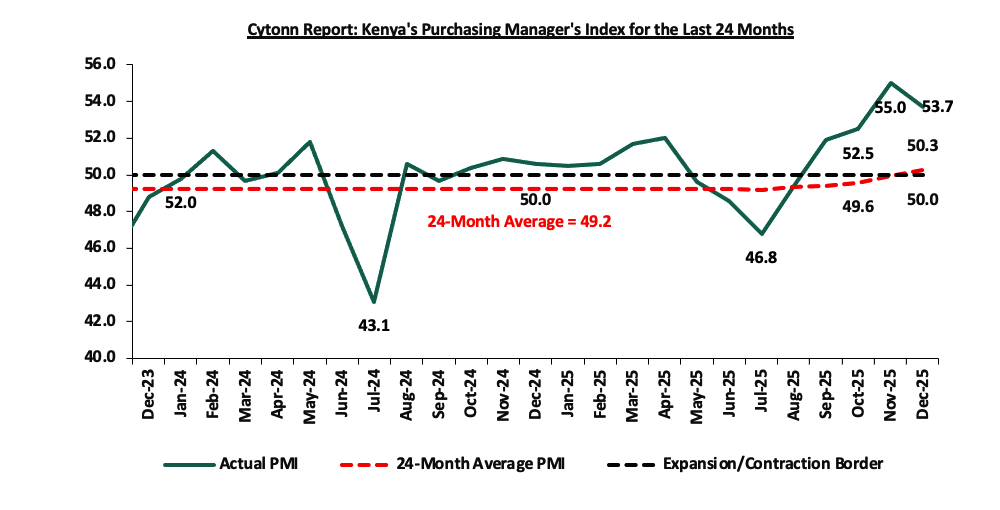
During the week, Stanbic Bank released its monthly Purchasing Manager’s Index (PMI), highlighting that the index for the month of December 2025 remained in expansion territory, coming in at 53.7, albeit lower than 55.0 recorded in November 2025, marking the fourth consecutive month the index remained above the 50.0 neutral mark, signaling a sustained improvement in business conditions;
Equities
During the week, the equities market was on an upward trajectory, with NSE 20, NSE 25 and NSE 10 and NASI gaining by 3.0%, 2.5%, 2.4%, 2.4% taking the YTD performance to gains of 3.0%, 2.5%, 2.4% and 2.4% of NSE 20, NSE 25, NSE 10 and NASI respectively. The equities market performance was mainly driven by gains recorded by large cap stocks such as Cooperative Bank, NCBA and Equity of 8.6%, 4.7% and 3.7% respectively. However, the performance was weighed down by losses recorded by large cap stocks such as EABL of 4.4%;
Also, during the week, the banking sector index gained by 3.6% to 211.7 from 204.4 recorded the previous week. This is attributable to gains recorded by stocks such as Cooperative Bank, NCBA and Equity of 8.6%, 4.7% and 3.7% respectively;
Real Estate
During the week, the Kenya National Bureau of Statistics (KNBS) released the Quarterly Gross Domestic Product Report that outlined the performance of various sectors to the GDP;
Also during the week, the Kenya National Bureau of Statistics (KNBS) released the Leading Economic Indicators (LEI) November 2025 Report, which highlighted the performance of major economic indicators;
During the week, co-working space provider Kofisi closed two of its Nairobi locations, Karen and Upper Hill, following a USD 3.2 mn (Kshs 416.7 mn) loss in 2024, reversing a profit of USD 16.28 mn in 2023. The London-based company aims to focus on larger, higher-capacity sites to enhance client experience through community spaces, better services, and economies of scale. Despite the loss, Kofisi’s revenues rose 24.5% to USD 10.3 mn in 2024, supported by high occupancy rates averaging above 90% across its offices. Kenya remains Kofisi’s largest market in Africa, accounting for USD 7.6 mn or 74.4% of its 2024 revenue;
Smartwings Airlines begun direct charter flights from Budapest, Hungary, to Mombasa, Kenya, reflecting growing interest in Kenya’s coastal tourism from Eastern Europe. The inaugural flight, carrying 183 passengers, was welcomed on 29th December 2025 highlighting Kenya’s effort to boost tourism. The Hungary-Mombasa route operates through a partnership with tour companies Private Safaris and iBUSZ, targeting travelers seeking beach holidays and wildlife experiences. While arrivals from Eastern Europe remain lower than from Western Europe, this new route indicates potential growth in regional tourism;
On the Unquoted Securities Platform, Acorn D-REIT and I-REIT traded at Kshs 27.4 and Kshs 23.2 per unit, respectively, as per the last updated data on 5th December 2025. The performance represented a 33.4% and 14.5% gain for the D-REIT and I-REIT, respectively, from the Kshs 20.0 inception price. The volumes traded for the D-REIT and I-REIT came in at 12.8 mn and 41.2 mn shares, respectively, with a turnover of Kshs 323.5 mn and Kshs 791.5 mn, respectively, since inception in February 2021. Additionally, ILAM Fahari I-REIT traded at Kshs 11.0 per share as of 5th December 2025, representing a 45.0% loss from the Kshs 20.0 inception price. The volume traded to date came in at 1.2 mn shares for the I-REIT, with a turnover of Kshs 1.5 mn since inception in November 2015;
Focus of the Week
Kenya’s financial services sector has undergone a profound transformation over the past two decades, establishing the country as one of Africa’s leading fintech hub. This evolution began with the launch of M-pesa in 2007 and has since expanded into digital lending, insurtech, blockchain applications, and, increasingly, capital markets integration, demonstrating how technology can leapfrog traditional financial infrastructure to deliver broad-based access. In parallel, Kenya’s capital markets, anchored by the Nairobi Securities Exchange established in 1954, have modernized but continue to face structural challenges, including shallow liquidity, limited retail participation, and concentrated institutional ownership. Integrating fintech into capital markets is therefore critical for mobilizing long-term savings, expanding investor participation, and channeling capital to productive investments. Leveraging tools such as fractional investing, automated advisory services, and digital settlement systems could transform Kenya’s 89.1 mn mobile money accounts as of November 2025 from transactional participants into long-term investors. With a digitally savvy population and a relatively progressive regulatory environment, Kenya is well positioned to seize this opportunity, provided regulatory coordination, cybersecurity resilience, and consumer protection are effectively addressed.
Investment Updates:
-
Weekly Rates:
-
We continue to offer Wealth Management Training every Tuesday, from 7:00 pm to 8:00 pm. The training aims to grow financial literacy among the general public. To register for any of our Wealth Management Trainings, click here;
-
If interested in our Private Wealth Management Training for your employees or investment group, please get in touch with us through wmt@cytonn.com;
-
Cytonn Insurance Agency acts as an intermediary for those looking to secure their assets and loved ones’ future through insurance namely; Motor, Medical, Life, Property, WIBA, Credit and Fire and Burglary insurance covers. For assistance, get in touch with us through insuranceagency@cytonn.com;
-
Cytonn Asset Managers Limited (CAML) continues to offer pension products to meet the needs of both individual clients who want to save for their retirement during their working years and Institutional clients that want to contribute on behalf of their employees to help them build their retirement pot. To more about our pension schemes, kindly get in touch with us through pensions@cytonn.com;
Hospitality Updates:
-
We currently have promotions for Staycations. Visit cysuites.com/offers for details or email us at sales@cysuites.com;
Money Markets, T-Bills Primary Auction:
During the week, T-bills were oversubscribed for the second consecutive week, with the overall subscription rate coming in at 130.3%, higher than the subscription rate of 108.0% recorded the previous week. Investors’ preference for the shorter 91-day paper waned, with the paper receiving bids worth Kshs 4.3 bn against the offered Kshs 4.0 bn, translating to a subscription rate of 108.5%, lower than the subscription rate of 158.2%, recorded the previous week. The subscription rate for the 182-day paper decreased to 96.1% from the 112.9% recorded the previous week, while that of the 364-day papers increased to 173.2% from 83.0% recorded the previous week. The government accepted a total of Kshs 26.2 bn worth of bids out of Kshs 31.3 bn bids received, translating to an acceptance rate of 83.7%. The yields on the government papers showed mixed performance with the yield on the 182-day paper remaining unchanged at 7.8%, while the yields on the 364-day and 91-day paper decreased marginally by 0.5 bps and 0.1 bps to remain unchanged at 9.2% and 7.7% respectively compared to the previous week. The chart below shows the yield growth rate for the 91-day paper from January 2025 to January 2026 month-to-date:
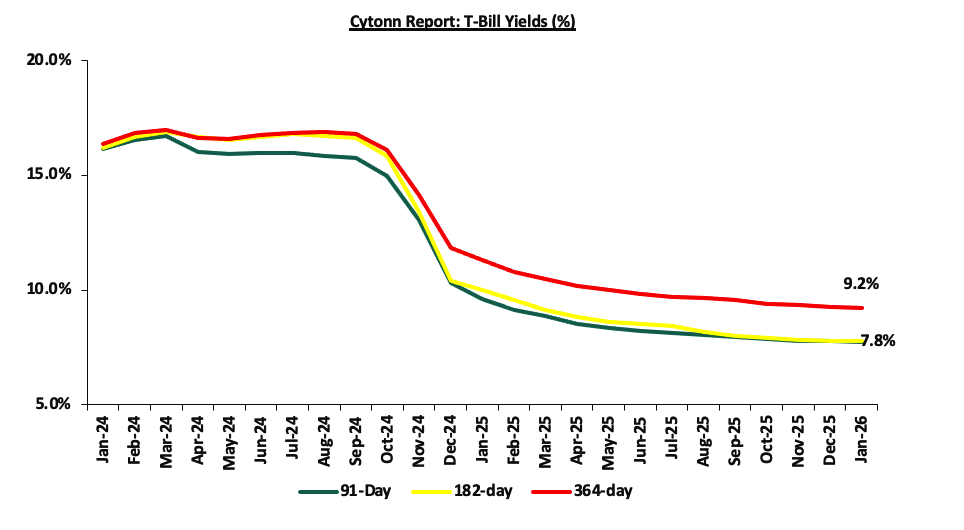
The charts below show the performance of the 91-day, 182-day and 364-day papers from January 2024 to January: 2026;:
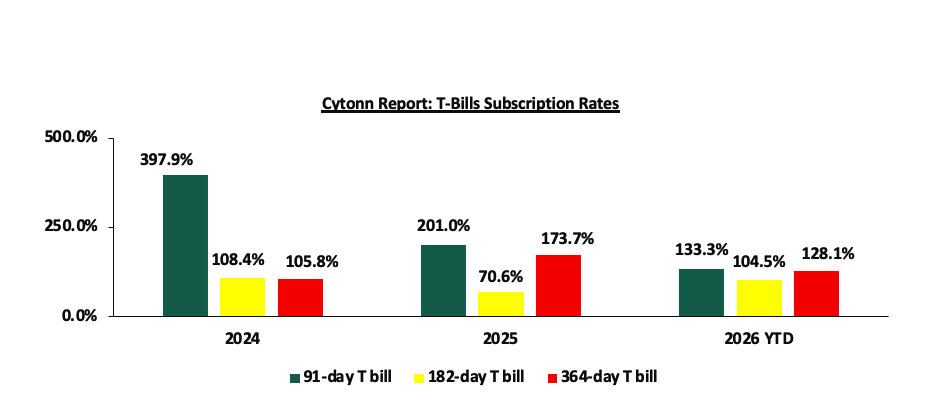
The chart below compares the overall average T- bills subscription rates obtained in 2024, 2025 and 2026 Year-to-date (YTD):
Primary T-Bond Auctions
The Central Bank of Kenya released the auction results for the re-opened treasury bonds FXD1/2019/020 and FXD1/2022/025 with tenors to maturities of 13.2 years and 21.8 years respectively and fixed coupon rates of 12.9% and 14.2% respectively. The bonds were oversubscribed, with the overall subscription rate coming in at 119.2%, receiving bids worth Kshs 71.5 bn against the offered Kshs 60.0 bn. The government accepted bids worth Kshs 60.6 bn, translating to an acceptance rate of 84.7%. The weighted average yield for the accepted bids for the FXD1/2019/020 and FXD1/2022/025 came in at 13.3% and 13.8% respectively. Notably, the 13.3% on the FXD1/2019/020 was lower than the 13.4% recorded the last time the bond was reopened in November 2021 while the 13.8% on the FXD1/2022/025 was higher than the 13.7% recorded the last time the bond was reopened in November 2025. With the Inflation rate at 4.5% as of December 2025, the real returns of the FXD1/2019/020 and FXD1/2022/025 are 8.8% and 9.3%. Given the 10.0% withholding tax on the bonds, the tax equivalent yields for shorter term bonds with 15.0% withholding tax are 14.1% and 14.6% for the FXD1/2019/020 and FXD1/2022/025 respectively.
Money Market Performance:
In the money markets, 3-month bank placements ended the week at 9.2% (based on what we have been offered by various banks). The yields on the 364-day and 91-day paper decreased marginally by 0.5 bps and 0.1 bps to remain unchanged at 9.2% and 7.7% respectively compared to the previous week. The yield on the Cytonn Money Market Fund decreased by 23.0 bps to 11.7% from the 11.9% recorded the previous week, while the average yields on the Top 5 Money Market Funds decreased by 17.6 bps to 11.5% from 11.7% recorded the previous week.

The table below shows the Money Market Fund Yields for Kenyan Fund Managers as published on 9th January 2026:
|
Money Market Fund Yield for Fund Managers as published on 9th January 2026 |
||
|
Rank |
Fund Manager |
Effective Annual Rate |
|
1 |
Arvocap Money Market Fund |
12.0% |
|
2 |
Cytonn Money Market Fund ( Dial *809# or download Cytonn App) |
11.7% |
|
3 |
Nabo Africa Money Market Fund |
11.4% |
|
4 |
Etica Money Market Fund |
11.3% |
|
5 |
Ndovu Money Market Fund |
11.1% |
|
6 |
Lofty-Corban Money Market Fund |
11.0% |
|
7 |
Enwealth Money Market Fund |
11.0% |
|
8 |
Gulfcap Money Market Fund |
10.8% |
|
9 |
Old Mutual Money Market Fund |
10.5% |
|
10 |
Kuza Money Market fund |
10.4% |
|
11 |
Jubilee Money Market Fund |
10.3% |
|
12 |
Orient Kasha Money Market Fund |
10.1% |
|
13 |
Madison Money Market Fund |
9.8% |
|
14 |
Dry Associates Money Market Fund |
9.7% |
|
15 |
British-American Money Market Fund |
9.7% |
|
16 |
Apollo Money Market Fund |
9.5% |
|
17 |
KCB Money Market Fund |
9.5% |
|
18 |
GenAfrica Money Market Fund |
9.2% |
|
19 |
SanlamAllianz Money Market Fund |
9.1% |
|
20 |
Faulu Money Market Fund |
9.1% |
|
21 |
Genghis Money Market Fund |
8.6% |
|
22 |
CIC Money Market Fund |
8.5% |
|
23 |
ICEA Lion Money Market Fund |
8.3% |
|
24 |
CPF Money Market Fund |
8.3% |
|
25 |
Mali Money Market Fund |
8.2% |
|
26 |
Co-op Money Market Fund |
8.2% |
|
27 |
Absa Shilling Money Market Fund |
7.5% |
|
28 |
Mayfair Money Market Fund |
7.1% |
|
29 |
AA Kenya Shillings Fund |
6.6% |
|
30 |
Ziidi Money Market Fund |
6.1% |
|
31 |
Stanbic Money Market Fund |
5.2% |
|
32 |
Equity Money Market Fund |
4.9% |
Source: Business Daily
Liquidity:
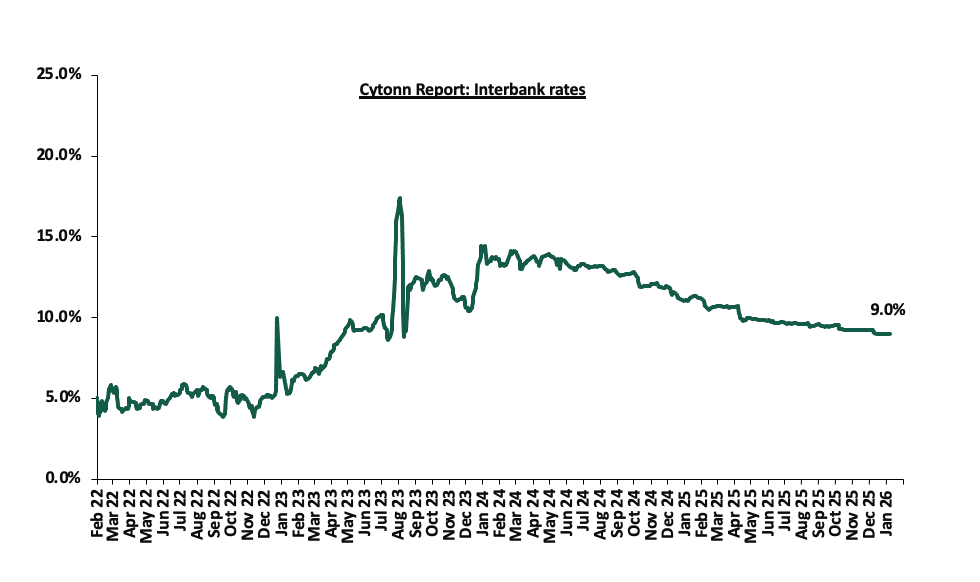
During the week, liquidity in the money markets eased, with the average interbank rate decreasing marginally by 1.2 bps, to remain relatively unchanged at 9.0% compared to the previous week, partly attributable to government payments that offset tax remittances. The average interbank volumes traded decreased by 22.6% to Kshs 7.5 bn from Kshs 9.7 bn recorded the previous week. The chart below shows the interbank rates in the market over the years:
Kenya Eurobonds:
During the week, the yields on Eurobonds were on an upward trajectory, with the yields on the 13-year Eurobond issued in 2021 increasing the most by 33.7 bps to 8.1% from 7.8% recorded the previous week. The table below shows the summary of the performance of the Kenyan Eurobonds as of 8th January 2026:
|
Cytonn Report: Kenya Eurobond Performance |
|||||||
|
|
2018 |
2019 |
2021 |
2024 |
2025 |
||
|
Tenor |
10-year issue |
30-year issue |
7-year issue |
12-year issue |
13-year issue |
7-year issue |
11-year issue |
|
Amount Issued (USD) |
1.0 bn |
1.0 bn |
0.9 bn |
1.2 bn |
1.0 bn |
1.5 bn |
1.5 bn |
|
Years to Maturity |
2.5 |
22.5 |
1.7 |
6.7 |
8.8 |
5.5 |
10.5 |
|
Yields at Issue |
7.3% |
8.3% |
7.0% |
7.9% |
6.2% |
10.4% |
9.9% |
|
2-Jan-26 |
6.1% |
8.8% |
- |
7.2% |
7.8% |
7.1% |
|
|
31-Dec-25 |
6.0% |
8.8% |
- |
7.2% |
7.8% |
7.1% |
|
|
2-Jan-26 |
6.1% |
8.8% |
- |
7.2% |
7.8% |
7.1% |
|
|
5-Jan-26 |
6.1% |
8.8% |
|
7.2% |
7.8% |
7.1% |
|
|
6-Jan-26 |
6.1% |
8.9% |
- |
7.3% |
7.9% |
7.1% |
10.0% |
|
7-Jan-26 |
6.1% |
9.0% |
|
7.3% |
8.0% |
7.2% |
|
|
8-Jan-26 |
6.2% |
9.1% |
- |
7.4% |
8.1% |
7.3% |
|
|
Weekly Change |
0.2% |
0.2% |
- |
0.3% |
0.3% |
0.2% |
0.0% |
|
MTD Change |
0.2% |
0.2% |
- |
0.3% |
0.3% |
0.2% |
0.0% |
|
YTD Change |
0.2% |
0.2% |
- |
0.3% |
0.3% |
0.2% |
0.0% |
Source: Central Bank of Kenya (CBK)
Kenya Shilling:
During the week, the Kenya Shilling appreciated against the US Dollar by 3.1 bps, to Kshs 129.0 from Kshs 129.1 recorded the previous week. On a year-to-date basis, the shilling has appreciated by 3.1 bps against the dollar, lower than the 22.9 bps appreciation recorded in 2025.
We expect the shilling to be supported by:
-
Diaspora remittances standing at a cumulative USD 5,046.6 mn in the twelve months to November 2025, 3.6% higher than the USD 4,872.2 mn recorded over the same period in 2024. This has continued to cushion the shilling against further depreciation. In the November 2025 diaspora remittances figures, North America remained the largest source of remittances to Kenya accounting for 60.6% in the period,
-
Tourism inflows, which strengthened significantly. Tourism receipts reached Kshs 560.0 billion in 2025, up from Kshs 452.2 billion in 2024, representing a 23.9% increase, supported by improved international arrivals through the country’s major airports, and,
-
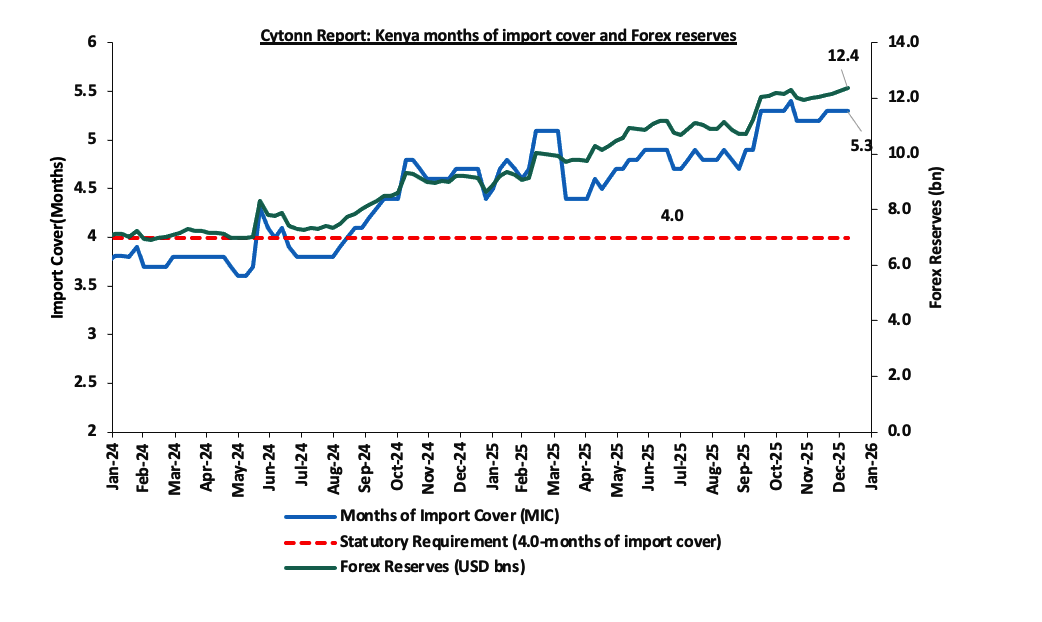
Improved forex reserves currently at USD 12.4 bn (equivalent to 5.3-months of import cover), which is above the statutory requirement of maintaining at least 4.0-months of import cover and above the EAC region’s convergence criteria of 4.5-months of import cover.
The shilling is however expected to remain under pressure in 2026 as a result of:
-
An ever-present current account deficit which came at 2.2% of GDP in the twelve months to October 2025, and,
-
Elevated government debt servicing obligations, which continue to exert pressure on foreign exchange reserves, given that 59.7% of Kenya’s external debt is US Dollar-denominated as of June 2025, sustaining demand for hard currency in 2026.
Kenya’s forex reserves increased by 1.8% during the week to USD 12.4 bn from the USD 12.2 bn recorded the previous week, equivalent to 5.3 months of import cover, and above the statutory requirement of maintaining at least 4.0-months of import cover.
The chart below summarizes the evolution of Kenya's months of import cover over the years:
Weekly Highlights
-
Kenya Q3’2025 GDP Growth
The Kenya National Bureau of Statistics (KNBS) released the Q3’2025 Quarterly Gross Domestic Product Report, indicating that the Kenyan economy expanded by 4.9% in Q3’2025, higher than the 4.2% growth recorded in Q3’2024. The improved performance was largely driven by accelerated growth in key sectors, with Mining and Quarrying rebounding to 16.6% in Q3’2025 from a 12.2% contraction in Q3’2024, Construction expanding by 6.7% in Q3’2025 from a 2.6% contraction in Q3’2024, and Electricity and Water Supply growing by 3.6% in Q3’2025 from 0.9% in Q3’2024. However, the Agriculture and Forestry sector, the main contributor to GDP, recorded a slower growth of 3.2% in Q3’2025, down from 4.2% in Q3’2024, while several service-oriented sectors experienced moderated growth rates, including Information and Communication, which slowed to 4.5% in Q3’2025 from 6.1% in Q3’2024, and Professional Services, which moderated to 6.1% from 7.8%. Despite the moderation, the economy demonstrated resilience supported by recovery in extractive, construction, and selected service sectors.
The key take-outs from the report include;
-
Sectoral contribution to growth: The biggest gainer in terms of sectoral contribution to GDP was the Accommodation & Food Services sector, increasing by 0.3% points to 1.7% in Q3’2025 from 1.4% in Q3’2024, while Agriculture and Forestry was the biggest loser, declining by 0.3% points to 14.2% in Q3’2025 from 14.5% in Q3’2024. Agriculture and Forestry remains the major contributor to GDP, with the sectoral contribution to GDP decreasing by 0.3% points to 14.2% in Q3’2025, from 14.5% recorded in Q3’2024, while Real Estate remained unchanged at 10.8% in Q3’2025, from 10.8% in Q3’2024. The Accommodation & Food Services sector recorded the highest growth rate in Q3’2025, expanding by 17.7%, from 13.7% in Q3’2024.
The chart below shows the top contributors to GDP by sector in Q3’2025:
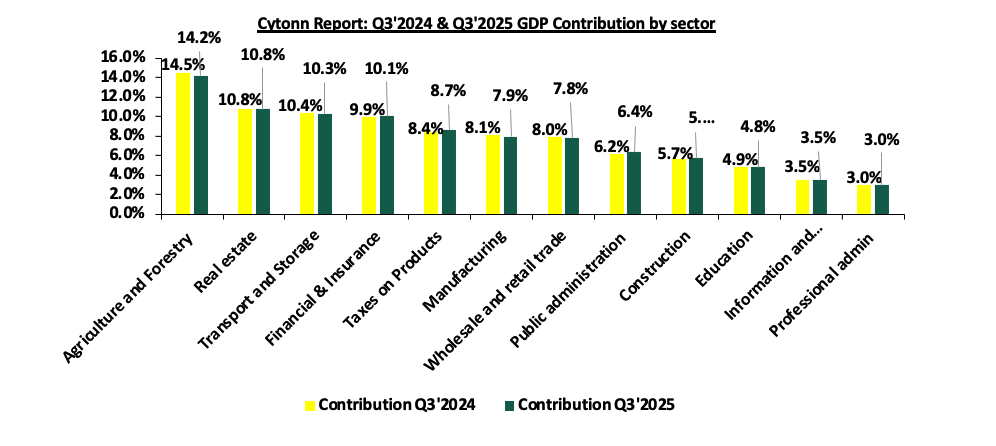
Source: KNBS Q3’2024 and Q3’2025 GDP Report
-
Reduced growth in the Agricultural Sector: Agriculture and Forestry recorded a growth of 3.2% in Q3’2025. The performance was a decrease of 1.0% points, from the expansion of 4.2% recorded in Q3’2024. Additionally, the sector remains the major contributor to GDP, with the sectoral contribution to GDP declining by 0.3% points to 14.2% in Q3’2025, from 14.5% recorded in Q3’2024. The positive growth recorded during the quarter was mainly attributable to favorable weather conditions. Notably, during the quarter, the quantity of milk deliveries to processors increased by 9.7% to 249.0 mn litres during the quarter under review from 227.0 mn litres in the third quarter of 2024, and flower exports increased by 36.2% to 31,277.0 metric tonnes during the quarter under review from 22,960.7 metric tonnes in the third quarter of 2024.
-
Accelerated growth in the Financial and Insurance Services Sector-The Financial and Insurance sector growth rate increased by 0.7% points to 5.4% in Q3’2025 compared to 4.7% in Q3’2024, supported by continued ease in the cost of credit during the period. The contribution to GDP increased by 0.2% to 10.1% in Q3’2025 from 9.9% recorded in Q3’2024. Some of the notable improvements include:
-
The number of shares traded in the Nairobi Securities Exchange increased by 153.9%, rising to 848.0 mn in September 2025 from 334 mn in September 2024. Similarly, the total value of traded shares surged by 2,358.0%, increasing from Kshs 5.0 bn in September 2024 to Kshs 122.9 bn in September 2025,
-
The NSE 20 Share Index rose by 67.3% to 2,973 points in September 2025 from 1,776 points in September 2024, signaling improved performance in the equity market,
-
Broad money supply (M3) grew by 7.5% to Kshs 6,443.7 bn as at end of September 2025, from Kshs 5,992.2 bn recorded as at the end of September 2024.
-
Accelerated growth in the electricity supply sector The Electricity and Water Supply sector recorded an accelerated growth of 3.6% in Q3’2025 compared to a 0.9% growth in Q3’2024, with the sectoral contribution to GDP remaining unchanged at 2.5% in Q3’2025, from 2.5% in Q3’2024. Notably, total electricity generated increased by 5.0% to 3,402.4 mn KWh in Q3’2025, from 3,241.3 mn KWh in Q3’2024.
-
Accelerated growth in the Accommodation and Food Service sector Accommodation and Food Services sector recorded an accelerated growth of 17.7% in Q3’2025, higher than the 13.7% recorded in Q3’2024, while the sector’s contribution to GDP increased to 1.7% in Q3’2025 from 1.4% in Q3’2024
The chart below shows the different sectoral GDP growth rates for Q3’2025:
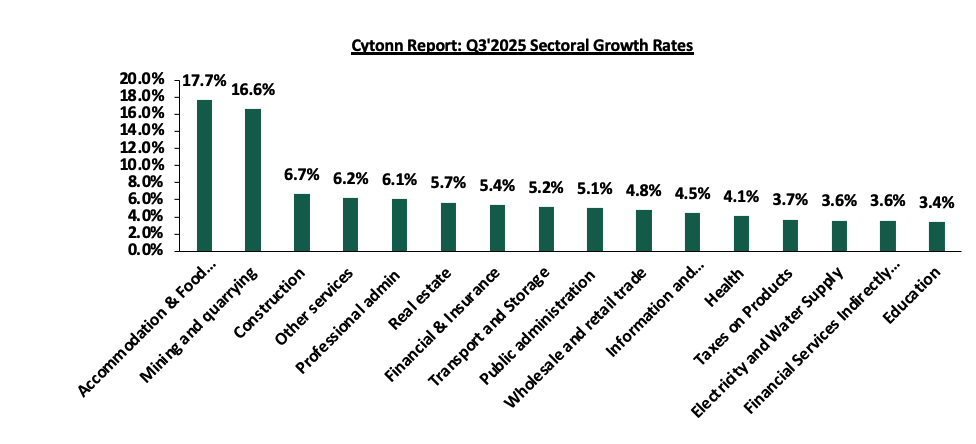
Source: KNBS Q3’2025 GDP Report
In 2025, Kenya’s economy is projected to grow at a faster pace, estimated at an average of 5.0%, supported by strengthened business activity, a relatively stable Kenyan Shilling, reduced borrowing costs, and inflation within the Central Bank of Kenya’s (CBK) target range. However, the growth trajectory still faces headwinds from a difficult business environment, including rising taxes and a high cost of living. At its December 9, 2025, Monetary Policy Committee (MPC) meeting, the CBK cut the Central Bank Rate (CBR) by 25 basis points to 9.00% from 9.25% in October 2025, marking the ninth consecutive rate reduction in its ongoing easing cycle. The decision was driven by the MPC’s assessment that inflation remained comfortably within the target range, and that monetary policy could continue to support private sector lending and economic activity. Headline inflation in Kenya remained steady at 4.5% in December 2025, unchanged from November, and within the CBK’s preferred target band of 2.5%–7.5%. The persistence of inflation within this range was underpinned by stable energy costs and moderated inflationary pressure on processed food items, even as some food prices rose. The accommodative monetary policy stance is expected to alleviate some pressure on the cost of credit, improving access to affordable borrowing and encouraging investment by both businesses and households. This environment is supportive of increased private sector activity and broader economic expansion. However, inflationary pressures from food prices and other cost-of-living factors present ongoing risks, while favorable rainfall and a stable macroeconomic backdrop bolster optimism for Kenya’s growth prospects in 2025.
For a more detailed analysis read our Q3’2025 GDP Note
-
Kenya Q3’2025 Balance of Payments
Balance of Payments
Kenya’s balance of payment (BoP) position improved significantly by 458.9% in Q3’2025, to a surplus of Kshs 63.7 bn, from a deficit of Kshs 17.8 bn in Q3’2024. The y/y positive performance in BoP was mainly driven by a significant 118.0% increase in capital account balance to a surplus of Kshs 3.0 bn from a surplus of Kshs 1.4 bn in Q3’2024, coupled with a 57.8% decrease in the financial account balance to a deficit of Kshs 25.7 bn from a deficit of Kshs 60.9 bn. The table below shows the breakdown of the various balance of payments components, comparing Q3’2025 and Q3’2024:
|
Item |
Q3'2024 |
Q3'2025 |
Y/Y % Change |
|
Current Account Balance |
(43.5) |
(135.3) |
211.1% |
|
Capital Account Balance |
1.4 |
3.0 |
118.0% |
|
Financial Account Balance |
(60.9) |
(25.7) |
(57.8%) |
|
Net Errors and Omissions |
(1.0) |
42.9 |
4,336.3% |
|
Balance of Payments |
(17.8) |
63.7 |
458.9% |
All values in Kshs bns
Key take-outs from the table include;
-
The current account deficit (value of goods and services imported exceeds the value of those exported) increased by 211.1% to Kshs 135.3 bn from Kshs 43.5 bn in Q3’2024. The y/y increase of the current account was brought about by the 10.8% widening in the Merchandise trade deficit to Kshs 355.8 bn from a Kshs 321.1 bn in Q3’2024.,
-
The capital account balance (shows capital transfers receivable and payable between residents and non-residents, including the acquisition and disposal of non-produced non-financial items), which includes foreign direct investments (FDIs), increased by 118.0% to a surplus Kshs 3.0 bn in Q3’2025, up from a surplus of Kshs 1.4 bn in Q2’2024,
-
The financial account balance (the difference between the foreign assets purchased by domestic buyers and the domestic assets purchased by foreign buyers) recorded a 57.8% decrease in net inflow to a deficit Kshs 25.7 billion in Q3’2025, from a deficit of Kshs 60.9 billion in Q3’2024.
-
Consequently, the Balance of Payments (BoP) position improved to a surplus of Kshs 63.7 bn in Q3’2025, from a deficit of Kshs 17.8 bn recorded in Q3’2024.
Current Account Balance
Kenya’s current account deficit widened by 211.1% to Kshs 135.3 bn in Q3’2025 from the Kshs 43.5 bn deficit recorded in Q3’2024. The y/y expansion of the deficit registered was driven by:
-
The widening of the merchandise trade account deficit (the value of import goods exceeds the value of export goods, resulting in a negative net foreign investment) by 10.8% to Kshs 355.8 bn in Q3’2025, from Kshs 321.1 bn recorded in Q3’2024, and,
-
A 43.1% decrease in the services trade balance to a surplus of Kshs 57.2 bn from a surplus of Kshs 100.6 bn in Q3’2024,
The table below shows the breakdown of the various current account components on a year-on-year basis, comparing Q3’2025 and Q3’2024:
|
Item |
Q3'2024 |
Q3’2025 |
Y/Y % Change |
|
Merchandise Trade Balance |
(321.1) |
(355.8) |
10.8% |
|
Services Trade Balance |
100.6 |
57.2 |
(43.1%) |
|
Primary Income Balance |
(80.8) |
(76.5) |
(5.2%) |
|
Secondary Income (transfer) Balance |
257.7 |
239.8 |
(7.0%) |
|
Current Account Balance |
(43.5) |
(135.3) |
Kenya’s balance of payment (BoP) position improved significantly by 458.9% in Q3’2025, to a surplus of Kshs 63.7 bn, from a deficit of Kshs 17.8 bn in Q3’2024. The y/y positive performance in BoP was mainly driven by a significant 118.0% increase in capital account balance to a surplus of Kshs 3.0 bn from a surplus of Kshs 1.4 bn in Q3’2024, coupled with a 57.8% decrease in the financial account balance to a deficit of Kshs 25.7 bn from a deficit of Kshs 60.9 bn. Looking ahead, Kenya’s external position will mainly rely on the sustainability of services exports and the direction of capital flows. While the strong performance in the services trade, likely supported by tourism, transport and ICT, offers a stabilizing buffer to the current account, the widening merchandise trade deficit continues to underscore structural import dependence and vulnerability to global commodity price movements. More critically, the sharp reversal in the financial account highlights growing sensitivity to global liquidity conditions, investor risk appetite and domestic policy credibility. Going forward, a recovery in foreign capital inflows, particularly long-term FDI, alongside prudent external debt management, will be key to strengthening the financial account and supporting overall Balance of payments stability. Despite, the narrowing of the goods trade deficit, Kenya’s balance of payments position may remain under pressure despite gains in the services sector.
For a more detailed analysis read our Q3’2025 Balance of Payments Note
-
Stanbic Bank’s November 2025 Purchasing Manager’s Index (PMI)
During the week, Stanbic Bank released its monthly Purchasing Manager’s Index (PMI), highlighting that the index for the month of December 2025 remained in expansion territory, coming in at 53.7, albeit lower than 55.0 recorded in November 2025, marking the fourth consecutive month the index remained above the 50.0 neutral mark, signaling a sustained improvement in business conditions, mainly attributable to continued growth in output and new orders. On a year-to-year basis, the index recorded a 6.1% growth from the 50.6 recorded in December 2024, indicating a significant improvement in business conditions compared to the same period last year. The improvement was largely driven by a solid expansion in output and sales volumes, as firms benefited from robust demand conditions, improved tourism activity, increased advertising and competitive pricing strategies. Input prices rose at a faster pace in December, reaccelerating from November’s 18-month low, despite improved supply chain efficiency, while output charges increased modestly, recording the strongest rise since July, as firms sought to maintain competitiveness and support sales.
In December, business output continued to expand, marking another month of growth as firms reported rising order book volumes toward the end of the year. Firms reported strong demand conditions, with all main sectors monitored by the survey including manufacturing, services, wholesale & retail, construction, and agriculture recording an upturn in activity. New business intakes remained strong in December, attributed to robust customer demand, improved tourism activity, increased advertising, and favorable year-end trading conditions, while some businesses also reported gains from new client acquisitions. Increased purchasing activity, inventory accumulation, and broad-based sectoral expansion helped reinforce the overall upturn.
Employment levels strengthened in December, with firms increasing staffing levels to expand capacity and meet both current workloads and anticipated future orders. This followed November’s strong expansion in activity, with job creation accelerating to the fastest pace since November 2019, reflecting improved business confidence and sustained demand conditions.
Purchasing activity increased in December, as firms raised input procurement to meet rising demand and build stocks in anticipation of future growth. Consequently, inventories expanded further as businesses sought to secure market positions and facilitate faster deliveries. Supplier delivery times shortened markedly during December, recording the greatest improvement over four years, attributable to improved supply chain performance and increased competition among vendors. Input prices rose at a solid pace, reaccelerating from November’s 18-month low, mainly driven by higher tax-related costs, fuel prices, and material prices. Output prices increased modestly as well, marking the strongest rise since July, although several firms continued to offer competitive pricing to attract customers, keeping overall pricing pressures contained. The chart shows Kenya's Purchasing Manager's Index for the Last 24 Months:
Going forward, we anticipate that the business environment will remain supportive in the short to medium term, underpinned by strengthening demand conditions, improved supply chain performance, and a more accommodative monetary policy stance by the Central Bank of Kenya (CBK), following the Monetary Policy Committee’s (MPC) decision to lower the Central Bank Rate (CBR) by 25.0 bps to 9.0% in December from 9.25% in October 2025. However, elevated taxation, rising input costs, and subdued consumer purchasing power are expected to weigh on business profitability and overall growth. Overall, the private sector is expected to sustain its recovery momentum, albeit with potential headwinds in the coming months.
Rates in the Fixed Income market have been on a downward trend due to high liquidity in the money market which allowed the government to front load most of its borrowing. The government is 101.0% ahead of its prorated net domestic borrowing target of Kshs 340.0 bn, having a net borrowing position of Kshs 683.3 bn (inclusive of T-bills). However, we expect a stabilization of the yield curve in the short and medium term, with the government looking to increase its external borrowing to maintain the fiscal surplus, hence alleviating pressure in the domestic market. As such, we expect the yield curve to stabilize in the short to medium-term and hence investors are expected to shift towards the long-term papers to lock in the high returns
Market Performance
During the week, the equities market was on an upward trajectory, with NSE 20, NSE 25 and NSE 10 and NASI gaining by 3.0%, 2.5%, 2.4%, 2.4% taking the YTD performance to gains of 3.0%, 2.5%, 2.4% and 2.4% of NSE 20, NSE 25, NSE 10 and NASI respectively. The equities market performance was mainly driven by gains recorded by large cap stocks such as Cooperative Bank, NCBA and Equity of 8.6%, 4.7% and 3.7% respectively. However, the performance was weighed down by losses recorded by large cap stocks such as EABL of 4.4%.
Also, during the week, the banking sector index gained by 3.6% to 211.7 from 204.4 recorded the previous week. This is attributable to gains recorded by stocks such as Cooperative Bank, NCBA and Equity of 8.6%, 4.7% and 3.7% respectively.
During the week, equities turnover increased by 230.7% to USD 27.1 mn from USD 8.2 mn recorded the previous week, taking the YTD total turnover to USD 27.9 mn. Foreign investors remained net buyers for the second consecutive week with a net buying position of USD 0.5 mn, from a net buying position of USD 0.1 mn recorded the previous week, taking the YTD foreign net buying position to USD 0.5 mn, compared to a net selling position of USD 92.9 mn recorded in 2025.
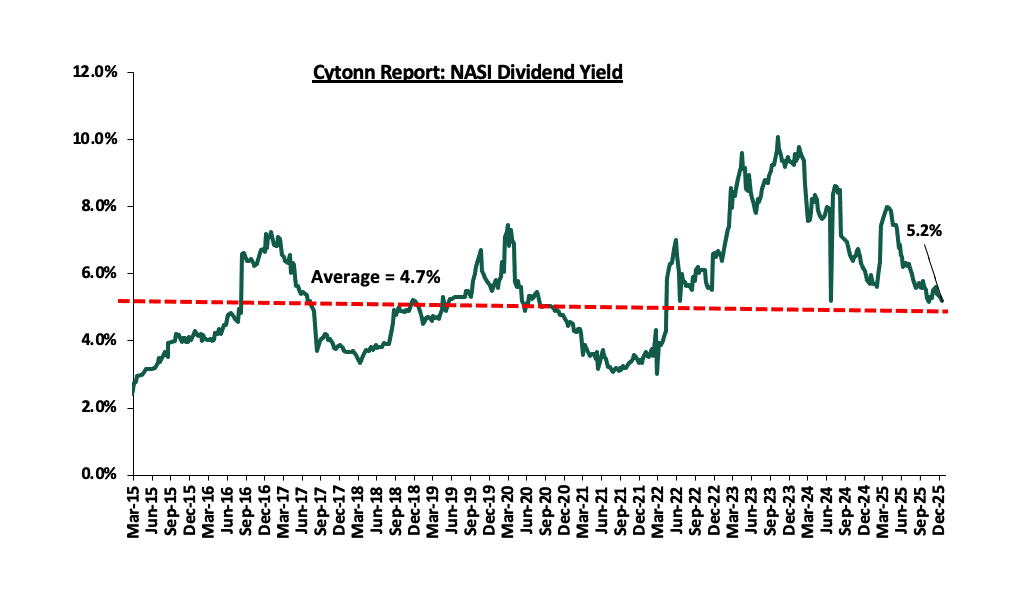
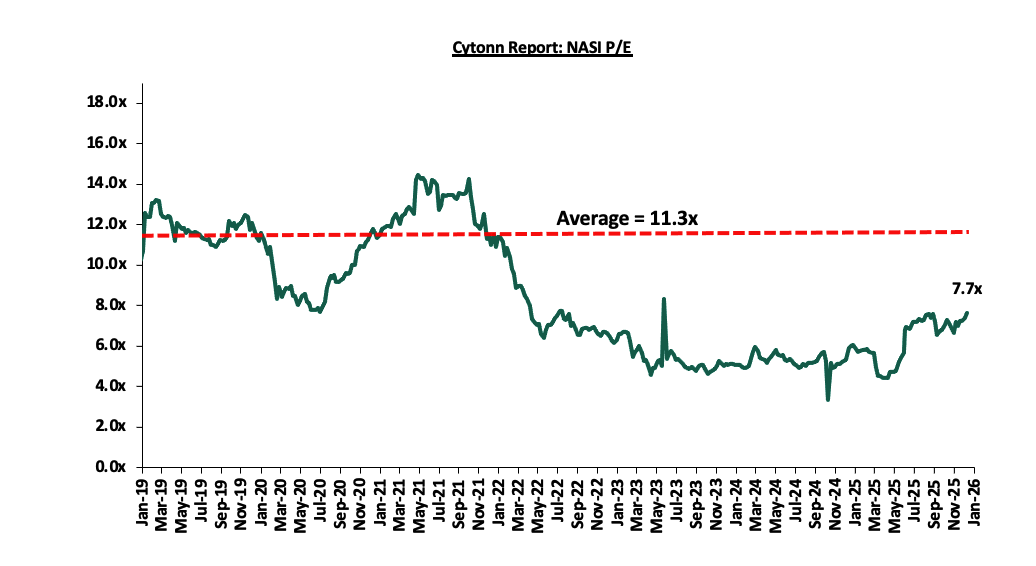
The market is currently trading at a price to earnings ratio (P/E) of 7.7x, 32.3% below the historical average of 11.3x. The dividend yield stands at 5.2%, 0.5% points above the historical average of 4.7%. Key to note, NASI’s PEG ratio currently stands at 1.0x, an indication that the market is fairly valued relative to its future growth. A PEG ratio greater than 1.0x indicates the market may be overvalued while a PEG ratio less than 1.0x indicates that the market is undervalued.
The charts below indicate the historical P/E and dividend yields of the market;
Universe of Coverage:
|
Cytonn Report: Equities Universe of Coverage |
|||||||||||
|
Company |
Price as at 2/1/2026 |
Price as at 9/1/2026 |
w/w change |
YTD Change |
Year Open 2026 |
Target Price* |
Dividend Yield |
Upside/ Downside** |
P/TBv Multiple |
Recommendation |
|
|
I&M Group |
42.8 |
44.9 |
4.9% |
4.9% |
42.8 |
53.1 |
6.7% |
24.9% |
0.8x |
Buy |
|
|
NCBA |
85.0 |
89.0 |
4.7% |
4.7% |
85.0 |
101.3 |
6.2% |
20.0% |
1.4x |
Buy |
|
|
ABSA Bank |
24.9 |
25.6 |
2.8% |
2.8% |
24.9 |
28.3 |
6.8% |
17.6% |
1.7x |
Accumulate |
|
|
Diamond Trust Bank |
114.8 |
116.5 |
1.5% |
1.5% |
114.8 |
129.4 |
6.0% |
17.1% |
0.4x |
Accumulate |
|
|
Standard Chartered Bank |
299.8 |
305.8 |
2.0% |
2.0% |
299.8 |
307.9 |
14.7% |
15.4% |
1.7x |
Accumulate |
|
|
Stanbic Holdings |
197.8 |
197.8 |
0.0% |
0.0% |
197.8 |
205.5 |
10.5% |
14.4% |
1.2x |
Accumulate |
|
|
Equity Group |
67.0 |
69.5 |
3.7% |
3.7% |
67.0 |
75.2 |
6.1% |
14.3% |
1.2x |
Accumulate |
|
|
Co-op Bank |
23.9 |
26.0 |
8.6% |
8.6% |
23.9 |
26.8 |
5.8% |
9.0% |
0.9x |
Hold |
|
|
CIC Group |
4.5 |
4.6 |
0.4% |
0.4% |
4.5 |
4.8 |
2.9% |
7.0% |
1.2x |
Hold |
|
|
Britam |
9.1 |
9.2 |
2.0% |
2.0% |
9.1 |
9.5 |
0.0% |
3.0% |
0.9x |
Lighten |
|
|
KCB Group |
65.8 |
67.0 |
1.9% |
1.9% |
65.8 |
65.8 |
4.5% |
2.7% |
0.8x |
Lighten |
|
|
Jubilee Holdings |
322.5 |
345.8 |
7.2% |
7.2% |
322.5 |
333.5 |
3.9% |
0.4% |
0.5x |
Lighten |
|
|
*Target Price as per Cytonn Analyst estimates **Upside/ (Downside) is adjusted for Dividend Yield ***Dividend Yield is calculated using FY’2024 Dividends |
|||||||||||
We are “Bullish” on the Equities markets in the short term due to current attractive valuations, lower yields on short-term government papers and expected global and local economic recovery, and, “Neutral” in the long term due to persistent foreign investor outflows. With the market currently trading at par to its future growth (PEG Ratio at 1.0x), we believe that investors should reposition towards value stocks with strong earnings growth and that are trading at discounts to their intrinsic value. We expect the current high foreign investors sell-offs to continue weighing down the economic outlook in the short term.
-
GDP report Q3’2025
During the week, the Kenya National Bureau of Statistics (KNBS) released the Quarterly Gross Domestic Product Report that outlined the performance of various sectors to the GDP and below are the key take-outs related to the Real Estate sector:
-
Steady growth in the Real Estate Sector - The Real Estate sector posted steady growth of 5.7% in Q3’2025, which is 0.9% points faster than the 4.8% growth registered in Q3’2024. The steady growth can be attributable to an increasing demand for housing in the country. On a quarter-on-quarter basis, this represented 0.2% points increase from the 5.5% growth recorded in Q2’2025. The increase in performance can be attributable to; i) Eased interest rates, following CBK’S decision to lower the CBR by 25.0 bps to 9.5% from 9.75% in August 2025. This has enabled increased access to credit and lower rates which has spurred demand in the property market, ii) Improved strength in the Kenyan Shilling, which improved against the US Dollar by 0.2% in Q3’2025. This will help in reducing the expected importation costs and construction costs for materials such as furniture, fixtures and fittings, iii) Favourable government and policy interventions. Continued rollout of affordable housing projects under the current government (BETA) has fostered increased demand for residential units and construction related services.
The graph below shows the Real Estate sector contribution to GDP from Q1’2022 to Q3’2025.
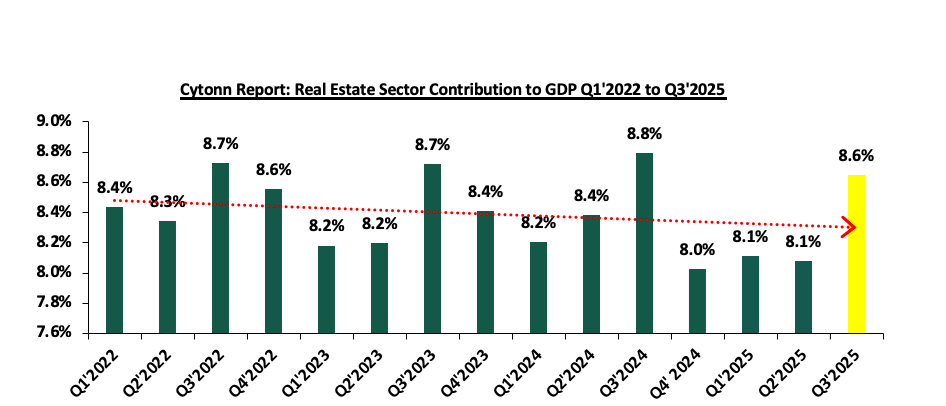
Source: Kenya bureau of statistics (KNBS)
The graph below shows the Real Estate Sector growth rate from Q1’2022 to Q3’2025:
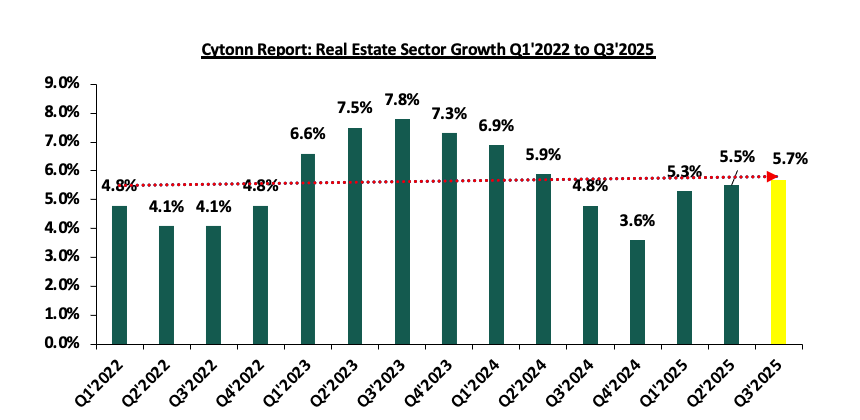
Source: Kenya bureau of statistics (KNBS)
-
Continued growth in the construction sector - The construction sector grew by 6.7% in Q3’2025, which is 9.3% points higher than the (2.6%) growth in Q3’2024. On a quarter-on-quarter basis, this performance represented a 1.0%-point increase from the 5.7% increase recorded in Q2’2025 largely driven by (i) Government’s continued Focus on Affordable Housing: the Kenyan government has sustained its strong commitment to the Affordable Housing Program (AHP), a key pillar under the Bottom-Up Economic Transformation Agenda (BETA). (ii) Infrastructural development: Kenya sustained momentum in infrastructure development, with focus shifting to ongoing government and public-private partnership (PPP) projects aimed at improving connectivity and supporting construction activity and, (iii)Provision of affordable mortgage financing: Kenya Mortgage Refinance Company (KMRC) has continued to play a critical role in expanding access to affordable housing finance by offering single-digit fixed-rate, long-term refinancing to Primary Mortgage Lenders (PMLs) such as banks, SACCOs, and microfinance institutions. The graph below shows the Construction sector growth rates from Q1’2022 to Q3’2025;
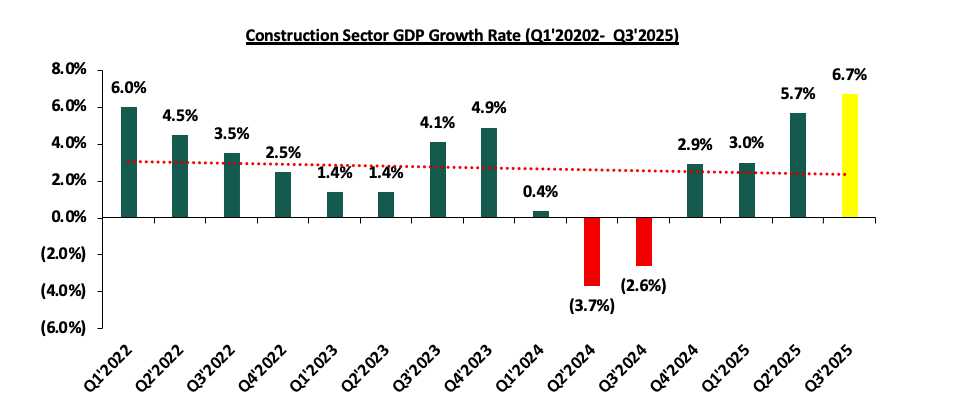
Source: Kenya bureau of statistics (KNBS)
-
Sustained recovery in accommodation and restaurant sector –The accommodation and restaurant services sector grew by 17.7% in Q3’2025, representing a 5.2% points y/y decline from the 22.9% growth recorded in Q3’2024. On a q/q basis, the performance reflected a 9.9% increase from the 7.8% growth registered in Q2’2025. The slowed growth compared to 2024 is mainly attributable to economic deceleration, high operational costs and constrained consumer spending arising from increased taxation and elevated living costs. Nevertheless, the sector continues to recover steadily from the impacts of COVID-19, with the lifting of travel restrictions remaining a key driver of activity within the wider real estate and tourism industries. The graph below shows the accommodation and restaurant sector contribution to GDP growth rates from Q1’2022 to Q3’2025;
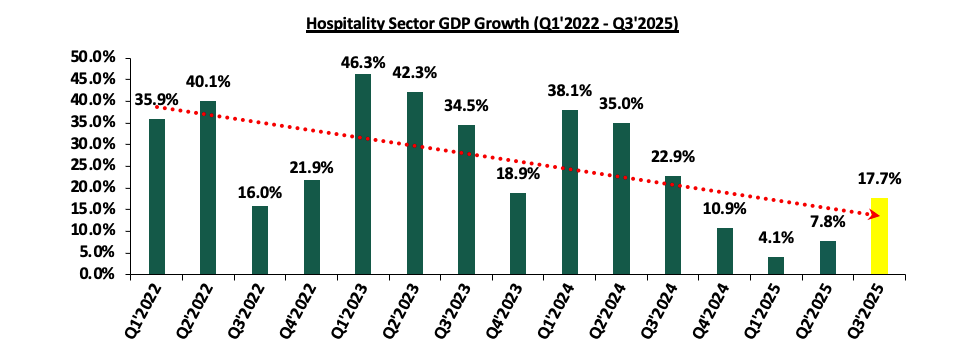
Source: Kenya bureau of statistics (KNBS)
-
November Leading Economic Indicators (LEI)
During the week, the Kenya National Bureau of Statistics (KNBS) released the Leading Economic Indicators (LEI) November 2025 Report, which highlighted the performance of major economic indicators. Key highlights related to the Real Estate sector include:
-
In November 2025, cement consumption reached 960,182 metric tonnes, representing a 20.0% y/y increase from the same month in 2024. Month-on-month, consumption decreased by 1.1%, reflecting a decline in momentum in the construction sector. The y/y performance was anchored by (i) continued private sector construction activity in urban hubs such as Nairobi, Mombasa, and Kisumu, (ii) government-led infrastructure investments under the Bottom-Up Economic Transformation Agenda (BETA), including roads, affordable housing, water, and sanitation projects, and (iii) public works initiatives in rural and semi-urban areas, which both support livelihoods and expand critical infrastructure.
The chart below shows cement consumption in metric tonnes in Kenya between Q1’2023 and November 2025:
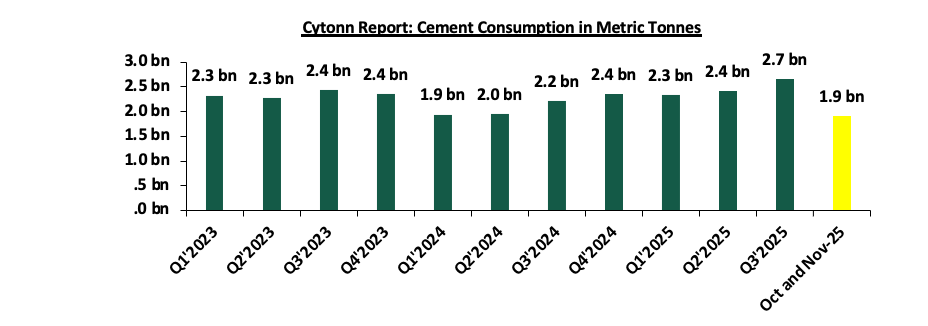
Source: Kenya National Bureau of Statistics (KNBS)
-
In November 2025, the value of building plans approved in Nairobi City County was Ksh 5.5 bn, representing a 44.6% decrease on a year-on-year basis from Ksh 9.9 bn in November 2024 and 61.5% decline compared to October 2025. The performance reflects (i) reduced investor confidence in the real estate sector following the increase in construction costs (ii) constrained funding
The chart below shows the building plans approved in billions in Kenya between Q1’2023 and November 2025.
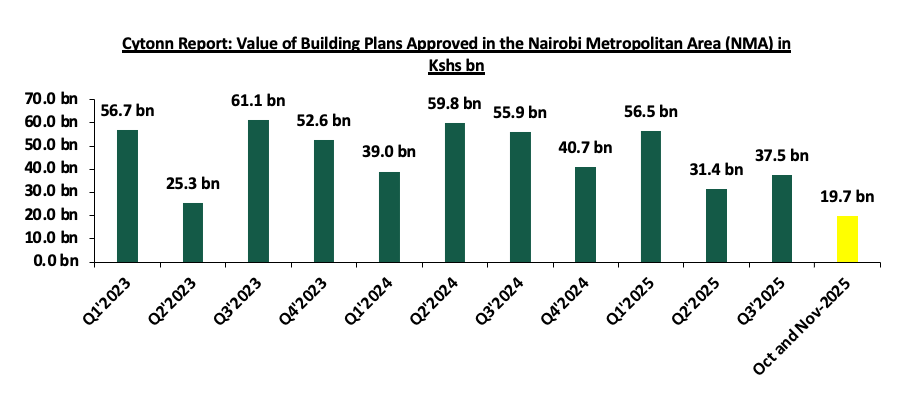
Source: Kenya National Bureau of Statistics (KNBS)
-
Office Sector
-
Kofisi closes two Nairobi co-working spaces
During the week, co-working space provider Kofisi closed two of its Nairobi locations, Karen and Upper Hill, following a Kshs 416.7 mn (USD 3.2 mn) loss in 2024, reversing a profit of Kshs 2.3 bn (USD 16.3 mn) in 2023. The London-based company aims to focus on larger, higher-capacity sites to enhance client experience through community spaces, better services, and economies of scale. Despite the loss, Kofisi’s revenues rose 24.5% to Kshs. 1.4 bn (USD 10.3 mn) in 2024, supported by high occupancy rates averaging above 90% across its offices. Kenya remains Kofisi’s largest market in Africa, accounting for Kshs 1.0 bn (USD 7.6 mn) or 74.4% of its 2024 revenue.
Kofisi’s closure of two Nairobi co-working spaces highlights a growing trend in the office real estate sector toward larger, more flexible, and high-capacity workspaces. This shift may reduce demand for smaller office leases, prompting landlords to adapt by offering more flexible, serviced, or shared office solutions to remain competitive. It could also lead to consolidation of office space in prime locations, driving up rental demand and prices in high-occupancy areas, while older or smaller office buildings may face higher vacancy rates.
Going forward we expect the commercial office sector to experience selective growth and consolidation, with demand increasingly skewed toward prime, high-capacity, and flexible office spaces rather than smaller standalone offices. Operators and occupiers are prioritizing efficiency and enhanced workplace experiences, favouring well-located buildings that can support serviced offices, co-working models, and shared amenities. As a result, Grade A offices in prime nodes are expected to remain resilient, supported by strong occupancy and stable rents, while older or smaller buildings may face prolonged vacancies and downward pressure on pricing unless repositioned or refurbished. Overall, the sector’s outlook points to a more adaptive, tenant-driven market, where flexibility, quality, and economies of scale will be key determinants of performance.
-
Hospitality Sector
Smartwings Airlines begun direct charter flights from Budapest, Hungary, to Mombasa, Kenya, reflecting growing interest in Kenya’s coastal tourism from Eastern Europe. The inaugural flight, carrying 183 passengers, was welcomed on 29th December 2025 highlighting Kenya’s effort to boost tourism. The Hungary-Mombasa route operates through a partnership with tour companies Private Safaris and iBUSZ, targeting travelers seeking beach holidays and wildlife experiences. While arrivals from Eastern Europe remain lower than from Western Europe, this new route indicates potential growth in regional tourism.
The direct flights are likely to increase demand for hotels, resorts, and other accommodation facilities in Mombasa and nearby coastal areas. Hospitality providers may see higher occupancy rates, especially during peak seasons, prompting potential expansions or upgrades in services to cater to international tourists. Increased visitor numbers could also stimulate the broader local economy, including restaurants, tour operators, and leisure facilities, encouraging more investments in the hospitality and tourism infrastructure.
Looking ahead, we expect the hospitality and tourism sector along Kenya’s coast to record gradual but sustained growth, supported by improved air connectivity and diversification of source markets. The introduction of direct charter flights from Eastern Europe signals rising international interest in Mombasa as a leisure destination, which should bolster hotel occupancies, particularly in resort and beach properties. Over time, consistent inflows from new markets may encourage hotel refurbishments, capacity expansions, and new developments, especially in prime coastal locations. More broadly, increased tourist arrivals are likely to strengthen auxiliary services such as tour operations, food and beverage, and entertainment, reinforcing the coast’s role as a key driver of Kenya’s tourism-led economic growth.
-
Real Estate Investments Trusts
-
REITS Weekly Performance
On the Unquoted Securities Platform, Acorn D-REIT and I-REIT traded at Kshs 27.4 and Kshs 23.2 per unit, respectively, as per the last updated data on 5th December 2025. The performance represented a 33.4% and 14.5% gain for the D-REIT and I-REIT, respectively, from the Kshs 20.0 inception price. The volumes traded for the D-REIT and I-REIT came in at 12.8 mn and 41.2 mn shares, respectively, with a turnover of Kshs 323.5 mn and Kshs 791.5 mn, respectively, since inception in February 2021. Additionally, ILAM Fahari I-REIT traded at Kshs 11.0 per share as of 5th December 2025, representing a 45.0% loss from the Kshs 20.0 inception price. The volume traded to date came in at 1.2 mn shares for the I-REIT, with a turnover of Kshs 1.5 mn since inception in November 2015.
REITs offer various benefits, such as tax exemptions, diversified portfolios, and stable long-term profits. However, the ongoing decline in the performance of Kenyan REITs and the restructuring of their business portfolios are hindering significant previous investments. Additional general challenges include:
-
Insufficient understanding of the investment instrument among investors leading to a slower uptake of REIT products,
-
Lengthy approval processes for REIT creation,
-
High minimum capital requirements of Kshs 100.0 mn for REIT trustees compared to Kshs 10.0 mn for pension funds Trustees, essentially limiting the licensed REIT Trustee to banks only
-
The rigidity of choice between either a D-REIT or and I-REIT forces managers to form two REITs, rather than having one Hybrid REIT that can allocate between development and income earning properties
-
Limiting the type of legal entity that can form a REIT to only a trust company, as opposed to allowing other entities such as partnerships, and companies,
-
We need to give time before REITS are required to list – they would be allowed to stay private for a few years before the requirement to list given that not all companies maybe comfortable with listing on day one, and,
-
Minimum subscription amounts or offer parcels set at Kshs 0.1 mn for D-REITs and Kshs 5.0 mn for restricted I-REITs. The significant capital requirements still make REITs relatively inaccessible to smaller retail investors compared to other investment vehicles like unit trusts or government bonds, all of which continue to limit the performance of Kenyan REITs.
We expect the performance of Kenya’s Real Estate sector to remain resilient, supported by several factors: i) Smartwings Airlines launching of the Budapest - Mombasa flights. However, challenges such as weak investor appetite in listed REITs like ILAM Fahari I-REIT and high capital requirements will continue to constrain the sector’s optimal performance.
Kenya has become a leading fintech hub in Africa, driven by innovations like M-PESA that transformed mobile money and financial inclusion. While fintech has revolutionized payments and lending, its integration into capital markets is still evolving, with mobile investment platforms, digital bonds, and automated advisory services beginning to bridge the gap.
Having previously covered Fintech Amid COVID-19, Technology & Investments and Fintech Impact on Kenya’s Financial Services Industry, we now explore fintech’s role in Kenya’s capital markets. This discussion is structured into the following sections:
-
Introduction
-
Overview of Fintech, Capital Markets, and Regulatory Frameworks
-
Key Fintech Innovations and Market Integration
-
Case Studies
-
Opportunities and Risks
-
Outlook and Conclusion
Section I: Introduction
Kenya’s financial services sector has undergone a profound transformation over the past two decades, establishing the country as one of Africa’s leading fintech hub. This evolution began with the launch of M-pesa in 2007 and has since expanded into digital lending, insurtech, blockchain applications, and, increasingly, capital markets integration, demonstrating how technology can leapfrog traditional financial infrastructure to deliver broad-based access. In parallel, Kenya’s capital markets, anchored by the Nairobi Securities Exchange established in 1954, have modernized but continue to face structural challenges, including shallow liquidity, limited retail participation, and concentrated institutional ownership. Integrating fintech into capital markets is therefore critical for mobilizing long-term savings, expanding investor participation, and channeling capital to productive investments. Leveraging tools such as fractional investing, automated advisory services, and digital settlement systems could transform Kenya’s 89.1 mn mobile money accounts as of November 2025 from transactional participants into long-term investors. With a digitally savvy population and a relatively progressive regulatory environment, Kenya is well positioned to seize this opportunity, provided regulatory coordination, cybersecurity resilience, and consumer protection are effectively addressed.
Section II: Overview of Fintech, Capital Markets, and Regulatory Frameworks in Kenya
a)Defining the Landscape
Fintech encompasses technology-enabled innovation in financial services delivery, ranging from payment systems and digital lending to sophisticated capital markets infrastructure. In Kenya's context, fintech has evolved from simple mobile money transfers to complex ecosystems incorporating artificial intelligence, blockchain, application programming interfaces, and advanced data analytics. Capital markets, meanwhile, comprise platforms for issuing and trading securities including equities, bonds, derivatives, and collective investment schemes, alongside the regulatory and institutional infrastructure supporting these activities.
b) Kenya's Fintech Ecosystem: Maturity and Breadth
Kenya's fintech landscape stands as Africa's most developed, characterized by high penetration, diverse offerings, and increasing sophistication. Mobile money remains the cornerstone, with 89.1 mn accounts as of November 2025 according to Central Bank of Kenya data. Transaction values reached Kshs 7.5 tn by November 2025, demonstrating the sheer scale of digital financial flows. M-Pesa dominates with 90.8% market share, but competition has intensified with Airtel Money, T-Kash, and bank-led solutions expanding their presence.
Digital lending has proliferated dramatically, with over 126 licensed digital credit providers operating as of June 2025. These platforms leverage alternative data sources, including mobile money transaction histories, social media profiles, and smartphone usage patterns, to assess creditworthiness and disburse loans within minutes.
API-enabled financial services represent the next frontier, with Kenya's banking sector increasingly opening its infrastructure to third-party developers.
c) Structure and Performance of Kenyan Capital Markets
Kenya's capital markets comprise the Nairobi Securities Exchange for equity and bond trading; a government securities market managed by the Central Bank; collective investment schemes supervised by the Capital Markets Authority; and pension funds regulated by the Retirement Benefits Authority. The NSE lists 61 companies across various sectors, with market capitalization of 3.0 tn as of 9th January 2026. Trading activity remains thin, with total turnover of USD 1.1 bn in 2025, equivalent to an average daily turnover of approximately USD 4.4 mn, and concentrated in a handful of blue-chip counters. The bond market shows a similar pattern of government dominance and institutional concentration. Treasury bonds total turnover came in at Kshs 2.1 tn as of September 2025, accounting for 99.99% of the total bond market. Corporate bonds and commercial paper remain underdeveloped, with only 12 active corporate bond listings. The table below shows key bond market performance indicators from 2010 to September 2025
|
Cytonn Report: Key Bond Market Performance Indicators: 2010- September 2025 |
|||||
|
Year |
Treasury Bond Turnover (Kshs Bn) |
Corporate Bond Turnover (Kshs. Bn) |
Total Bond Turnover (Kshs Bn) |
Corporate Bond Turnover as a % of Total Bond Turnover |
Treasury Bond Turnover as a % of Total Bond Turnover |
|
2010 |
466.9 |
12.5 |
479.4 |
2.6% |
97.4% |
|
2011 |
437.1 |
8.5 |
445.7 |
1.9% |
98.1% |
|
2012 |
563.8 |
1.9 |
565.7 |
0.3% |
99.7% |
|
2013 |
451.6 |
0.9 |
452.5 |
0.2% |
99.8% |
|
2014 |
504.3 |
2.0 |
506.5 |
0.4% |
99.6% |
|
2015 |
302.1 |
3.0 |
305.1 |
1.0% |
99.0% |
|
2016 |
431.9 |
1.6 |
433.5 |
0.4% |
99.6% |
|
2017 |
432.8 |
3.1 |
435.9 |
0.7% |
99.3% |
|
2018 |
556.6 |
1.2 |
557.7 |
0.2% |
99.8% |
|
2019 |
651.4 |
3.7 |
655.1 |
0.6% |
99.4% |
|
2020 |
690.7 |
1.2 |
691.9 |
0.2% |
99.8% |
|
2021 |
956.1 |
0.9 |
957.0 |
0.1% |
99.9% |
|
2022 |
741.5 |
0.3 |
741.8 |
0.0% |
100.0% |
|
2023 |
643.8 |
0.2 |
644.0 |
0.0% |
100.0% |
|
2024 |
1544.4 |
0 |
1544.4 |
0.0% |
100.0% |
|
2025* |
2075.3 |
0.6 |
2075.9 |
0.0% |
100.0% |
Source: NSE/CMA, 2025* data as of September 2025
Collective investment schemes, commonly known as unit trusts, have grown steadily but remain small relative to the economy's size. Total assets under management across 55 approved collective investment schemes reached Kshs 679.6 bn by Q3’2025, up from Kshs 316.4 bn in Q3’2024. Money market funds constitute the largest category at 58.9% of assets.
Price-to-earnings ratios on the NSE averaged 11.3x, significantly below regional peers like Nigeria at 16.6x and Mauritius at 18.1x, suggesting undervaluation or limited growth expectations. Settlement cycles, while improved from the previous T+4 to T+3 in 2011, still lag global best practice of T+2 or even T+1. These inefficiencies impose costs that deter participation, particularly from retail investors for whom transaction costs represent a higher proportion of investment value.
-
Regulatory Architecture and Coordination
Kenya's financial sector regulation involves multiple agencies with overlapping yet distinct mandates, requiring coordination to enable fintech-capital markets integration effectively.
-
The Central Bank of Kenya regulates banks, non-bank financial institutions, payment systems, and foreign exchange markets. Its mandate has expanded to encompass digital lenders, mobile money operators, and payment service providers. The CBK's regulatory approach has evolved from restrictive to increasingly enabling, with initiatives including regulatory sandboxes, open banking frameworks, and innovation hubs designed to balance innovation with financial stability.
-
The Capital Markets Authority oversees securities markets, collective investment schemes, securities exchanges, and capital markets intermediaries including brokers, dealers, and fund managers. The CMA's Strategic Plan 2023-2028 identifies three strategic objectives directly relevant to fintech integration: deepening and widening the capital markets; enhancing market efficiency, integrity, and transparency; and strengthening institutional capacity and stakeholder engagement. Specific initiatives include developing digital distribution channels, promoting retail investor participation through technology, and modernizing market infrastructure to support real-time trading and settlement.
-
The Retirement Benefits Authority regulates pension schemes and custodians. Given pension funds' role as Kenya's largest institutional investors, RBA's policies significantly influence capital markets liquidity and product development. The authority has progressively liberalized investment guidelines, allowing exposure to alternative assets, regional markets, and innovative financial products, while maintaining prudential limits to protect members' interests.
-
Regulatory Sandboxes and Innovation Enablers
Kenya has embraced regulatory sandboxes as mechanisms to test innovations in controlled environments before full-scale deployment. CMA launched its Regulatory Sandbox Framework in 2019, enabling fintech firms to test products with real customers under relaxed regulatory requirements while maintaining consumer protection safeguards. These sandboxes serve multiple purposes: they provide regulators with practical insights into emerging technologies and business models; they offer innovators regulatory clarity and temporary relief from compliance requirements that may not fit new models; and they create safe spaces for experimentation that could fail without systemic consequences. Importantly, sandbox participation doesn't guarantee eventual licensing, maintaining regulatory discretion while encouraging innovation.
-
Data Governance and Protection
The Data Protection Act 2019 established Kenya's comprehensive framework for personal data processing, creating rights for data subjects and obligations for data controllers and processors. For fintech-capital markets integration, data governance is critical yet complex. Investment platforms require extensive personal and financial data for onboarding, suitability assessments, and regulatory compliance, while simultaneously leveraging alternative data for credit assessment and personalization. Balancing data utility with privacy protection requires robust consent mechanisms, data minimization practices, strong cybersecurity controls, and transparent disclosure of data usage.
The Office of the Data Protection Commissioner has issued guidelines specific to financial services, requiring firms to conduct data protection impact assessments, implement technical safeguards including encryption and access controls, and establish procedures for data breach notification. For cross-border data transfers, particularly relevant as Kenyan fintechs expand regionally, adequacy assessments determine whether recipient jurisdictions provide equivalent protection. These requirements add compliance costs but are essential for maintaining trust in digital financial services.
- Licensing Models and Market Entry
Kenya’s capital markets licensing regime requires all firms carrying out regulated activities, including stockbrokers, dealers, investment banks, fund managers, authorized securities dealers, trustees, and other intermediaries to hold a valid license issued by the Capital Markets Authority (CMA) under the Capital Markets Act, ensuring they meet prescribed fit-and-proper, capital, and operational capacity standards before conducting business. Under Section 29 of the Act, the CMA must be satisfied that a prospective licensee is a legally constituted entity with the minimum share capital and qualifications prescribed, has sufficient administrative capacity to carry on the business, and, for trading participants, has lodged the required security or guarantee with the relevant securities exchange or approved entity.
Section III: Key Fintech Innovations and Integration with Kenyan Capital Markets
The integration of fintech into capital markets represents Kenya's most significant financial sector evolution since mobile money's introduction, with profound implications for access, efficiency, and market structure.
-
Mobile Platform Integration
Mobile platforms constitute the most significant channel for capital markets democratization in Kenya, leveraging the country's high adult mobile money penetration. The integration journey began tentatively with M-Akiba in 2015, but has accelerated dramatically since 2022 with multiple players recognizing mobile money networks as essential distribution infrastructure for investment products.
Safaricom's evolution from pure telecommunications and mobile money provider to financial services ecosystem illustrates this transformation. By 2026, Safaricom has partnered with multiple licensed fund managers to integrate investment products directly into the M-pesa super-app, enabling customers to purchase unit trust holdings, government bonds, and money market funds without leaving the familiar M-pesa interface. The user experience transformation is instructive. Previously, investing in capital markets required opening a Central Depository System account, completing extensive paperwork with a broker or fund manager, funding an account through bank transfers, and monitoring investments through separate platforms. The integrated mobile approach collapses these steps into a unified flow: customers complete digital KYC using existing M-Pesa verification; they fund investments instantly from mobile money wallets; they monitor holdings within the app they already use daily; and they can liquidate investments with proceeds returning to mobile wallets within hours for money market funds or days for other securities.
-
Fractional Investing and Micro-Investment Platforms
Fractional investing represents a significant restructuring of access to equity markets by enabling participation with small monetary amounts that were historically impractical under traditional brokerage models. In Kenya, earlier market conventions required investors to trade in board lots, which raised effective entry thresholds despite relatively low headline share prices. However, following recent market reforms, the Nairobi Securities Exchange now permits single-share trading, allowing investors to purchase as little as one share of a listed company. While this reform materially lowers the formal entry barrier, practical constraints remain, as transaction costs, brokerage fees, and investor behavior still limit the viability of very small trades through traditional channels.
Digital investment platforms extend the impact of single-share trading by enabling monetary-based investing, where users specify investment amounts rather than share quantities. Through order aggregation and omnibus custody structures, these platforms allow investors to acquire fractional economic exposure to equities with amounts as low as Kshs 100, even where one full share may still represent a relatively large commitment. Shares are held in omnibus accounts at the Central Depository and Settlement Corporation, with beneficial ownership recorded proportionally on platform systems. Investment behavior on fractional platforms differs markedly from traditional brokerage patterns. Rather than infrequent, lump-sum allocations, users typically make smaller, regular investments, effectively applying dollar-cost averaging strategies. The following table presents a breakdown of NSE investor numbers as of September 2025
|
Cytonn Report: NSE Equity Investor Numbers |
|||
|
Account Type |
Category of investor |
Q2’2025 |
Q3'2025 |
|
EACI |
East African Corporate |
267 |
265 |
|
EAII |
East African Individuals |
7,137 |
265 |
|
JR |
Junior Investors |
198 |
7,141 |
|
BR |
Brokers |
6 |
6 |
|
FCI |
Foreign Corporate Investors |
381 |
381 |
|
FII |
Foreign Investors (Individuals) |
7,997 |
7,979 |
|
LCI |
Local Corporate Investors |
40,803 |
40,705 |
|
LII |
Local Individual Investors |
1,245,681 |
1,248,543 |
Source: CDSC
-
Blockchain and Distributed Ledger Technology Pilots
Blockchain technology has transitioned from speculative cryptocurrency discussions to practical capital markets applications in Kenya, with multiple pilots exploring distributed ledger benefits for securities issuance, trading, and settlement. The technology's core advantages include immutable record-keeping, real-time settlement, reduced intermediary requirements, and programmable compliance through smart contracts.
Tokenization of securities is gaining traction in Kenya as a practical blockchain application within capital markets. Yeshara Tokens Limited was admitted into the Capital Markets Authority’s regulatory sandbox for a one-year trial in January 2025, where it will test the trading of tokenized securities through its blockchain-powered Yeshara Platform, initially focusing on real estate assets and aiming to unlock liquidity and broaden access to financial markets for a wider range of investors. In parallel, the Nairobi Securities Exchange (NSE) joined the Hedera Governing Council to accelerate the digitization of real-world and digital assets and the tokenization of securities on its Exchange, leveraging Hedera’s secure, transparent, and scalable distributed ledger infrastructure to support future digital assets issuance and trading. NSE’s participation in the council signals its strategic commitment to launching tokenized securities and diverse digital products within a regulated ecosystem, extending beyond real estate into broader capital markets applications.
Regulatory frameworks for blockchain-based securities and digital assets in Kenya have been clarified and strengthened with the enactment of the Virtual Asset Service Providers Act, 2025 (Act No. 20 of 2025), which came into force on 4th November 2025. This law establishes a comprehensive licensing and supervisory regime for virtual asset service providers (VASPs), entities that operate trading platforms, exchanges, custodial wallets, broker services, and token issuance/management systems using distributed ledger technology, and expressly designates the Capital Markets Authority (CMA) and the Central Bank of Kenya (CBK) as relevant regulatory authorities with powers to license, regulate, supervise, and enforce compliance for activities listed in the First Schedule to the Act. Importantly, the definition of “virtual assets” under the Act includes digital representations of value that can be traded, transferred, or used for investment purposes, while excluding closed-loop tokens and fiat currency representations, ensuring that tokenized financial instruments used for investment sit clearly within the regulatory perimeter. Permissible activities under the Act include tokenization of real-world assets, issuance of tokens, operation of virtual asset exchanges, and portfolio management of virtual assets, all subject to licensing, fit-and-proper criteria, capital requirements, and ongoing prudential obligations imposed by the relevant authority.
-
Artificial Intelligence and Advanced Data Analytics
Artificial intelligence is transforming multiple dimensions of capital markets participation and operation in Kenya, from investor onboarding to trading algorithms and risk management. The technology's applications span customer-facing services, middle-office operations, and regulatory compliance.
Robo-advisory platforms represent AI's most visible application, providing automated investment advice and portfolio management at fractions of traditional wealth management costs. Robo-advisors use algorithms to assess investor risk tolerance, financial goals, and time horizons through digital questionnaires, then construct and automatically rebalance diversified portfolios of unit trusts, equities, and bonds
Credit scoring and alternative data analytics exemplify AI's behind-the-scenes impact. Digital lenders use machine learning algorithms trained on hundreds of variables from mobile money transactions, smartphone metadata, and social network data to predict default probabilities and determine creditworthiness for borrowers lacking traditional credit histories. This methodology is expanding into investment suitability assessments, where platforms analyze transaction data to infer income stability, spending patterns, and savings capacity, enabling more accurate risk profiling than traditional self-reported questionnaires.
Predictive analytics are being applied to investor behavior, enabling platforms to personalize engagement, identify churn risks, and optimize product recommendations. Platforms analyze which messages drive action, what times investors are most likely to transact, and which products match specific demographic profiles, using these insights to improve user experience and business outcomes.
-
Digital Trading and Clearing Systems
Kenya's capital markets infrastructure has undergone substantial digitization, transforming how securities are issued, traded, and settled. The journey from physical certificates and floor trading to fully electronic systems has been gradual but is now accelerating with modern technologies.
The Nairobi Securities Exchange implemented its Automated Trading System in 2006, enabling electronic order matching and eliminating floor trading. Settlement infrastructure has similarly modernized. The Central Depository and Settlement Corporation, established in 2004, operates Kenya's securities depository, eliminating physical certificates and enabling electronic book-entry settlement. The CDSC's Investor Portal, allows investors to view holdings, track corporate actions, and initiate transfers directly, reducing dependency on intermediaries. Integration with mobile money platforms enables instant funding and withdrawal, eliminating the multi-day delays previously required for bank transfers.
The shift from T+4 to T+3 settlement in 2011 reduced counter-party risk and improved capital efficiency, bringing Kenya in line with many developed markets. However, global markets are moving to T+2 or even T+1. Straight-through processing, where trades flow from execution to settlement without manual intervention, has become standard for institutional trades but remains incomplete for retail transactions. Digital platforms are closing this gap, with several now offering end-to-end digital workflows where investors can place orders, have them executed, settled, and reflected in holdings within minutes for unit trusts or hours for equities, all without human intermediaries. This automation reduces errors, cuts costs, and improves user experience.
Mobile trading applications have proliferated, with virtually all licensed brokers and fund managers now offering smartphone apps for order placement and portfolio monitoring. These apps typically feature real-time quotes, charting tools, news feeds, and one-click trading, bringing professional-grade capabilities to retail investors. Push notifications alert users to price movements, executed orders, and corporate actions, keeping them engaged with investments. The next frontier involves API-based market access, where third-party developers can integrate trading capabilities directly into their applications. For instance, a personal financial management app could allow users to invest spare change into money market funds without leaving the app, using APIs to connect to licensed fund managers.
-
Payment Integration and Instant Settlement
Seamless payment integration distinguishes successful digital investment platforms from those struggling for traction. Traditional investment funding via bank transfers required customers to log into separate banking platforms, initiate transfers with obscure reference numbers, and wait 24-48 hours for funds to reflect in investment accounts. This friction created increased abandonment rates between account opening and first investment.
Mobile money integration eliminates this friction. Platforms integrated with M-Pesa, Airtel Money, and bank mobile apps enable instant funding through familiar payment interfaces. Customers authorize payments using the PINs they use daily, and funds reflect in investment accounts within seconds. Withdrawal processes similarly leverage mobile money, with investment proceeds deposited to mobile wallets within hours for money market funds compared to 5-7 days for bank transfers.
Bank API integration is increasingly positioned as a strategic funding channel, especially for higher-value transactions. Under the CBK’s National Payments System Vision and Strategy (2021–2025), the central bank committed to fostering open banking frameworks and secure API standards that enable third-party platforms to initiate bank transfers with user consent and access customer account information in a controlled manner, reducing reliance on manual transfers. This aligns with the broader NPS goals of creating a secure, efficient, and collaborative payments ecosystem that supports innovation and choice across channels. By linking bank and investment accounts directly, API-driven transfers offer faster funding and higher transaction limits compared with traditional mobile money rails, appealing particularly to mass-affluent investors. However, despite the strategy’s emphasis on API standards and risk management frameworks for identification, authentication, consent, and transaction initiation, implementation remains uneven, with comprehensive API capabilities currently concentrated among tier-one banks as of 2025
Real-time gross settlement system integration would enable instant large-value payments for institutional and high-net-worth investors, though current RTGS access is restricted to banks and select financial institutions. Expanding RTGS access to licensed capital markets intermediaries, potentially through restricted participation tiers, could enhance liquidity and settlement efficiency.
Section IV: Case Studies
Examining specific implementations illustrates how fintech-capital markets integration is translating from concept to reality across Kenya. These case studies reveal both successes to emulate and challenges requiring ongoing attention.
Case Study 1: Mobile Money Market Funds
Mobile money market funds represent one of Kenya's most successful fintech-capital markets integrations, enabling millions of Kenyans to access institutional-grade fixed income investments through their mobile phones with unprecedented accessibility.
Structure and Evolution
Money market funds in Kenya have traditionally been investment vehicles for institutional investors and high-net-worth individuals, offering diversified exposure to short-term fixed income securities including treasury bills, commercial paper and fixed deposits. These funds provided superior returns to savings accounts, while maintaining high liquidity with redemptions processed immediately.
However, access remained restricted by minimum investment requirements of Kshs 1,000 to Kshs 10,000 depending on the fund manager, complex onboarding requiring physical branch visits and extensive documentation, and limited awareness among mass-market consumers who viewed such products as exclusively for the wealthy or financially sophisticated.
The integration with mobile money platforms transformed this landscape fundamentally. Licensed fund managers partnered with mobile money operators and digital distribution platforms to offer money market fund access directly through mobile interfaces, reducing minimums to as low as Kshs 100, eliminating physical documentation through digital KYC processes, and enabling instant funding from mobile wallets. The chart below shows the growth in Unit Trust Funds’ AUM over the last 5 years:
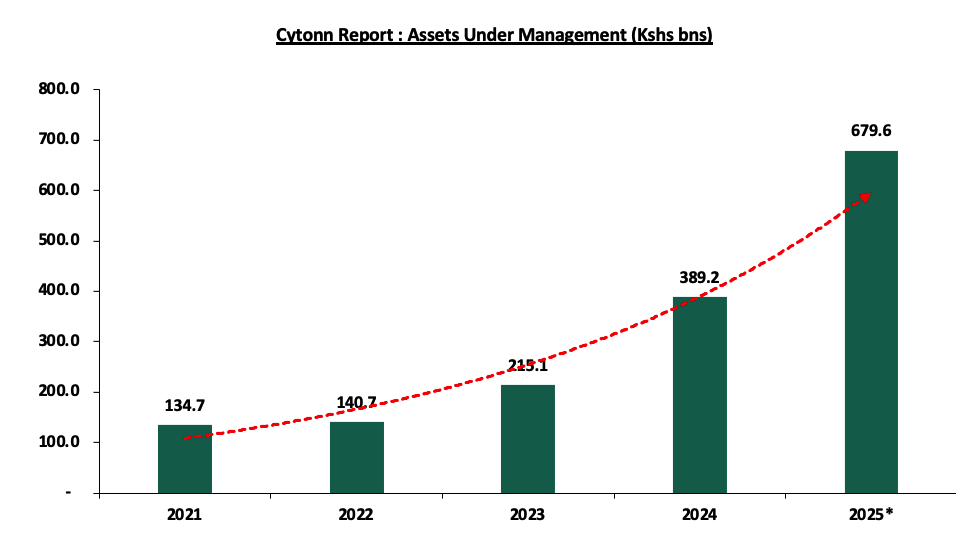
Source: CMA, 2025* Data as of 30th September
The typical mobile money market fund experience operates as follows; users download a mobile app or access services through USSD menus, complete digital onboarding using national ID verification and mobile money registration details (leveraging existing KYC from mobile network operators), select investment amounts starting from Kshs 100, and fund purchases instantly from M-Pesa, Airtel Money, or bank accounts. Investments are processed same-day or next-day depending on cut-off times, with users receiving units in their chosen money market fund. Returns accrue daily, visible through mobile interfaces showing current unit values and accumulated gains. Redemptions can be initiated through the app, with funds typically returned to mobile wallets immediately following standard fund settlement cycles.
By September 2025, Money Market Funds (MMFs) had accumulated Kshs 400.0 bn in Assets Under Management, representing 58.9% of total Unit Trust Fund AUM of Kshs 679.6 bn, according to the CMA Quarterly CIS Report Q3’2025.This reflects a 7.3% quarter-on-quarter increase from Kshs 372.8 bn in Q2’2025, underscoring the continued dominance of MMFs as Kenya’s primary retail collective investment vehicle
The rapid expansion of MMFs is closely linked to low investment minimums,high liquidity, competitive yields, and fintech-enabled distribution, particularly via mobile money platforms. The broader Unit Trust Funds industry grew 14.0% quarter on quarter to 679.6 bn in Q3’2025 from 596.3 bn in Q2’2025, with the total number of CIS investors rising 128.0% to 3.0 mn by September 2025, highlighting deepening retail participation. Fintech adoption has been a key enabler, supported by the growth in registered mobile money accounts, which increased 9.6% year on year to 87.0 mn, improving accessibility and transaction efficiency for retail investors
Product innovation within the MMF segment has increasingly focused on automation and convenience, including recurring investments and instant liquidity features, which have contributed to predictable inflows and sustained asset growth. However, these features introduce liquidity management challenges, as MMFs offer near-instant withdrawals while underlying instruments settle over longer cycles, necessitating adequate liquidity buffers by fund managers.
Regulatory oversight has evolved alongside growth. The Collective Investment Schemes Regulations 2023 restrict MMFs to short-term, interest-bearing instruments with a maximum weighted average maturity of 18 months, supporting capital preservation and liquidity. Additionally, CMA guidance on asset segregation and custody has strengthened investor protection in digital distribution models, although consistent implementation across platforms remains critical.
Case Study 2: Fractional Share Trading Platforms
Fractional share trading platforms have emerged as transformative innovations in Kenya's equity markets, eliminating traditional barriers that restricted stock ownership to those who could afford whole shares and meet minimum trading lots.
Structure and Evolution
Fractional share trading platforms have emerged as a key innovation in Kenya’s capital markets, aimed at lowering entry barriers for retail investors. Historically, trading on the Nairobi Securities Exchange (NSE) required investors to buy shares in fixed board lots, which often meant committing large sums of capital and limited participation to a small segment of the population. Recent reforms, highlighted in the CMA Quarterly Statistical Bulletin for Q3’2025, have introduced single-unit trading at the NSE, allowing investors to buy and sell shares one unit at a time. This change has set the stage for fintech platforms to offer fractional share ownership, enabling individuals to invest in equities with very small amounts of money.
Fractional trading platforms leverage technology to make investing more convenient and inclusive. By aggregating individual orders and executing bulk trades through licensed brokers, these platforms allow users to own fractions of shares while maintaining accurate ownership records at the Central Depository and Settlement Corporation. Users can fund their investments digitally via mobile money or bank APIs, complete KYC remotely, and track their portfolios in real time. Dividends and other corporate actions are proportionally allocated to fractional owners, mirroring traditional shareholding rights. The table below shows key annual equity market performance indicators.
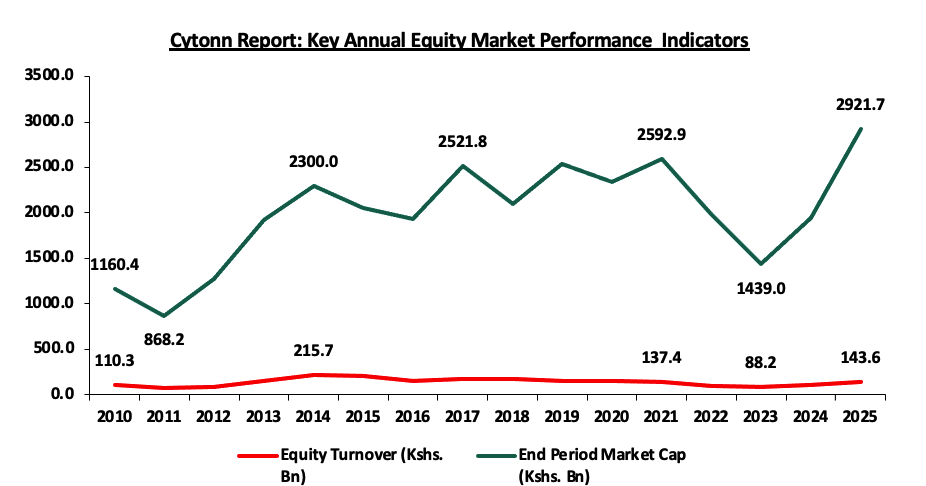
Source: NSE
Key Take outs:
-
Market Capitalization has more than doubled to Kshs 2.9 tn in 2025 from Kshs. 1.2 tn in 2010, showing the market’s overall value has grown significantly, reflecting capital inflows and investor confidence over the period.
-
Equity turnover exhibits cyclical volatility as it peaked at Kshs. 215.7 bn in 2014 but then declined sharply to a low of Kshs. 88.2 bn in 2023 before rebounding to Kshs. 143.6 bn in 2025, indicating fluctuating liquidity driven by shifting investor sentiment and macroeconomic factors.
-
Despite rising market capitalization in recent years, turnover did not proportionally increase, suggesting that higher market value is not translating into equivalent trading activity, implying potential liquidity constraints as well as concentration in a few blue-chip stocks.
Case Study 3: Safaricom and Airtel Money as Investment Service Provider Platforms (ISPPs)
The Capital Markets Authority’s approval of Safaricom and Airtel Money as Investment Service Provider Platforms (ISPPs) in December 2025 marks a pivotal step in Kenya’s fintech–capital markets convergence, enabling mobile money platforms to function as regulated distribution channels for investment products, including direct trading of NSE-listed equities through Safaricom’s Ziidi Trader. Under this model, investors can buy and sell shares, as well as access other approved capital-markets products, directly from their mobile wallets, with transactions executed and settled seamlessly over existing mobile money infrastructure, while custody and investment management remain with licensed brokers, fund managers, and issuers. ISPPs’ responsibilities are confined to secure onboarding, transaction processing, customer communication, and platform reliability, with investment risk and performance accountability clearly retained by underlying product providers.
Strategically, the ISPP framework directly advances the NSE’s retail investor deepening agenda by allowing share trading via familiar platforms such as M-pesa, significantly lowering entry barriers through simplified account structures, small ticket sizes, and near-instant settlement. This framework helps in broadening retail participation, improving market liquidity, and reducing over-reliance on institutional and foreign investors, thereby strengthening the depth, resilience, and inclusivity of Kenya’s capital markets.
Regulatory Innovation and Framework
The ISPP framework introduces a distinct licensing category for digital platforms that distribute investment products, positioning ISPPs as technology-driven transaction and distribution facilitators rather than providers of investment advice or portfolio management. Under the framework, ISPPs are required to maintain robust technology infrastructure with over 99.5% uptime, implement strong cybersecurity and data-protection controls in line with the Data Protection Act, ensure full transparency on fees and product information, and facilitate direct access to underlying product providers for investor queries and complaints. Importantly, investment management liability remains with licensed product providers such as fund managers, brokerages, and REIT managers, while ISPP responsibilities are limited to platform integrity, accurate transaction processing, customer communication, and secure custody arrangements where applicable. This clear separation of roles enables entities such as mobile network operators to participate in capital-markets distribution without traditional investment management expertise, while preserving accountability across the value chain, as reflected in the growth of money market accounts shown in the graph below:
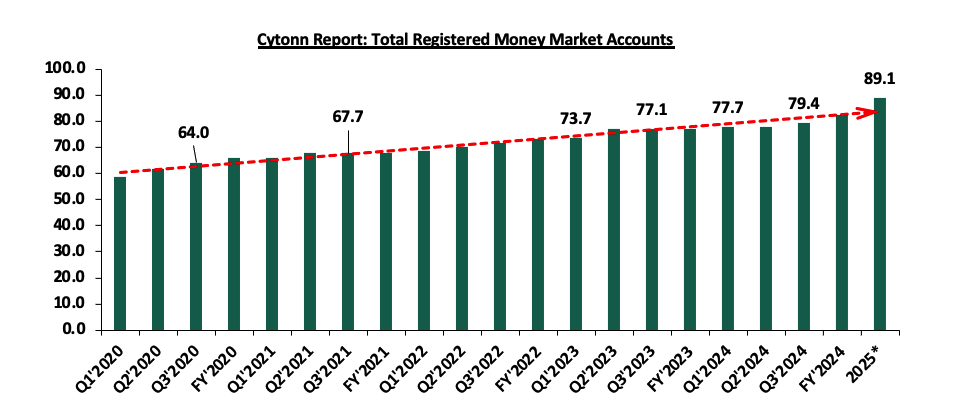
Source: Central Bank of Kenya (CBK), 2025* data as of November 2025
Significant challenges remain. Safaricom’s 92.3% market share raises potential dominance concerns, prompting CMA and Competition Authority oversight to protect competition and smaller players. Regulations will require multi-provider offerings, platform interoperability, and disclosure of affiliated products. Consumer protection will be critical, including clear risk disclosures, suitability assessments, cooling-off periods, and accessible complaint mechanisms. Cybersecurity and operational resilience are also essential, as investment services integrated with mobile money and telecom infrastructure increase systemic risks.
Case Study 4: Central Bank of Kenya (CBK) New Retail Bond Platform
On 22nd July 2025, the Central Bank of Kenya (CBK) initiated procurement for a new digital retail bond system. According to the tender document, the system will offer a fully integrated front-end and back-end platform, allowing individual investors to register, purchase, manage, rediscount, and receive interest payments on government securities primarily through mobile phones and the web. The CBK explicitly outlines the goal to “provide all services related to retail bonds”, including direct settlement via mobile money and banking systems, automation of interest/coupon payments, and a real-time, investor-facing dashboard for balances, transaction history, and reporting.
This is a notable evolution from previous platforms, and it reflects a deeper strategic shift. Whereas M-Akiba suffered from limited functionality, confusing onboarding, and no exit mechanism, and DhowCSD was skewed toward digital-savvy investors with limited support for small savers, the new system is designed from the ground up with mass-market financial inclusion and user simplicity as central priorities.
The evolution of these systems is captured in the table below:
|
M-Akiba (2017) |
DhowCSD (2023) |
New CBK System (2025) |
|
|
Target Market |
Low-income retail investors |
Institutional and retail (digitally literate) |
Mass-market retail, micro-savers included |
|
Access Channel |
Limited hours, USSD via mobile |
24/7, Web-first with limited mobile functionality |
24/7 availability including secondary trading, USSD, mobile app and web platforms. |
|
Account Opening |
Manual, broker-assisted |
Direct via online portal |
Fully digital KYC and self-registration |
|
Functionality |
Buy only |
Account opening, bidding |
Buy, sell, rediscount, receive interest |
|
Integration with Payments |
M-Pesa and Airtel money only |
Bank-linked payments |
Bank + mobile money operators (real-time) |
|
Liquidity |
Guaranteed exit option but no rediscounting |
Has secondary market access |
Full rediscount and early exit options |
|
Interface |
Technical, USSD menus |
Formal, web-based |
Intuitive, simplified, mobile-optimized |
|
Scalability |
Limited, never scaled |
Proven, growing rapidly |
Built for national scale (supports 40+ mn concurrent transactions) |
Source: CBK
Beyond its expanded functionality, the platform’s architecture as outlined in the tender includes a modular, API-enabled system, allowing for integration with Mobile Network Operators (MNOs), payment gateways, and CBK’s internal systems. Key technical features include:
-
Automated Interest Processing – System must auto-calculate and process coupon/interest payments.
-
Retail Depository Management – Maintain a comprehensive, secure, and real-time register of securities ownership.
-
Rediscount and Secondary Transfers – Support for early exits, resale, and portfolio rebalancing, particularly crucial for lower-income users.
-
Multi-Channel Access – Full service availability via mobile app, USSD, and responsive web interface.
-
Reporting & Analytics – Generation of both investor-facing and internal reports, including performance dashboards and audit logs.
The timing of the rollout coincides with a deliberate fiscal pivot toward the domestic market. With Treasury targeting Kshs 635.5 bn in local borrowing for FY’2025/26 and international credit markets growing tighter, this platform offers a crucial distribution channel. Investor demand also appears robust bond turnover hit Kshs 2.5 tn in 2025, and individual accounts now comprise 79.0% of those on DhowCSD. The graph below shows the composition of DhowCSD investors by June 2024:
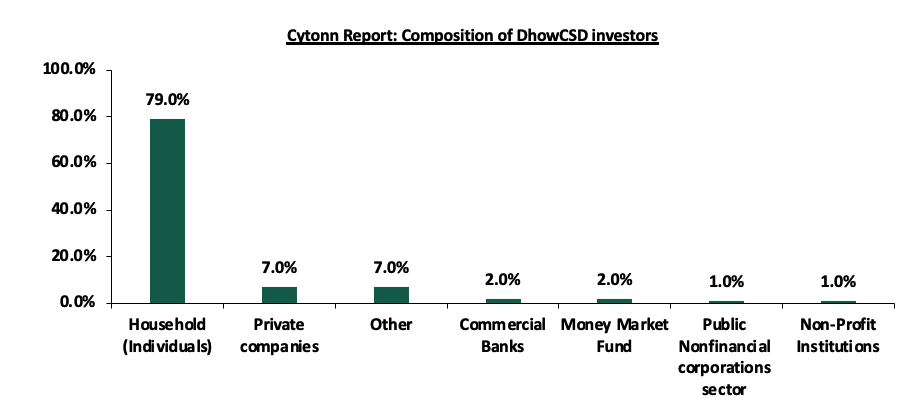
Source: CBK
The graph below shows secondary bond market turnover from Jan 2021 to Dec 2025, highlighting the impact of the DhowCSD platform.
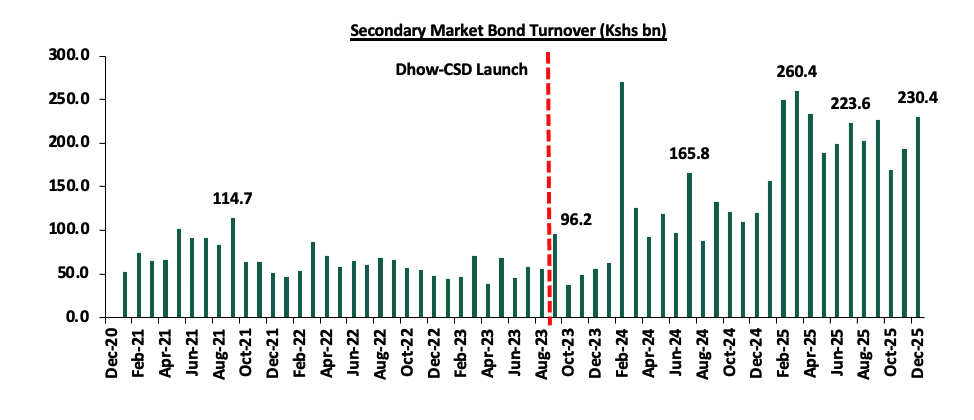
Source: NSE
If well-executed, the platform could serve as a blueprint for other frontier markets seeking to mobilize domestic capital in an inclusive, technology-driven way. However, success will depend on robust public education, seamless user experience, and institutional commitment beyond deployment. A technically sound system that’s poorly adopted would replicate past mistakes. Still, with its design, timing, and fiscal backing, this is Kenya’s best shot yet at mass retail bond participation.
Section V: Opportunities and Risks of Fintech-Driven Capital Markets Integration in Kenya
The integration of fintech into Kenya's capital markets presents transformative opportunities alongside significant risks requiring careful management. This section analyzes both dimensions, providing balanced assessment to inform strategy and policy.
-
Expanding the Investor Base
Kenya's median age of 20 years creates a predominantly young population that is digitally native, comfortable with mobile interfaces, and entering prime working and saving years. This cohort missed the branch-based banking era entirely, expecting financial services delivered digitally. Traditional capital markets infrastructure, requiring physical presence and paper-based processes, systematically excludes this demographic. Digital platforms align with their preferences and capabilities. Geographic expansion opportunities exist beyond Nairobi's concentration. Historically, capital markets infrastructure clustered in Nairobi, where the NSE, brokerages, and fund managers maintained physical offices. Rural and peri-urban residents faced travel costs and time investments making participation impractical. Digital platforms with mobile money integration eliminate geography as a barrier.
-
Enhancing Market Liquidity and Efficiency
Liquidity constraints plague Kenyan capital markets, with many securities trading infrequently and wide bid-ask spreads reflecting thin order books. Expanding the investor base addresses this structurally by increasing the pool of potential buyers and sellers, tightening spreads, and enabling more continuous trading. Transaction cost reduction creates positive feedback loops. Lower costs encourage more frequent trading, which increases liquidity, which further narrows spreads and reduces costs.
Market efficiency improvements extend beyond costs to information dissemination and price discovery. Digital platforms increasingly incorporate real-time news feeds, analyst reports, and earnings updates directly into interfaces, ensuring investors access information simultaneously regardless of location or network. This reduces information asymmetries that traditionally advantaged well-connected institutional investors over retail participants. More efficient information flow leads to faster price adjustments reflecting fundamental values, reducing arbitrage opportunities and volatility. Settlement acceleration from T+3 toward T+1 or real-time settlement through digital infrastructure and blockchain pilots reduces counter-party risk and frees capital.
Automated market making represents an emerging opportunity. Digital platforms can algorithmically match buyers and sellers, providing continuous quotes and reducing execution uncertainty. This differs from traditional broker-based matching requiring manual intervention. Automated market makers using algorithms to manage inventory and risk can narrow spreads and ensure liquidity even in less-popular securities, though regulatory frameworks for algorithmic trading in Kenya remain underdeveloped.
-
Democratizing Fixed Income and Alternative Assets
Kenya’s fixed income market has long been dominated by institutional investors, with negligible retail participation, but digital innovations such as the CBK bond trading platform and the introduction of Investment Service Provider Platforms (ISPPs) are beginning to open the market to mass investors. By aggregating retail demand through simple, low-cost digital distribution, ISPPs can expand the domestic bondholder base, reducing reliance on external financing and concentrated institutions while strengthening fiscal sustainability and public engagement in government debt outcomes. The same model can unlock Kenya’s underdeveloped corporate bond market by breaking the issuer–investor deadlock through demonstrated demand and improved liquidity, reducing corporate dependence on bank lending, while also supporting the growth of alternative assets such as REITs, infrastructure, and agricultural investments.
-
Leveraging Youth and Tech Ecosystem Strengths
Kenya's technology ecosystem, encompassing software developers, UI/UX designers, data scientists, and entrepreneurs, represents substantial human capital applicable to capital markets innovation. Unlike financial engineering requiring specialized finance expertise, much fintech innovation centers on user experience, system architecture, and data analytics-capabilities abundant in Kenya's tech sector. This creates opportunities for local innovation tailored to Kenyan contexts rather than importing solutions designed for developed markets with different infrastructures and user behaviors.
Entrepreneurship opportunities extend to specialized fintech services: identity verification providers, credit scoring engines, regulatory compliance platforms, market data aggregators, and investor education content creators can all build businesses supporting the broader ecosystem. This creates distributed value capture rather than concentrating benefits in a few large platforms.
Risks
-
Cybersecurity and Technology Vulnerabilities
The National KE-CIRT/CC detected 842.3 mn cyber threat events during the three-month period between July and September 2025 according to Communications Authority data, spanning system attacks, malware, brute force attacks, and mobile app attacks. Capital markets digitization expands attack surfaces and potential impacts.
Account takeover risks increase as investment accounts link to mobile money wallets and bank accounts. Compromised credentials could enable criminals to liquidate investments and transfer funds before detection. While platforms implement multi-factor authentication and transaction limits, social engineering attacks exploiting user vulnerabilities remain effective.
Platform security breaches could expose sensitive financial data including identity documents, tax information, transaction histories, and portfolio holdings. Kenya's Data Protection Act imposes breach notification and remediation obligations, but reputational damage and user trust erosion would harm the entire sector, not just the breached platform. Cybersecurity insurance for platforms remains expensive and limited in Kenya, meaning catastrophic breaches could bankrupt smaller operators.
Infrastructure dependencies create single points of failure. Most platforms depend on mobile money networks, internet connectivity, and cloud service providers. Outages in any component cascade into service disruptions. The 2024 widespread internet disruptions following undersea cable damage illustrated fragility, with millions unable to access digital financial services for hours. Building redundancy through diverse connectivity and distributed systems architecture requires investment that smaller platforms may lack.
Third-party risks proliferate as platforms integrate with multiple service providers for identity verification, credit scoring, payment processing, and custody. Each integration creates potential vulnerabilities. The security posture becomes only as strong as the weakest link, requiring extensive vendor due diligence and ongoing monitoring that strains platform resources.
-
Data Privacy and Consumer Protection
Extensive personal data collection for KYC, suitability assessments, and service personalization creates privacy concerns. While Kenya's Data Protection Act establishes frameworks, enforcement remains nascent and consumer awareness low. Many users consent to broad data sharing without understanding implications, creating power imbalances between platforms and users
Data monetization temptations exist. Aggregated investment behavior data holds commercial value for market research, targeted advertising, and trading insights. Platforms may face pressure to monetize this data, potentially compromising user privacy despite consent frameworks. The line between anonymized aggregate data and re-identifiable user information is technically blurry. Mis-selling risks increase as platforms emphasize ease and accessibility potentially downplaying risks. Marketing may over-emphasize returns while under-communicating volatility, liquidity constraints, or loss potential. Vulnerable populations including youth and low-income users with limited financial literacy may be particularly susceptible. The boundary between legitimate marketing and misleading promotion requires clear regulatory standards and enforcement.
-
Informal and Unregulated Operators
Kenya's informal financial sector persists alongside regulated institutions. Unregulated investment schemes, Ponzi frauds, and pyramid schemes proliferate, often mimicking legitimate fintech platforms' language and digital interfaces
Regulatory arbitrage opportunities exist where activities falling between CBK, CMA, and other agencies' mandates operate without adequate oversight. Digital lending experienced this before CBK asserted jurisdiction in 2020, with predatory practices harming consumers. Similar risks exist for emerging activities like peer-to-peer lending, cryptocurrency trading, and decentralized finance applications.
Platform failures and user fund protection represent critical concerns. If a digital investment platform becomes insolvent, what happens to user assets? While regulations require asset segregation and custodial arrangements, implementation and enforcement vary. Cross-border platforms operating in Kenya without local licenses also create jurisdiction challenges. International robo-advisors or cryptocurrency exchanges serving Kenyan users via internet access may evade Kenyan regulation while exposing users to risks. Enforcement against foreign-domiciled platforms with no local presence is practically difficult, leaving users unprotected.
-
Fragmented Regulation and Coordination Challenges
Multiple regulators overseeing different aspects of fintech-capital markets integration creates coordination demands that are not always met seamlessly. A mobile money-integrated investment platform falls under CBK (for mobile money), CMA (for securities), possibly RBA (if offering pension products), and Data Protection Commissioner (for personal data). Navigating requirements across these agencies creates compliance complexity and costs.
Regulatory gaps and overlaps emerge. Who supervises a blockchain-based securities platform, CMA for securities trading or CBK if it uses cryptocurrency for settlement? What about platforms offering investment advice via AI, are they investment advisors requiring licensing or technology providers exempt from registration? Ambiguity creates both under-regulation risks and over-regulation that stifles innovation.
Enforcement inconsistencies across agencies undermine effectiveness. Different agencies may have varying priorities, resource constraints, and risk appetites, leading to uneven oversight. An entity might face stringent supervision from one regulator while receiving minimal attention from another with concurrent jurisdiction.
Policy coordination with complementary reforms is essential. Capital markets digitization interacts with broader policy areas including taxation, competition policy, consumer protection law, and telecommunications regulation. Misalignment creates unintended consequences.
-
Liquidity Mismatches and Market Volatility
Digital platforms' ease of use and instant gratification features may create liquidity expectations exceeding what underlying assets provide. Money market funds offering same-day liquidity work when redemptions are stochastic and offsetting inflows provide buffers. However, correlated withdrawals during market stress, precisely when users most desire liquidity, can force funds to sell assets at unfavorable prices, crystallizing losses and creating self-fulfilling panic.
Herding behavior may intensify in digital environments where users can see others' actions, follow influencers' recommendations, or algorithmically receive similar investment suggestions. If many users simultaneously receive signals to buy or sell particular securities, this concentrated demand or supply can amplify volatility rather than smoothing it as diversified decision-making would.
Risk Mitigation Strategies
Addressing these risks requires coordinated efforts across multiple stakeholders. Regulatory enhancements including comprehensive cybersecurity standards for digital financial services platforms, explicit consumer protection rules addressing digital-specific risks, harmonized cross-agency regulation through memoranda of understanding and joint supervision, and adequate enforcement resources and technical capacity must be priorities.
-
Industry self-regulation through associations establishing codes of conduct, sharing threat intelligence, and operating collective dispute resolution mechanisms can complement government oversight. International standards adoption including ISO information security standards, Financial Action Task Force anti-money laundering recommendations, and International Organization of Securities Commissions principles provides frameworks proven in other markets.
-
Consumer education campaigns explaining digital security practices, investment fundamentals, and fraud recognition must accompany access expansion. Education cannot solely be platforms' responsibility given conflicts of interest; independent financial literacy initiatives by civil society, government, and development partners are essential.
-
Technology safeguards including multi-factor authentication, transaction limits and velocity checks, anomaly detection algorithms, and encrypted communications should be mandatory minimum standards. Regular security audits and penetration testing ensure ongoing resilience.
-
Insurance and compensation schemes protecting users against platform failures, frauds, and cybersecurity breaches provide confidence to participate. Expanding investor protection fund coverage explicitly to digital platforms and considering cyber insurance pooling mechanisms could enhance safety nets.
-
Prudential requirements including minimum capital for platform operators, segregated client asset accounts, and regular financial reporting ensure platforms can withstand operational losses without jeopardizing user assets. Scaled requirements based on platform size and risk profiles balance safety with avoiding excessive barriers for smaller innovators.
Section VI: Outlook, Strategic Recommendations, and Conclusion
-
Outlook and Expected Trends
Kenya's fintech-capital markets integration trajectory through 2030 will likely involve deepening and broadening of existing trends alongside emergence of new technologies and business models. Several developments appear probable based on current initiatives and global patterns.
-
Product proliferation and sophistication will expand investor choice. Beyond current equity, fixed income, and money market offerings, expect exchange-traded funds tracking thematic indexes, environmental/social/governance-focused funds, commodity-linked securities, inflation-protected bonds, structured products combining multiple assets, and potentially even prediction markets on economic indicators. This variety enables portfolio diversification and matches diverse investor preferences.
-
AI advancement will enhance sophistication across the value chain. Hyper-personalized investment recommendations considering hundreds of individual data points, real-time portfolio rebalancing responding to market movements and personal circumstances, natural language interfaces enabling conversational investment management, and predictive analytics identifying emerging opportunities or risks will become standard rather than exceptional features.
-
Institutional adoption of digital channels will increase as pension funds, insurance companies, and asset managers recognize digital distribution benefits and competitive necessities. Institutional-grade digital platforms offering sophisticated analytics, compliance automation, and operational efficiency will emerge alongside retail-focused offerings.
-
Regulatory evolution will continue adapting frameworks to digital realities. Expect comprehensive digital asset regulations, explicit open finance rules mandating interoperability, updated market conduct standards addressing algorithmic trading and robo-advisory, and potentially consolidated financial services regulation reducing fragmentation across agencies.
-
Cybersecurity threats will intensify alongside digital adoption, requiring continuous vigilance and investment. Quantum-resistant cryptography may become necessary as quantum computing advances threaten current encryption standards. Biometric authentication including facial recognition and behavioural biometrics may supplement or replace passwords and PINs.
Recommendations
Licensed intermediaries including brokers, fund managers, investment advisors, and the Nairobi Securities Exchange should adapt strategies recognizing digital transformation's inevitability and opportunities.
-
Embrace digital transformation genuinely rather than superficially. This requires substantial investment in technology platforms, business process re-engineering, organizational culture changes, skills development and talent acquisition, and often painful cannibalization of traditional revenue streams. Half-measures satisfying regulators without truly competing against digital-native platforms will prove fatal as customer preferences shift irreversibly.
-
Partner strategically with fintech firms, recognizing that building all capabilities in-house is often less effective than collaborative models. Traditional intermediaries bring regulatory licenses, client relationships, investment expertise, and capital; fintechs contribute technological capabilities, user experience design, data analytics, and agility. Partnerships combining these strengths through revenue-sharing, joint ventures, or strategic investments can outperform either operating independently.
-
Focus on customer experience relentlessly. Digital success requires obsessive attention to interface design, minimizing friction in onboarding and transactions, providing transparent and immediate information, personalizing communications and recommendations, and supporting customers proactively. Customer experience cannot be an afterthought to compliance and operations; it must drive platform design from inception.
-
Invest in data capabilities to leverage the information generated by digital interactions. Customer transaction data, behavioural patterns, engagement metrics, and external data sources enable personalization, risk management, product development, and operational optimization. However, this requires data infrastructure, analytical talent, and governance frameworks many traditional intermediaries lack.
-
Differentiate through specialized services rather than competing solely on price. Digital platforms naturally drive commoditization of basic services, compressing margins. Sustainable competitive advantages will come from specialized expertise (sector focus, alternative assets, complex strategies), superior advisory combining human and algorithmic capabilities, institutional-grade services for high-net-worth and corporate clients, and values-based positioning (ESG investing, community impact).
-
Maintain rigorous risk management as digitization introduces new vulnerabilities. Cybersecurity, operational resilience, model risk from algorithmic decision-making, liquidity management for digital-enabled rapid redemptions, and fraud detection all require sophisticated capabilities. Cost-cutting in risk management creates catastrophic liabilities.
-
Collaborate on industry initiatives addressing common challenges including shared cyber threat intelligence, industry codes of conduct and standards, collective investor education campaigns, joint advocacy on regulatory issues, and industry compensation schemes protecting consumers. Competition on customer service and product features should coexist with collaboration on ecosystem development.
Conclusion
Kenya is at a pivotal moment where two decades of fintech evolution intersect with the need to modernize and democratize its capital markets. The alignment of technological capability, progressive regulation, strong market demand, and a young, digitally engaged population creates an opportunity to expand financial inclusion, mobilize domestic savings, and support long-term economic growth. Millions of Kenyans could transition from transactional mobile money use to sustained investing, while billions of shillings could be channeled into infrastructure, businesses, and housing through deeper bond and equity markets. Improved market efficiency, lower costs, and greater liquidity would also enhance Kenya’s regional and global competitiveness, while innovation could drive job creation and entrepreneurship.
Realizing this potential, however, is not automatic. It requires coordinated action to manage risks alongside opportunity. Cybersecurity failures, weak consumer protection, fragmented regulation, or exclusionary design could undermine trust and replicate inequalities in digital form. The path forward demands a careful balance between innovation and stability, access and security, and commercial viability and social impact. Policymakers must provide enabling yet protective regulatory frameworks, market participants must pursue genuine, customer-centric digital transformation, and investors and innovators must engage responsibly. If these elements align, Kenya’s fintech–capital markets integration can deliver a more inclusive, efficient ecosystem that builds widespread wealth; if not, the promise of digital inclusion risks falling short
Disclaimer: The views expressed in this publication are those of the writers where particulars are not warranted. This publication, which is in compliance with Section 2 of the Capital Markets Authority Act Cap 485A, is meant for general information only and is not a warranty, representation, advice or solicitation of any nature. Readers are advised in all circumstances to seek the advice of a registered investment advisor.

- Talk to us
- Kenya
- P.O Box 20695 - 00200, Nairobi, Kenya
- Cell +254709101200
- Tel +254709101200
- WhatsApp +254741676635
- United States
- +254709101200
- DOWNLOAD OUR APP
-


- Kenya
- 8th Floor, Pinetree Plaza, Kaburu Drive, Ngong Road, Nairobi, Kenya
- USA
- Suite 1150, 1775 Eye Street NW, USA, Washington DC 20006, USA
- Investments
- High Yield
- Private Equity
- Real Estate
- Real Estate
- RiverRun Estates
- Cytonn Towers
- The Ridge
- Taraji Heights
- The Alma