Technology & Investments and Cytonn Weekly #43/2019
By Research Team, Oct 27, 2019
Executive Summary
Fixed Income
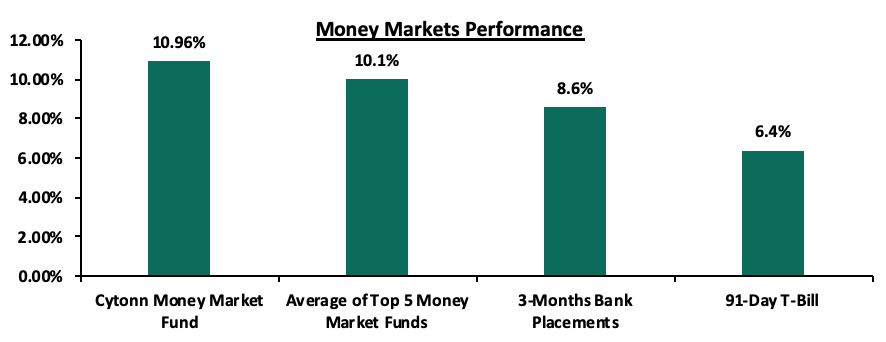
During the week, T-bills remained undersubscribed, with the subscription rate declining to 72.8%, from 80.6% recorded the previous week. The decline in the subscription rate is partly attributable to the 16-year infrastructure bond sale that closed this week. The yield on the 91-day, 182-day and 364-day papers remained unchanged at 6.4%, 7.2%, and 9.8%, respectively. In the money markets, 3-month bank placements ended the week at 8.6% (based on what we have been offered by various banks), the 91-day T-bill came in at 6.4%, while the average of Top 5 Money Market Funds remained unchanged at 10.1%, as recorded the previous week, with the Cytonn Money Market Fund closing the week at 10.96%, from 11.0% recorded the previous week;
Equities
During the week, the equities market was on an upward trend with NASI, NSE 20 and NSE 25 gaining by 1.2 %, 1.2%, and 1.5%, respectively, taking their YTD performance to gains/losses of 6.9%, (12.1%) and 1.5%, for NASI, NSE 20 and NSE 25, respectively. During the week, Absa Group Ltd in association with Official Monetary and Financial Institutions Forum (OMFIF) released the Absa Africa Financial Markets Index 2019, which looks at financial markets in African countries, and ranks them according to Market Depth, Access to Foreign Exchange, Tax and Regulatory Environment and Market Transparency, Capacity of Local Investors, Macroeconomic Opportunity, and, Enforceability of Financial Contracts, Collateral Positions and Insolvency Frameworks. Overall, Kenya had a score of 65.0, a similar score as last year, with its position unchanged from last year as well. During the week, the Capital Market Authority (CMA) released the second Corporate State of Governance of Issuers report for the financial year 2018/19. The report noted that in the financial year 2018/19, the issuers had a weighted overall score of 61.0%, an improvement from 55.0% reported in the FY 2017/18;
Real Estate
During the week, Jones Lang LaSalle (JLL), a real estate management services firm, released its Q4’2019 Spotlight on Africa Report, which tracks vital trends impacting hotel investment in Sub-Saharan Africa. As per the report, hotel investors in Sub-Saharan Africa are likely to attract investment for hotel projects that are set up as mixed-use developments. The World Bank released its ‘Doing Business Report 2020’, where Kenya’s ranking in terms of dealing with construction permits, improved to position #105 in 2019 from position #128 in 2018. In the residential sector, Tilisi Developments Plc, a local real estate developer, announced that they are set to begin construction of 186 high-end villas on a 41-acre parcel of land within their masterplan development located in Rironi, Limuru. In the hospitality sector, seven Kenya hotels received various awards at the World Luxury Hotel Awards 2019 in Finland, including Sarova Stanley and Sankara in Nairobi, affirming recognition of the country as a preferred travel destination for both business and holiday travelers;
Focus of the Week
Technology has continued to be a disruption in the investment industry, both in Kenya and globally. One of the most tangible disruptions is the ability that technology provides to make investments easier to access, be it through a website or mobile phone. From the comfort of your phone, you can now access an investment company’s website or application, make an investment or withdraw an investment. Following our report on Fintech Impact on Kenya’s Financial Services Industry, which focused on technology in financial services, in this week’s report we focus specifically on the impact of technology on investments. We analyze how technology has impacted the investment industry focusing on the history of the global investment industry, technology factors shaping the investment industry in Kenya, and outlook on the future of technology and the investment industry;
- Cytonn Investments was ranked among the Top 100 companies to work for in the 2019 Best 100 Companies to Work For in Kenya report; ranking #28 nationwide;
- Caleb Mugendi, Asst. Head of Investments, was on CNBC to talk about what is shaking the Kenyan market. Watch Caleb here;
- David Kingoo, Senior Risk and Compliance Associate was on KBC Channel 1 to talk about tax administration in the country. Watch David here;
- Caleb Mugendi, Asst. Head of Investments, was on Metropol TV to talk about the rate cap. Watch Caleb here;
- Phase 1 of The Alma is now 100% sold with early buyers having achieved up to 55% capital appreciation. We are now running a promotion in Phase 2: Buy a unit in Phase 2 with a 15-year payment plan and 0% deposit. For inquiries, please email us on clientservices@cytonn.com. The site is open between 8 am - 5 pm, 7-days a week for site visits;
- Cytonn Money Market Fund closed the week at an average yield of 11.0% p.a. To subscribe, just dial *809#;
- For an exclusive tour of Cytonn’s real estate developments, visit: Sharp Investor's Tour and for more information, email us at sales@cytonn.com;
- We continue to hold weekly workshops and site visits on how to build wealth through real estate investments. The weekly workshops and site visits target both investors looking to invest in real estate directly and those interested in high yield investment products to familiarize themselves with how we support our high yields. Watch progress videos and pictures of The Alma, Amara Ridge, and The Ridge;
- We continue to see very strong interest in our weekly Private Wealth Management Training (largely covering financial planning and structured products). The training is at no cost and is open only to pre-screened participants. We also continue to see institutions and investment groups interested in the training for their teams. Cytonn Foundation, under its financial literacy pillar, runs the Wealth Management Training. If interested in our Private Wealth Management Training for your employees or investment group, please get in touch with us through wmt@cytonn.com. To view the Wealth Management Training topics, click here;
- For recent news about the company, see our news section here;
- We have 10 investment-ready projects, offering attractive development and buyer targeted returns. See further details here: Summary of Investment-Ready Projects
Money Markets, T-Bills & T-Bonds Primary Auction:
During the week, T-bills remained undersubscribed, with the subscription rate declining to 72.8%, from 80.6% recorded the previous week. The decline in the subscription rate is partly attributable to the 16-year infrastructure bond sale that closed this week. The yield on the 91-day, 182-day, and 364-day papers remained unchanged at 6.4%, 7.2%, and 9.8%, respectively. The acceptance rates increased to 94.3%, from 67.8% recorded the previous week, with the government accepting Kshs 16.5 bn out of the Kshs 17.5 bn worth of bids received.
For the month of October, the National Treasury issued a tax-exempt 16-year Kshs 60.0 bn infrastructure bond with market-determined coupon rates for the purpose of financing the infrastructure projects in the FY 2019/20 budget estimates. The bond was oversubscribed as per our expectations due to its tax-free incentive that translates to higher returns, receiving bids totaling Kshs 86.9 bn of the Kshs 60.0 bn on offer, translating to a subscription rate of 144.9%. The weighted average rate of accepted bids was at 12.4% in line with our expectations of 12.3% - 12.5%
In the money markets, 3-month bank placements ended the week at 8.6% (based on what we have been offered by various banks), the 91-day T-bill came in at 6.4%, while the average of Top 5 Money Market Funds came in at 10.1%, as recorded in the previous week, with the Cytonn Money Market Fund closing the week at 10.96%, from 11.0% recorded the previous week.
Liquidity:
During the week, the average interbank rate declined to 6.9%, from 7.2% recorded in the previous week, on the back of improving liquidity conditions in the money market mainly due to government payments and net redemptions of government securities. This saw the commercial banks’ excess reserves come in at Kshs 17.8 bn, compared to Kshs 11.5 bn recorded last week, in relation to the monthly 5.25% cash reserve requirement. The average volumes traded in the interbank market increased by 117.0% to Kshs 13.1 bn, from Kshs 6.0 bn the previous week.
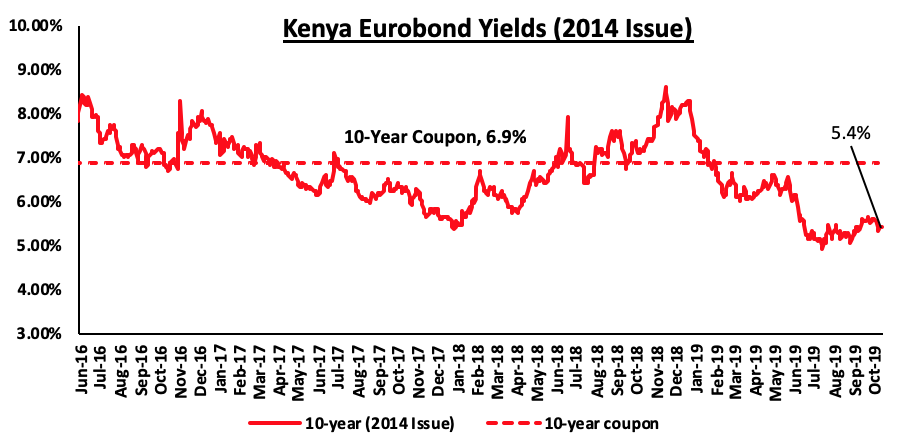
Kenya Eurobonds:
According to Reuters, the yield on the 10-year Eurobond issued in 2014 remained unchanged at 5.4% similar to what was recorded in the previous week.
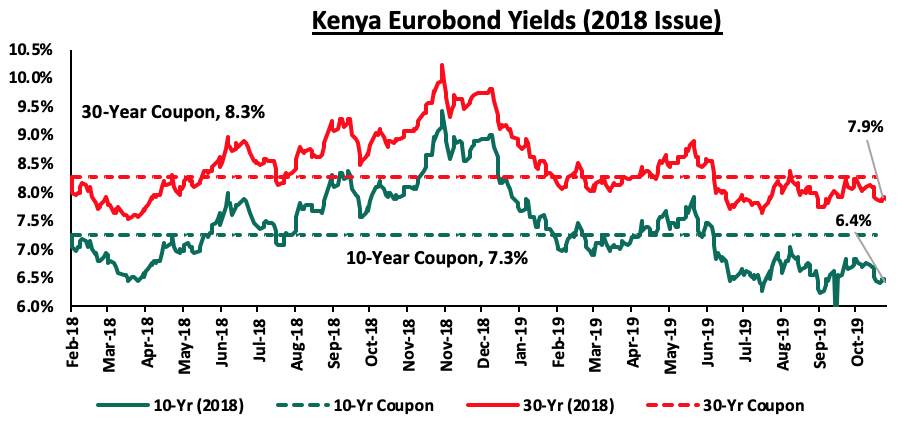
For the 2018 issues, the yields on the 10-year declined by 0.1% points to 6.4% from 6.5% recorded in the previous week. The 30-year Eurobonds yields remained unchanged at 7.9% as recorded in the previous week.
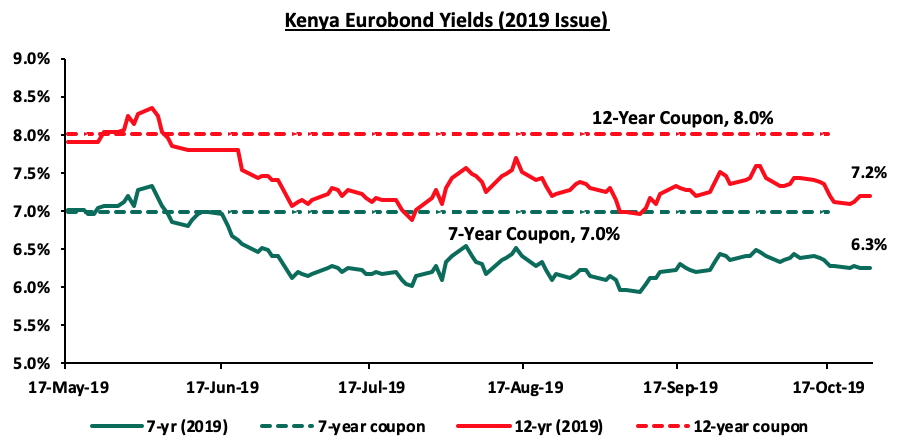
During the week, the yields on the 7-year Eurobond remained unchanged at 6.3% as recorded in the previous week. The 12-year Eurobond increased by 0.1% points to 7.2% from 7.1% recorded in the previous week.
Kenya Shilling:
During the week, the Kenya Shilling appreciated marginally against the US Dollar by 0.4%, to close at Kshs 103.3, from 103.7 recorded the previous week, supported by dollar inflows from offshore investors buying government bonds. On a YTD basis, the shilling has depreciated by 1.4% against the dollar, in comparison to the 1.3% appreciation in 2018. In our view, the shilling should remain relatively stable against the dollar in the short term, supported by:
- The narrowing of the current account deficit, with preliminary data indicating that Kenya’s current account deficit improved by 11.8% during Q2’2019, coming in at a deficit of Kshs 107.6 bn, from Kshs 122.0 bn in Q2’2018, equivalent to (6.2%) of GDP, from (7.6%) recorded in Q2’2018. This was mainly driven by the narrowing of the country’s merchandise trade deficit by 1.7% and a rise in secondary income (transfers) balance by 5.1%,
- Improving diaspora remittances, which have increased cumulatively by 8.0% in the 12-months to September 2019 to USD 2.8 bn, from USD 2.6 bn recorded in a similar period of review in 2018. The rise is due to:
- Increased uptake of financial products by the diaspora due to financial services firms, particularly banks, targeting the diaspora, and,
- New partnerships between international money remittance providers and local commercial banks making the process more convenient,
- CBK’s supportive activities in the money market, such as repurchase agreements and selling of dollars, and,
- High levels of forex reserves, currently at USD 8.9 bn (equivalent to 5.6-months of import cover), above the statutory requirement of maintaining at least 4.0-months of import cover, and the EAC region’s convergence criteria of 4.5-months of import cover.
Weekly Highlight:
During the week, the World Bank released the Doing Business 2020 Report, which investigates the regulations that enhance business activity in a country and those that constrain it. The report covers regulations affecting 11 areas of the life of a business which include: starting a business, dealing with construction permits, getting electricity, registering property, getting credit, protecting minority investors, paying taxes, trading across borders, enforcing contracts, resolving insolvency and labour market regulation.
Kenya’s Overall Result
|
EASE OF DOING BUSINESS RANKING |
|||||
|
|
2016 |
2017 |
2018 |
2019 |
2020 |
|
Ease of Doing Business Rank (1-190) |
113 |
92 |
80 |
61 |
56 |
|
Ease of Doing Business Score (0-100) |
58.1 |
62.4 |
65.2 |
70.3 |
73.2 |
Source: World Bank
Of the 190 countries, Kenya’s ranking improved by 4 positions to #56 in the 2020 report with a score of 73.2, from #61 in the 2019 report. In Africa, Kenya’s ranking declined 1 position to #4, from #3 compared to the previous period, the global ranking improvement was primarily because of:
- Dealing with Construction Permits: This was made easier by making dealings of construction permits more transparent by making building permit requirements publicly available online, and also by reducing fees,
- Getting Electricity: Kenya made strides to improve the reliability of electricity supply through modernizing existing infrastructure and by inaugurating a new substation in Nairobi,
- Getting Credit: Kenya strengthened access to credit by introducing online registration, modification, and cancellation of security interests, and public online searches of its collateral registry. Kenya also set up new credit bureaus and registries which has had positive effects within the economy by reducing interest rates, collateral, and default rates for loans at commercial banks
- Protecting Minority Investors: Kenya strengthened minority investor protections by requiring shareholders to approve the election and dismissal of an external auditor,
- Paying Taxes: Kenya made paying taxes easier by implementing an online filing and payment system for social security contributions, and,
- Resolving Insolvency: Kenya made resolving insolvency easier by improving the continuation of the debtor’s business during insolvency proceedings.
Conclusion:
Coming #56, after Morocco (#53), Rwanda (#38) and Mauritius (#13) in the ranking, Kenya’s economy remains one of the most attractive business environments in Africa. We expect continued improvement, as the government remains committed to pro-market reforms and adopting a robust regulatory framework and improving the business environment much further which will help attract more investors. The World Bank also recognized Kenya’s efforts in implementing reforms attributable to good leadership and coordination between agencies
Inflation Projections
We are projecting the Y/Y inflation rate for the month of October to come in within the range of 4.4% - 4.8%, compared to 3.8% recorded in September. The Y/Y inflation for the month of October is expected to rise due to the base effect. The M/M inflation is however expected to decline driven by:
- A decline in the food and non-alcoholic beverages index, which has a weighting of 36.0%, mainly driven by the low food prices especially grain and flour prices, as well as milk prices,
- We also expect a decline in the transport index following the 4.2% and 1.0% decline in petrol and diesel prices, respectively, during the month, and,
- Only a marginal rise in the housing, water, electricity, gas, and other fuels index following the 0.4% increase in kerosene prices to Kshs 101.1, from Kshs 100.6 in September.
Going forward, we expect the inflation rate to remain within the government set range of 2.5% - 7.5%.
Rates in the fixed income market have remained relatively stable as the government rejects expensive bids. Despite the rise in net revenue collections in Q1’2019 by 13.1% to Kshs 372.3 bn from Kshs 329.2 bn recorded in a similar period last year, we still don’t expect the government to meet the Kshs 2.1 tn revenue target for FY’2019/2020, creating uncertainty in the interest rate environment as additional borrowing from the domestic market goes to plug the deficit. Putting into consideration the possible repeal of the interest rate cap, we expect improved private sector credit growth in the country, especially access to credit by MSMEs. This will lead to increased competition for bank funds from both the private and public sectors, thereby reducing liquidity in the money market, resulting in upward pressure on interest rates. Owing to this, we will be updating our Fixed Income House View.
Market Performance
During the week, the equities market was on an upward trend with NASI, NSE 20 and NSE 25 gaining by 1.2%, 1.2%, and 1.5%, respectively, taking their YTD performance to gains/losses of 6.9%, (12.1%) and 1.5%, for NASI, NSE 20 and NSE 25, respectively. The performance in NASI was driven by gains recorded by stocks mainly in the Banking sector with NCBA Group, Equity Group, and KCB Group recording gains of 5.2%, 5.1%, and 2.0%, respectively, as the market anticipates the repeal of the interest rate cap by the National Assembly.
Equities turnover increased by 13.3% during the week to USD 39.0 mn, from USD 34.4 mn the previous week, taking the YTD turnover to USD 1,171.1 mn. Foreign investors remained net sellers for the week, with a net selling position of USD 2.8 mn, from a net selling position of USD 8.5 mn recorded the previous week.
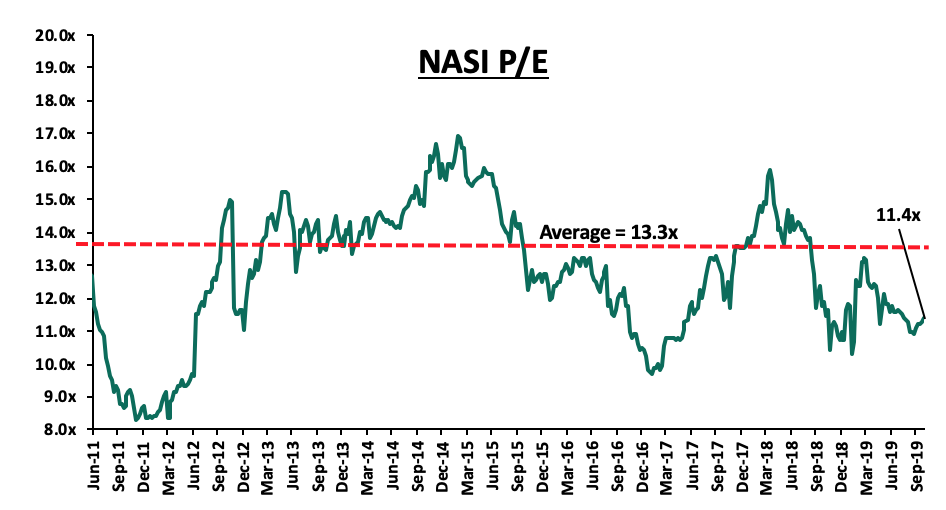
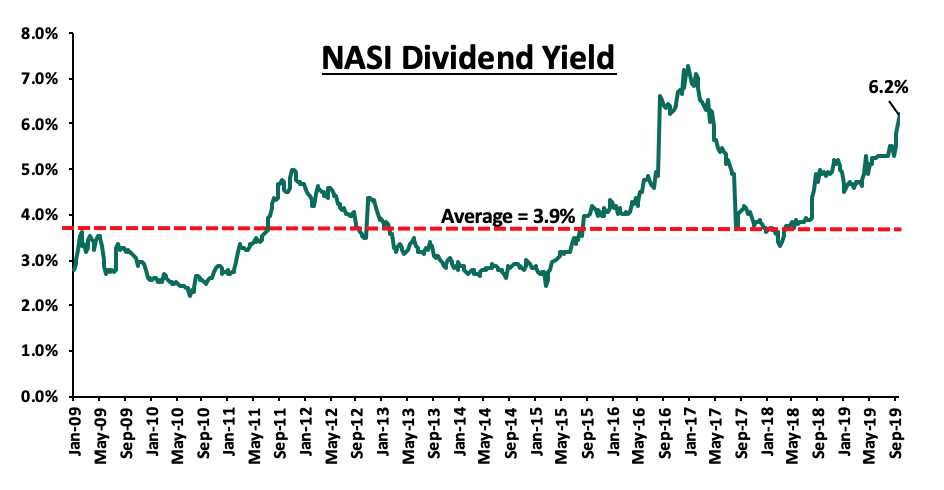
The market is currently trading at a price to earnings ratio (P/E) of 11.4x, 14.3% below the historical average of 13.3x, and a dividend yield of 6.2%, above the historical average of 3.9%. With the market trading at valuations below the historical average, we believe there is value in the market. The current P/E valuation of 11.4x is 17.4% above the most recent trough valuation of 9.7x experienced in the first week of February 2017, and 37.2% above the previous trough valuation of 8.3x experienced in December 2011. The charts below indicate the historical P/E and dividend yields of the market.
Weekly Highlight
During the week, Absa Group Ltd in association with Official Monetary and Financial Institutions Forum (OMFIF) released the Absa Africa Financial Markets Index 2019 report. The purpose of this index is to highlight countries with the clearest growth prospects through the evaluation of the financial market in 20 African countries. The assessment is done according to:
- Market Depth,
- Access to Foreign Exchange,
- Tax and Regulatory Environment and Market Transparency,
- Capacity of Local Investors,
- Macroeconomic Opportunity, and,
- Enforceability of Financial Contracts, Collateral Positions, and Insolvency Frameworks.
Besides the above quantitative analysis, OMFIF appraised over 40 policymakers and top executives of financial institutions across the 20 countries. These financial institutions include; investors, regulators, banks, audit and accounting firms, securities exchanges, central banks, and international financial and development institutions. Among the 20 countries, South Africa and Kenya maintained their positions from the previous index report at positions 1 and 3, respectively. The other countries in the top 5 list include; Mauritius, Namibia, and Botswana. Overall, Kenya had a score of 65.0 out of 100, a similar score recorded in 2018, but as per individual pillars, Kenya received the following rankings;
- On Legality and Enforceability of Standard Financial Markets Master Agreements, Kenya was ranked 2nd with a score of 96.0, an improvement from the 3rd rank with a score of 83.0 in 2018,
- On Access to Foreign Exchange, Kenya was ranked 5th with a score of 65.0, a drop from the 1st rank with a score of 93.0 in 2018,
- On Market Depth, Kenya was ranked 5th with a score of 55.0, an improvement from the 8th rank with a score of 44.0 in 2018,
- On Market Transparency, Tax And Regulatory Environment, Kenya was ranked 11th with a score of 71.0, a descent from the 8th rank with a score of 70.0 in 2018, and
- On Capacity of Local Investors, Kenya was ranked 8th with a score of 39.0, a drop from the 7th rank with a score of 33.0 in 2018.
Key take-outs from the report include:
- There was a significant improvement in Market Depth in 3 countries, namely Kenya, Namibia, and Botswana, achieving scores of over 50.0. This shows an improvement in other bourses in Africa with South Africa being the benchmark as an outlier with a score of 100,
- Market Transparency, Tax, and Regulatory Environment pillar saw the best collective performances with 13 out of 20 countries scoring above 67.0,
- While most pillars saw an improvement, Access to Foreign Exchange is the only pillar where collective scores dropped. Similarly, the interbank foreign exchange risk had a large disparity where South Africa’s turnover is at 466.0% of GDP, whereas when isolated from the rest the average turnover for the remaining 19 countries is 13.0% of GDP, and,
- All countries showed an improvement in their index averages compared to the first index report that was released in 2017, showing that they are all aligning their local resources in accordance with global standards.
The report cites that it has become a more challenging environment for new listing in certain countries such as Kenya where since the introduction of the rate cap in 2016, credit creation has been hampered, weakening companies’ financial bottom-line and hindering their expansion plans, thus negatively impacting their capital issuance. The value of bonds listed on the Nairobi exchange doubled to USD 17.5 bn from USD 8.8 bn over the year, entirely due to sovereign issues. The Capital Markets Authority aims to boost Kenya’s venture capital and private equity markets to create a pipeline of smaller firms that can pursue initial public offering through the Ibuka program, in line with the Capital Markets Master Plan which has a target of at least four listings per year on the Nairobi Stock Exchange. In our view, the repeal of the rate cap will help spur the growth of Kenya’s capital market by improving Micro, Small and Medium Enterprises’ access to credit, and thus, the economic growth derived from the expansion will, in turn, boost the development of the local capital market.
During the week, the Capital Market Authority (CMA) released the second Corporate State of Governance Issuers report for the financial year 2018/19. The State of Governance Report is an assessment of issuers of securities in Kenya aimed at raising visibility of the firms’ state of corporate governance in order to empower investors and respective boards to inspire continuous improvement in practices. The report follows the evaluation of the second set of regulatory reports submitted in accordance with the Code of Corporate Governance Practices for Issuers of Securities to the Public, 2015 (the Code), which became effective in March 2017. The Code sets out the principles and specific recommendations on the structures and processes that issuers should adopt in making good corporate governance an integral part of their business dealings and culture. The principles against which issuers’ performances were measured against include;
- Commitment to Good Corporate Governance,
- Rights to Shareholders,
- Ethics and Social Responsibility,
- Transparency and Disclosure,
- Board Operations and Control,
- Stakeholder Relations, and
- Accountability, Risk Management, and Internal Control.
The Capital Market Authority assessed 53 issuers where 7 issuers demonstrated leadership practices, while 17 demonstrated good practices, 21 demonstrated fair practices and 8 needed improvement practices. The CMA Chief Executive, Mr. Paul Muthaura, noted that in the financial year 2018/19, the issuers had a weighted overall score of 61.0%, an improvement from 55.0% reported in the FY 2017/18. The report indicates that at least 19, equivalent to 29.7% of the 64 issuers of shares and bonds who are currently listed on the Nairobi Stock Exchange, failed the corporate governance test, with at least 11 issuers failing to publicly disclose part or a substantial portion of information for assessment to help existing and prospective investors make informed investment decisions. The report specifies that;
- Compared to FY 2017/18, there was a commendable improvement by all issuers, with the number of firms in leadership increasing to 7 from 3, those with a ‘Good’ rating increasing to 17 from 5, those with a ‘Fair’ rating falling to 21 from 31 and those with a ‘Need Improvement’ rating decreasing to 8, from 17 recorded in 2017/18,
- Of the 7 issuers who demonstrated leadership practices, 3 were from the banking sector, 2 from manufacturing & allied/automobiles & accessories sectors, 1 from the insurance sector and 1 from the construction & allied sector,
- Further, Construction & Allied sector performed well in most sectors leading in Board Operations and control as well as Ethics and Social Responsibility principle,
- Accountability, Risk management, and internal control had 3 sectors leading i.e. Energy & Petroleum, Construction & Allied as well as Investment & Investment Services sectors. The Insurance sector performed well on the Board Operations and Control principle while the Manufacturing & Allied/Automobiles & Accessories sector led on the commitment to good corporate governance principle, and
- Investment & Investment Services performed best on transparency and disclosure principle. Banking, Energy & Petroleum and Construction & Allied sectors were best performers on the Stakeholder Relations principle.
In its recommendation, the report pointed out the following areas for the issuers to improve on;
- Issuers to demonstrate how they have made their boards and management aware of the Code,
- Issuers to establish mechanisms for managing their relationship with stakeholders,
- Issuers to establish a formal dispute resolution process for internal and external disputes,
- Issuers to develop and implement their codes of ethics and conduct, and,
- Issuers to conduct legal and governance audits.
It is our view that good corporate governance is important and goes a long way to enable firms to operate more efficiently, to improve access to capital, mitigate risk and safeguard stakeholders' interests. Kenya’s capital market has in recent years been marred by corporate governance malpractices, which has seen firms such as Kenya Airways, Uchumi Supermarkets, and Mumias Sugar Company’s bottom-lines deteriorate, causing their share prices to plunge. We expect the recommendations from CMA to drive better practices, by serving as a benchmark against which firms will be able to check themselves and improve where they fail to match.
Universe of Coverage
Below is a summary of our universe of coverage:
|
Banks |
Price at 18/10/2019 |
Price at 25/10/2019 |
w/w change |
YTD Change |
Target Price* |
Dividend Yield |
Upside/ Downside** |
P/TBv Multiple |
Recommendation |
|
I&M Holdings |
49.0 |
45.2 |
(7.8%) |
5.9% |
79.8 |
7.8% |
84.5% |
0.8x |
Buy |
|
Sanlam |
17.1 |
17.1 |
0.0% |
(14.8%) |
29.0 |
0.0% |
70.1% |
0.8x |
Buy |
|
Diamond Trust Bank |
117.5 |
115.0 |
(2.1%) |
(27.2%) |
175.6 |
2.3% |
55.0% |
0.6x |
Buy |
|
KCB Group*** |
43.3 |
44.1 |
2.0% |
12.1% |
61.4 |
8.3% |
47.5% |
1.1x |
Buy |
|
Equity Group*** |
38.0 |
40.0 |
5.1% |
7.5% |
53.0 |
5.3% |
38.0% |
1.6x |
Buy |
|
CIC Group |
3.0 |
3.0 |
(1.0%) |
(20.5%) |
3.8 |
4.2% |
32.2% |
1.2x |
Buy |
|
Britam |
7.1 |
6.9 |
(2.3%) |
(30.2%) |
8.8 |
4.9% |
32.1% |
0.7x |
Buy |
|
Kenya Reinsurance |
3.0 |
3.0 |
1.0% |
(17.2%) |
3.8 |
5.2% |
29.0% |
0.1x |
Buy |
|
Co-operative Bank*** |
12.5 |
12.5 |
0.4% |
(16.8%) |
15.0 |
8.4% |
28.4% |
1.0x |
Buy |
|
Jubilee holdings |
343.3 |
350.0 |
2.0% |
(13.5%) |
418.5 |
2.6% |
22.1% |
1.0x |
Buy |
|
Barclays Bank*** |
11.4 |
11.5 |
1.3% |
0.0% |
12.6 |
10.0% |
19.4% |
1.4x |
Accumulate |
|
NIC Group |
32.0 |
33.6 |
5.2% |
7.7% |
37.9 |
3.3% |
16.1% |
0.6x |
Accumulate |
|
Liberty Holdings |
9.7 |
10.4 |
6.8% |
(24.7%) |
11.3 |
5.1% |
13.8% |
0.7x |
Accumulate |
|
Standard Chartered |
195.8 |
198.5 |
1.4% |
2.7% |
208.0 |
6.3% |
11.0% |
1.5x |
Accumulate |
|
Stanbic Holdings |
99.5 |
101.8 |
2.3% |
5.8% |
100.5 |
6.1% |
4.9% |
1.1x |
Lighten |
|
HF Group |
6.8 |
6.7 |
(1.8%) |
27.1% |
2.8 |
0.0% |
(58.8%) |
0.2x |
Sell |
|
*Target Price as per Cytonn Analyst estimates **Upside / (Downside) is adjusted for Dividend Yield ***Banks in which Cytonn and/or its affiliates are invested in |
|||||||||
We are “Positive” on equities for investors as the sustained price declines has seen the market P/E decline to below its historical average. We expect increased market activity, and possibly increased inflows from foreign investors, as they take advantage of the attractive valuations, to support the positive performance.
- Industry Report
During the week, Jones Lang LaSalle (JLL), a real estate management services firm, released its Q4’2019 Spotlight on Africa Report, which tracks vital trends impacting hotel investment in Sub-Saharan Africa. According to the report, hotel investors in Sub-Saharan Africa are likely to attract investment for hotel projects that are set up as mixed-use developments. This is as transactions for mixed-use properties increased by 42.0% whereas other sectors such as Office, Retail, Industrial and Hotels, as single-use, declined by 4.0%, 20.0%, 6.0%, and 18.0%, respectively.
Mixed-Use Developments (MUD’s) allow for risk diversification by including alternative types of property in one development. Residential developments are also increasing in prevalence as they provide up-front cash inflows and a more predictable source of revenue as compared to a hotel alone. The report echoes our sentiments as in the 2018 Mixed-Use Development Report, according to which, themes within MUD’s recorded better performance compared to single-use developments. For instance, office and residential themes in MUD’s registered higher rental yields by 0.3% and 0.6% points, respectively.
The table below shows MUD performance against other single-use developments in 2018:
|
MUD's Performance in Comparison to Single-use Developments Performance 2018 |
|||
|
Themes |
MUD Themes Average Rental Yield % |
Market Average Rental Yield % |
Rental Yield Difference |
|
Retail |
8.5% |
9.5% |
(1.0%) |
|
Offices |
8.2% |
7.9% |
0.3% |
|
Residential |
5.6% |
5.0% |
0.6% |
|
Average |
7.4% |
7.5% |
(0.1%) |
|
· Office space and residential units in MUDs have higher rental yields at 8.2% and 5.6% compared to the market average at 7.9% and 5.0% mainly attributed to higher rents and prices charged due to amenities and facilities provided |
|||
Source: Cytonn Research 2018
Investors are therefore likely to be attracted to mixed-use developments due to their enhanced performance which is driven by:
- Operational Synergies - The various themes in a mixed-use development complement each other. For instance, building residents will create a ready market for retail services while firms occupying office space are potential clients for hotel, restaurant and conferencing space in the hotel. As a result, improvement of the performance of one theme leads to better performance in other themes,
- Risk Diversification - Having multiple components in the development creates multiple revenue streams that help to diversify the risk of a project. In case uptake for one of the themes is low, the developer or property manager will continue to receive revenues from the other themes. The developer can also opt to alter uses, depending on each theme’s performance; for example, underperforming residential units can be serviced or furnished apartments, and vice versa, and,
- Potential for Higher Occupancies – MUD’s create an environment where occupants can live, work, play and invest all in one location, hence reducing time and cost incurred while commuting. By creating convenience, therefore, MUD’s attract demand from both prospective homeowners and corporations
According to the report, the Sub-Saharan hotel industry Africa is characterized by a lack of consistency with volatile demand conditions and a low supply base expected to grow at 2.4% compound annual increase over the next three-years. The weak demand in the sector is attributed to elections in some nations such as Senegal, slow economic growth, regulatory changes that have negatively impacted business and tourism, and inaccessible funding which is also expensive. The Kenyan hotel sector, on the other hand, continues to perform well driven by a robust and diversified economy. However, the sector experienced weak occupancy rates which were worsened by the Dusit D2 terror attacks in January 2019.
We retain a positive outlook for the hospitality sector driven by differentiated concepts by investors, improved security and hotel standards with the entry of global hotel brands while existing hotels refurbish their developments.
The World Bank released its ‘Doing Business Report 2020’, a report that compares business regulation across economies from 190 countries. The major key take-outs were as follows:
- Kenya’s ranking in terms of property registration dropped twelve positions to #134 in 2019 from #122 in 2018 attributed to additional payment slip generation, and increased online consent application and title search fees. The drop in ranking was despite a faster property registration and land-related processes aided the government’s launch of the e-Citizen portal digitization system,
- Kenya’s ranking in terms of dealing with construction permits, improved twenty-three ranks to position #105 in 2019 from position #128 in 2018 attributed to increased transparency by making building permit requirements publicly available online;
According to the report, Kenya’s overall rank improved five positions to #56 in 2019 from #61 in 2018 with the largest contributing factors being:
- Automation of systems such as property registration and land search,
- Ease of obtaining credit,
- Protecting minority investors, and
- Resolving insolvency.
The improvements in processes and economic reforms are a positive step towards improving the country’s investment landscape and establishing it as a preferred investment destination. However, recent concerns the delay in the processing of construction permits as raised by the Architectural Association of Kenya (AAK) would have a negative impact on our ranking. The delays continue to affect developers by prolonging project implementation timelines and increasing development costs.
- Residential Sector
During the week, Tilisi Developments Plc, a real estate developer, announced that they are set to begin construction of 186 high-end villas on a 41-acre parcel of land within the Tilisi masterplan development located in Rironi, Limuru area. The project will consist of 3-bed, 4-bed and 5-bed villas of 212 SQM, 232 SQM, and 585 SQM, and priced at Kshs 18.5 mn, Kshs 20.0 mn and Kshs 59.0 mn, respectively, translating to an average of Kshs 91,442 per SQM. In comparison to the Redhill/Sigona area market average of Kshs 105,218 according to the NMA Residential Report 2018/2019, the prices offered are 13.1% lower than the market average.
The area remains attractive to investors driven by;
- The improving infrastructure such as the ongoing upgrading of Waiyaki Way to a six-lane highway, which is expected to ease of accessibility to areas such as Limuru on completion, and
- The relatively affordable prices of development land in Limuru area compared to Nairobi suburbs areas and satellite towns, which according to our research, recorded average prices of approximately Kshs 20.0 mn per acre in Limuru Town compared to the market average of Kshs 24.0 mn and Kshs 81.0 mn per acre for satellite towns and low-rise Nairobi suburbs, respectively. Masterplanned developments are mixed-use developments built in a rural or undeveloped area that offer varying themes such as residential, retail, industrial, education facilities, etc.
The table below shows the performance of detached Upper Mid-End suburbs in 2018/2019:
(All Values in Kshs Unless Stated Otherwise)
|
Detached Performance 2018/2019 (Upper Mid-End Suburbs) |
|||||||
|
Area |
Price per SQM |
Rent per SQM |
Annual Uptake |
Occupancy (%) |
Rental Yield |
Y/Y Price Appreciation |
Total Returns |
|
Loresho |
146,540 |
575 |
17.5% |
94.6% |
4.5% |
1.7% |
6.2% |
|
Runda Mumwe |
158,932 |
662 |
26.1% |
83.6% |
4.3% |
1.5% |
5.8% |
|
South C |
120,928 |
494 |
23.8% |
92.5% |
4.6% |
(0.7%) |
3.8% |
|
Redhill & Sigona |
105,218 |
367 |
21.1% |
77.5% |
3.3% |
0.3% |
3.6% |
|
Langata |
142,183 |
556 |
13.0% |
97.2% |
4.7% |
(1.7%) |
3.0% |
|
Lavington |
180,021 |
555 |
27.3% |
79.4% |
3.3% |
(0.3%) |
3.0% |
|
Average |
142,303 |
535 |
21.5% |
87.5% |
4.1% |
0.1% |
4.2% |
|
· Detached units in the upper mid-end suburbs registered average returns of 4.2%, 0.5% points lower than the residential market average of 4.7% · Loresho recorded the highest returns at 6.2%, while Langata and Lavington recorded the lowest returns at 3.0% each · Redhill& Sigona recorded annual uptake and total returns of 21.1% and 3.6% in 2018/2019, respectively |
|||||||
Source: Cytonn Research 2019
Due to rapid population growth and urbanization, we expect to see developers continue shifting urban development from cities to rural or undeveloped areas with availability of large tracts of land at affordable prices.
- Hospitality Sector
During the week, the Kenyan hospitality sector received global recognition as seven hotels received various awards at the World Luxury Hotel Awards 2019 in Finland. The winners from their respective categories are as shown below:
|
World Luxury Hotel Brand Award Winners 2019 |
||
|
|
Hotel |
Award Category |
|
1. |
Lantana Galu Beach |
Luxury Family Beach Resort |
|
2. |
Maiyan |
Luxury Private Pool Villa |
|
3. |
Sankara Nairobi, Autograph Collection |
Luxury Boutique Hotel |
|
4. |
Sarova Stanley |
Luxury City Hotel |
|
5. |
Sarova Whitesands Beach Resort & Spa |
Luxury Beach Resort |
|
6. |
Sun Multinational |
Luxury Hotel Group |
|
7. |
Elewana Kifaru House |
Luxury Hotel Best Scenic Environment |
Source: World Luxury Hotel Brands Awards 2019
The awards are an indication of the attractiveness of the sector driven by;
- Concerted marketing efforts by the government and private sector,
- Improving air transport,
- Improved hotel standards with the entry of global hotel brands, and
- The increased number of inbound international visitors.
According to the Kenya National Bureau of Statistics (KNBS), Leading Economic Indicator August 2019, international visitor arrivals in the first nine months of the year were highest in 2019 since 2016, coming in at 1.02 mn, 5.4% higher compared to 0.96 mn last year and 75.6% higher compared to 0.58 mn in 2016.
Technology has continued to be a disruption in the investment industry, both in Kenya and globally, thus, following our Fintech Impact on Kenya’s Financial Services Industry report on technology in financial services, in this week’s report we focus specifically on investments. One of the most tangible disruptions is the ability that technology provides to make investments easier to access, be it through a website or mobile phone. From the comfort of your phone, you can now access an investment company’s website or application, make an investment or withdraw an investment. This was not possible a few years ago where you had to visit a brick and mortar branch to create an investment account and manage your account. All these aspects of modern investing are relatively recent disruptive innovations being used by firms to remain competitive in a market where clients are not only more knowledgeable but need things done much faster and more efficiently. However, Kenya needs to accelerate adoption of technology in the investments sector; for example, technology is present in mobile banking, mobile money through Mpesa, government bond issuance through M-Akiba, but investment instruments like Unit Trust Funds and Pensions are yet to digitize and could do a better job adopting technology.
In this week’s focus note we aim to analyze how technology has impacted the investment industry. As such, we shall look at the following:
- Technology Factors Shaping the Investment Industry in Kenya, and,
- Outlook on the Future of Technology and the Investment Industry.
Section I: Technology Factors Shaping the Investment Industry in Kenya
The Kenyan investment industry is seeing its historical operating model disrupted by technology and regulations. Currently, the investment industry in Kenya remains very manual and at the dawn of technological revolution, there’s need to accelerate digitization and move transactions to mobile/ electronic channels. From Initial Public Offers (IPO) to Mergers and Acquisitions (M&A), to research and trading, investment firms are getting leaner, smaller, and reinventing their core businesses will help them keep up with innovations. In this section, we highlight the three key factors that are shaping the Kenyan investment landscape.
- Mobile Phone and Internet Penetration
The ICT sector in Kenya has experienced rapid growth, from 10.0% in 2017 to 22.0% in 2018, and contributed to 1.6% of the total GDP in 2018, according to the Jumia Mobile Report 2019. The report highlights a 91.0% mobile subscription penetration rate with an internet connectivity penetration rate of 84.0%. That means 43.3 mn of the Kenyan population has access to the internet.
|
Mobile Penetration in Kenya |
||
|
Category |
Kenya |
Africa |
|
Total Population |
51.6 mn (Ave. Age- 18 years |
1.3 bn (Ave. Age- 20 years |
|
GDP Growth |
5.7% (Established in 2018) |
3.5% (Established in 2018) |
|
Mobile Subscriptions |
46.9 mn (91.0% Penetration) |
1.1 bn (80.0% Penetration) |
|
Internet Users |
43.3 mn (84.0% Penetration) |
473.0 mn (36.0% Penetration) |
|
Active Social Media Users |
8.2 mn (16.0% Penetration) |
216.0 mn (17.0% Penetration) |
Source: Jumia Mobile Report 2019
The table above shows mobile, internet and social media penetration in Kenya compared to the whole of Africa. It goes to show that the internet, mobile and social media are key channels that a business cannot avoid to use in targeting clients, especially in Kenya.
Increasingly, mobile banking has become the most preferred channel for users at 49.0%, while the traditional forms e.g. ATMs rated at 16.0%, according to the Kenya Bankers Customer Service Survey Q4’2018. This goes to show the disruptive effects of technology on client preference relative to the brick and mortar model.
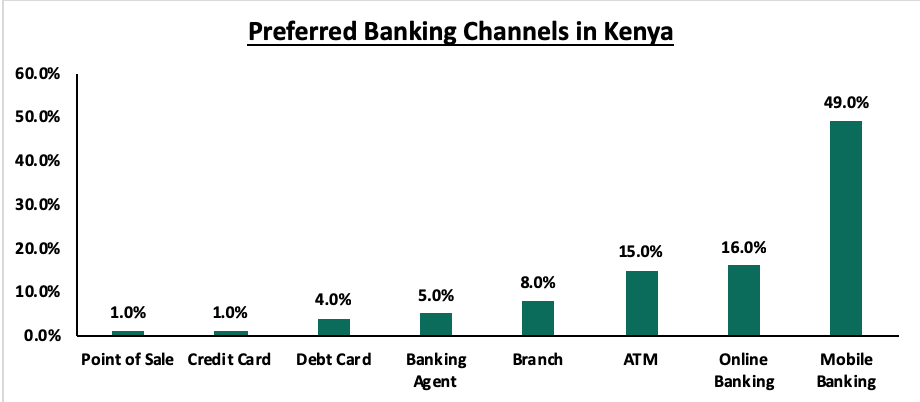
Source: Customer Service Survey Quarter Four 2018
Some of the investment companies in Kenya e.g. Britam, Cytonn, CIC Group to mention a few have capitalized on this disruption to improve how they interact with their clients. They have done this through interactive mobile applications that enable their clients to invest, withdraw and transfer funds easily without manual intervention. Other firms have gone a notch higher and utilized the USSD (Unstructured Supplementary Service Data) platform to target the feature phone (a mobile phone that incorporates features such as the ability to access the Internet and store and play music but lacks the advanced functionality of a smartphone) users as they expand into the retail market space.
- Mobile Money Penetration
Mobile money is a technology that allows people to receive, store and spend money using a mobile phone. It's sometimes referred to as a 'mobile wallet'. A report released by the Communication Authority of Kenya covering April to June 2019 showed that the number of total active mobile money subscriptions was at 32.6 million. The mobile money subscriptions represent 62.5% of the total mobile subscriptions, which stands at 52.2 million, a growth of 5.2% from Quarter 4, 2018. Investment firms in Kenya are adapting their investing methods to allow mobile money options due to increased adoption. This makes it flexible for investors to invest and withdraw money easily. M-Akiba (M – mobile, Akiba – savings in Kiswahili), is a Kenyan government bond that was launched in 2017 and is accessible through the mobile phone. It is a three-year bond with an initial minimum investment of Kshs 3,000 and offers an interest rate of 10.0% p.a. Although the investments in the initial launch did not meet the expected target of Kshs 1 bn, the post-issuance study by Financial Sector Deepening Kenya found that the product was able to attract a new client segment interested in the Kenyan government bond. 85% of the investors had never bought a bond before and they were distributed across virtually all 47 counties. All this was made possible due to the mobile money penetration in the country.
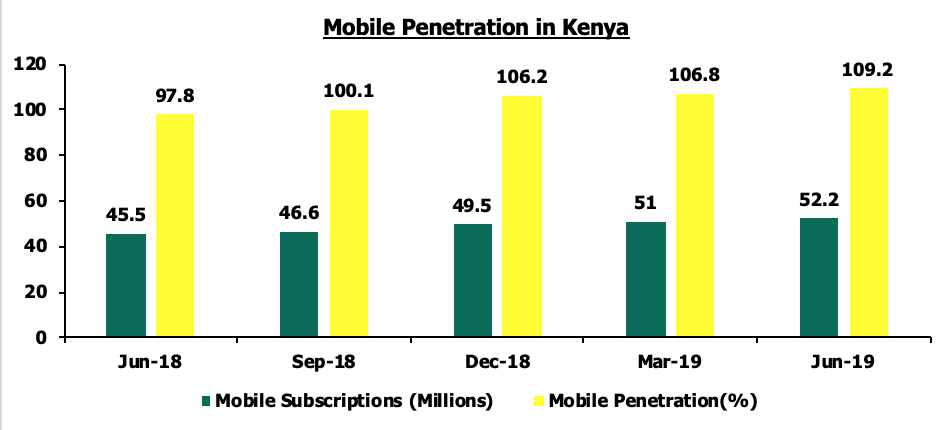
Source: Communication Authority of Kenya, Operator’s Returns
- Big Data and Research
Big data is a massive volume of both structured and unstructured data that's so large it is difficult to process using traditional techniques. It has had a lot of influence on how investment firms make decisions as well as create better client experiences. With big data, the firms can get insights into their client datasets as well as customize products, facilitate loss prevention and improve their pricing accuracy. There is plenty of data in the investments industry. The firms must collect, store, and analyze large amounts of data and thus, leveraging on Big data, they can learn more about their clients and improve their investment operations thereby driving new revenues. Big data is helpful in segmenting the clients, identifying and preventing fraud, risk modeling, client retention and identifying the main channels of transactions.
In summary, the above 3 factors tell us:
- Increased innovation around mobile applications as a tool for customer interaction and differentiated business models will set apart the winners from the losers in the industry.
- Integration with mobile payment platforms to offer clients an easy way to invest and access their funds will allow you to target new client segments.
- Lastly, using big data to analyze and pick trends from the volumes of client data that investment firms collect, will allow them to keep improving their customer experience and offer targeted products in the market.
Section III: Outlook on the Future of Technology and the Investment Industry
Technology and evolving customer behaviors are driving change across financial services. In the Kenyan investments environment, remaining competitive means adapting to these changes, embracing new thinking, and leading the charge to innovate. Below are the technology areas we feel will drive the investment market in Kenya;
- Improved Client Experience: This will remain a priority for investment firms. Removing any friction process that involves manual work will be a key focus. Allowing clients to set up accounts in seconds, invest and withdraw anytime as well as offer value-added services on mobile will be a key differentiator.
- Digital and Mobile Experience: We expect to see new innovations in mobile services as investment firms adopt the “digital-first” strategy. Mobile technology is a major game-changer for financial inclusion, and the disruptions such as mobile wallets will become a key thing for investment firms. The world’s largest money market fund Yu’e Bao has focused on this strategy and seen its Assets Under Management grow 80 times for the 13 money market funds on its online cash management platform. In the next few years, if an investment firm does not embrace a digital structure, its business model will surely fail.
- Change in Company Structures: From Goldman Sachs, Lloyd’s of London, JPMorgan and more, investment firms are making big bets on technology innovation while bracing for the impact of the growing FinTech sector. Now seeing themselves as technology groups, rather than investment firms, they are recruiting more Artificial Intelligence (AI) talent and diving deep into data offerings. These shakedowns will continue happening as investment firms balance between investment analysts and technologists in decision-making.
- Artificial Intelligence (AI) and Robotics: Investment firms already have huge chunks of data that their existing employees can do little about. Cognitive technology can handle these large chunks of data easily and provide business insights by creating connections amongst the datasets. Investment firms will advance the way they use technology to create Mergers and Acquisitions (M&A) prediction models, perform due diligence processes and automate the majority of their workflows. There are limitless possibilities when it comes to AI and investment firms will have to be keen to discover the potential. With the disruption caused by internet penetration in Kenya, AI is expected to do the same across several sectors amongst those in the investment industry. Just like all innovations, AI poses a threat and opportunity.
- Internet of Things (IoT): The Internet of Things describes the network of physical objects—“things”—that are embedded with sensors, software, and other technologies for the purpose of connecting and exchanging data with other devices and systems over the internet. The integration of IoT capabilities within the financial services industry is still in its early stages in Kenya, but many believe digital applications represent the future of investing. Investment firms who will deploy IoT shall allow their clients to make contactless investments and track their returns with greater accuracy while giving the investment firms huge client data sets that they can analyze to predict trends.
- Cybersecurity: The development of data science and data mining technology has driven an evolving debate on protection and privacy, which has increasingly translated into legislation. The new General Data Protection Regulation (GDPR) standards for processing, storing, and securing the personal data of EU citizens has had a far-reaching influence in the various markets with the threat of major fines if you do not adhere. Enabling innovation and constructive use of data and protecting citizens from breaches or cybercrime linked to weak data laws are fine balances that investment firms have to consider even as they create their competitive edge riding on technological advancements.
In closing, we expect the investment industry to continue adopting new technologies into their processes and create a competitive advantage in the market as they strive to give their clients above-average market returns.
Disclaimer: The views expressed in this publication are those of the writers where particulars are not warranted. This publication is meant for general information only and is not a warranty, representation, advice or solicitation of any nature. Readers are advised in all circumstances to seek the advice of a registered investment advisor.

- Talk to us
- Kenya
- P.O Box 20695 - 00200, Nairobi, Kenya
- Cell +254709101200
- Tel +254709101200
- WhatsApp +254741676635
- United States
- +254709101200
- DOWNLOAD OUR APP
-


- Kenya
- 8th Floor, Pinetree Plaza, Kaburu Drive, Ngong Road, Nairobi, Kenya
- USA
- Suite 1150, 1775 Eye Street NW, USA, Washington DC 20006, USA
- Investments
- High Yield
- Private Equity
- Real Estate
- Real Estate
- RiverRun Estates
- Cytonn Towers
- The Ridge
- Taraji Heights
- The Alma