Ghana’s Debt Restructuring, & Cytonn Weekly #01/2023
By Cytonn Research, Jan 8, 2023
Executive Summary
Fixed Income
During the week, T-bills were oversubscribed, for the first time in three weeks, with the overall subscription rate coming in at 131.7%, significantly up from 17.9% recorded the previous week. Investor’s preference for the 91-day paper persisted as they sought to avoid duration risk, with the paper receiving bids worth Kshs 19.3 bn against the offered Kshs 4.0 bn, translating to a subscription rate of 482.9%, up from 54.5% recorded the previous week. The subscription rates for the 364-day and the 182-day papers also increased to 44.8% and 78.0% from 16.9% and 4.3% recorded the previous week, respectively. The yields on the government papers were on an upward trajectory, with the yields on the 364-day, 182-day and 91-day papers increasing by 6.1 bps, 1.3 bps and 2.3 bps to 10.4%, 9.8% and 9.4%, respectively;
Additionally, during the week, Stanbic bank released its monthly Purchasing Manager’s Index (PMI), highlighting that the index for the month of December 2022 picked up to a three-month high of 51.6, from 50.9 in November 2022, pointing towards a sustained improvement in the business environment for a fourth consecutive month;
Equities
During the week, the equities market recorded mixed performance with NASI declining by 0.5%, while NSE 20 and NSE 25 gained by 1.7% and 0.7%, respectively, taking the YTD performance to a loss of 0.4% for NASI, and gains of 1.8% and 0.5% for NSE 20 and NSE 25, respectively. The equities market performance was mainly driven by losses recorded by large cap stocks such as Safaricom and ABSA Bank Kenya of 2.7% and 2.0%, respectively. The losses were however mitigated by gains recorded by other large cap stocks such as Standard Chartered Bank Kenya (SCBK), Diamond Trust Bank Kenya (DTB-K) and EABL of 5.4%, 4.0% and 3.7%, respectively;
Real Estate
During the week, the Finance Act 2022, became effective as of 1st January 2023, with the Capital Gains Tax (CGT) chargeable on net gains upon transfer of property tripling to 15.0% from the 5.0% previously chargeable. In the Real Estate Investment Trusts (REITs) segment, Fahari I-REIT closed the week trading at an average price of Kshs 6.7 per share on the Nairobi Securities Exchange, a 3.1% increase from Kshs 6.5 per share recorded the previous week. On the Unquoted Securities Platform as at 30th December 2022, Acorn D-REIT and I-REIT closed the week trading at Kshs 23.9 and Kshs 20.9 per unit, respectively, a 19.4% and 4.4% gain for the D-REIT and I-REIT, respectively, from the Kshs 20.0 inception price;
Focus of the Week
Debt sustainability has been a cause for concern within the Sub-Saharan Africa (SSA) region and has been aggravated by a slow post pandemic recovery, elevated inflationary pressures and a backdrop of depreciating currencies in 2022. According to the Joint World Bank and International Monetary Fund (IMF) Debt Sustainability Analysis (DSA) as of September 2022, eight countries in the region are identified as in debt distress, 14 at high risk of debt distress, and, 16 at moderate risk of debt distress. Key to note, according to the Bloomberg Global default risk index 2022, for the SSA countries, Ghana and Kenya are ranked 2nd and 6th , respectively, pointing towards increased perceived risks on their debt sustainability. Debt distress in the SSA has been mainly on the back of poor fiscal and monetary policies, as well as borrowing to deal with the adverse effects of the COVID-19 pandemic in most economies resulting to its debt to GDP ratio almost doubling to 57.0%, 7.0% points above the IMF recommended threshold for developing economies at the end of 2021 from 28.5% recorded in 2011. Ghana, like many other developing countries, has accumulated high levels of public debt to a point of unsustainability, with its debt to GDP ratio coming in at 77.5% as of May 2022. As a result, the government of Ghana initiated a debt restructuring in December 2022, in order to restore its capacity to service its public debt as well as improve the local business environment;
Investment Updates:
- Weekly Rates:
- Cytonn Money Market Fund closed the week at a yield of 10.87%. To invest, dial *809# or download the Cytonn App from Google Playstore here or from the Appstore here;
- Cytonn High Yield Fund closed the week at a yield of 13.90% p.a. To invest, email us at sales@cytonn.com and to withdraw the interest, dial *809# or download the Cytonn App from Google Playstore here or from the Appstore here;
- We continue to offer Wealth Management Training every Wednesday, from 9:00 am to 11:00 am, through our Cytonn Foundation. The training aims to grow financial literacy among the general public. To register for any of our Wealth Management Trainings, click here;
- If interested in our Private Wealth Management Training for your employees or investment group, please get in touch with us through wmt@cytonn.com;
- Any CHYS and CPN investors still looking to convert are welcome to consider one of the five projects currently available for assignment, click here for the latest term sheet;
- Cytonn Insurance Agency acts as an intermediary for those looking to secure their assets and loved ones’ future through insurance namely; Motor, Medical, Life, Property, WIBA, Credit and Fire and Burglary insurance covers. For assistance, get in touch with us through insuranceagency@cytonn.com;
- Cytonnaire Savings and Credit Co-operative Society Limited (SACCO) provides a savings and investments avenue to help you in your financial planning journey. To enjoy competitive investment returns, kindly get in touch with us through clientservices@cytonn.com;
Real Estate Updates:
- For an exclusive tour of Cytonn’s real estate developments, visit: Sharp Investor's Tour, and for more information, email us at sales@cytonn.com;
- Phase 3 of The Alma is now ready for occupation and the show house is open daily. To rent please email properties@cytonn.com;
- We have 8 investment-ready projects, offering attractive development and buyer targeted returns; See further details here: Summary of Investment-ready Projects;
- For Third Party Real Estate Consultancy Services, email us at rdo@cytonn.com;
- For recent news about the group, see our news section here;
Hospitality Updates:
- We currently have promotions for Staycations. Visit cysuites.com/offers for details or email us at sales@cysuites.com;
Money Markets, T-Bills Primary Auction:
During the week, T-bills were oversubscribed, for the first time in three weeks, with the overall subscription rate coming in at 131.7%, significantly up from 17.9% recorded the previous week. Investor’s preference for the 91-day paper persisted as they sought to avoid duration risk, with the paper receiving bids worth Kshs 19.3 bn against the offered Kshs 4.0 bn, translating to a subscription rate of 482.9%, up from 54.5% recorded the previous week. The subscription rates for the 364-day and the 182-day papers also increased to 44.8% and 78.0% from 16.9% and 4.3% recorded the previous week, respectively. The yields on the government papers were on an upward trajectory, with the yields on the 364-day, 182-day and 91-day papers increasing by 6.1 bps, 1.3 bps and 2.3 bps to 10.4%, 9.8% and 9.4%, respectively. The Government accepted a total of Kshs 31.4 bn worth of bids out of the Kshs 31.6 bn worth of bids received, translating to an acceptance rate of 99.4%.
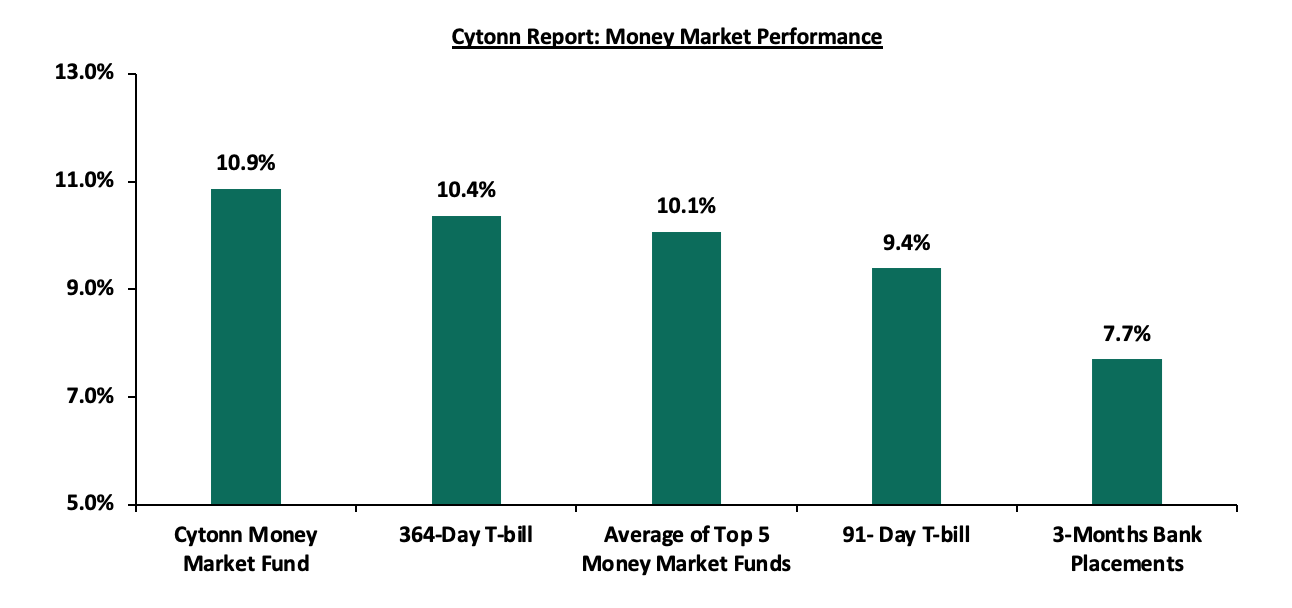
In the money markets, 3-month bank placements ended the week at 7.7% (based on what we have been offered by various banks), while the yield on the 364-day T-bill and 91-day T-bill increased by 6.3 bps and 2.3 bps to 10.4% and 9.4%, respectively. The average yield of the Top 5 Money Market Funds and Cytonn Money Market Fund remain relatively unchanged at 10.1% and 10.9%, respectively, as recorded the previous week.
The table below shows the Money Market Fund Yields for Kenyan Fund Managers as published on 6th January 2023:
|
Cytonn Report: Money Market Fund Yield for Fund Managers as published on 6th January 2023 |
||
|
Rank |
Fund Manager |
Effective Annual Rate |
|
1 |
Cytonn Money Market Fund (dial *809# or download Cytonn App) |
10.9% |
|
2 |
Kuza Money Market fund |
10.0% |
|
3 |
Zimele Money Market Fund |
9.9% |
|
4 |
Apollo Money Market Fund |
9.8% |
|
5 |
NCBA Money Market Fund |
9.8% |
|
6 |
GenCap Hela Imara Money Market Fund |
9.8% |
|
7 |
Nabo Africa Money Market Fund |
9.6% |
|
8 |
Sanlam Money Market Fund |
9.6% |
|
9 |
Madison Money Market Fund |
9.5% |
|
10 |
Old Mutual Money Market Fund |
9.5% |
|
11 |
Dry Associates Money Market Fund |
9.4% |
|
12 |
Co-op Money Market Fund |
9.2% |
|
13 |
CIC Money Market Fund |
9.1% |
|
14 |
AA Kenya Shillings Fund |
9.0% |
|
15 |
British-American Money Market Fund |
9.0% |
|
16 |
ICEA Lion Money Market Fund |
8.7% |
|
17 |
Orient Kasha Money Market Fund |
8.6% |
|
18 |
Absa Shilling Money Market Fund |
8.1% |
|
19 |
Equity Money Market Fund |
5.4% |
Source: Business Daily
Liquidity:
During the week, liquidity in the money markets remained tightened, despite the average interbank rate remaining relatively unchanged at 6.4%. The average interbank volumes traded declined by 35.4% to Kshs 13.8 bn from Kshs 21.3 bn recorded the previous week.
Kenya Eurobonds:
During the week, the yields on Eurobonds were on a downward trajectory with the yield on the 7-year Eurobond issued in 2019 recording the largest decline having declined by 0.3% points to 10.6% from 10.9% recorded the previous week. The table below shows the summary of the performance of the Kenyan Eurobonds as of 5th January 2023;
|
Cytonn Report: Kenya Eurobonds Performance |
||||||
|
|
2014 |
2018 |
2019 |
2021 |
||
|
Date |
10-year issue |
10-year issue |
30-year issue |
7-year issue |
12-year issue |
12-year issue |
|
29-Dec-22 |
12.9% |
10.4% |
10.9% |
10.9% |
10.8% |
9.9% |
|
30-Dec-22 |
12.9% |
10.5% |
10.9% |
10.9% |
10.8% |
9.9% |
|
2-Jan-23 |
12.9% |
10.5% |
10.9% |
10.9% |
10.8% |
9.9% |
|
3-Jan-23 |
13.0% |
10.4% |
10.8% |
10.7% |
10.6% |
9.8% |
|
4-Jan-23 |
12.9% |
10.3% |
10.7% |
10.6% |
10.6% |
9.7% |
|
5-Jan-23 |
12.8% |
10.4% |
10.8% |
10.6% |
10.7% |
9.8% |
|
Weekly Change |
(0.1%) |
(0.1%) |
(0.1%) |
(0.3%) |
(0.1%) |
(0.1%) |
|
MTD Change |
(0.1%) |
(0.1%) |
(0.1%) |
(0.3%) |
(0.1%) |
(0.1%) |
|
YTD Change |
(0.1%) |
(0.1%) |
(0.1%) |
(0.3%) |
(0.1%) |
(0.1%) |
Source: Central Bank of Kenya (CBK)
Kenya Shilling:
During the week, the Kenyan shilling depreciated by 0.1% against the US dollar to close the week at Kshs 123.5, from Kshs 123.4 recorded the previous week, partly attributable to increased dollar demand from importers, especially oil and energy sectors against a slower supply of hard currency. On a year to date basis, the shilling has depreciated by 0.1% against the dollar, adding to the 9.0% depreciation recorded in 2022. We expect the shilling to remain under pressure in 2023 as a result of:
- High global crude oil prices on the back of persistent supply chain bottlenecks coupled with high demand,
- An ever-present current account deficit estimated at 5.5% of GDP in the 12 months to October 2022, same as what was recorded in a similar period in 2021,
- The need for Government debt servicing which continues to put pressure on forex reserves given that 69.3% of Kenya’s External debt was US Dollar denominated as of October 2022, and,
- A continued hike in the USA Fed interest rates in 2022 to a range of 4.25%-4.50% in December 2022 has strengthened the dollar against other currencies following capital outflows from other global emerging markets.
The shilling is however expected to be supported by:
- Improved diaspora remittances standing at a cumulative USD 4.0 bn as of November 2022, representing a 9.7% y/y increase from USD 3.7 bn recorded over the same period in 2021, and,
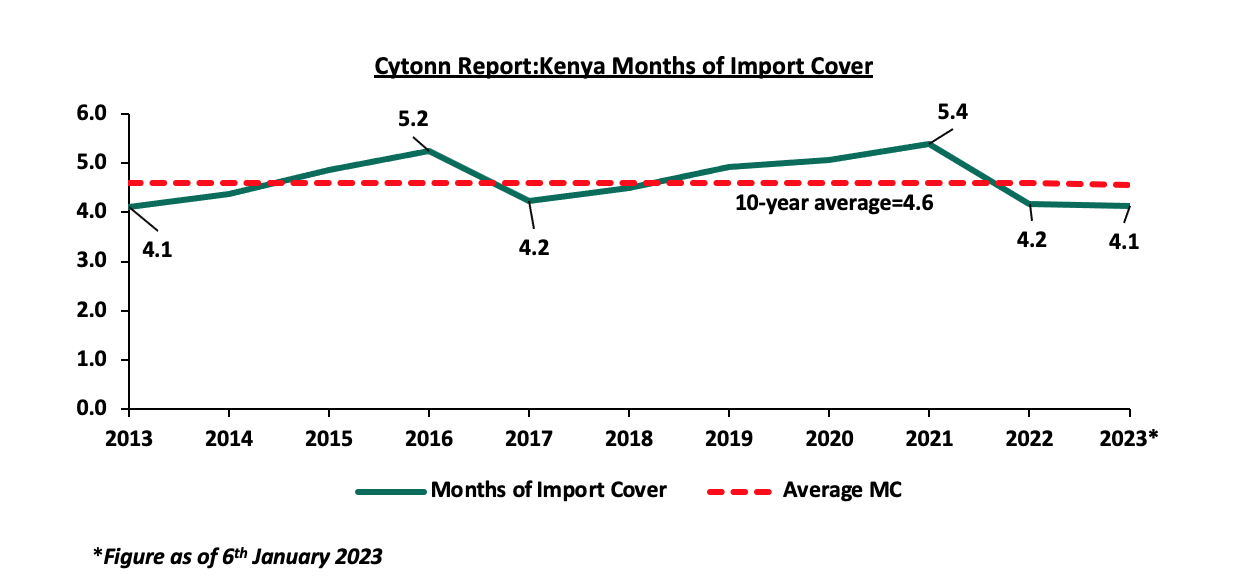
- Sufficient Forex reserves currently at USD 7.4 bn (equivalent to 4.1 months of import cover), which is above the statutory requirement of maintaining at least 4.0-months of import cover. The chart below summarizes the evolution of Kenya months of import cover over the last 10 years;
Weekly Highlight:
Stanbic Bank’s December 2022 Purchasing Manger’s Index (PMI)
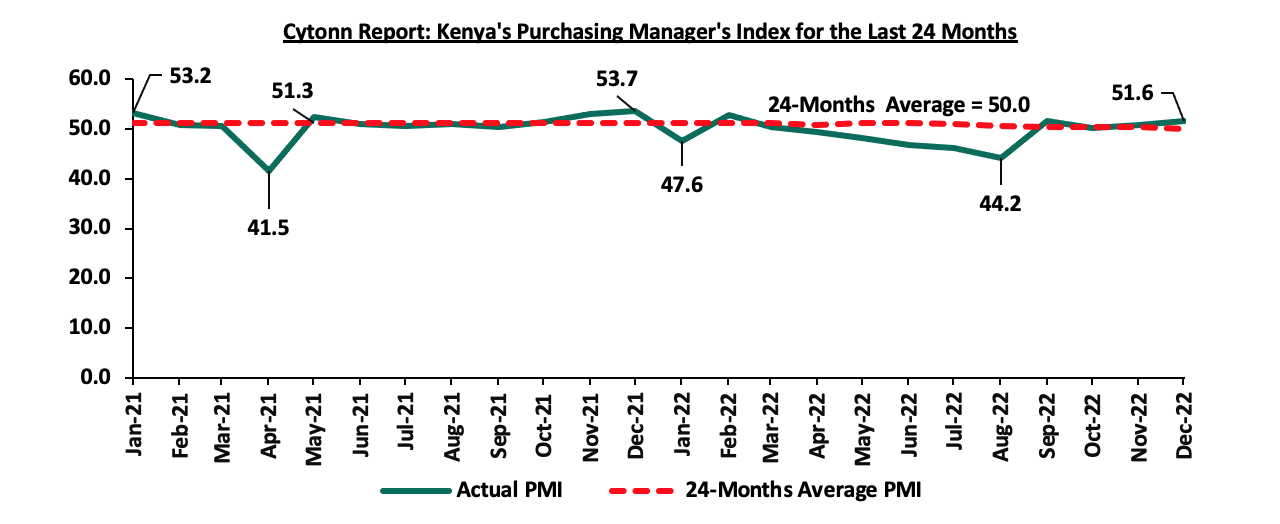
During the week, Stanbic bank released its monthly Purchasing Manager’s Index (PMI), highlighting that the index for the month of December 2022 picked up to a three-month high of 51.6, from 50.9 in November 2022, pointing towards a sustained improvement in the business environment for a fourth consecutive month. The rebound in business activity in the country is linked to factors such as increase in demand, favorable weather conditions and softer price pressures as firms saw input costs increase at the slowest rate in 12 months. This was evidenced by the decline in headline inflation by 0.4% points to 9.1% in December 2022, from 9.5% recorded in November 2022. Additionally, the rate of sales growth sped up to a 10-month high and was solid overall. On sectoral performances, there were variances, with sectors such as agriculture, manufacturing, wholesale and retail recording increase in sales growth while construction and services recorded decline in sales growth. The chart below summarizes the evolution of PMI over the last 24 months.
Despite the improvement in the PMI index in December 2022, we maintain a cautious outlook in the short-term owing to the elevated inflationary pressures which has led to high cost of production. Consumer demand is also of a major concern as prices of commodities remain elevated thus exerting pressure on consumer wallet. Additionally, following the lapse of the 15.0% electricity subsidy in December 2022, the cost of electricity is set to rise in 2023. With fuel and electricity being major input to most business, we expect the cost of production to rise and consequently lead to high commodities prices thus impact consumer demand. Key to note, the improvement in the general business environment in the country is largely pegged on the stability in the global economy.
Rates in the Fixed Income market have remained relatively stable due to the relatively ample liquidity in the money market. The government is 4.9% ahead of its prorated borrowing target of Kshs 302.0 bn having borrowed Kshs 316.8 bn of the Kshs 581.7 bn borrowing target for the FY’2022/2023. We expect sustained gradual economic recovery as evidenced by the revenue collections of Kshs 789.3 bn in the FY’2022/2023 as at the end of November, equivalent to a 36.9% of its target of Kshs 2.1 tn. Despite the performance, we believe that the projected budget deficit of 6.2% is relatively ambitious given the downside risks and deteriorating business environment occasioned by high inflationary pressures. We however expect the support from the IMF and World Bank to ease the need for elevated borrowing and thus help maintain a stable interest rate environment since the government is not desperate for cash. Owing to this, our view is that investors should be biased towards short-term fixed-income securities to reduce duration risk.
Market Performance:
During the week, the equities market recorded mixed performance with NASI declining by 0.5%, while NSE 20 and NSE 25 gained by 1.7% and 0.7%, respectively, taking the YTD performance to a loss of 0.4% for NASI, and gains of 1.8% and 0.5% for NSE 20 and NSE 25, respectively. The equities market performance was mainly driven by losses recorded by large cap stocks such as Safaricom and ABSA Bank Kenya of 2.7% and 2.0%, respectively. The losses were however mitigated by gains recorded by other large cap stocks such as Standard Chartered Bank Kenya (SCBK), Diamond Trust Bank Kenya (DTB-K) and EABL of 5.4%, 4.0% and 3.7%, respectively.
During the week, equities turnover declined by 9.1% to USD 6.2 mn from USD 6.9 mn recorded the previous week, taking the YTD turnover to USD 6.2 mn. Additionally, foreign investors remained net sellers, with a net selling position of USD 2.4 mn, from a net selling position of USD 2.9 mn recorded the previous week, taking the YTD net selling position to USD 2.4 mn.
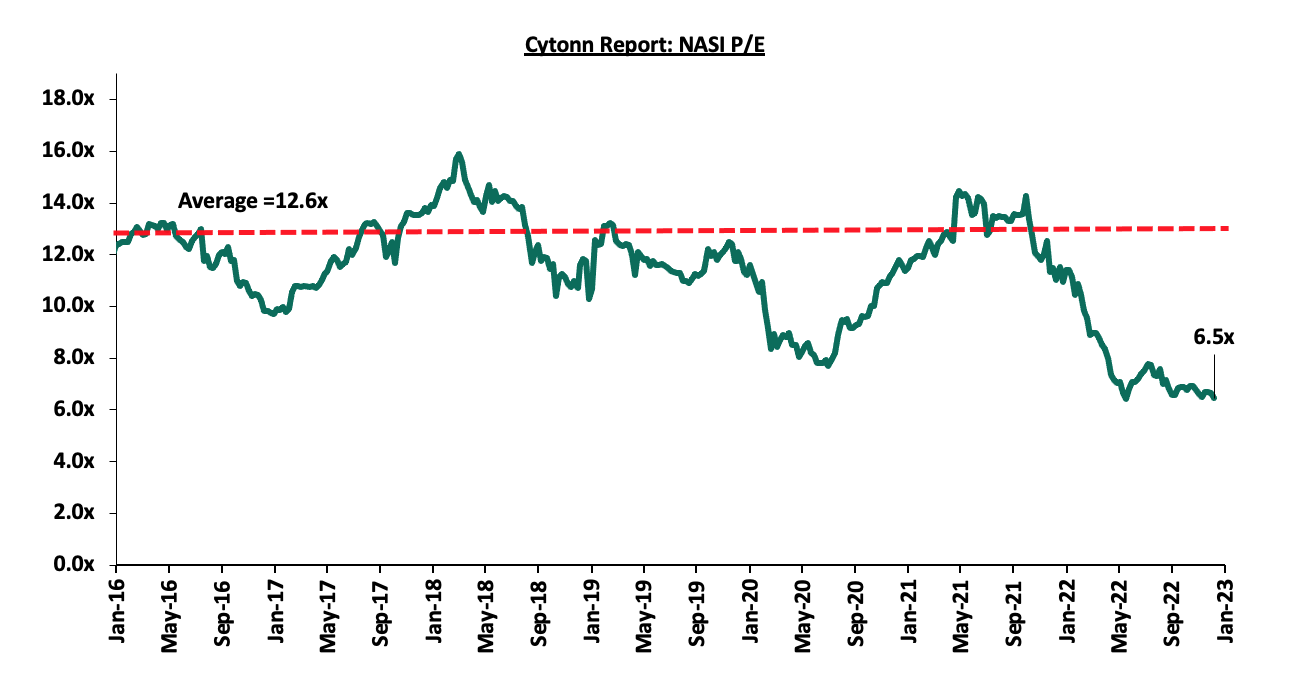
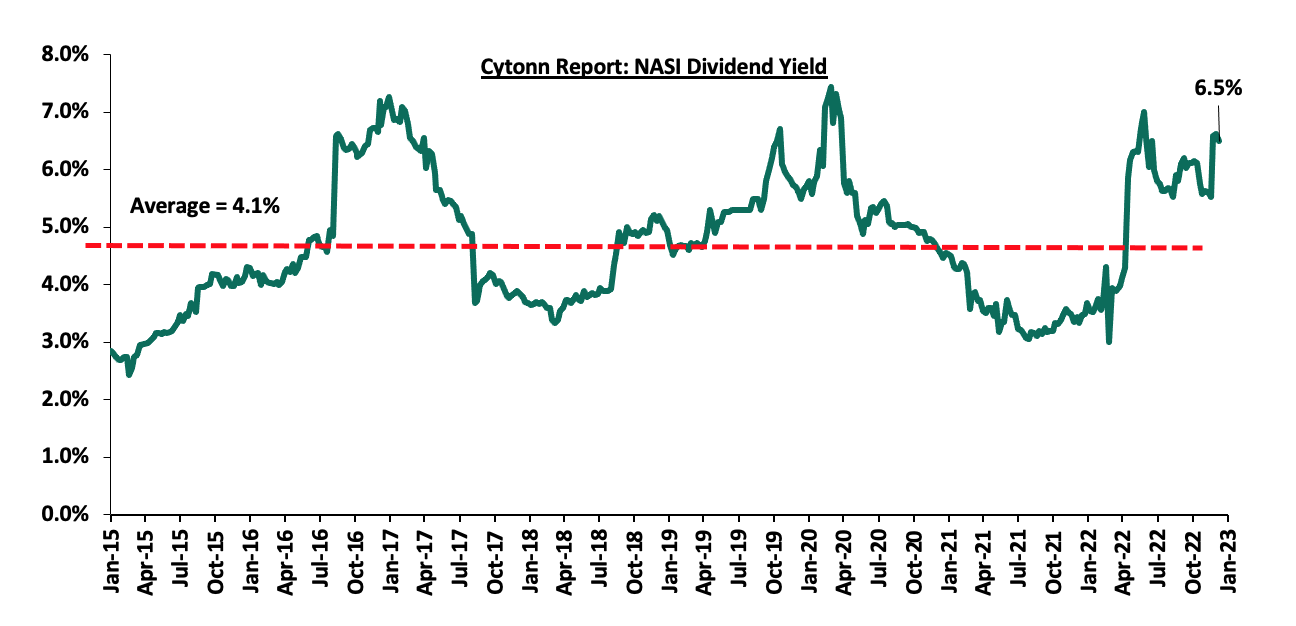
The market is currently trading at a price to earnings ratio (P/E) of 6.5x, 48.7% below the historical average of 12.6x, and a dividend yield of 6.5%, 2.4% points above the historical average of 4.1%. Key to note, NASI’s PEG ratio currently stands at 0.9x, an indication that the market is undervalued relative to its future growth. A PEG ratio greater than 1.0x indicates the market may be overvalued while a PEG ratio less than 1.0x indicates that the market is undervalued. The charts below indicate the historical P/E and dividend yields of the market;
Universe of coverage:
|
Company |
Price as at 30/12/2022 |
Price as at 06/01/2023 |
w/w change |
YTD Change |
Year Open 2023 |
Target Price* |
Dividend Yield |
Upside/ Downside** |
P/TBv Multiple |
Recommendation |
|
Jubilee Holdings |
198.8 |
200.0 |
0.6% |
0.6% |
198.8 |
305.9 |
0.5% |
53.5% |
0.4x |
Buy |
|
Sanlam |
9.6 |
7.9 |
(17.1%) |
(17.1%) |
9.6 |
11.9 |
0.0% |
50.0% |
1.0x |
Buy |
|
Liberty Holdings |
5.6 |
4.7 |
(16.8%) |
(7.5%) |
5.0 |
6.8 |
0.0% |
44.8% |
0.4x |
Buy |
|
KCB Group*** |
38.1 |
39.2 |
2.9% |
2.2% |
38.4 |
52.5 |
7.7% |
41.6% |
0.6x |
Buy |
|
ABSA Bank*** |
12.3 |
12.1 |
(2.0%) |
(1.2%) |
12.2 |
15.5 |
12.4% |
40.7% |
1.0x |
Buy |
|
Kenya Reinsurance |
1.8 |
1.9 |
3.3% |
1.1% |
1.9 |
2.5 |
5.3% |
38.1% |
0.1x |
Buy |
|
Equity Group*** |
44.5 |
45.6 |
2.4% |
1.1% |
45.1 |
58.4 |
6.6% |
34.7% |
1.1x |
Buy |
|
Co-op Bank*** |
12.3 |
12.4 |
0.8% |
2.5% |
12.1 |
15.5 |
8.1% |
32.8% |
0.7x |
Buy |
|
Britam |
5.2 |
5.4 |
3.8% |
3.8% |
5.2 |
7.1 |
0.0% |
31.9% |
0.9x |
Buy |
|
I&M Group*** |
17.0 |
17.4 |
2.4% |
2.1% |
17.1 |
20.8 |
8.6% |
28.3% |
0.4x |
Buy |
|
NCBA*** |
39.4 |
39.7 |
0.8% |
1.8% |
39.0 |
43.4 |
10.7% |
20.2% |
0.9x |
Buy |
|
CIC Group |
2.0 |
2.0 |
0.0% |
2.1% |
1.9 |
2.3 |
0.0% |
19.0% |
0.7x |
Accumulate |
|
Diamond Trust Bank*** |
50.0 |
52.0 |
4.0% |
4.3% |
49.9 |
57.1 |
5.8% |
15.6% |
0.2x |
Accumulate |
|
Stanbic Holdings |
102.0 |
102.3 |
0.2% |
0.2% |
102.0 |
108.6 |
8.8% |
15.1% |
0.9x |
Accumulate |
|
HF Group |
3.2 |
3.1 |
(2.8%) |
(1.6%) |
3.2 |
3.5 |
0.0% |
14.2% |
0.2x |
Accumulate |
|
Standard Chartered*** |
142.8 |
150.5 |
5.4% |
3.8% |
145.0 |
164.8 |
4.0% |
13.5% |
1.0x |
Accumulate |
|
*Target Price as per Cytonn Analyst estimates **Upside/ (Downside) is adjusted for Dividend Yield ***For Disclosure, these are stocks in which Cytonn and/or its affiliates are invested in |
||||||||||
We are “Neutral” on the Equities markets in the short term due to the current adverse operating environment and huge foreign investor outflows, and, “Bullish” in the long term due to current cheap valuations and expected global and local economic recovery.
With the market currently trading at a discount to its future growth (PEG Ratio at 0.9x), we believe that investors should reposition towards value stocks with strong earnings growth and that are trading at discounts to their intrinsic value. We expect the current high foreign investors sell-offs to continue weighing down the economic outlook in the short term.
- Statutory Review
During the week, the Finance Act 2022, became effective as of 1st January 2023, with the Capital Gains Tax (CGT) chargeable on net gains upon transfer of property tripling to 15.0% from the 5.0% previously chargeable. The bill was assented to law by President Uhuru Kenyatta in June 2022, stemming from the amendment of Section 34 (1) of the Income Tax Act. CGT is a final tax levied on the net gains which accrue to a company or an individual on or after 1st January 2015, whether or not the property was acquired before the aforementioned date, upon the transfer of property situated in Kenya. CGT was in existent until 1985 when it was suspended, and later re- introduced in 2015 through an amendment introduced to the Income Tax Act by the Finance Act 2014. The tax had been suspended to allow for the growth of the property market and attract investments. The current amendment will allow the Kenya Revenue Authority (KRA) to collect higher revenues, a move intended to; i) increase tax revenues to help in financing of the FY’2022/2023 Kshs 3.3 tn budget, ii) raise funds for development projects meant to spur economic growth in the country, and, iii) put Kenya closer to other East African countries such as Tanzania and Uganda with higher rates of 20.0% and 30.0% respectively. The increment will expose investors disposing off properties to higher levy charges and will lead to reduced incomes of persons selling land and buildings. The amendment however, was resisted by Real Estate stakeholders, who have in the past lobbied against previous attempts to increase the CGT, proposing the government to adopt an inflation adjustment (indexation) to arrive at the equitable acquisition value of the property as an alternative to increasing the CGT rate. Indexation involves adjusting the base, which is the original buying price of a taxable property upwards for tax purposes to mitigate the inflationary distortion. In support of this, tax experts attribute some of the net gains to inflation as the value of money decreases over time and can be mitigated by adjusting the buying price accordingly.
With the implementation of the policy, we expect that the increment will impact negatively on Kenya’s Real Estate sector by; i) reducing property transaction volumes, ii) curtailing investments in the sector owing to increased costs of mergers and acquisitions, and, iii) slightly deter foreign investments as investors may opt to shift their investments to other countries with lower CGT rates such as Nigeria at 10.0% and Mauritius with no CGT tax, which offer higher gains. However, it is important to consider that other countries in the region still have higher CGT rates. This means that the Kenyan Real Estate industry will still retain its competitive advantage over other East Africa nations, and will remain preferred by investors seeking to invest in the region. Thus, while the hike may be concerning, it is important to also consider the larger context of the region and the potential benefits that investing in Kenya can offer to investors.
- Real Estate Investment Trusts (REITs)
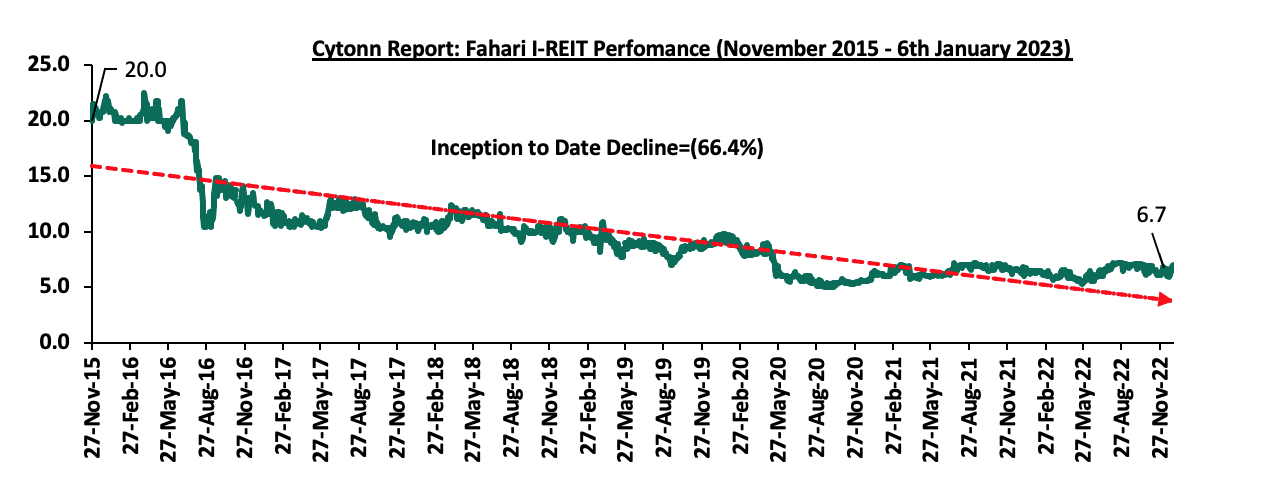
In the Nairobi Securities Exchange, ILAM Fahari I-REIT closed the week trading at an average price of Kshs 6.7 per share. The performance represented a 3.1% gain from Kshs 6.5 per share recorded the previous week, taking it to a 0.9% Year-to-Date (YTD) decline from Kshs 6.8 per share recorded at the beginning of the year. In addition, the performance represented a 66.4% Inception-to-Date (ITD) loss from the Kshs 20.0 price. The dividend yield currently stands at 7.4%. The graph below shows Fahari I-REIT’s performance from November 2015 to 6th January 2023;
In the Unquoted Securities Platform, Acorn D-REIT and I-REIT traded at Kshs 23.9 and Kshs 20.9 per unit, respectively, as at 30th December 2022. The performance represented a 19.4% and 4.4% gain for the D-REIT and I-REIT, respectively, from the Kshs 20.0 inception price. The volumes traded for the D-REIT and I-REIT came in at 6.5 mn and 15.5 mn shares, respectively, with a turnover of Kshs 141.3 mn and Kshs 320.7 mn, respectively, since its inception in February 2021.
We expect the performance of Kenya’s Real Estate sector to continue improving owing to; i) the anticipated increase in the construction activities particularly in the residential sector driven by government’s efforts to provide affordable housing to citizens, ii) continuous recovery of the hospitality sector, and, iii) aggressive expansion efforts by both local and international retailers. However, the threefold increase in capital gains tax on property sales and low investor appetite for REITs is expected to hinder the optimum performance of the sector.
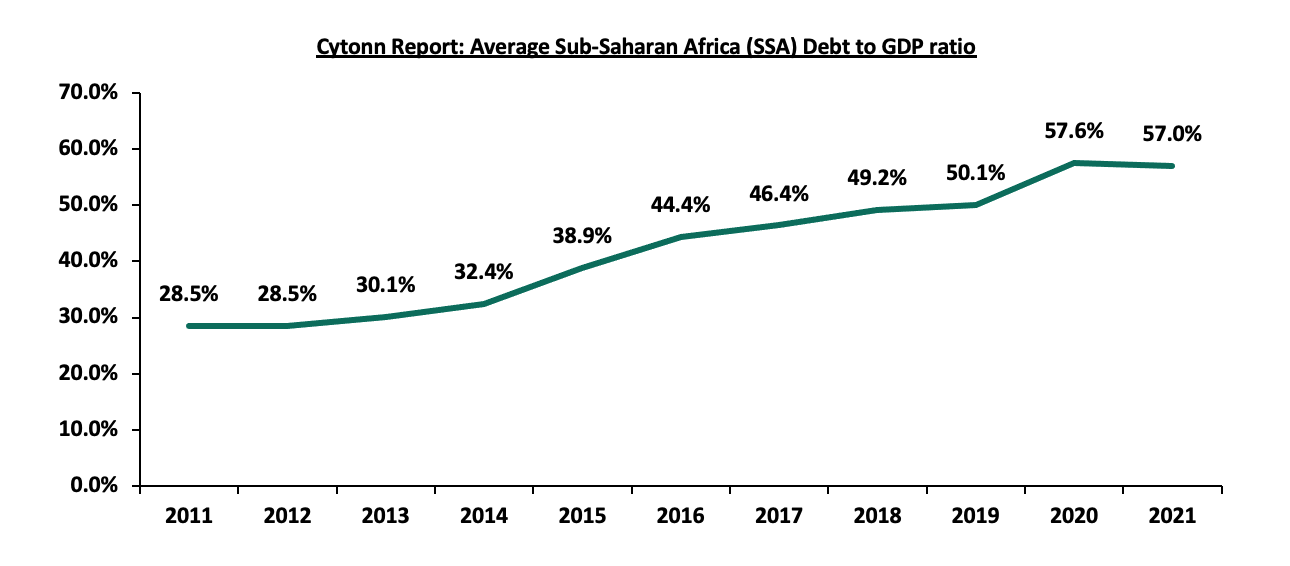
Debt sustainability has been a cause for concern within the Sub-Saharan Africa (SSA) region and has been aggravated by a slow post pandemic recovery, elevated inflationary pressures and a backdrop of depreciating currencies in 2022. According to the Joint World Bank and International Monetary Fund (IMF) Debt Sustainability Analysis (DSA) as of September 2022, eight countries in the region are identified as in debt distress while 14 are at high risk of debt distress, and 16 at moderate risks of debt distress. Additionally, according to the Bloomberg Global default risk index 2022, for the SSA countries, Ghana and Kenya are ranked 1st and 2nd , respectively, pointing towards increased perceived risks on their debt sustainability. This has been mainly on the back of poor fiscal and monetary policies in most countries in the Sub Saharan Africa (SSA) region resulting to its debt to GDP ratio almost doubling to 57.0%, 7.0% points above the IMF recommended threshold for developing economies at the end of 2021 from 28.5% recorded in 2011. The graph below shows the evolution of the average debt to GDP ratio in the Sub- Saharan Africa (SSA) region for a period of 10 years;
Source: IMF
The rapid increase in the Public debt to GDP ratio points that the public debt accumulation is not being matched by economic growth, making it unsustainable and leading to more countries being on the verge of debt distress. Eventually, restructuring becomes a matter of inevitability as the Governments have to carry out social functions like health and education services, while at the same time servicing debt. Ghana, like many other developing countries, has accumulated high levels of public debt to a point of unsustainability. Consequently, the World Bank ranks both risks, external debt distress and risk of overall debt distress for Ghana as high, an indication of high probability of debt repayment default and that, the rising debt burden needs careful management. As a result, the government of Ghana initiated a debt restructuring in December 2022, in order to restore its capacity to service its public debt as well as improve its local business environment;
In a bid to understand the looming economic crisis in Ghana due to its high debt levels, we shall analyze Ghana’s debt trends over time and the look at the debt restructuring initiative taken by its government to restore macroeconomic order as follows;
- Ghana’s Macroeconomic environment,
- Evolution of Ghana’s public debt,
- Ghana’s Debt Restructuring,
- IMF Lending Facility to Ghana,
- Challenges faced by Ghana’s debt restructuring program, and,
- Conclusion
Section 1: Ghana’s Macroeconomic Environment
Ghana has been a major driver of economic growth in both the West and Sub Saharan Africa, driven by the high exports of agricultural products such as cocoa. However, its reliance on imports such refined oil and gas imports and its high public debt to GDP ratio have led to the deterioration of the Ghana’s macroeconomic environment, as discussed below;
- Economic Growth
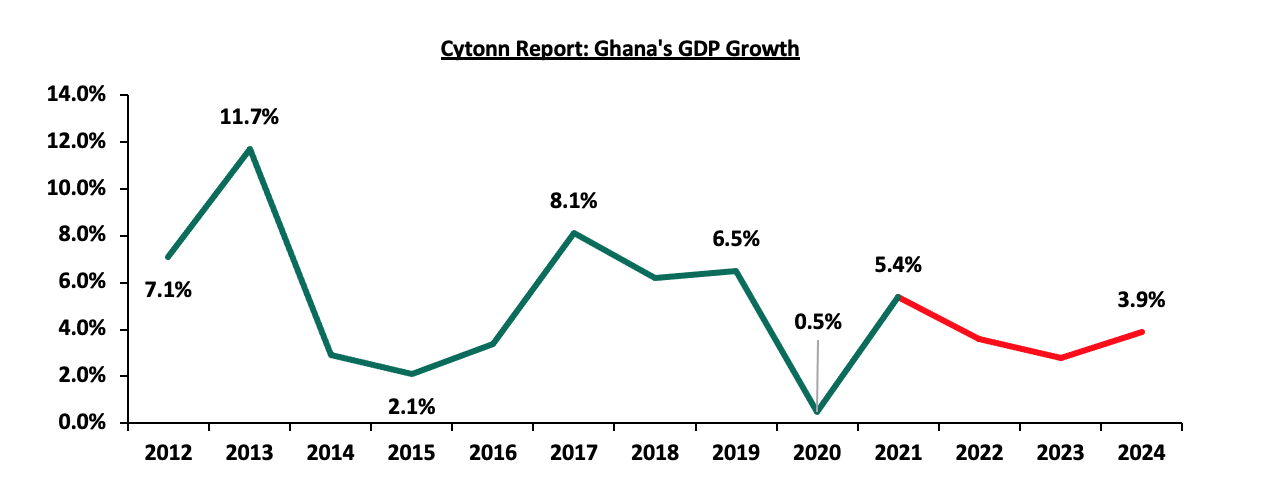
According to the World bank, Ghana’s Gross Domestic Product grew by a 10-year CAGR of 7.0% to USD 77.6 bn in 2021 from USD 39.3 bn recorded in 2011. This has been driven by the diversification of the economy, led by the growth in the services sector, which accounted for 48.9% of GDP in 2021, whose back bone is the information and communication sub sector. The industrial sector and the agricultural sector contributed 30.1% and 21.0% of GDP, respectively, in the same period. Additionally, the economy expanded by 5.4% in 2021 from the 0.5% expansion in 2020 mainly due to the post pandemic economic recovery. However, Ghana’s GDP growth is forecasted to slow to 3.6% in 2022 and decline further to 2.8% in 2023 on the back of elevated inflation following the high global fuel and food prices. The graph below shows the Ghana’s GDP growth rate for the last 10 yrs;
Source: IMF
- Inflation
Ghana’s y/y inflation hit a record high of 50.3% in the month of November 2022, a 9.9% points increase from 40.4% recorded in October 2022 driven by the 79.1% increase in the prices of housing, water, gas and electricity, and 63.1% increase in the prices of transport and fuel. Notably, this is the highest inflation rate recorded in the last 21 years. On an annual basis, according to the IMF, the inflation is projected to close the year at an average record high of 27.2% from 10.0% recorded in 2021, significantly higher than the government’s target of the range of 6.0%-10.0%. The graph below shows the Ghana’s inflation rate for the last 10 years;

Source: IMF
- Currency
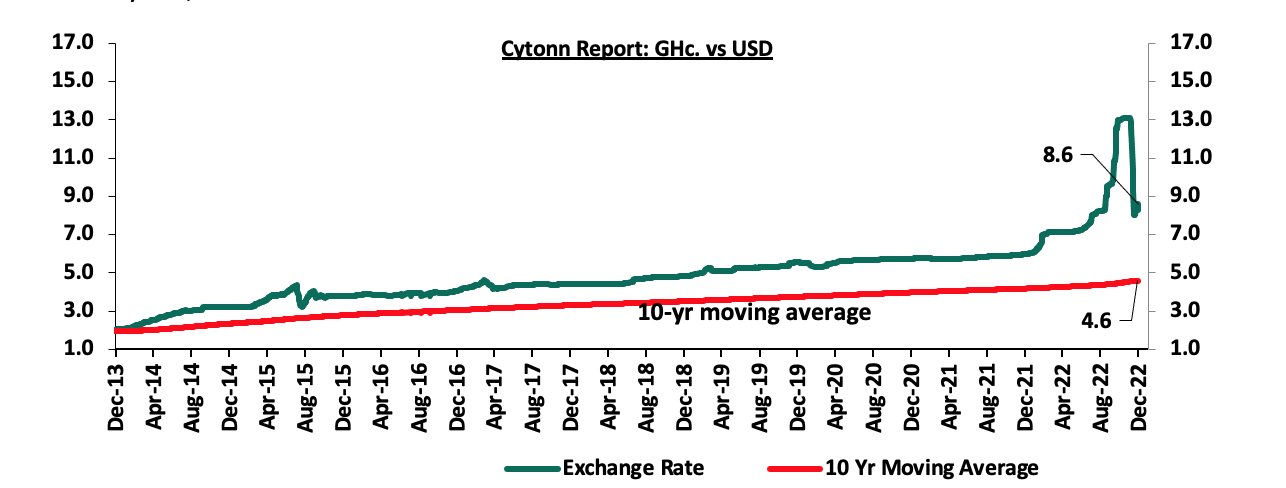
In 2022, the Ghanaian Cedi depreciated by 42.8% to close at Ghc 8.6 recorded on 30th December 2022 from Ghc 6.0 recorded against the U.S dollar on 4th January 2022 to become the worst performing currency in Sub Saharan Africa. This was mainly attributable to the high debt servicing costs and import reliance, with the currency reserves declining by 32.0% to USD 6.6 bn in September 2022 from USD 9.7 bn in December 2021, representing 2.9 months to import cover. The graph below shows the movement of the Ghanaian Cedi for the last 10 years;
Source: Bank of Ghana
- Interest Rates
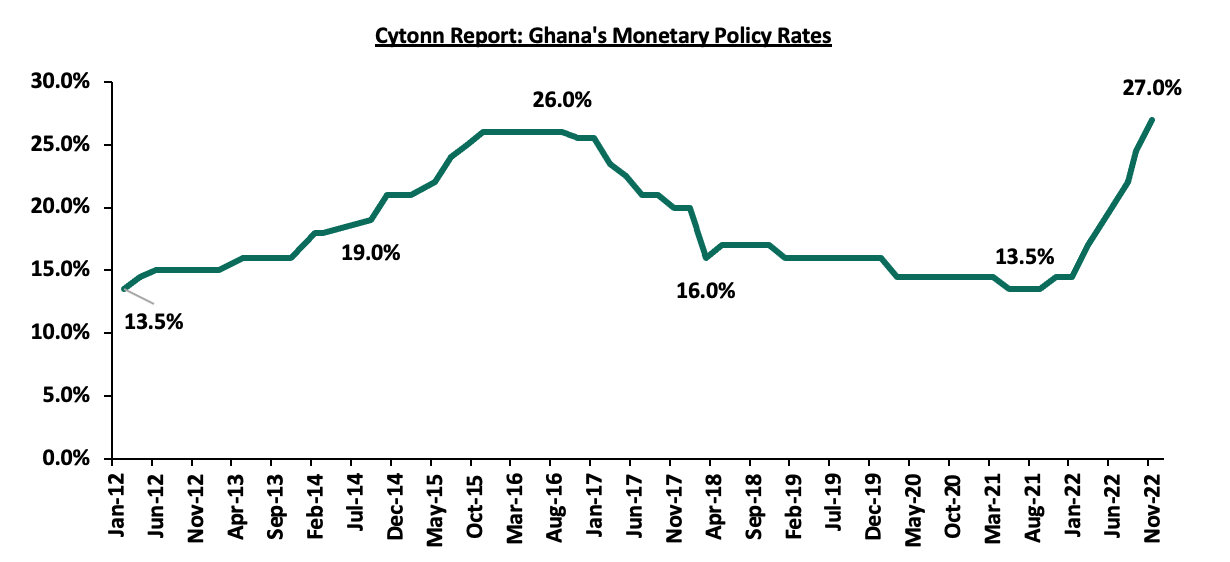
With Ghana’s Inflation rate at 50.3% in November 2022, the Bank of Ghana Monetary Policy Committee met on 28th November 2022 hiked the MPC rate by 250.0 bps to 27.0%, the highest rate recorded in the last 10 years, from 24.5% in September 2022. Despite the tightened monetary policy with five interest rate hikes in 2022, inflation continues to remain elevated driven by high dependency on imports that have been impacted by high commodity prices in the global markets. The graph below shows Ghana’s interest rates for the last 10 years;
Source: Bank of Ghana
- Current Account
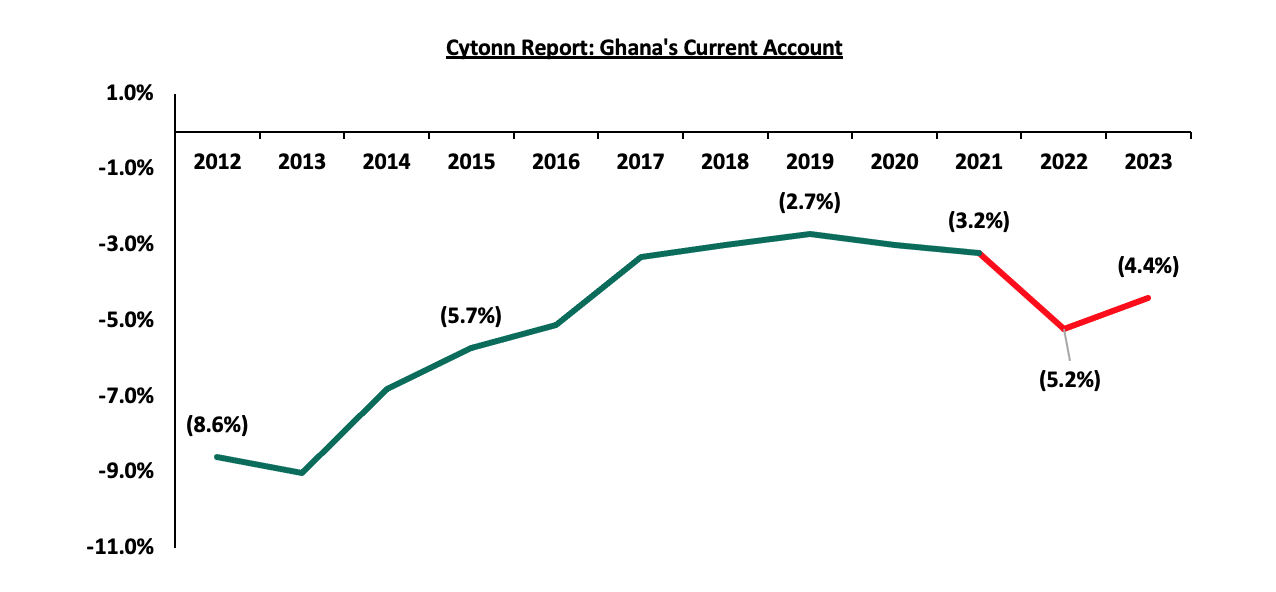
Due to the high import reliance and lack of value addition on its exports, coupled with the local currency depreciation, Ghana’s current account deficit is projected to widen further to 5.2% by end of 2022 from 3.2% in 2021, and this is expected to continue weighing down the Ghana’s economy. The graph below shows the Ghana’s current account deficit for the last 10 years;
Source: IMF
- Public Debt
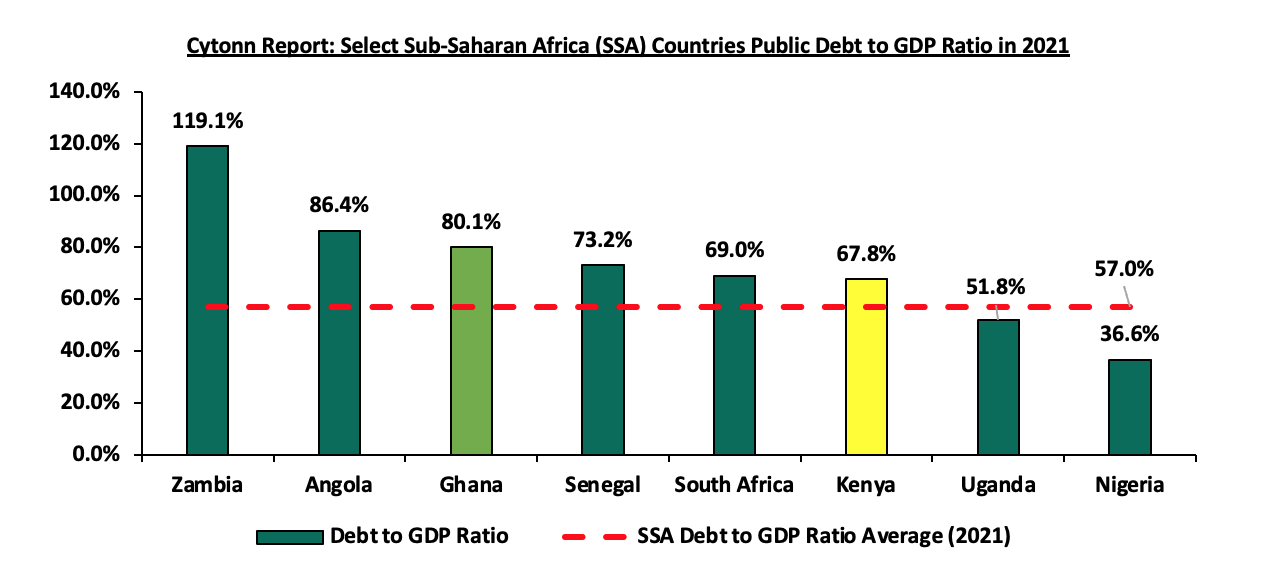
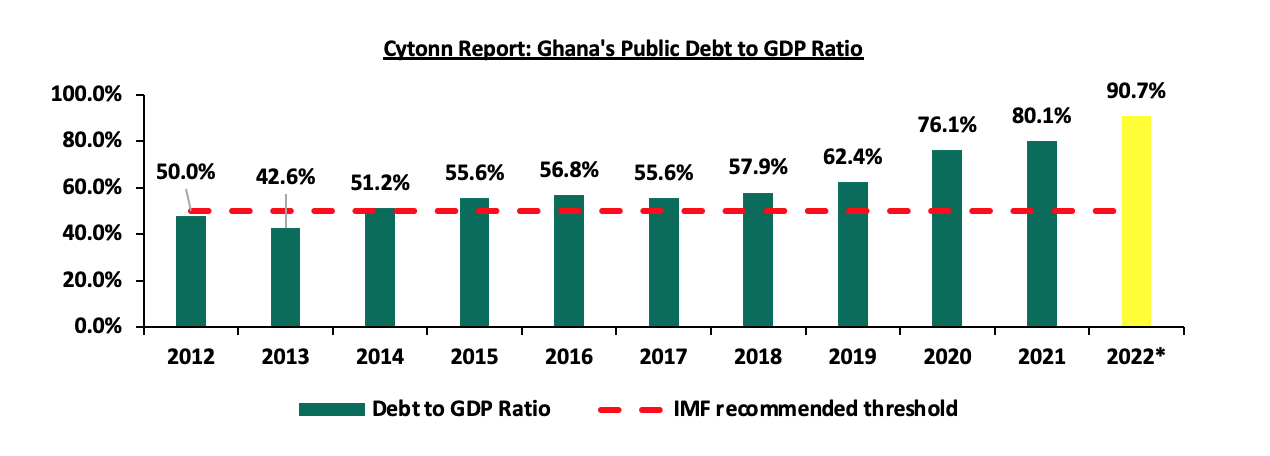
Ghana’s total public has grown with a 10-year CAGR of 14.3% to USD 58.6 bn at the end of 2021, from USD 15.4 bn recorded in 2011, on the back of rising debt appetite to cover its fiscal deficit against low revenue collections. As such, its public debt to GDP ratio came in at 80.1% in 2021, and is projected to end 2022 at 90.7%, 40.7% points above the IMF recommended threshold of 50.0% debt to GDP ratio for developing economies. Notably, according to Ghana’s Ministry of Finance, Ghana’s debt servicing costs consumed 70.0% of its tax revenues in 2022, and its public debt including debt owned by State Owned Enterprises exceed 100.0% of its GDP in the same period, presenting a hard challenge to the government to balance between debt servicing and economic development. Ghana’s public debt to GDP ratio at 80.1% in 2021, is 23.1% points higher than the SSA average of 57.0%. The graph below shows a comparison of the debt to GDP ratio of select Sub-Saharan Africa economies as of the end of 2021,
Source: IMF, Bank of Ghana
The above factors highlight Ghana’s tough macroeconomic environment which when coupled with a deterioration in the business environment have further deepened Ghana’s debt distress, with the government lagging behind in its revenue collection targets.
Section II: Evolution of Ghana’s Public Debt
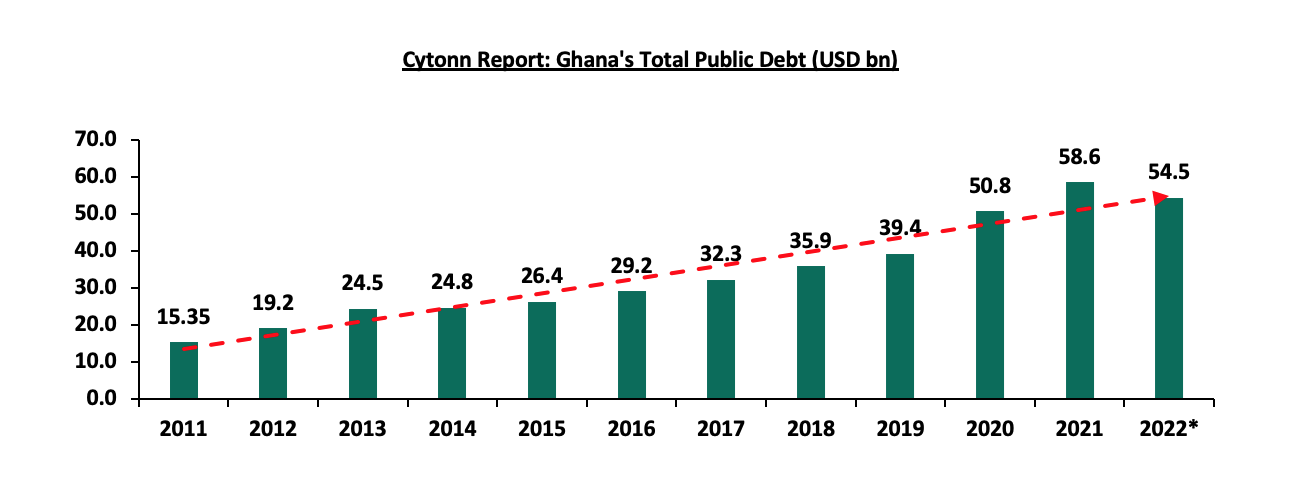
Ghana’s public debt has been on the rise, having grown with a 10-year CAGR of 14.3% to USD 58.6 bn in 2021 from USD 15.4 bn the end of 2011, representing 80.1% debt to GDP ratio, above the 70.0% debt to GDP ratio threshold recommended by the Economic Community of West Africa States (ECOWAS) and the IMF recommended threshold of 50.0% for developing economies. Notably, Ghana’s public debt recorded a 29.1% increase to USD 58.6 bn in 2021 from USD 50.8 bn in 2020, mainly attributable to spillover effects of the COVID-19 pandemic that saw a slowdown in exports and economic activity, coupled with the financial and energy sector bailouts. Ghana’s fiscal deficit has continued to heighten to 11.7% in 2021, from 9.6% of GDP in 2020, mainly attributable to a challenging macroeconomic environment that has continued to weigh down on revenue collection. As of May 2022, the country’s public debt came in at USD 54.5 bn, equivalent to 77.5% debt to GDP ratio. The graph below shows the evolution of Ghana’s public debt over the last 10 years;
*Figures as of May 2022, Source: Bank of Ghana (BoG)
According to the IMF, Ghana’s debt to GDP ratio is projected to grow to 90.7% by the end of 2022, on the back of high borrowing levels that outweigh economic growth. This is excepted to cause a debt overhang that will lead to crowding of the private sector. The graph below shows Ghana’s debt to GDP for last 10 years;
*Figures as at May 2022, Source: Bank of Ghana, IMF
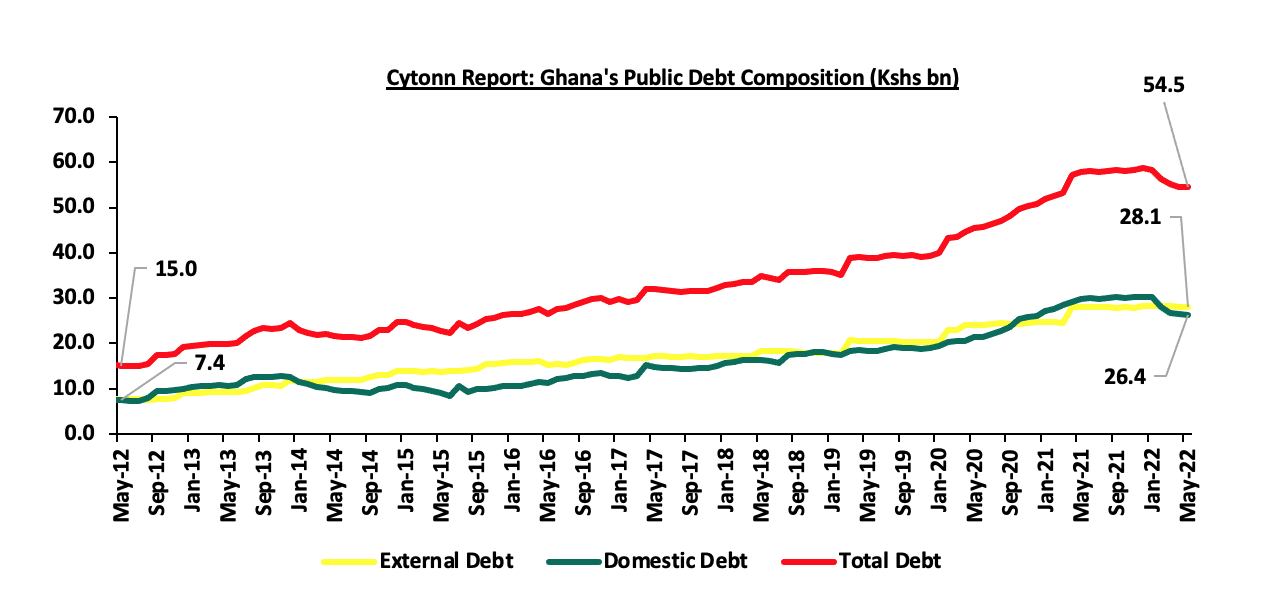
Over the last 10 years, the Ghana’s external debt has grown with a 10-yr CAGR of 14.0% to USD 28.1 bn as at May 2022 from USD 7.6 bn in May 2012, while its domestic debt grew by a slower CAGR of 13.5% to USD 26.4 in May 2022 from USD 7.1 bn recorded by the end of May 2012. As such, Ghana debt mix shifted to 49:51 domestic to external debt as at May 2022, from 50:50 in May 2012. The graph below shows Ghana’s domestic and external debt composition for the last 10 years;
Source: Bank of Ghana
Ghana’s Global Credit Ratings
The following is a summary of the Ratings on Ghana from the three main Global Ratings agencies in 2022,
- S&P Ratings- In December 2022, Standard and Poor (S&P) Ratings downgraded Ghana’s Long Term Currency bonds to ‘selective default’ and also downgraded the country’s foreign currency debt to ‘CC’ from ‘CCC+’ in August 2022. This was majorly attributable to the proposed Domestic Debt Exchange Programme, which S&P noted to be a distressed exchange offer, a likelihood that institutional investors would incur some losses during the debt restructuring process,
- Fitch Ratings- Fitch Ratings also downgraded Ghana’s Long-Term Local-Currency (LTLC) Issuer Default Rating (IDR) to ‘C’ from ‘CC’ in September 2022 and ‘CCC’ in August 2022. Fitch attributed the downgrade to the Domestic Debt Exchange Program (DDEP) to be like a default initiation process, and,
- Moody’s Ratings- Moody’s downgraded Ghana’s Long-Term Issuer and Senior unsecured bond ratings to ‘Ca’ from ‘Caa2’, however assigned a stable outlook, as creditors would incur losses in the proposed debt restructuring program.
The continued downgrading of the Ghana’s economic outlook by the three agencies during the year pointed towards the looming economic crisis in Ghana, leading to a decline in investors’ confidence in its economy. Additionally, the deteriorated credit ratings have continued to limit Ghana’s access to the international sources of financing, and increasing trading yields on Eurobonds, and therefore translating to high external debt servicing costs.
Section III: Ghana’s Domestic Debt Restructuring
- Initial Debt Restructuring
The government of Ghana in October 2022, formed a five-member committee and began working on a debt restructuring program, which was announced by the Deputy Minister for Finance towards the end of November 2022, the initial debt proposal involved:
- International Bondholders- They would undergo a 30.0% haircut on their principal investments coupled with forgoing some interest payments,
- Domestic Bondholders- With majority of domestic bondholders being commercial and custodian banks, they would also forgo some interest payments, and also have their bonds exchanged by new ones that would offer no coupons in the 1st year, 5.0% in the second year and 10.0% in the third year, and,
- Foreign bonds- The government highlighted that it would suspend coupons on foreign bonds for three years.
- Current Debt Restructuring Plan
On 4th December 2022, the Government of Ghana, through its Ministry of Finance announced the new Domestic Debt Restructuring Plan, named the Domestic Debt Exchange Programme (DDEP) which came into effect on 5th December 2022. The program involved:
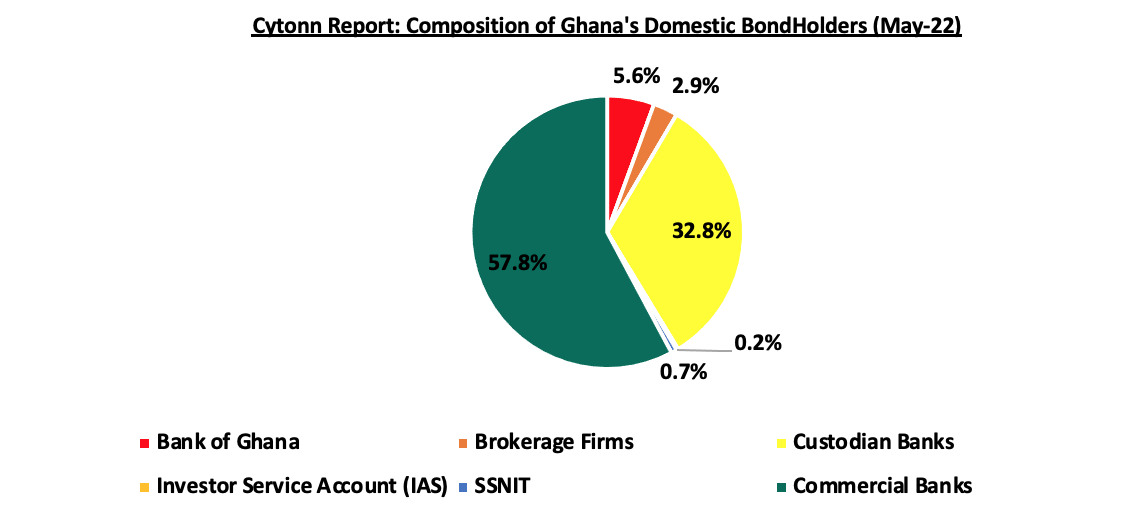
- Domestic Debt Exchange- The Programme involved the exchange of the local currency denominated bonds as at 1st December 2022 with new bonds with maturities in 2027, 2029, 2032 and 2037 and annual coupons for the new bonds set at 0.0%, in 2023, 5.0% in 2024 and 10.0% from 2025 till maturity. The allocation ratio was set at 17.0%, for the short bonds maturing in 2027 and 2029, 25.0% and 41.0% for the bonds maturing in 2032 and 2037, respectively. The move was designed to give the government time to stabilize the domestic economy and in turn improve the business environment for investors consequently increase government revenue collection. The graph below shows the different holders of government’s bonds as of May 2022,
Source: Ghana’s Central Securities Depository - Financial Sector Impact Minimization- In order to minimize the impact of the domestic debt exchange programme on small investors, individuals and other vulnerable groups, the ministry noted that T-bills would be excluded in the exchange programme, with a commitment of payment of full value amount at maturity. Additionally, there would be no haircut as earlier proposed in the initial debt restructuring plan, and individual bond holders will be fully exempted from the programme. The Government also called for all regulatory bodies such as the Bank of Ghana, The Ghana Securities and Exchange Commission, the National Insurance Commission and the National Pensions Regulatory Authority to put measures to reduce the impact of the programme on the sector, and,
- The Financial Stability Fund (FSF)- Additionally, the government would establish a Financial Stability Fund (FSF) that would act as last resort to the financial sector, and would back up the liquidity to all financial institutions such as commercial banks, pension funds, insurance companies, fund managers and Collective Investment Schemes (CIS) to ensure that they are able to pay their clients once maturities fall due. The FSF had a target of USD 1.2 bn to be raised from the World Bank and other financial institutions.
The programme would involve an exchange of approximately GhC 137.3 bn (USD 10.5 bn) of the existing domestic bonds with fresh bonds, as the government would not be able to service the debt without restructuring. The program was set to commence on 5th December 2022 and close on 19th December 2022, but would be extended at the decision of the government.
In a bid to ensure the stability to banks during the DDEP, the Bank of Ghana published the regulatory reliefs that would take effect on 23rd December 2022, and included:
- For the local currency deposits, there would be a reduction of the Cash Reserve Requirement (CRR) to 12.0% from 15.0% while for the foreign currency denominated deposits, the CRR would be maintained at 12.0%,
- A reduction of the Capital Conservation Buffer to 0.0% from 3.0% and therefore, reducing the Capital Adequacy Ratio CAR to 10.0% from 13.0%. Additionally, risk weights attached to the new bonds will be set at 0.0% for CAR computation and 100.0% for the old bonds,
- While determining the financial exposure of banks to counterparties, new bonds will be fully deductible while old bonds will not, and,
- Increase in Tier II banks component of regulatory capital to 3.0% from 2.0% of the total risk weighted assets and also increase in allowable portion of the property revaluation for Tier II banks capital computation to 60.0% from 50.0%, and this would ensure that small banks were well capitalized to withstand the DDEP shocks.
Furthermore, banks would be required to submit data on liquidity ratios, their access to interbank markets, and their cost of financing on a daily basis to the Bank of Ghana, and also the banks would access the reverse repos provided by the new bonds to boost liquidity. All banks would also pre-position their assets for eligible collateral under the Central Bank’s Emergency Liquidity Assistance (ELA), which would be accessed with other collaterals excluding the old bonds, and the banks would not declare or pay any dividends to their shareholders. However, Fitch noted that it expects that many Ghanaian Banks to face significant pressure on their capitalization, and suffer economic losses for exchanging their existing debt for the new bonds with lower coupons and longer tenors. Nevertheless, Fitch noted that it believed on the Bank of Ghana’s new regulatory measures to cushion the banks against the financial impact of the exchange program will be sufficient to enable the local banks mitigate the impact.
- Reception of the Debt Restructuring from stakeholders
Due to the announcement that bondholders who have invested through financial institutions such as banks, investment companies, pension schemes and insurance companies, would be required to exchange their bonds, many financial institutions announced their rejection to the exchange program;
- Local pension firms, which hold 5.6% of Ghana’s domestic bonds, and since they are mandated by the Ghana’s Pension Regulatory Authority to have majority of their assets in government securities, poised their concerns on the prolonged maturity timelines,
- Six Labor unions including the Ghana Registered Nurses and Midwives Association (GRNMA) and the Chamber of Corporate Trustees (CCT) issued their directive rejecting the exchange programme on 6th December 2022, and,
- The Ghana Securities Industry Association (GSIA) also announced their rejection to the domestic bond exchange program, as they were not involved during the engagements to unveil the restructuring exercise.
The negative reception of the majority of the bondholders presented a challenge to the government, and in a bid to ease the exchange programme the government has been updating the proposal as follows;
- Extension of the exercise duration- The government has extended the closing date of the exchange programme twice from the initial date of 23rd December 2022 to 30th December 2022 and later to 16th January 2023 in order to give more time to the financial sector institutions to secure the necessary approvals for their involvement in the exchange programme,
- Exempting Pension Funds from the programme- The government announced that it will drop pensions firms from the ongoing domestic debt exchange programme, and that, the parties involved would engage to prepare an alternative plan,
- Paying accrued and unpaid interest on eligible Bonds-The government announced that it would pay accrued and unpaid interest on eligible bonds and a cash tender fee payment to holders of eligible bonds maturing in 2023. Additionally, interest on the new bonds will not accrue until 2024, but will start paying the interest at a rate of 5.0% after 2024, increasing to 10.7% for the new bonds that will mature in 2038,
- Increasing the new bonds under DDEP program to twelve from the initial four bonds-The government added 8 new bonds with one maturing every year from 2027 to 2038,
- A modification to the Exchange Consideration Ratios- The Exchange Consideration Ratio applicable to Eligible Bonds maturing in 2023 will be different than for other Eligible bonds. The table below shows the new consideration ratios;
|
Cytonn Report: Ghana’s New Exchange Consideration Ratios |
|||||||||||||
|
Eligible Bond Tendered |
2027 |
2028 |
2029 |
2030 |
2031 |
2032 |
2033 |
2034 |
2035 |
2036 |
2037 |
2038 |
Cash Tender Fee* |
|
Eligible 2023 Bonds |
15.0% |
15.0% |
14.0% |
14.0% |
14.0% |
14.0% |
14.0% |
N/A |
N/A |
N/A |
N/A |
N/A |
2.0% |
|
Eligible Post 2023 Bonds |
9.0% |
9.0% |
9.0% |
9.0% |
8.0% |
8.0% |
8.0% |
8.0% |
8.0% |
8.0% |
8.0% |
8.0% |
N/A |
|
*As a percentage of principal amount of the tendering eligible Holder’s Eligible 2023 Bonds |
|||||||||||||
- A non-binding target of 80.0%- The government set a non-binding target minimum level of overall participation of 80.0% of the aggregate principal amount outstanding of Eligible Bonds, and,
- Including Individual Bond holders- Rather than only applying the exchange to institutional bond holders, the government announced the expansion of the program to cover even individual investors.
- IMF Lending Facility to Ghana
The first International Monetary Fund (IMF) visit to Ghana in a bid to discuss a lending arrangement with Ghanaian Authorities was held between 6th -13th July 2022. During the visit, the IMF noted that the current fiscal deficit and debt situation in Ghana was adversely impacting on the economy of Ghana, and that, a credit package would be needed to restore macroeconomic stability. This was followed by other two visits in October and November 2022. Notably, on 12th December 2022, the IMF announced that it had reached a staff level Agreement on a 3-year program of the Extended Fund Facility (ECF) amounting to USD 3.0 bn (SDR 2.2 bn) which was subject to the IMF management and Executive approval, and after the receipt of the necessary commitments from Ghana’s partners and Creditors. Therefore, the Ghanaian authorities agreed to reforms which include:
- Develop a medium term plan to generate additional revenue and increasing tax compliance,
- Strengthening commitment controls on public expenditure,
- Enhancing the reporting and monitoring of expenditures that would promote transparency,
- Improving the management and running of state owned enterprises, and,
- Addressing structural challenges in the energy and cocoa sectors.
The agreement followed the launch of the Domestic Debt Exchange Programme, which IMF noted that its progress would be needed before the approval of the facility. This partially increased confidence in their economy and consequently the Cedi appreciated by 34.6% to close the year at GHc 8.6 from the adverse exchange rate of GHc 13.1 against the U.S Dollar recorded on 17th November 2022.
- External Debt Restructuring
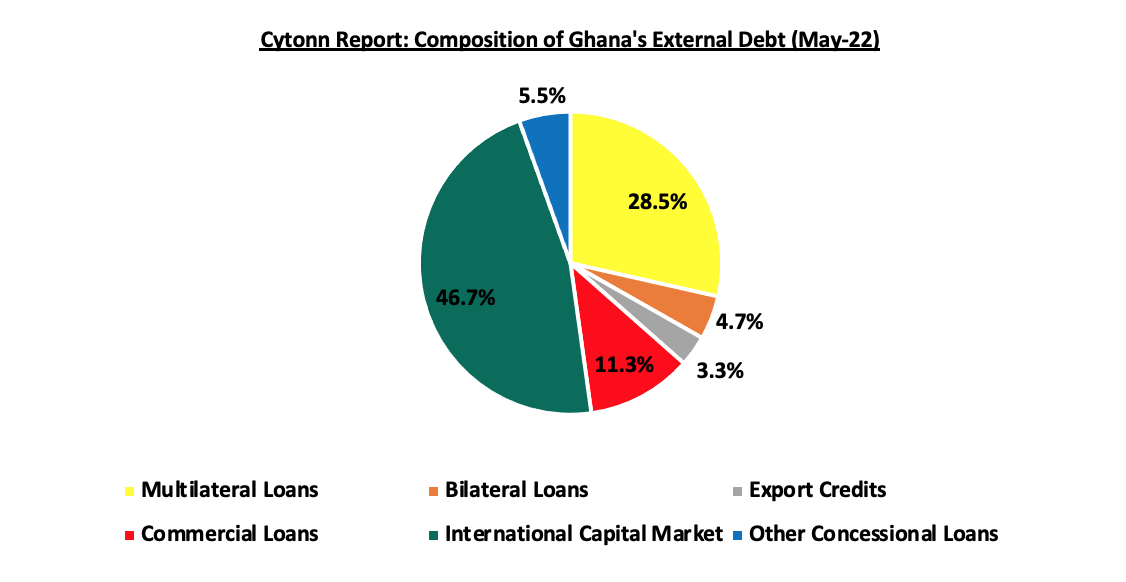
As an interim measure to prevent the further deterioration of Ghana’s financial and economic situation, Ghana’s Ministry of Finance announced a suspension of all external debt servicing payments, from 19th December 2022. The suspension would include the servicing of Eurobonds, commercial loans, and most of the bilateral loans, while excluding the suspension of servicing of multilateral debt and new debts contracted after 19th December 2022 and debts related to certain short term trade facilities. This move was taken before an orderly restructuring program was initiated, leading to further deterioration of the country’s credit risk ratings. As at the end of May 2022, International capital markets, which include the Eurobonds, at USD 13.1 bn formed the majority of Ghana’s external debt, representing 46.7%, with Ghana issuing 16 Eurobonds in the last 10 years. As such, on 19th December 2022, holders of Ghana’s Eurobonds formed a committee to formulate an equitable restructuring proposal, which was aimed to restore credit worthiness in the economy. The chart below shows the composition of Ghana’s external debt as at end of May 2022;
Source: Bank of Ghana
Section V: Challenges undermining the success of Ghana’s Domestic Debt Exchange Programme
There are several factors that continue to barricade Ghana’s efforts to have a successful debt exchange program. This include;
- Lack of all-round stakeholder engagement- Evidenced by the negative reception by many of the stakeholders in its domestic bond holders, coupled extension of the expiration date twice and the adjustments made to the current debt restructuring program, the exchange program lacks an all-inclusive shareholder’s perspective. Key to note, the debt restructuring committee is made up of only the Ministry of Finance and Bank of Ghana excluding recipients of the program, in this case the bond holders from vital decision making processes of the debt exchange program. In a debt restructuring of such magnitudes, the government should have formed a committee where all stakeholders are represented, in order to gain trust from all the parties involved,
- High losses to investors- It is clear that in the current debt restructuring program that the government wants to shift too much of the burden to the investors. Taking into account the 2038 due date for the maturity of the long term instruments, Ghanaian investors are going to lose 55.0% of their T-bonds investments, representing only 45.0% recovery rate, lower than the 52.0% recovery rate on previous debt restructuring occasions such as Greece and Grenada at 65.0% and Grenada 50.0%, respectively,
- Lack of Credit enhancements in the new exchange instruments – In addition to the low recovery rate to the investors, Ghana’s new debt instruments will not pay interest in 2023, extinguishing any form of liquidity due to unattractiveness of the bonds. The new instruments can be enhanced by, for instance, guarantees backed by international bodies or higher coupon rates to make up for upfront losses, and,
- Absence of a strong legal framework- The lack of a proper legal framework has weighed down the Ghana’s debt exchange program. This is evidenced by the prompt formulation of guidelines, only to be amended a few days later.
Section VI: Conclusion
Majority of Sub-Saharan countries continue to suffer from high debt levels that push their economies to levels of crisis. In addition to Ghana’s debt restructuring, we have seen Kenya recently pursue a voluntary switch bond issue in June 2020 and in December 2022, where holders of short-term debt valued at Kshs 25.6 bn and 87.8 bn, respectively, were given an option to switch to a longer term debt of 6 years for each of the two switch bonds. As such, the switch bonds received an overall subscription rates of 82.7% and 60.3%, respectively, while the rest opting to be paid upon maturity. In Nigeria, the Government sent a proposal to parliament in December 2022 for approval to allow for a restructuring of USD 54.0 bn, short term loans owed to its Central Bank to a 40-year security at an interest of 9.0%. Additionally, Zambia initiated an external debt restructuring exercise in 2022 under the Common Framework for Debt Treatment of the G20, after a sovereign default in 2020 due to high debt unsustainability.
Therefore, the governments should put in place measures that promote high revenue collection rather than relying on public debt to cover their fiscal deficits. Below are some of the measures that Sub-Saharan countries can put in place to evade high levels of risk distress;
- Enhance fiscal consolidation- The mismatch between higher public expenditure and the lower revenue collections has continued to expand fiscal deficits necessitating borrowing. To offset such imbalances, the SSA countries need to either cut on government recurrent expenditures, or increasing revenue performance to promote fiscal consolidation,
- Addressing the structural and financing challenges faced by State Owned Enterprises (SOEs)- Majority of SOEs continue to record losses due to poor governance policies and depend heavily on government bailouts. One of the ways to reduce the burden from SOEs is to privatize them in order to bring them,
- Export Promotion- The SSA economy, which is majorly agriculturally and service driven, has for years lacked value addition to its exports, which results to low revenues from exports. The governments should promote export value addition structures such as the Export Processing Zones and industrialization, as this would increase the value of its exports, boosting their foreign exchange reserves. This would not only improve the region’s GDP but also anchor currency depreciation and reduce the costs of servicing of foreign currency denominated loans,
- Encouraging alternative means of financing infrastructure such as Private Public Partnerships (PPPs)- Infrastructure projects are capital intensive and majority have been funded through Public Debt. The governments should promote and streamline alternative means of financing such as PPPs and joint ventures in development projects,
- Putting in place measures that spur economic growth- Such measures that increase economic output include tourism, entrepreneurship, technology and innovation, as well as easing regulations that encourage favorable business environment, and,
- Restructure public debt early if need be- Countries in SSA that have high debt levels should restructure their debts instead of waiting to fall into debt distress. The following three countries have initiated forms of debt restructuring;
-
- Kenya- In June 2020 and December 2022, the Kenyan Government offered switch bonds for holders of government T-bills to voluntary switch to two Infrastructure bonds namely; IFB1/2020/6 and IFB1/2022/6, with tenors to maturity of 6 years each. The bonds received overall subscription rates of 82.7% and 60.3%, for IFB1/2020/6 and IFB1/2022/6, respectively, with the rest of the T-bill holders opting to hold and be paid upon maturity. This came at a time when the yields of the government papers have been on an upward trajectory, gaining by 6.1 bps, 1.3 bps and 2.3 bps to 10.4%, 9.8% and 9.4% for the 364-day, 182-day and 91-day papers respectively, for the first week of 2023,
- Zambia- Initiated restructuring of its public debt in 2022 which involved forming a creditors committee that included all external lenders under the Common Framework for Debt Treatment of the G20. This after defaulting on its sovereign debt in 2020 and its debt to GDP ratio coming in at 140.2% in 2020 pointing towards debt distress. This came after the USD 1.3 bn IMF assistance in August 2022, in which the debt restructuring was needed for the credit assistance to be approved, and,
- Nigeria- In our 2022 annual markets review, we highlighted that Nigeria Government had sent a proposal to parliament for approval to allow for a restructuring of USD 54.0 bn, short term loans owed to its Central Bank to a 40-year security at an interest of 9.0%. The debt was incurred through Ways and Means Advances to finance government deficit as a result of delayed government receipts. The Nigerian Executive also requested for a three-year moratorium on interest payments on existing debts and asked for another USD 2.2 bn (N1.0 tn) debt from Central bank on similar terms.
Ghana’s domestic debt restructuring success is pegged on its reception to the bondholders, since it is a voluntary exercise. As such, we expect the Government of Ghana to extend the exercise dates from the stated expiration date of 16th January 2023, and this will further delay the IMF assistance since it is one of the conditions that the government should implement before the credit assistance. However, we commend the government of Ghana for initiating the debt restructuring, but there is the need of all parties, especially the financial institutions, to be engaged for the success of the exercise. Broadly, we expect more public debt restructuring initiatives to be taken by other SSA countries in 2023 due to debt unsustainability, worsened by the deteriorated macroeconomic environment in the region that impedes revenue collection to service debts. Closer to home in Kenya, the domestic debt accounted for 50.2% of its total public debt, with treasury bonds contributing 83.0% of the total domestic debt, with majority of the bond holders being financial institutions such as banks and insurance companies. As such, any domestic debt restructuring in the country will have greater financial impact on the financial industry. However, we commend the current administration for the measures taken to reduce the need for excessive borrowing such as partial removal of subsidies of fuel and electricity, cutting down on public expenditure, and the ongoing discussions to privatize government parastatals such as the Kenya Airways which have been debt ridden for the last 10 years and being open to renegotiate its external debt terms with external lenders. This has seen Kenya’s public debt to GDP decline to 62.3% in October 2022 from 69.1% in May 2022. However, we expect the upcoming maturity of the June 2024 Eurobond of USD 2.0 bn to increase pressure on debt servicing levels. As such, we expect further fiscal tightening by the government, complete removal of subsidies especially for fuel and an increase in the use of Private Public Partnerships rather than borrowing in development projects, as this will ease pressure on our need for excessive borrowing.

